1. Introduction
Internationally, relevant research has focused on the impact of landscape design on road tunnel entrances and its impact on tunnel interior lighting. Akinci et al. [
1] explored the theme of landscape sustainability at the tunnel entrance. Their research discusses the importance of integrating sustainable landscape elements at tunnel entrances, emphasizing the need to consider ecological considerations and long-term maintenance in landscape design practices. Francesconi and Degni [
2] use the example of the Gronda motorway bypass, where the tunnel entrance blends seamlessly into the landscape. The study highlights the successful integration of the tunnel into the natural environment, demonstrating the potential for the harmonious coexistence of infrastructure and landscape. Lee [
3] studied the impact of landscape design on tunnel interior lighting. The study examined the influence of different landscape elements at road tunnel entrances on the lighting conditions inside the tunnel, contributing to a better understanding of the relationship between landscape design and tunnel aesthetics. On this basis, the relationship between the combined landscape and safety and comfort in urban tunnel chamber design is further discussed. Our approach utilizes machine learning techniques to analyze physiological factors and derive the best landscape design features to improve the safety and comfort of urban tunnel sections. In addition to the above studies, Huang et al. [
4] explored the impact of tunnel landscape design on driver visual perception, and Arias [
5] analyzed the impact of the tunnel environment on driving behavior from a psychological perspective. These studies provide important references for the design optimization of tunnel landscape elements in this paper.
Over the past decade, China has achieved remarkable progress in infrastructure development, with tunnel construction experiencing significant advances. By 2020, the number of highway tunnels in China reached 21,316, with a total length of 21.9993 million meters nationwide, marking an increase of 2249 tunnels with a total length of 3.0327 million meters compared to 2019 [
6]. However, alongside the expansion of tunnel networks, there has been a corresponding upsurge in the frequency of traffic accidents. Tunnels, being intrinsically susceptible to accidents, exhibit higher rates of incidents and deaths than typical road sections [
7,
8,
9]. Studies indicate that approximately 81% of tunnel traffic accidents directly caused by drivers are attributed to factors, such as distraction, slow perception, psychological tension, or carelessness [
10]. A driver’s timely perception, accurate judgment, and precise operation of dynamic information are essential for ensuring safety in tunnel traffic. These competencies are profoundly influenced by the psychological states of drivers, which play a subtle yet definitive role in their reception, processing, and interpretation of information [
11,
12]. The unique structural characteristics of tunnels, coupled with the absence of a standardized system for internal landscape design, introduce considerable variability into design practices. This variability contributes to an elevated incidence of traffic accidents in tunnels compared to other road sections. Shen et al. [
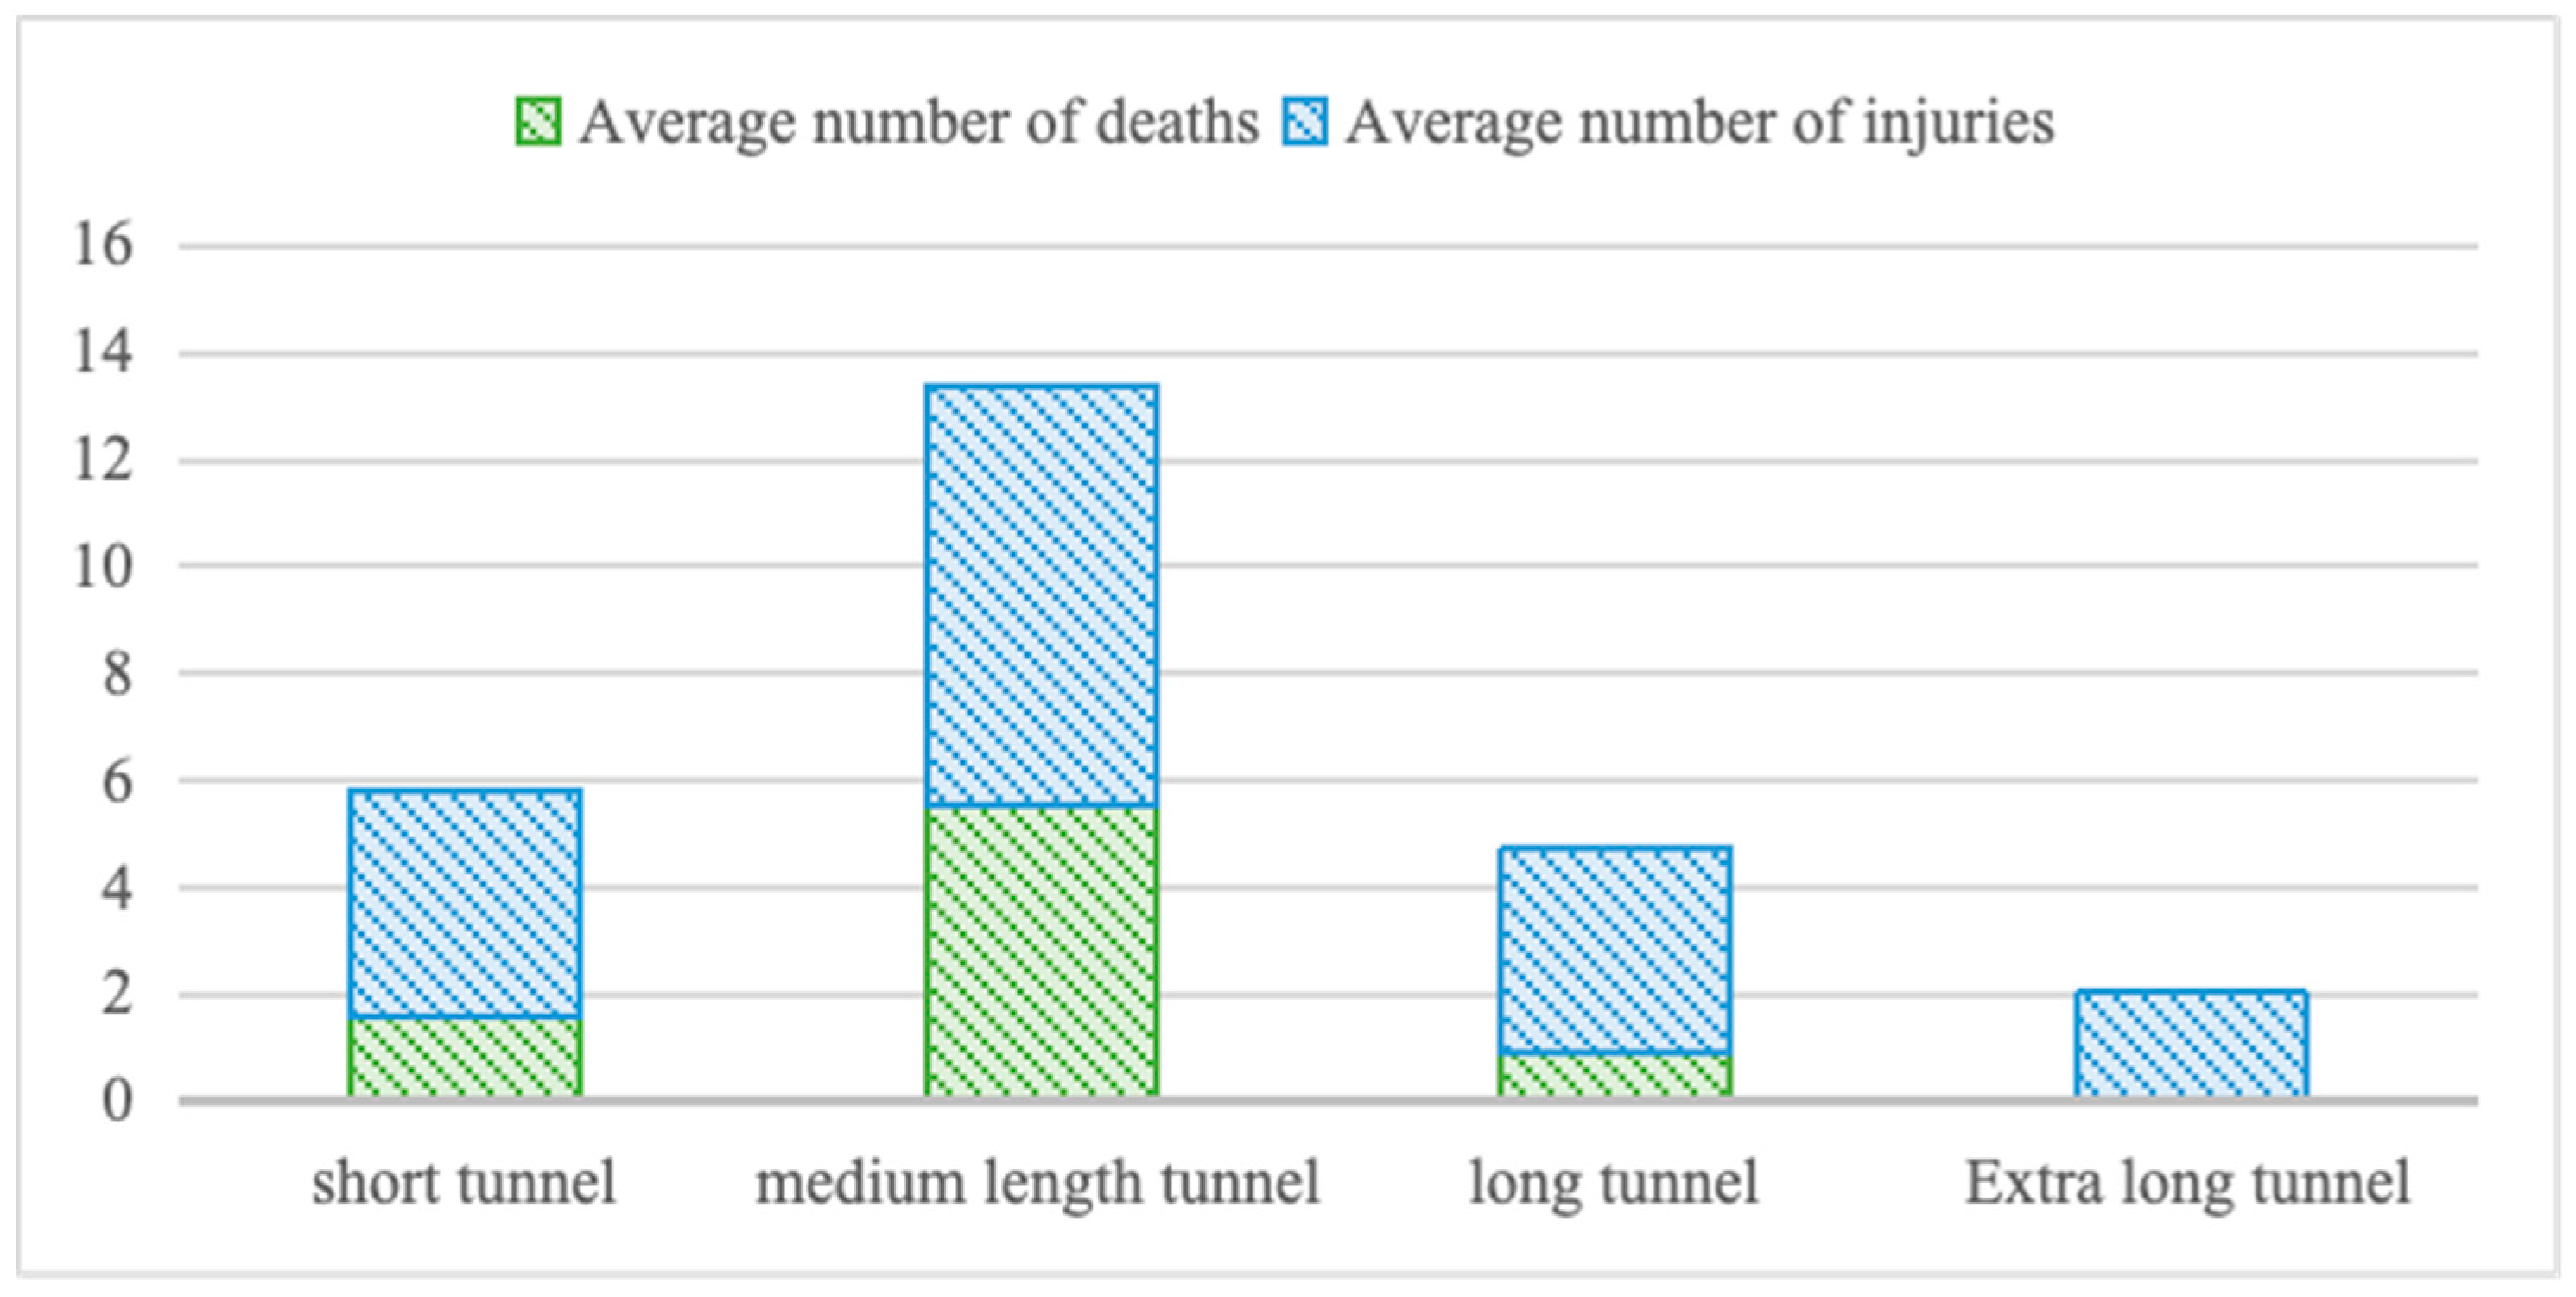
13] analyzed 121 traffic accidents that occurred in highway tunnels across China from 2001 to 2017, documenting 247 fatalities, 444 injuries, extensive vehicle damage, and significant economic losses.
Figure 1 presents their findings on the average number of accidents across different tunnel lengths during this period, revealing that medium-length tunnels experience the highest accident rates. Consequently, the design of the tunnel’s interior landscape, particularly the cave section, has attracted considerable attention from both the academic and industrial sectors. This focus underscores its importance not only in enhancing the tunnel’s overall aesthetics but also in improving driver safety.
In traditional tunnel landscape design, there has been a reliance on subjective questionnaires or software analysis to examine a single variable in order to deduce design parameters. For instance, Wan et al. [
14] used DIALux (
https://www.dialux.com/zh-CN/) to show how tunnel sidewall and vault decorations affect lighting. Their research revealed that decoration significantly influences light quality, recommending the use of light-gray vaults and white sidewalls for enhanced visibility and safety in tunnels, especially to mitigate the black hole effect at entrances. Exploring the optimization of lighting in urban underwater tunnels, Du et al. [
15], such as shading, enhanced entrance/exit lighting, decorations, and sight-inducing systems. They concluded that the combination of sight-inducing strategies with improved lighting contributes to a coherent visual environment, effectively recycling light within tunnels, and optimizing safety and navigation while considering comfort and economy. More recently, Jiao et al. [
10] embarked on a study in 2021, specifically focusing on visual comfort at the entrances and exits of urban underwater extra-long tunnels. Utilizing eye-tracking instruments, illuminance meters, and other experimental apparatus, the research aimed to collect data on drivers’ pupil areas and illuminance levels during tunnel traversal. The study identified the maximum transient velocity value of the pupil area as a critical metric for evaluating visual comfort at the entrance and exit sections of the East Lake Tunnel. Concurrently, in 2021, Ye et al. [
9] explored the comfort and safety evaluation of landscape design at highway tunnel entrances by leveraging eye movement indices. By employing the orthogonal experimental design method, they developed nine model scenarios influenced by four principal factors: entrance line shape, color, greenery, and the texture of the cave. Evaluation indices such as pupil diameter and gaze deviation time facilitated driving simulation experiments, which led to optimization suggestions for models posing driving safety hazards. Furthering this research trajectory, in 2022, Wang et al. [
12] examined the decoration of highway tunnel sidewalls from a driving comfort perspective by employing eye movement and heart rate indices as metrics for comfort and safety assessment. These experiments, conducted across three different landscape models, highlight an innovative approach to tunnel design evaluation. Nonetheless, it is important to note that these methodologies are not immune to subjective influences and exhibit limitations in the quantitative analysis of multivariate and multiparameter dimensions.
With the advent of machine learning, a burgeoning number of researchers have turned to machine learning methodologies for the quantitative analysis and study of tunnel design and construction with the objective of boosting both the efficiency of tunnel construction and ensuring traffic safety. Zhang et al. [
16] pioneered the application of machine learning in the construction of twin tunnels. Specifically, they employed multivariate adaptive regression splines and decision tree regression methods to forecast the maximum bending moment within the first tunnel lining, drawing on the constructed FE case studies. Ou et al. [
17] developed an advanced machine learning framework that integrates particle swarm optimization (PSO) with support vector regression (SVR), back-propagation neural network (BPNN), and extremum learning machine (ELM) to predict surface settlement during tunnel construction. Furthermore, Liu et al. [
18] constructed a prediction model for tunnel engineering monitoring using BPNN and MARS machine learning regression algorithms. In this setup, the residuals derived from the gray model are employed as the input data for the BP neural network. The result of this hybrid model serves as the predicted outcome, with a focus on monitoring data related to tunnel surface upper peripheral convergence and arch settlement deformation.
Despite significant advancements in the field, machine learning methods have not yet been utilized to quantitatively analyze the rationality of tunnel cave landscape design. Current approaches to designing tunnel cave landscapes face challenges in adequately accounting for the safety and comfort of tunnel driving. Addressing this gap, this paper pioneers the use of machine learning to analyze tunnel cave landscape design from the perspective of drivers’ physiological factors. It introduces an innovative approach that derives experimental conditions from orthogonal experiments, simulates the physiological and oculomotor parameters of driving outputs, and identifies the optimal comprehensive features of urban tunnel cave landscapes in terms of safety and comfort using a two-step semi-supervised [
19] K-means clustering algorithm [
20]. The contributions of this paper are outlined as follows:
Previous studies have focused on investigating the relationship between single tunnel landscapes and safety and comfort, whereas this paper is the first to examine the relationship between combined landscapes and safety and comfort;
We propose an approach that combines an orthogonal design of experiments with a two-step semi-supervised clustering pipeline. This approach allows for the analysis of the advantages and disadvantages of combining physical quantities in the design of landscape elements in the body segments of urban tunnels at the biomass level in terms of both the safety and comfort of the tunnels;
This work provides a valuable theoretical reference for exploring the design of landscape elements in the body segments of urban tunnels by utilizing machine learning techniques to analyze physiological volumes.
2. Literature Review
The landscape elements of urban tunnel body segments significantly influence the visual experience of drivers and the aesthetic appeal of tunnels. A well-conceived landscape design not only enhances driver safety and comfort but also beautifies the tunnel environment. In light of the critical need to boost highway tunnel driving safety and mitigate drivers’ psychological discomfort, the structural design of tunnel landscapes has emerged as a key area of focus. This design aspect typically encompasses the arch and sidewalls, the road surface within the tunnel, and the landscape zone of the cave, among other components [
21]. Within the framework of tunnel landscape design, the interior landscape of tunnels constitutes a vital subject of investigation. Various design and evaluation methodologies have been proposed for these landscape elements, which are further categorized based on their dynamic characteristics, such as spatial three-dimensionality, environmental simplicity, and functionality in dynamic vision, as shown in
Table 1.
2.1. Design of Landscape Elements for Urban Tunnel Body Sections
2.1.1. Landscape Physical Quantity Analysis for Tunnel Roof Design
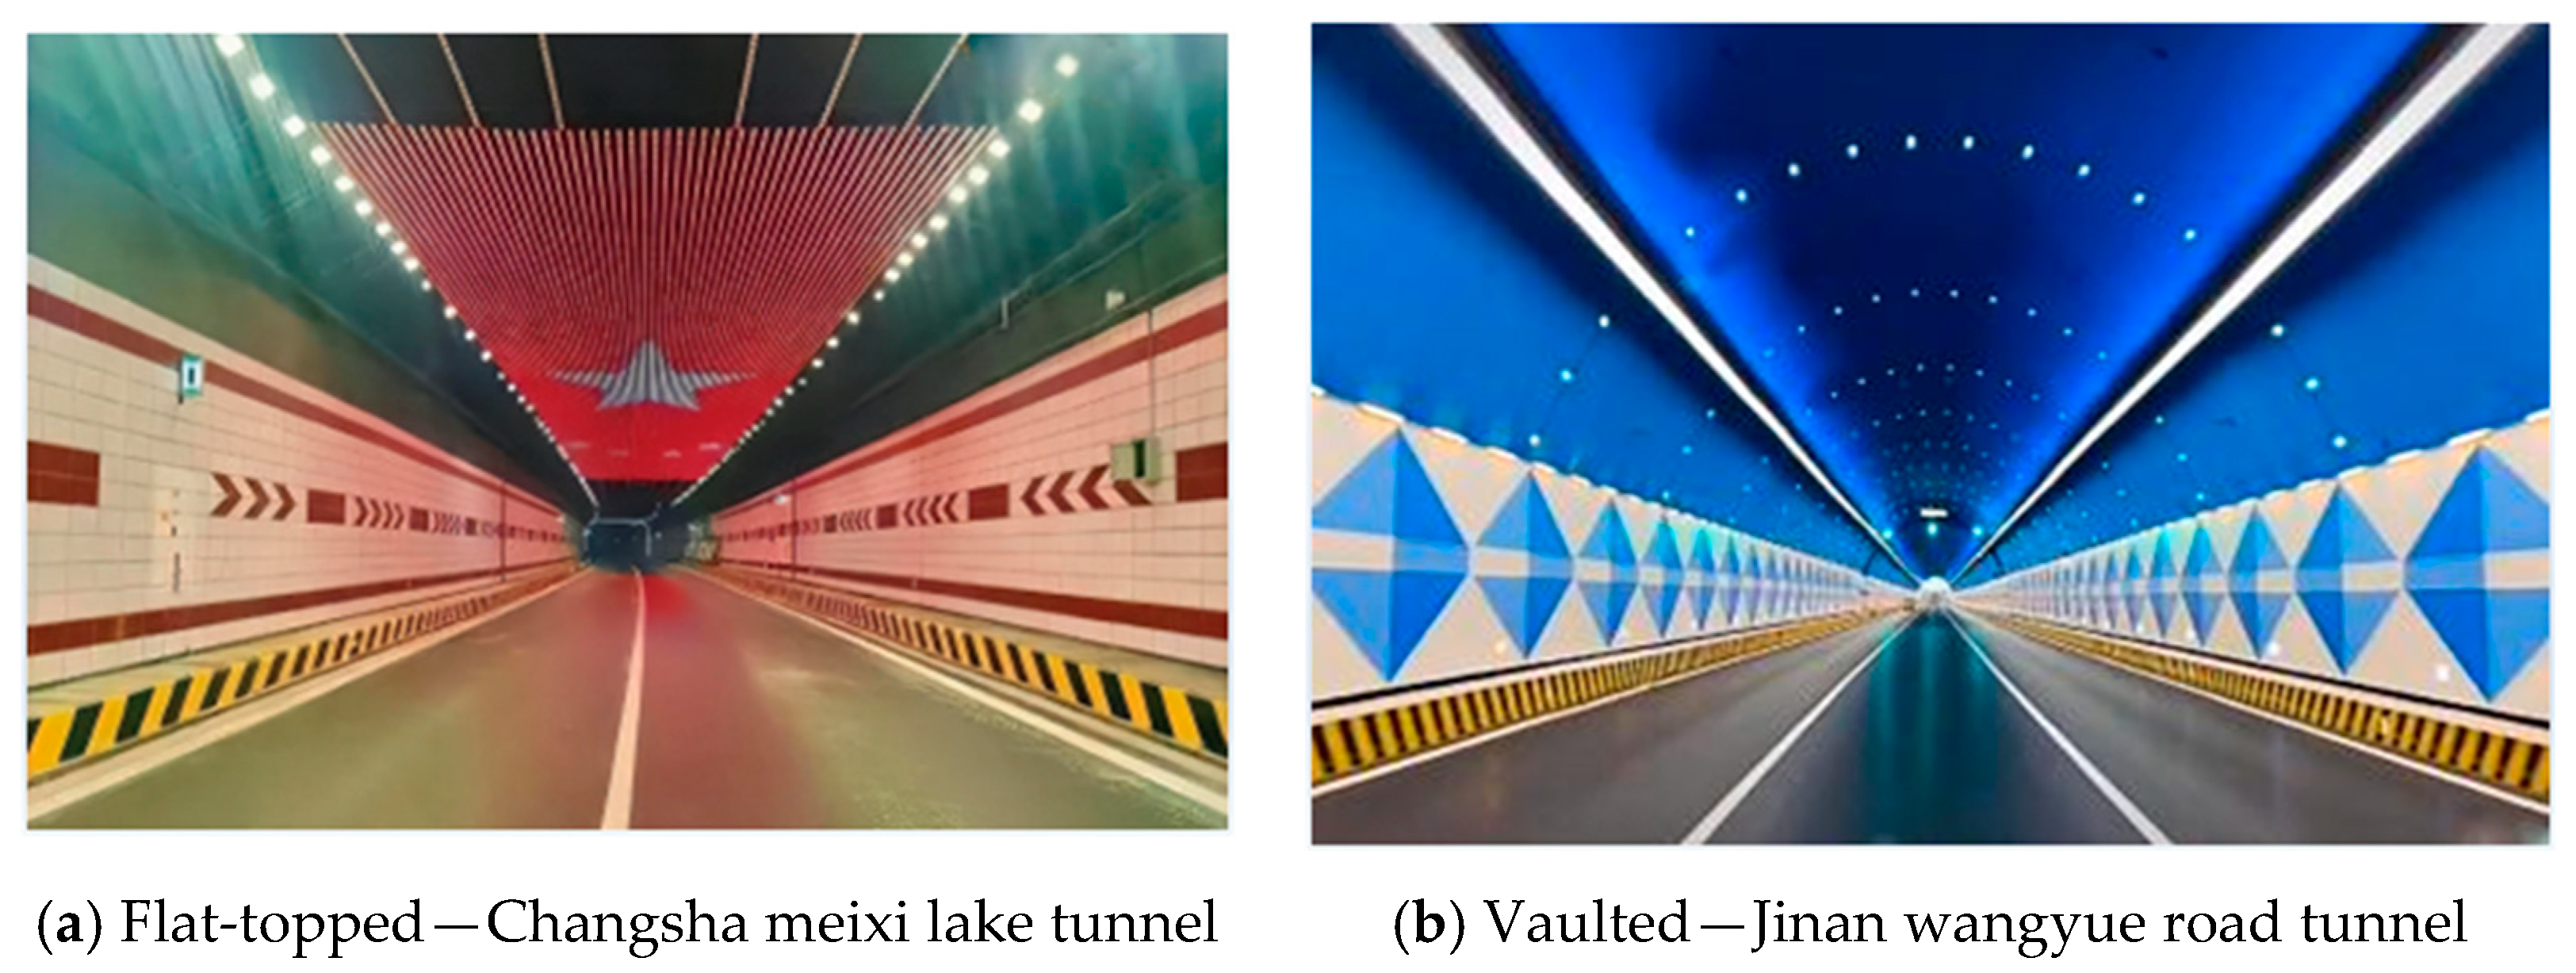
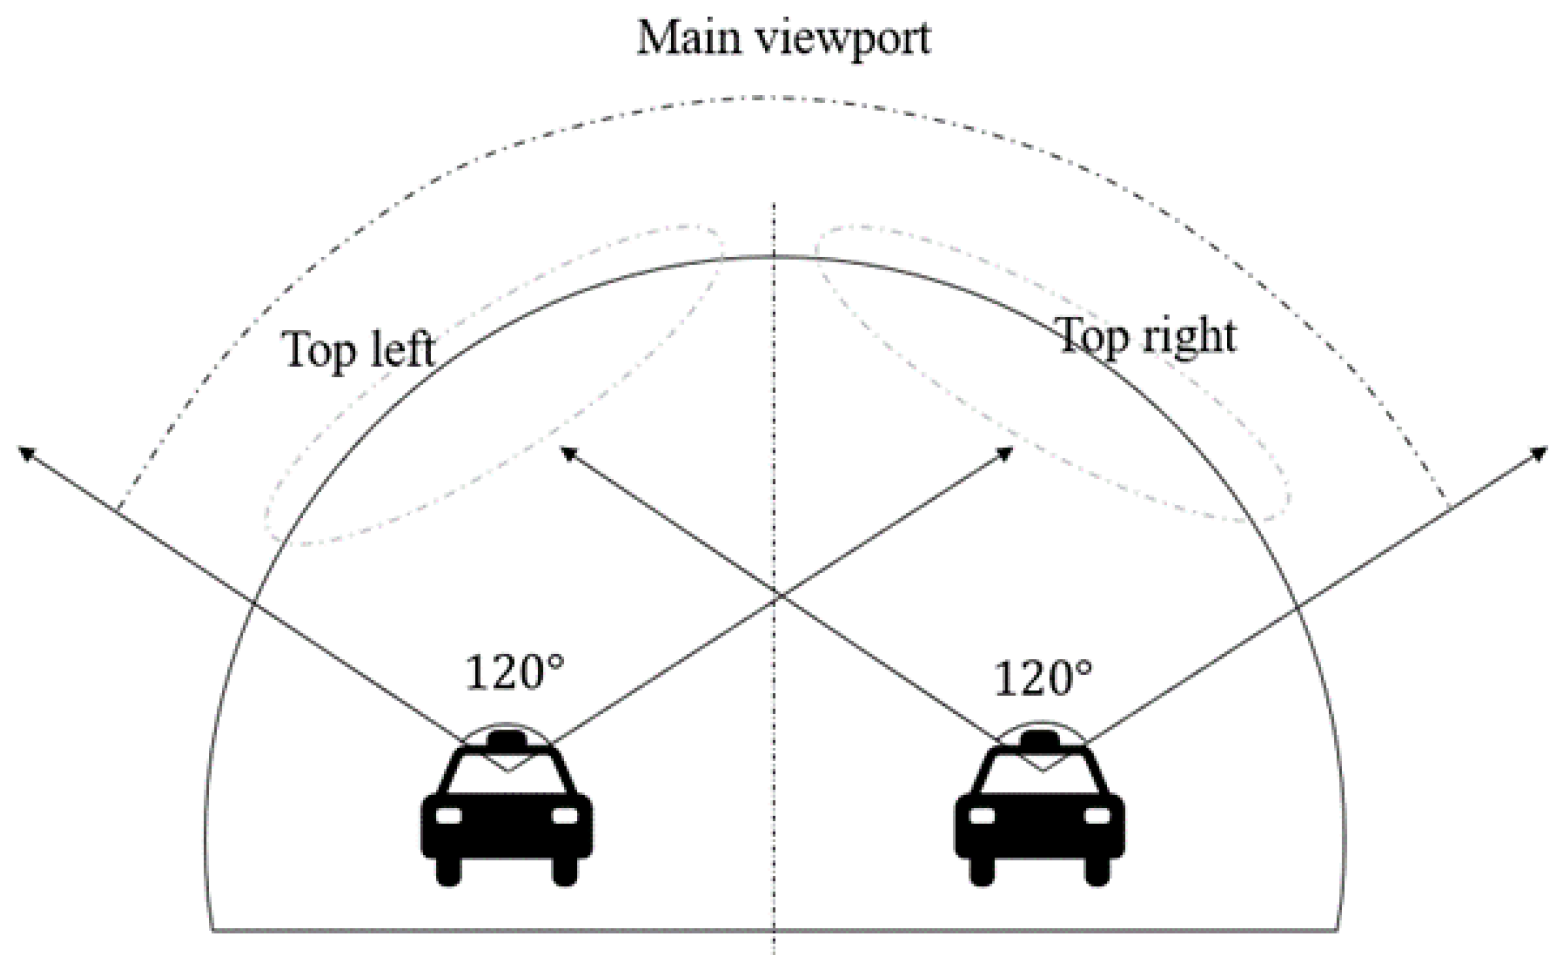
The tunnel roof, positioned in the upper region inside the tunnel, stands as one of the pivotal elements of the tunnel landscape, divisible into two primary forms: flat and vaulted. These forms fall within the driver’s horizontal visual range of 120°, constituting the main area of visual focus (refer to
Figure 2 and
Figure 3). Through the examination and analysis of numerous domestic tunnel roofs, including those of the test tunnel, it has been observed that gray is the prevailing color choice for tunnel roofs in China, with a marginal variation in the use of blue, white, and yellow.
In their research, Wan et al. [
14] discovered that a light gray vaulted roof has a notable positive impact on driver comfort. The findings suggest a preference for lighter colors over darker ones for the tunnel roof, as lighter colors are associated with higher levels of driving comfort. Beyond color, the incorporation of patterns on the tunnel ceiling has been identified as a means to alleviate the monotony of the tunnel environment and reduce driver discomfort [
21]. Patterned designs in the vault’s decoration scheme have been found to offer greater driving comfort compared to undecorated or uniformly colored decorations. However, at high vehicle speeds, intricate lighting patterns on the roof may lead to increased head and eye rotation angles for the driver. This diversion of vision and attention from the road for prolonged periods can compromise driving safety. From the aforementioned studies, it is evident that the principal factors influencing the design of tunnel roof landscape elements primarily revolve around the choice of color (favoring light shade) and the pattern design of the roof.
2.1.2. Analysis of Physical Quantities of the Landscape Oriented toward the Tunnel Sidewalls
The influence of color decorations within tunnels on drivers’ perceptions of the environment, as well as their driving behaviors, is a significant factor to consider. Previous studies have demonstrated a direct correlation between drivers’ subjective evaluations, details of the tunnel environment, and the impact of color hues. In particular, research has shown that light-colored sidewalls can enhance drivers’ ability to focus on the road ahead. Kircher et al. (2012) [
22] conducted a study to explore the relationship between sidewall colors and drivers’ desire to accelerate. The findings revealed that the blue sidewalls were least associated with the inclination to accelerate, providing a greater sense of comfort. The green and orange sidewalls followed while the white sidewalls incited the most significant inclination to accelerate. In addition to color, the design of sidewall patterns also plays a crucial role in improving the visual perception and spatial awareness of drivers. Research has indicated that patterns with a certain longitudinal width effectively capture driver attention, as detailed in
Table 2. Circular and rectangular patterns were found to soothe nervousness, whereas square and triangular patterns often incite a desire to accelerate, and inverted triangular patterns generally encourage a reduction in speed. Furthermore, the arrangement of these patterns also impacts drivers’ perception of speed and driving comfort. It is important to note that excessively narrow spacing between patterns can cause dizziness, while spacing that is too wide may not sufficiently improve the perception of speed. For driving speeds ranging from 60–80 km/h, a pattern spacing of 10–20 m is recommended [
23].
The longitudinal width of a pattern is a crucial factor that affects a driver’s speed perception. The narrower the sidewall pattern, the lower the speed perception, while a wider sidewall pattern tends to result in a higher speed perception compared to tunnels with no change in pattern width [
24]. In summary, under dynamic driving conditions, the primary elements that influence the landscape of tunnel sidewalls are color and pattern. For the color element, light-colored designs are preferred, while the pattern design should emphasize simple patterns and a suitable frequency of pattern appearance.
2.1.3. Landscape Physical Quantity Analysis for Tunnel Pavements
The color scheme commonly used for tunnel pavements is the natural gray-black tone of asphalt concrete. Despite its seemingly neutral appearance, this color palette has a soothing effect on the human nervous system. However, prolonged exposure to such monotone surfaces can lead to reduced concentration, mental lethargy, and visual fatigue [
25]. Consequently, the application of colored asphalt pavement has emerged as a strategic intervention to guide traffic flow, alleviate driver fatigue, and enhance both safety and comfort during tunnel navigation. Presently, colored pavements are primarily implemented at tunnel entrances and exits, with their application within the tunnel itself being relatively rare.
Subjective evaluations of various pavement colors within tunnels have highlighted distinct preferences among individuals. Among the participants surveyed, 55% reported visual comfort with green pavements, 40% favored red, and a mere 5% preferred yellow [
26]. In terms of visual cues, yellow and red pavements offer superior tunnel visual guidance, whereas gray and black pavements are less effective. Blue pavements are seen as positively inducing, while green and white pavements offer moderate visual cues [
27]. The reflectance ratios of different colored pavements vary significantly (refer to
Table 3), suggesting that adjusting the color and length of these pavements could facilitate a gradual transition in light reflectance ratios at the portal and articulation segments, thus satisfying luminance requirements. It is evident that pavement color plays a crucial role in the landscape design of tunnel pavements, underscoring its impact on the driving experience within tunnels.
2.1.4. Landscape Physical Quantity Analysis for Sidewalk Elevation Sign-Oriented
The meticulous design and implementation of traffic signs within tunnels are crucial for ensuring smooth visual recognition and safe driving. Tunnel sidewalk facade signs serve a vital function in alerting drivers to potential hazards, either by being positioned within traffic lanes or adjacent to elevated structures along the road, thereby reducing the risk of collisions. Adhering to the principles of safety ergonomics, the selection of colors for these signs should avoid mid-range hues to facilitate better recognition. Furthermore, considerations regarding form and size are essential for optimizing visual recognition. Overly elaborate signs may inadvertently distract drivers, undermining traffic safety [
28]. Consequently, it is highly recommended that tunnel sidewalk markings and patterns be simple and straightforward for ease of comprehension. As prescribed in the Road Traffic Signs and Markings [
29], tunnel sidewalk facade markings ought to consist of black and yellow diagonal stripes with a 45-degree tilt angle and a stripe width and spacing of 15 cm, such that the downward slope faces the direction of vehicle travel. This directive underscores the significance of color, pattern, and frequency of pattern occurrence as primary factors in the design of tunnel sidewalk facade signs, directly impacting their effectiveness and the overall safety of tunnel navigation.
2.2. Traditional Urban Tunnel Landscape Evaluation Methods
Hierarchical Analysis. Analytic Hierarchy Process (AHP) is a decision-making methodology that disaggregates decision elements into hierarchies, which may include objectives, guidelines, and options. It leverages qualitative and quantitative analyses to arrive at a final decision.
Principal Component Analysis. Principal Component Analysis (PCA) is a data analysis method that utilizes the idea of dimensionality reduction to transform multiple indicators into a few composite indicators. This method transforms the original data into a set of linearly independent representations of each dimension through linear transformation, which can reflect the main characteristics of the data.
Entropy weight method. The entropy weight method is an objective assignment approach to assigning weights to indicators based on their variation. By calculating the entropy of each indicator using information entropy, this method corrects the indicator weights to ensure a more unbiased and objective representation of each variable.
In essence, PCA streamlines complex, high-dimensional data into a concise set of principal components, simplifying the data for easier comprehension and interpretation. By selecting the most important principal components, PCA effectively filters out the noise and redundant information from the dataset. As an unsupervised learning method, PCA disregards category information, making it an ideal method for extracting the most informative test combinations in this study.
2.3. Machine Learning-Based Evaluation Methods for Urban Tunnel Landscapes
Previous studies have highlighted the limitations of traditional methods in evaluating urban tunnel landscapes, primarily due to their inherent subjectivity and potential for subjective bias. To surmount these challenges, the research community has pivoted toward leveraging machine learning technologies for objective, precise, and reproducible assessments of tunnel landscapes.
One innovative approach involves the use of image processing and machine learning to assess tunnel landscapes. This method entails the collection of a vast array of tunnel landscape images, followed by the application of computer vision techniques to extract features such as color, texture, and shape. Machine learning algorithms, including Support Vector Machines (SVM) and Deep Learning models, are then utilized to automatically classify and analyze these features, facilitating a nuanced assessment of tunnel landscapes.
Another avenue of research employs sensor data for the evaluation of tunnel landscapes. In this methodology, a network of sensors is deployed to capture data pertaining to air quality, noise levels, and lighting conditions within tunnels. Machine learning algorithms, such as cluster analysis and regression models, are applied to process and model these data. This approach enables the evaluation of the quality and comfort levels of the tunnel landscape based on objective sensor data.
Furthermore, some studies have sought to enrich machine learning analyses by integrating them with user survey data for a holistic assessment of tunnel landscapes. This involves gathering user evaluations of tunnel landscapes via questionnaires and feedback, which are subsequently combined with machine learning algorithms. This integrated approach facilitates the development of predictive models that assess the quality of tunnel landscapes and gauge user satisfaction effectively.
In essence, machine-learning-based methodologies offer promising avenues for the assessment of urban tunnel landscapes. By harnessing diverse data sources, including image analysis, sensor data, and user feedback, in conjunction with sophisticated machine learning algorithms, researchers can achieve objective, accurate, and comprehensive evaluations of tunnel landscapes.
2.4. Example of Representative Cave Landscape Design
In line with the imperative safety requirements encompassing the enhancement of speed perception and elevation of sight induction within tunnels, as well as the provision of optimal comfort levels through high subjective driver evaluation and favorable psychophysiological indicators, attention is directed toward the design elements, including color, material, pattern, and location. The predominant styles of graphic decorative schemes often feature natural scenery, simple geometry, a single color, emblems, flags, and so on. This shift away from the conventional starkness of tunnel environments serves to mitigate visual fatigue and alleviate other associated psychological discomforts among drivers [
30].
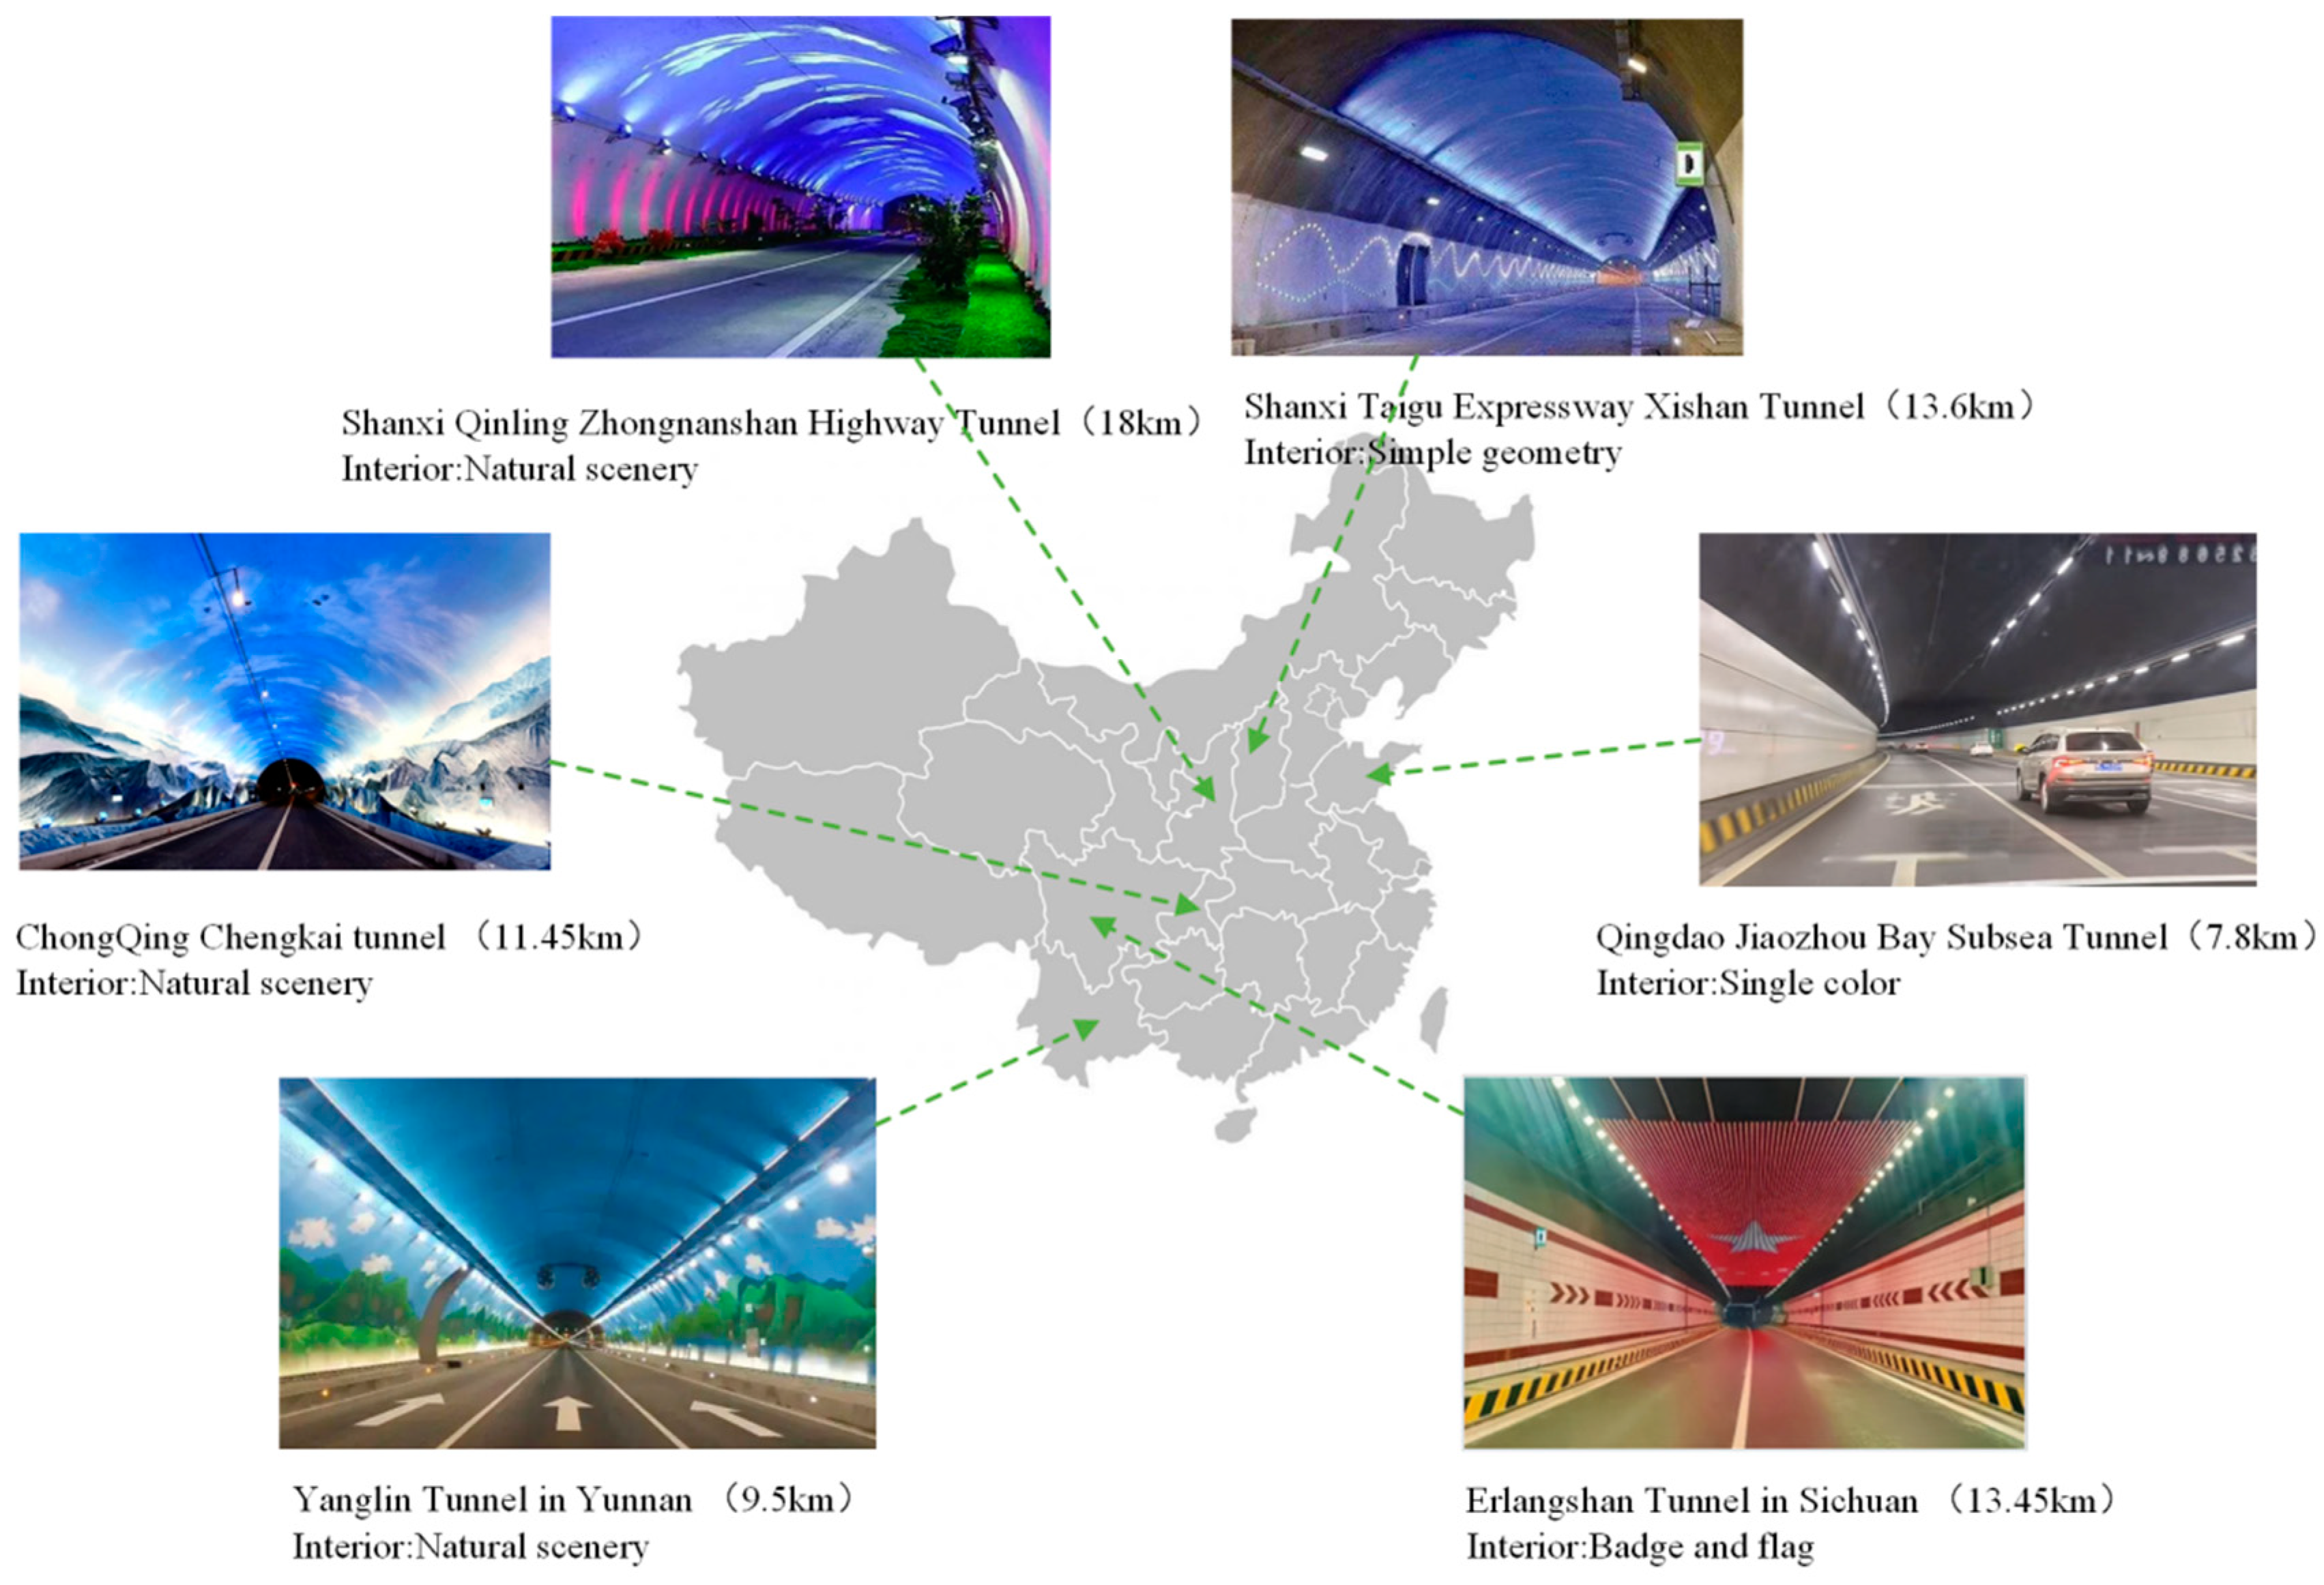
Figure 4 shows the distinctive tunnel interior designs in various regions of China. Notable examples include the vault decoration depicting natural scenery in the Qinling Zhanshan Tunnel in Shaanxi Province, Chengkai Expressway Tunnel in Chongqing, Yanglin Tunnel in Yunnan Province, simple geometric patterns in the Xishan Long Tunnel in Shanxi, and monochromatic aesthetics in the Jiaozhou Bay Tunnel in Qingdao, Shandong Province. Moreover, the image illustrates the use of emblematic banners in the design of the Erlangshan Tunnel in Sichuan Province.
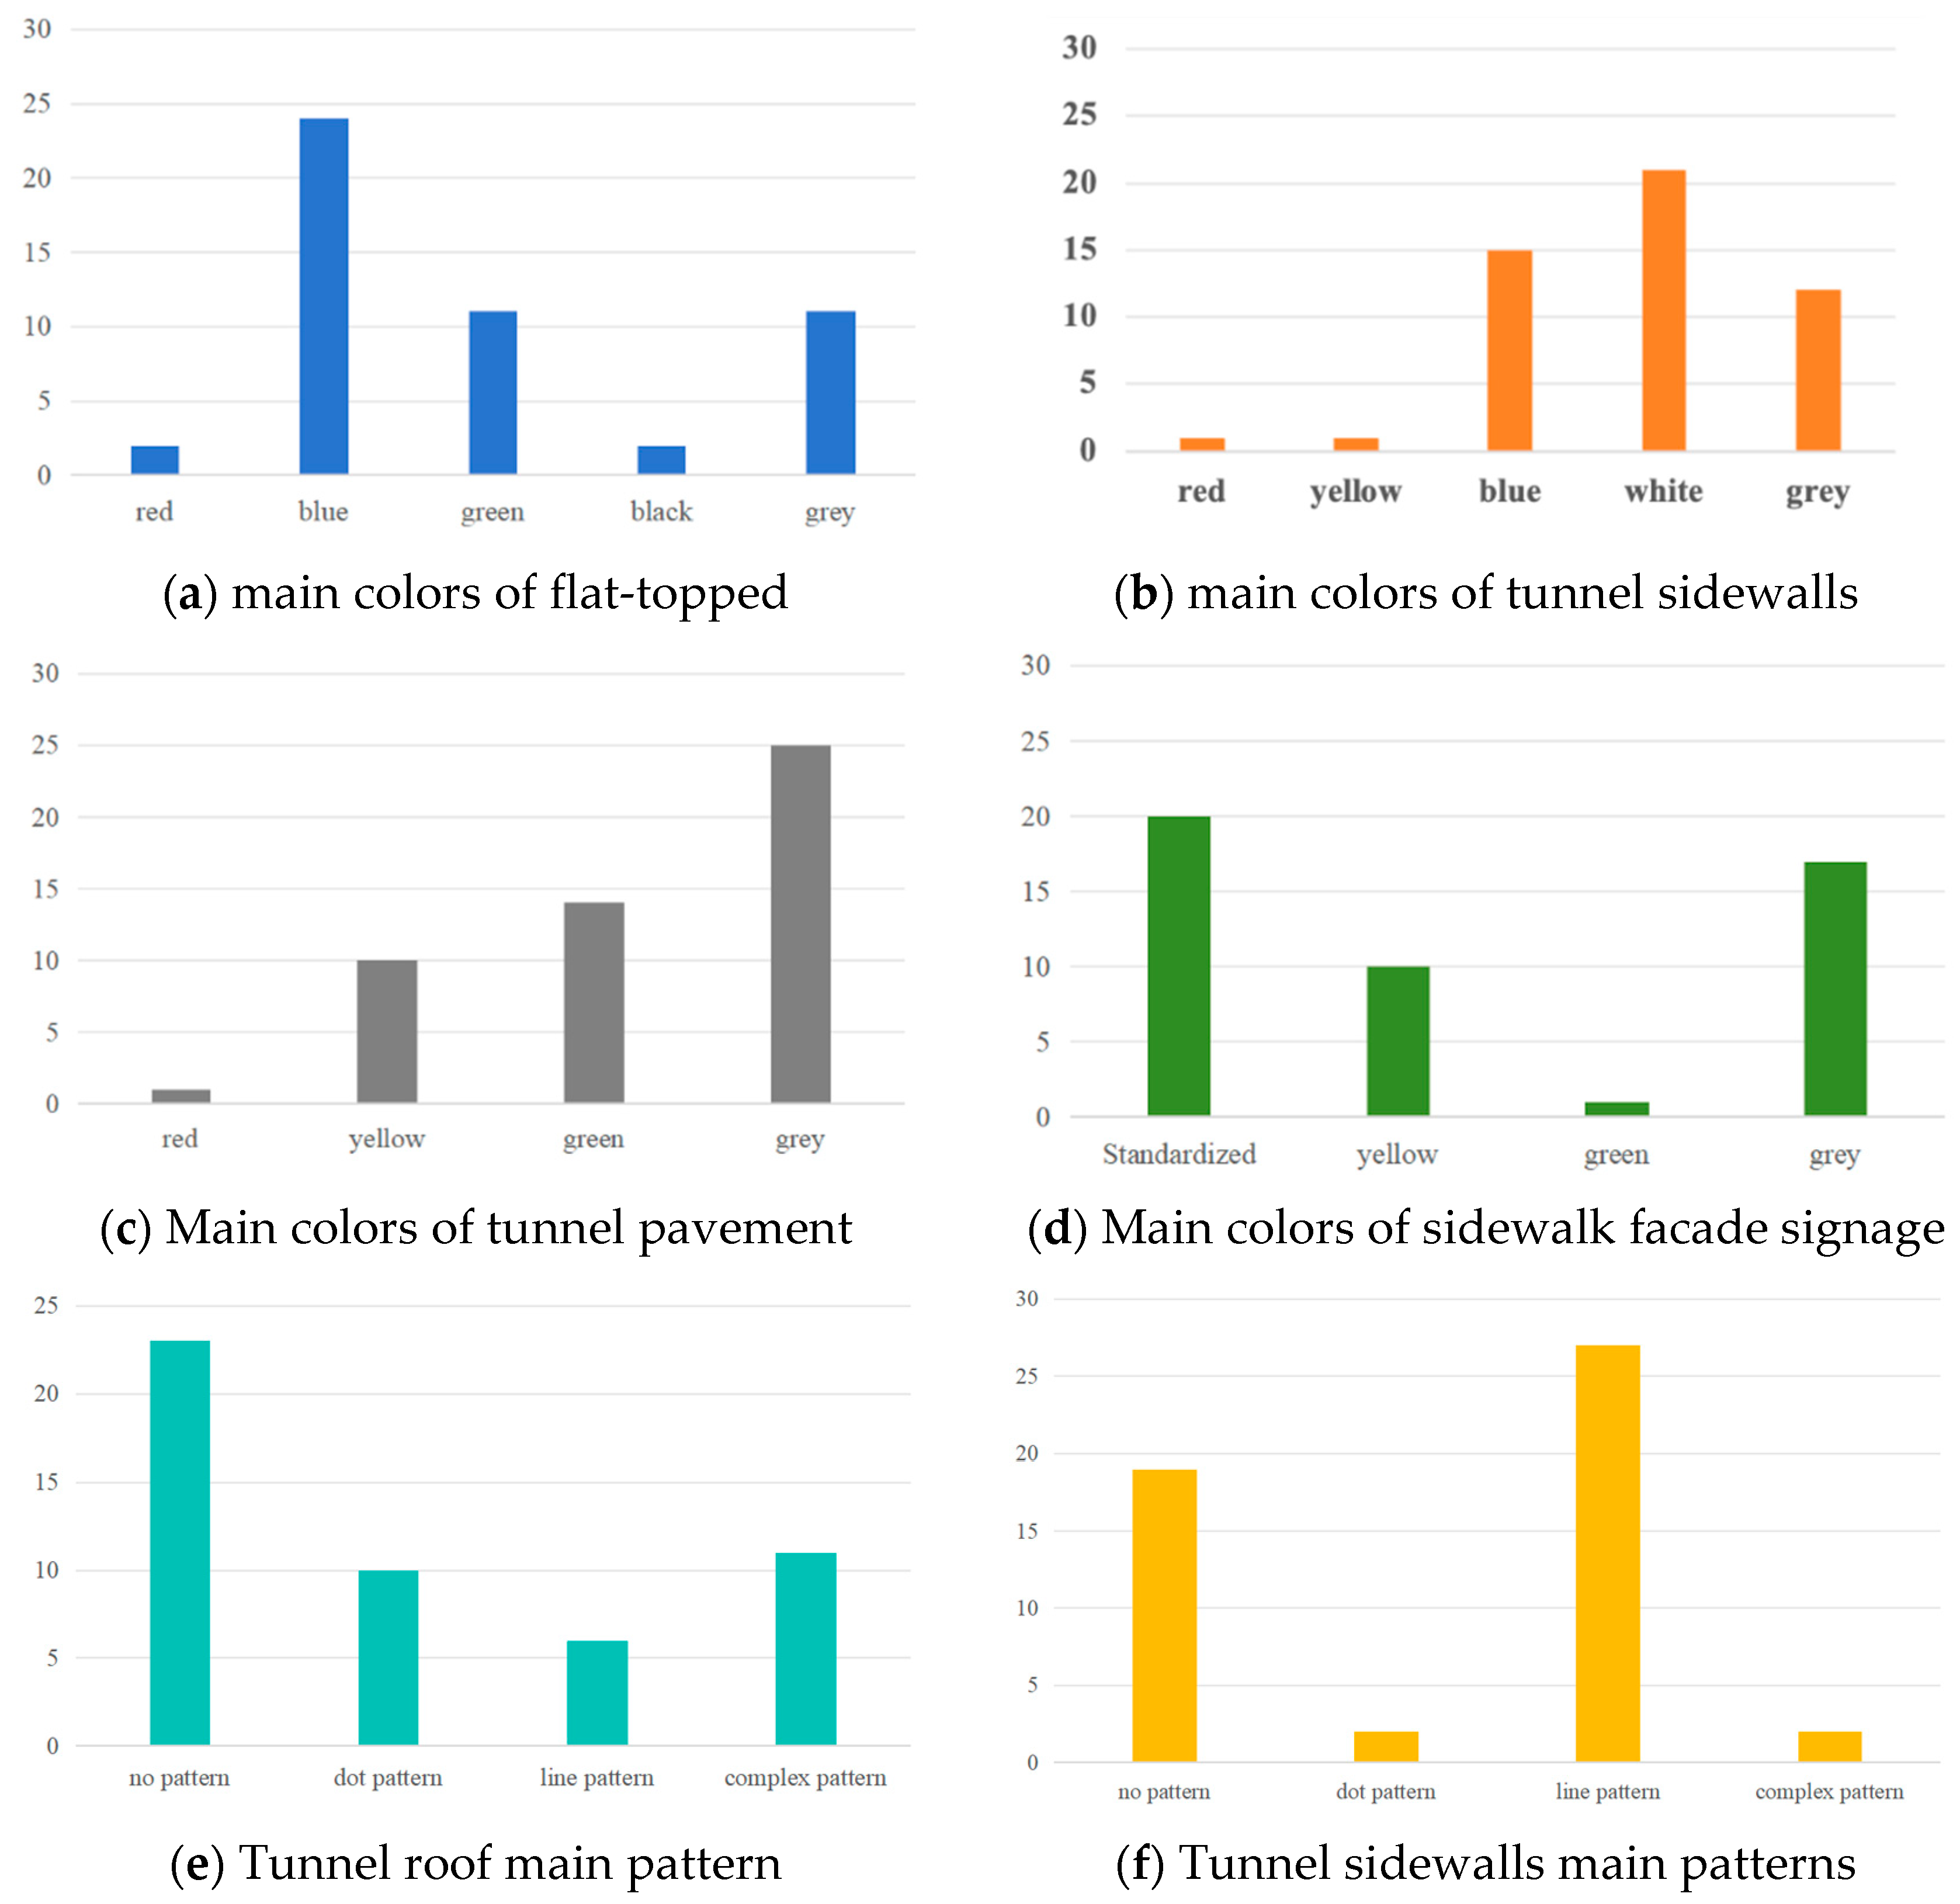
In order to gain an in-depth understanding of the color distribution of landscape elements within domestic tunnels, an investigation was conducted on a sample of 50 tunnels. A comprehensive dataset was compiled by meticulously filling out a detailed research form that captured the primary landscape elements and their respective color schemes in each tunnel, as demonstrated in
Figure 5.
The predominant colors observed on the tunnel roofs are blue, green, and gray, while the tunnel sidewalls predominantly feature shades of blue, white, and gray. The tunnel pavement predominantly showcased colors such as yellow, green, and gray, whereas the colors of the tunnel sidewalk facade markings adhered to normative colors of yellow and gray. The subsequent experimental processes were guided by these findings. However, to uphold the scientific rigor of the study, certain anomalies, such as only two instances of red-colored tunnel roofs, were excluded from the analysis. It was deemed that such a limited number of cases did not substantiate a significant trend. Consequently, the analysis predominantly focused on colors that exhibited a frequency greater than 10 instances. Subsequent refinement resulted in the selection of four main color pattern categories: no pattern, dot pattern, line pattern, and complex pattern.
3. Methodology
3.1. Experiment Design
Building on the biomass metrics identified in our previous research [
20] as correlates of safety and comfort, we devised a two-step clustering strategy aimed at pinpointing variables associated with safety, as well as combinations of variables that align with both safety and comfort. The comprehensive methodology employed in this strategy is shown in
Figure 6.
In the initial phase, we opted for five samples distinctly labeled as “Excellent” and “Fail” to serve as the foundation for a semi-supervised classification, specifically targeting adherence to safety and comfort prerequisites. Utilizing this approach, we embarked on a detailed examination of single-factor indices related to principal landscape components—namely, the tunnel roof, sidewalls, pavement, and pedestrian facade markings—across a spectrum of 60 varied operational scenarios.
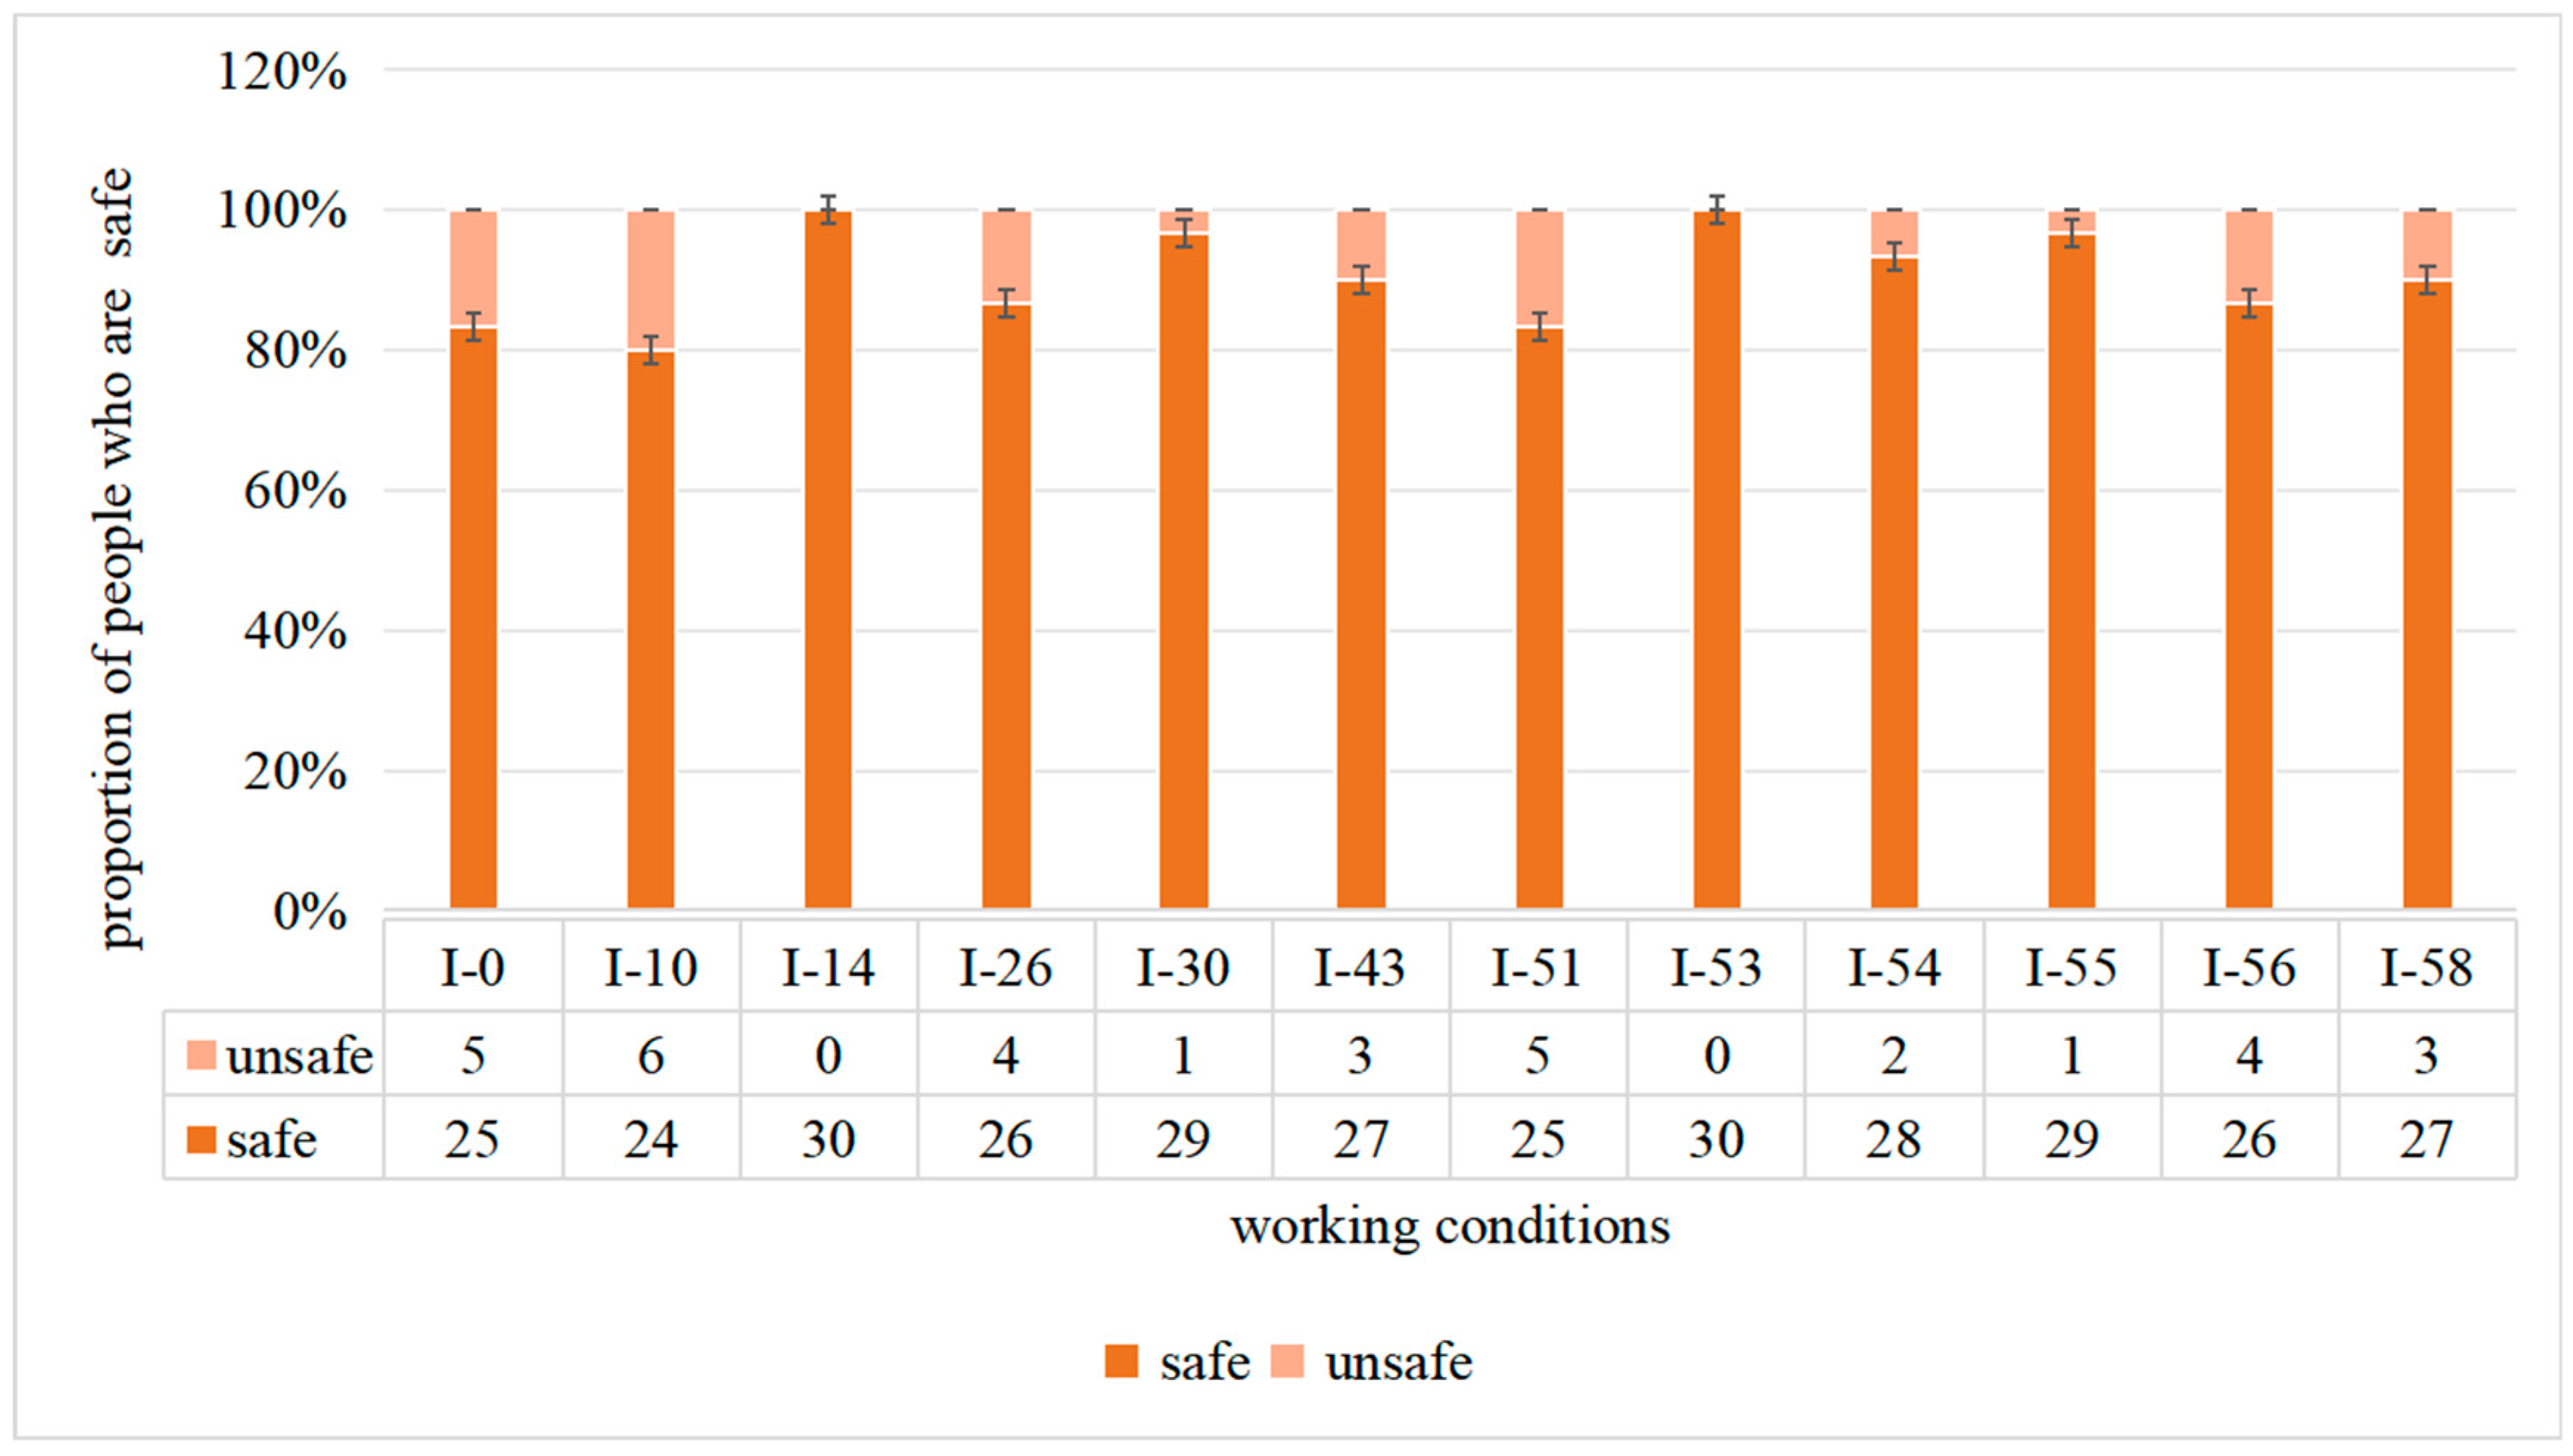
Subsequent to this analysis, we procured physiological and ocular movement data from drivers by emulating their driving experience under 60 distinct conditions. This endeavor led to the creation of six-dimensional parameters rooted in the operational scenarios, which were then aggregated using a semi-supervised K-means algorithm. The objective was to isolate the variables fulfilling safety criteria, characterized by a scenario where over 80% of drivers are deemed “Excellent”, denoting a safe condition. Furthermore, scenarios where more than 50% of drivers were rated “Excellent” were recognized as comfortable conditions.
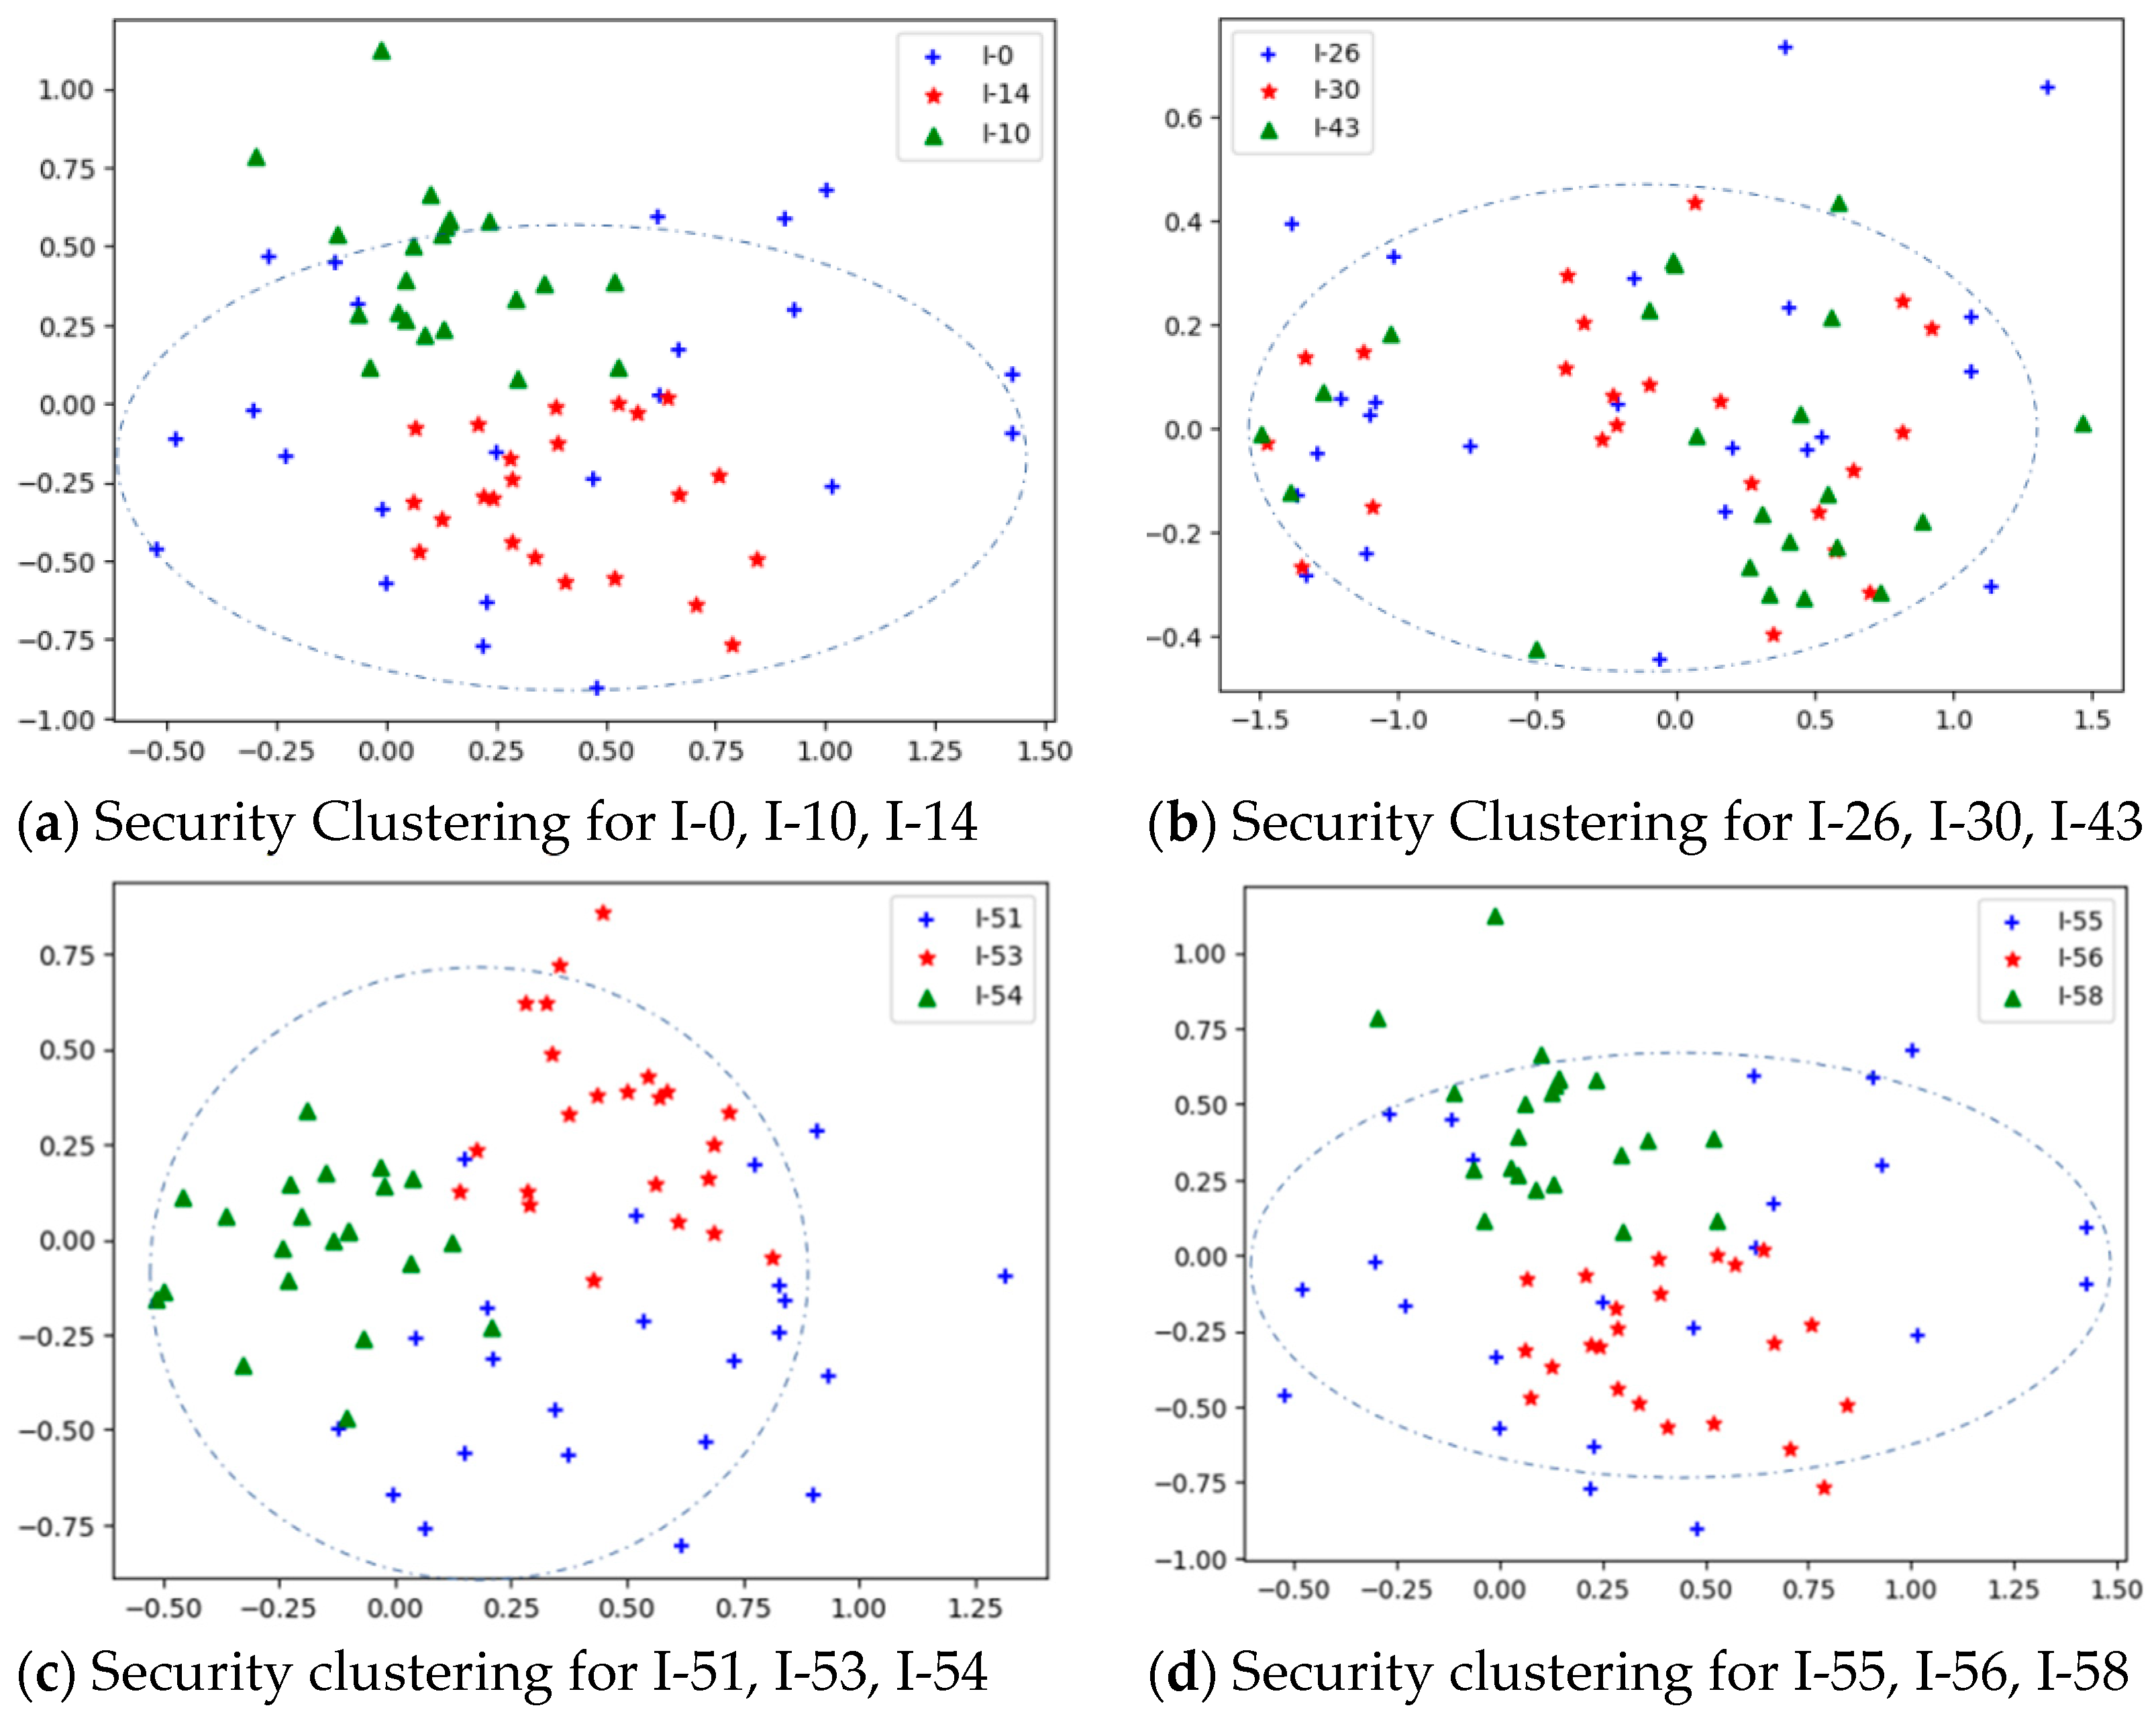
Progressing to the second stage, the outcomes of the initial comparison were scrutinized to ascertain the necessity of reconducting the orthogonal test. This determination was based on the results derived from the orthogonal test, which then guided the second iteration of the semi-supervised K-means algorithm clustering analysis. This process mirrored the clustering methodology delineated in the initial phase. Employing the Euclidean distance metric, we endeavored to pinpoint the safest and most comfortable composite landscape configurations under the safety-first axiom, thereby ensuring safety while concurrently accommodating comfort.
For each scenario, we requested each driver to simulate driving five times and excluded data with a heart rate variability greater than 50%. Finally, the average value of each biomass for each driver was considered as the final test result for the tunnel.
3.2. Construction of the Virtual Simulation Driving Test Platform
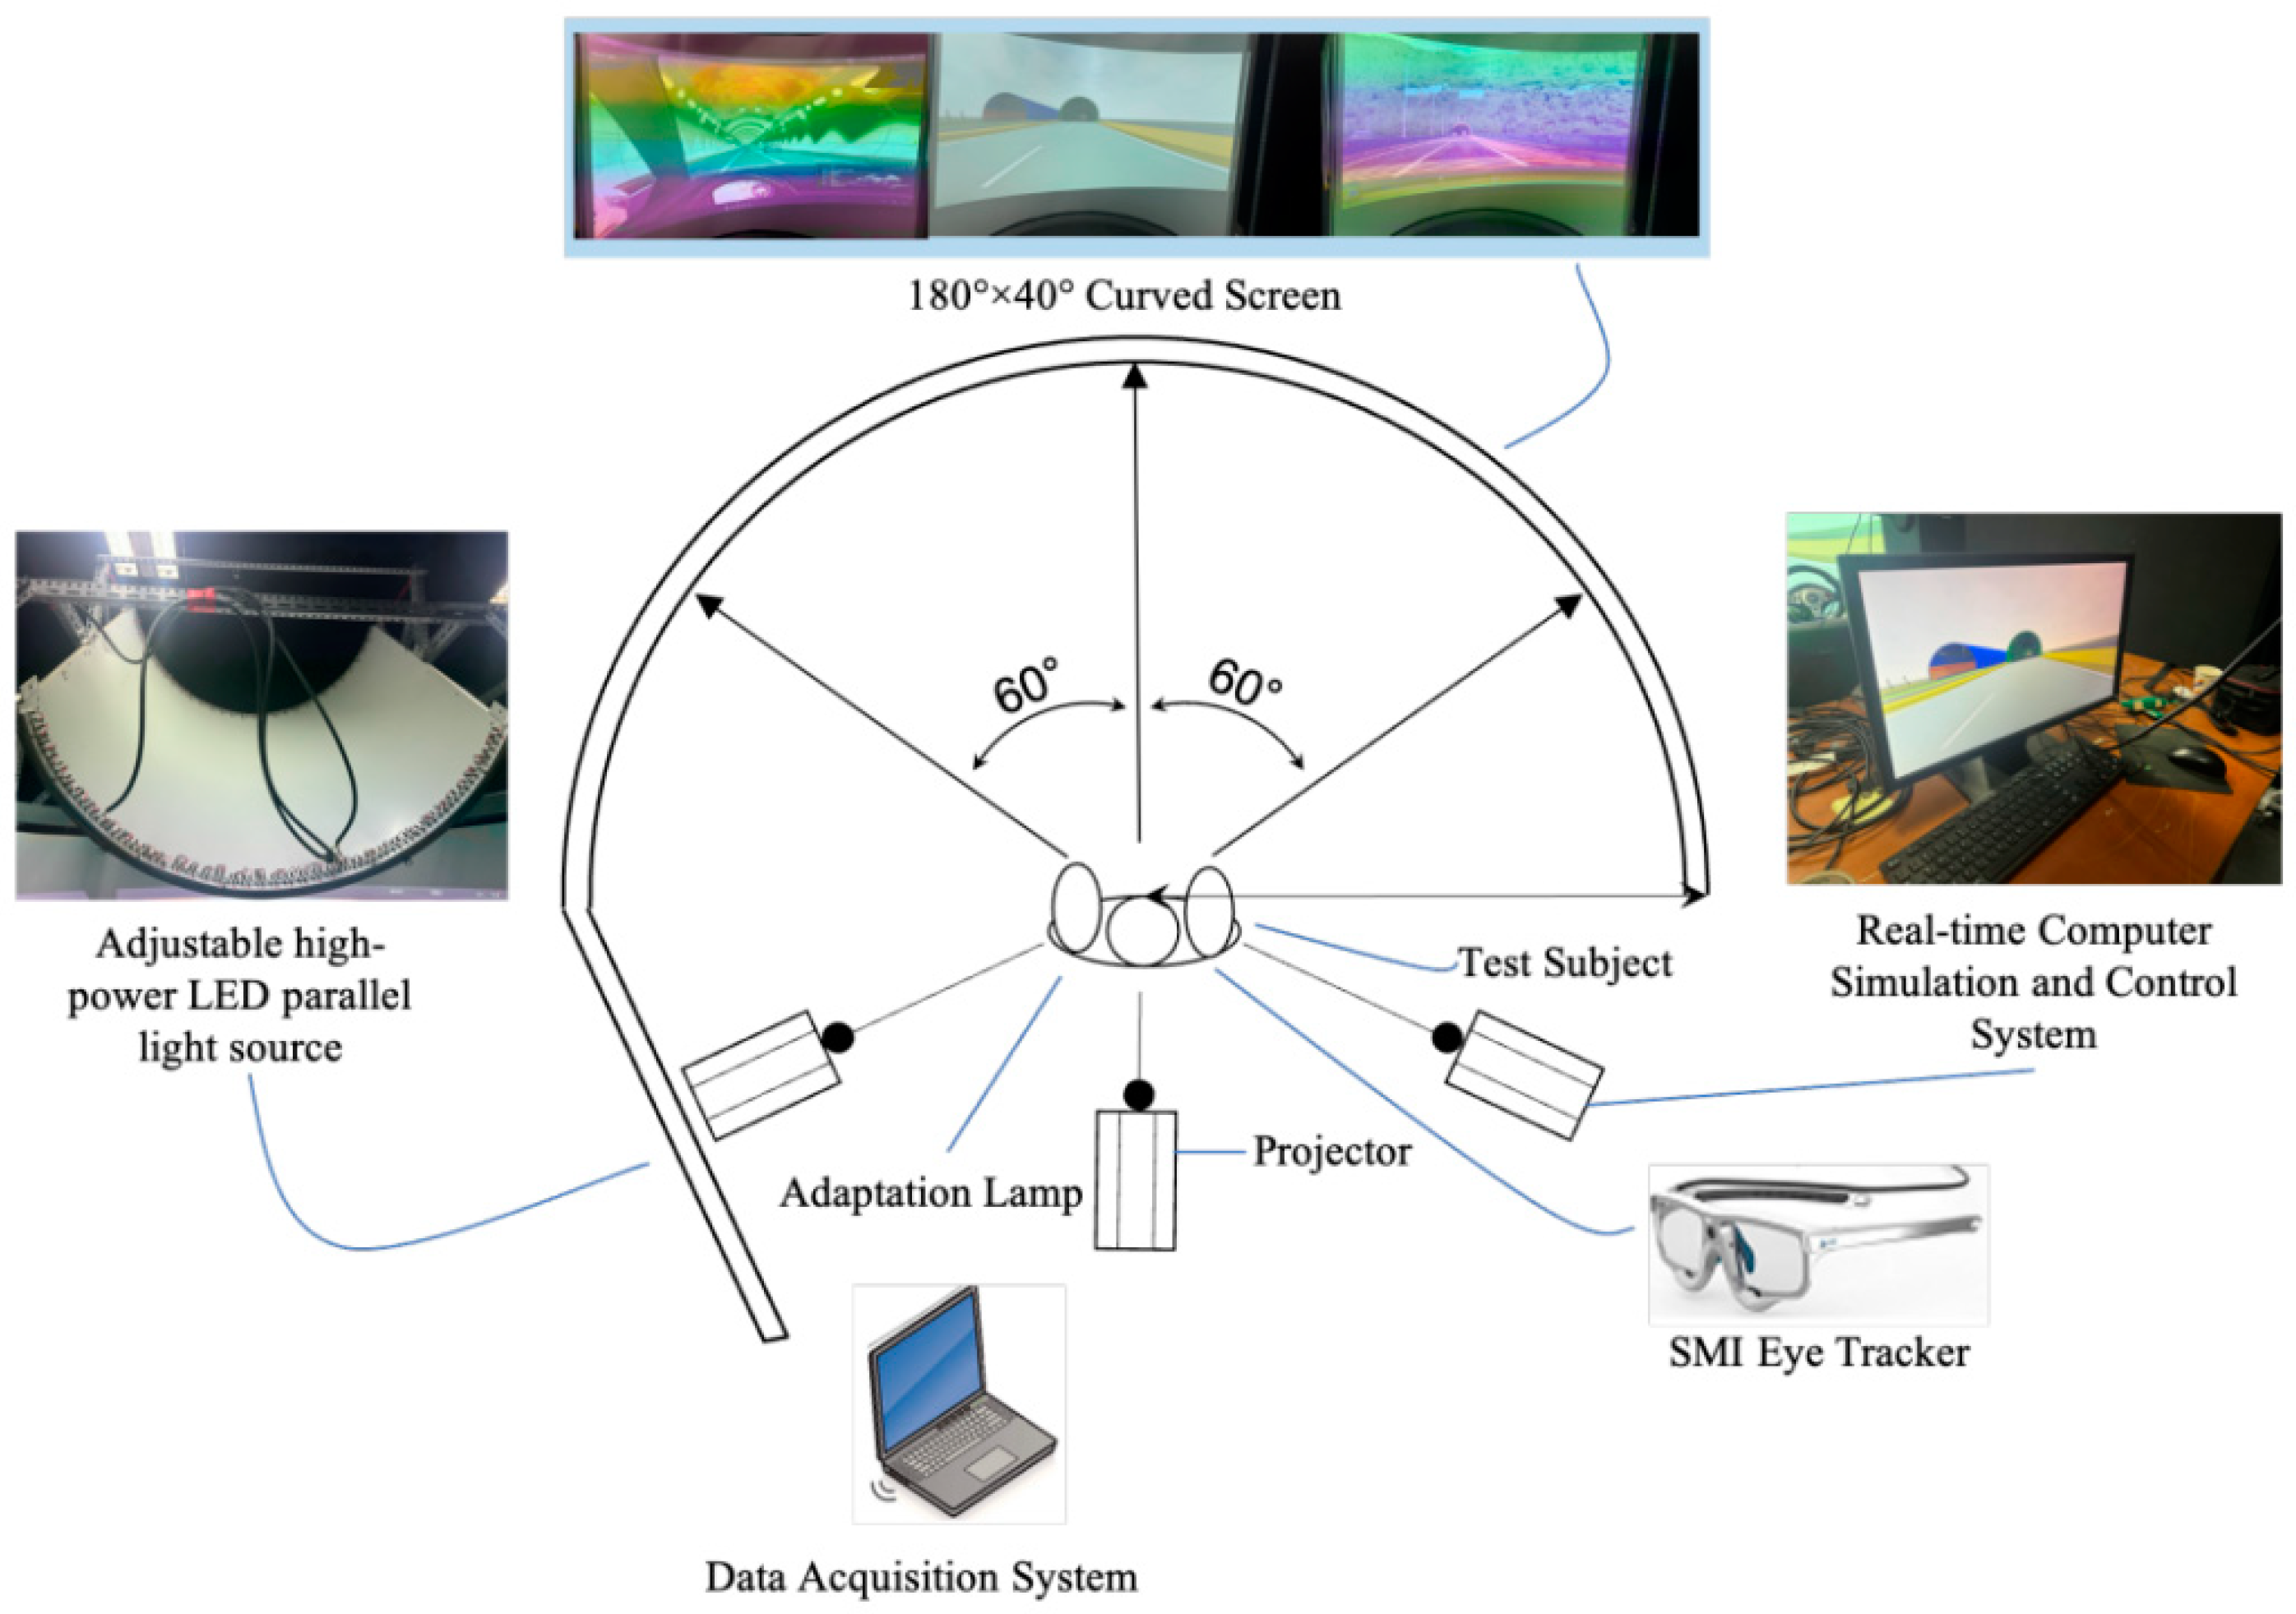
The experimental device used in this study was an indoor driving simulation platform, as shown in
Figure 7. The platform mainly consists of a simulated cab and motion control system, computerized real-time simulation and control system, eye tracker, adjustable high-power LED parallel light source, data acquisition system, and other auxiliary systems, which simulate real driving environments and driving processes in order to provide reproducible and controllable experimental conditions. Moreover, this guarantees that the physiological loads on the drivers remain unaffected by extraneous factors in the tunnel.
As shown in
Figure 8, one of the eye movement parameters used to record the changes in the driver’s eye movement parameters during tunnel driving was the German SMI eye-tracking instrument. The sampling frequency of this eye-tracking instrument is 50/60 Hz, with a sight-tracking accuracy of less than 0.1° and a pupil-tracking accuracy ranging from 0.5° to 1°. In order to collect other physiological indicators such as heart rate, blood pressure, and heart rate variability, we utilized the MP150 physiological recorder produced by the American BIOPAC company. This recorder has a sampling frequency of 400 kHz. The changes in its physiological indexes were analyzed using the equipped Acknowledge software(Win-ACK100W). During the test, drivers were required to accurately attach ECG patches at different locations on their chests according to the instructions during the test and connect to the ECG module with the corresponding wires so as to collect precise physiological data.
Building upon previous studies [
31,
32], our research incorporated six significant metrics to analyze eye movement patterns: eye movement frequency, number of gaze points, pupil area variability, heart rate, blood pressure, and heart rate variability, totaling six metrics. To ensure the accuracy of our experiment, we standardized the collected data, as each metric had varying ranges and units. This normalization procedure enabled us to compare and interpret the results effectively.
3.3. Personnel Preparation
Based on previous experiments [
20], we enlisted 30 drivers to undertake two separate driving sessions through tunnels adorned with 60 decorations and nine combinations of variables to collect physiological data. Acknowledging the potential individual variances in driving behaviors, we selected 30 drivers for the simulation tests. Considering previous studies that have shown variations in driving behavior between genders in tunnel environments, as well as the prevalence of male drivers in real-world scenarios, our participant group comprised 20 males and 10 females. All participants were between the ages of 18 and 60 years, and all had at least two years of driving experience, including tunnel driving. Additionally, the criteria for participation included the absence of color blindness or weakness, possession of normal unaided or corrected vision, and no prior exposure to driving simulation equipment.
To mitigate the impact of external factors on the experiment’s outcomes, subjects were instructed to refrain from engaging in strenuous physical activity one hour prior to the test, avoid alcohol and caffeine consumption within 12 h before the test, and ensure they had sufficient sleep to guarantee optimal conditions during the test. Furthermore, the purpose, location, and sequence of the test were not disclosed to the participants beforehand. To prevent interference from other electrical signals with the data collection instruments, all nonessential electronic devices were turned off during the testing period.
4. Semi-Supervised K-Means
As shown in Algorithm 1, the semi-supervised K-means algorithm is an improvement over the traditional K-means algorithm. This enhanced approach integrates a limited set of labeled samples, known as the seed set, to refine the clustering process. This approach assumes that the seed set encompasses all K clusters, with each cluster being represented by at least one sample.
In this paper, the semi-supervised K-means algorithm was used to predict the comfort and safety of the design of the landscape elements of urban tunnel body segments. Let , where represents the eye movement frequency, represents the number of focus points, represents the pupil area change rate, represents the heart rate and represents the blood pressure. When combining landscape elements based on a single element of safety screening, let denote the number of blinks, number of gaze points, pupil area change rate, heart rate, blood pressure, and heart rate variability, respectively. The number of clusters is denoted as K, and the labeled dataset , where , where R is the labeling space. The final output dataset, X, belongs to one of the K clusters. The inputs of this algorithm are , where belongs to , , and k. Here, R is the vector space, and d is the dimension of the vector space, which is 6 in this paper.
S refers to the limited labeled datasets available, while k determines the number of clusters targeted during the clustering operation.
The first step of this algorithm starts by finding the set of K clustering centers using labeled data , Subsequently, the algorithm proceeds to iteratively perform the following steps until convergence is achieved:
Assign clusters: reassign data points
to classes
j so that the conditions are satisfied:
where
is the distance between the sample
and each mean vector
(1 ≤
j ≤ k).
The samples are then assigned to the corresponding clusters
.
| Algorithm 1: Semi-supervised K-means |
Input: .
Output: . |
for do
|
end for
for do
for all do
end for
end for
for all do
:
end for
for do
end for
the mean vector is not updated |
Recalculate the centroid of each cluster:
Output cluster division , where denotes the safety or comfort classification of the current working condition.
Continuing our previous work [
20], we consulted a panel of experts in the field and classified the comprehensive evaluation indexes of landscape driving in urban tunnel sections into two grades based on the values of each biomarker index, namely “Fail” and “Pass”, and mapped them into numerical labels, denoted as 0 and 1, respectively. For landscape driving in urban tunnel sections, if four or more indexes are in the unsafe/uncomfortable condition, the comprehensive evaluation indexes are labeled as “Fail”; if three or fewer indexes are in the unsafe/uncomfortable condition, the comprehensive evaluation indexes are labeled as “Pass”. In the case of three or fewer unsafe/uncomfortable indicators, the tunnel is considered safe and comfortable based on the minimum evaluation standard. Therefore, the semi-supervised K-means clustering is used for safety and comfort classification, i.e., classifying them as safe or unsafe and comfortable or uncomfortable.
Experimental Conditions
To isolate and examine the impact of specific landscape elements on driving safety, comfort, and aesthetics, a methodology that focused solely on individual landscape element simulation tests was adopted. This approach aimed to mitigate the influence of extraneous factors and enhance the understanding and predictability of the impact of each element. Within the context of the urban tunnel environment, each test was designed to highlight a single landscape element while maintaining the other three elements in a non-landscape state. This strict control allowed for a controlled investigation of the influence of distinct landscape components.
This study involved a comprehensive analysis of the design parameters pertaining to the physical volumes of various tunnel components under different operational conditions. Specifically, the physical volume of the tunnel sidewalls was determined across 25 distinct working conditions, while the roof volume was optimized for a matching set of 25 conditions. Additionally, the design considerations were extended to the tunnel pavement, which was configured for 4 operational scenarios, and pedestrian facade markings, which were tailored for 5 unique working conditions. Notably, a control group devoid of specific design interventions was also included, resulting in a total of 60 test conditions, as outlined in
Table 4.
In
Table 4, the header abbreviations ‘SFS’ denote sidewalk facade signage, with ‘w/o’ denoting ‘without’, exemplified by ‘W w/o P’, which translates to white without a pattern. The abbreviations for the colors are derived from the initial letters of the respective colors. The specific sidewall patterns identified in this study—stippled, dot, line, and complex—are abbreviated as ‘S’, ‘D’, ‘L’, and ‘C’, respectively, with ‘P’ indicating pattern and ‘B’ indicating background. For instance, ‘BDP o WB’ represents a blue dot pattern on a white background, with similar conventions applied to other combinations.
A comprehensive analysis of the landscape elements of the tunnel roof, tunnel sidewalls, tunnel pavement, and tunnel sidewalk facade signs shows that the influencing factors affecting the main constituent elements of the tunnel body section are concentrated in 2 aspects: color and pattern. In terms of color design, it focuses on unity and contrast to improve the driver’s visual recognition ability; in terms of pattern, it focuses on priority, proportion, and unity; and in terms of the frequency of pattern appearance, it focuses on rhythmicity. as outlined in
Table 5.
Following the first semi-supervised clustering, the optimal design configuration was identified among the various factors evaluated. Consequently, these specific factors were chosen as variables for experimentation in this study. Four factors were designated for the investigation, including tunnel sidewalls, tunnel roofs, tunnel pavements, and sidewalk facade markings. Each factor was further divided into three distinct levels for the purpose of this study, as outlined in detail in
Table 6.
The test was a 4-factor, 3-level test, not considering interactions, where the 4 factors were represented by a total of 4 columns. The orthogonal table utilized in this experiment was deemed the most appropriate. Nine sets of internal test protocols were employed, and the detailed test protocol is presented in
Table 7.
In this paper, 1800 sets of “physiological + eye movement” features generated from 30 drivers under 60 working conditions were extracted. After normalization, the first semi-supervised clustering was performed to identify four types of univariate factors, each at three levels. Subsequently, orthogonal experiments were conducted to determine the combinations of multivariate working conditions. Lastly, the second semi-supervised clustering was performed to select the combination of landscape elements of the urban tunnel sections that are both safe and comfortable.
6. Conclusions
In conclusion, this study addresses a significant research gap in the industry by quantitatively analyzing the rationality behind the design of landscape elements in urban tunnel cavernous sections. By investigating the influence of different combinations of landscape elements on driving safety and comfort, we propose an innovative methodology for evaluating the design of these elements in urban tunnel cavern segments. Our approach, based on the concept of biomass perception, provides a systematic framework for assessing the impact of landscape design on the overall driving experience in urban tunnel environments.
This study examines how landscape designs influence safety and comfort in urban tunnels, revealing that optimal solutions require holistic consideration and that patterned designs are best suited for tunnel walls and ceilings, not for road surfaces.
This study employs simulated driving and K-means semi-supervised clustering to assess how variations in urban tunnel landscape elements impact driving, using driver biomass as a holistic indicator. The findings indicate that biomass-based assessments can accurately reflect driver states, offering insights into the impact of landscape designs on safety and comfort through machine learning.
This study offers valuable theoretical insights for researchers who use biomass to explore the landscape design of urban tunnel cavities, thereby providing a solid foundation for designers involved in tunnel cavity landscape design.
Although efforts were made in this paper to quantitatively analyze the design of landscape elements in urban tunnel cavern segments, there are still some shortcomings:
Firstly, the limited data collection and sample size pose a challenge. This study only incorporated data from a relatively small sample of 30 subject drivers. Considering the individual differences and diverse preferences among the drivers, the small sample size may have hindered the generalizability and reliability of the results. To obtain more accurate assessments of the impact of landscape element design on urban tunnel cavern segments, it is necessary to expand the sample size. Secondly, the study has limitations in terms of considerations. While focusing on factors like biomass perception and driver safety and comfort, other variables, such as traffic flow and road conditions, also influence the design of landscape elements in urban tunnel cavern segments. Failing to adequately address these factors may restrict a comprehensive evaluation of landscape element design in such settings. Furthermore, the generalizability of the proposed evaluation method system based on biomass perception needs further verification. Drivers’ perceptions and evaluations of landscape elements may differ across regions and cultural contexts. Hence, it is crucial to conduct cross-regional and cross-cultural studies to validate the applicability of this method in varying contexts.
For future research, we can consider recruiting more participants and ensuring that they have diversity in gender, height, age, fatigue level, and driving experience. This will provide a more comprehensive understanding of the differences in tunnel driving safety and comfort among different groups of people. In addition, we can consider introducing other factors, such as tunnel type, width, roof height, vehicle type, etc., to further study the impact of these factors on tunnel driving.


