Article

Enhancing DDBMS Performance through RFO-SVM Optimized Data Fragmentation: A Strategic Approach to Machine Learning Enhanced Systems

1
Department of Information Technology and Management Systems, Faculty of Business Administration, Al Maaref University, Beirut 5078/25, Lebanon
2
Faculty of Engineering, Islamic University of Lebanon, Lebanon, Khalde 30014, Lebanon
3
College of Engineering and Technology, American University of the Middle East, Egaila 54200, Kuwait
*
Author to whom correspondence should be addressed.
Appl. Sci. 2024, 14(14), 6093; https://doi.org/10.3390/app14146093
Submission received: 11 June 2024 / Revised: 5 July 2024 / Accepted: 9 July 2024 / Published: 12 July 2024
(This article belongs to the Special Issue AI-Based Data Science and Database Systems)

Abstract

:
Effective data fragmentation is essential in enhancing the performance of distributed database management systems (DDBMS) by strategically dividing extensive databases into smaller fragments distributed across multiple nodes. This study emphasizes horizontal fragmentation and introduces an advanced machine learning algorithm, Red Fox Optimization-based Support Vector Machine (RFO-SVM), designed for optimizing the data fragmentation process. The input database undergoes meticulous pre-processing to address missing data concerns, followed by analysis through RFO-SVM. This algorithm efficiently classifies features and target labels based on class labels. The RFO algorithm optimizes critical SVM parameters, including the kernel, kernel parameter, and boundary parameter, leveraging the accuracy metric. The resulting classified data serves as fragments for the fragmentation process. To ensure precision in fragmentation, a Genetic Algorithm (GA) allocates these fragments to diverse nodes within the DDBMS, optimizing the total allocation cost as the fitness function. The proposed model, implemented in Python, significantly contributes to the efficient fragmentation and allocation of databases in distributed systems, thereby enhancing overall performance and scalability.

1. Introduction

1.1. Context

In the contemporary landscape of data management, the advent of distributed database management systems (DDBMS) has played a pivotal role in addressing the growing demands of data storage, retrieval, and processing [1,2]. Unlike centralized databases, DDBMS distributes data across multiple nodes, fostering parallelism and scalability. One of the critical techniques employed within DDBMS is data fragmentation, which involves dividing a large database into smaller fragments that are stored across different nodes in the distributed environment. This fragmentation enhances efficiency, facilitates parallel processing, and optimizes query performance. To delve into the nuances of data fragmentation, this study navigates through the existing methodologies and introduces a novel approach incorporating machine learning for improved optimization.

1.2. Challenges

The significance of data fragmentation in DDBMS cannot be overstated. It is a strategic mechanism to enhance the performance and efficiency of distributed systems by breaking down large databases into more manageable fragments. This process brings about several advantages, including improved query response times, increased throughput, and scalability. By distributing data across multiple nodes, the workload is shared, minimizing the bottlenecks often associated with centralized databases. Effective data fragmentation is crucial for meeting the requirements of modern applications and services that deal with massive datasets. As data continues to grow exponentially, the ability to efficiently manage and access distributed data becomes paramount, making the study of data fragmentation techniques a focal point in the realm of DDBMS [3].

1.3. Motivation

The motivation for undertaking this study stems from the evolving landscape of data management challenges in distributed environments. As organizations increasingly rely on DDBMS to handle vast amounts of data, optimizing the performance of these systems becomes imperative. Traditional data fragmentation techniques have paved the way, but the ever-expanding size and complexity of datasets necessitate innovative solutions. The motivation lies in harnessing the power of machine learning, specifically the Red Fox Optimization-based Support Vector Machine (RFO-SVM), to augment the efficiency of data fragmentation. The Red Fox Optimization (RFO) algorithm, inspired by the hunting and foraging behaviors of red foxes, efficiently explores and exploits the search space to find optimal solutions [4]. This algorithm is combined with the Support Vector Machine (SVM) to enhance the data fragmentation process in DDBMS. The integration of advanced algorithms aims to address the limitations of conventional approaches, offering a more optimized and adaptive methodology. By exploring the synergy between machine learning and data fragmentation, this study aspires to contribute novel insights, methodologies, and solutions to the evolving landscape of distributed database management.

1.4. Problem Definition

The intricate challenges posed by data fragmentation in distributed database management systems (DDBMS) necessitate a comprehensive problem definition. The primary objective is to effectively partition a substantial database into smaller fragments, strategically distributing them across diverse nodes in a network. This fragmentation aims at elevating the overall performance, efficiency, and resource utilization within distributed systems. The crux of the problem lies in determining an optimal fragmentation scheme that maximizes the advantages of data distribution while mitigating potential drawbacks. The quest is to formulate a partitioning strategy that not only facilitates seamless data retrieval and query processing but also minimizes data transfer and communication costs. Achieving a delicate balance in resource utilization across the network is paramount. In essence, the problem definition centres on orchestrating a fragmentation scheme that transcends the conventional, ensuring enhanced management and utilization of distributed data resources. The overarching goal is to offer profound insights and innovative solutions that propel the evolution of distributed database management practices.

1.5. Contributions

The aim of this work is to develop a data fragmentation model using the Red Fox Optimization-based Support Vector Machine (RFO-SVM) algorithm. The goal is to address the limitations and challenges of data fragmentation in DDBMS and provide an optimized solution for horizontal fragmentation. The primary contributions of this paper include the following:
The development of an innovative data fragmentation model that integrates the Red Fox Optimization with Support Vector Machine (RFO-SVM) to optimize horizontal fragmentation in distributed database management systems (DDBMS).
Enhanced data preprocessing techniques that ensure high data quality and effective handling of missing data.
Advanced classification methods using optimized SVM parameters to accurately identify data fragments.
Effective allocation of classified data fragments to various nodes using a Genetic Algorithm (GA), optimizing total allocation cost.

2. Literature Review

Data fragmentation has received a lot of attention from researchers and experts recently. This is mainly due to the huge amount of data being collected, stored, and processed in private and public organizations. In this section, we divide the existing data fragmentation techniques into two main categories: machine learning-based and partitioning-based techniques.

2.1. Machine Learning-Based Techniques

Machine learning models have been widely adapted in recent years to overcome various challenges related to data fragmentation. Such an approach takes the benefits of clustering, heuristic, and correlation algorithms to analyze databases and enhance the performance of their processing.
The authors of ref. [5] proposed a clustering-based fragmentation technique where table attributes with similarity are placed in the same fragment cluster to improve the efficiency and effectiveness of vertical fragmentation in DDBMS. This technique aimed to create more significant and efficient vertical fragments by considering the frequency of user queries and Euclidean distances between attributes. However, heuristic solutions may not always guarantee optimal results and could potentially introduce suboptimal fragmentation or allocation decisions.
The authors of ref. [6] presented a random forest algorithm for feature selection to remove irrelevant or correlated attributes from the dataset. The method aimed to improve query processing time by reducing the attribute size and creating more efficient fragments. It effectively decreases the size of high-dimensional data by reducing the data dimensions without losing the related data. However, there are concerns regarding the system’s ability to scale and adapt effectively.
The authors of ref. [7] introduced a heuristic k-means approach for vertical fragmentation and allocation to address the challenges of communication costs and response time in DDBS. The proposed approach combines multiple techniques to create a promising solution and aims to achieve optimal vertical fragmentation and allocation by employing a heuristic k-means approach. The obtained results demonstrate its potential for improving DDBS performance. However, the process is time consuming and leads to complexity issues.
The authors of ref. [8] proposed a Cluster-based Distributed and Parallel Database System (CB-DDBS) architecture for improving the performance and efficiency of distributed database systems (DDBS). CB-DDBS enables clients to access the clustered DDBS from anywhere while allowing for static decisions on vertical and horizontal fragmentation, allocation, and replication at the initial stage of the design. However, the method lacks the details of the data regarding potential scalability challenges, constraints in handling large-scale databases, and trade-offs between performance and resource utilization.
The authors of ref. [9] proposed a heuristic clustering-based approach for vertical fragmentation and data allocation in order to improve the throughput of relational DDBS to address the challenge of reducing transmission costs (TC) in distributed database systems (DDBS). The method combines an aggregated similarity-based fragmentation procedure, effective site clustering, and a greedy algorithm-driven data allocation model. However, the approach lacks a way to evaluate its scalability and potential trade-offs between throughput improvement and leads to increased network overhead.
The authors of ref. [10] presented an efficient set of query execution plans to achieve the optimization of complex queries in cloud computing environments. The study introduced a set of robust heuristic algorithms, including Branch-and-Bound, Genetic, Hill Climbing, and Hybrid Genetic-Hill Climbing, to find near-optimal query execution plans and maximize the benefits. However, the computational complexity of the heuristic algorithms may pose challenges when dealing with large-scale and complex query workloads. Moreover, the algorithms lack satisfactory scalability and adaptability to diverse cloud database environments.
The authors of ref. [11] proposed a combination of data fragmentation and query generalization method that enables the system to efficiently distribute and process. The method uses clustering-based fragmentation and the Anti-Instantiation operator to derive semantic fragments and support intelligent flexible query answering. However, the data replication problem is expressed as a special Bin Packing Problem that requires a standard solver for integer linear programs, potentially leading to increased computational complexity.
The authors of ref. [12] proposed a KR Rough Clustering Technique (K-Means Rough), which applies the rough set approach to knowledge mining and clustering in large datasets. The method allows objects in the dataset to belong to multiple clusters, providing a more flexible and nuanced clustering result. The method better handles datasets with diverse types of data and capture the inherent uncertainty and vagueness in the data by combining distance, similarity, and approximations. However, the method leads to increased computational complexity and time compared with traditional clustering algorithms.
The authors of ref. [13] proposed an approach for optimizing query processing in DDBS through vertical fragmentation. The method aims to achieve better results in terms of query processing optimization compared with existing methods. The authors conduct experiments and compare their solution with two alternatives: VFAR and the K-means algorithm with the hamming distance. However, the performance gains achieved by the proposed approach may vary based on the dataset and the query workload, also there lacks a method to assess the generalizability and robustness of the proposed approach.
The authors of ref. [14] developed a new model by combining vertical fragmentation, replication, and allocation techniques for DDBS. The method aims to reduce communication costs and query response times in DDBS by implementing the model and significantly enhancing the performance of distributed database environments. However, the approach lacks an assessment of the general applicability and robustness of the proposed model in large and diverse environments.
In summary, machine learning-based techniques offer innovative solutions for data fragmentation in DDBMS, and allow us to overcome many challenges related to the efficiency of query processing, communication costs, response times, and replication problems. However, the existing techniques based on a machine learning (ML) approach suffer from several drawbacks: (1) Data quality, where the severe lack of values inside the dataset could highly affect the training phase of the ML models. In addition, applying traditional methods of handling missing data does not ensure an improvement of data quality. (2) Model parameter adaptation, where most of the proposed techniques consider default parameter values or, in the best case, a hyper-parameter process is applied. Unfortunately, without proposing new methods for parameter optimization, the existing technique will not guarantee high accuracy. (3) Complexity, especially when ML models are combined with heuristic algorithms. Therefore, designing less complex and highly accurate techniques is becoming essential for data fragmentation.

2.2. Partitioning-Based Techniques

In database systems, the size of the stored data may reach a huge size, which makes the partitioning process a fundamental operation in such systems. The aim of such an operation is to divide the database either horizontally or vertically thus enhancing the performance of the query processing.
The authors of ref. [15] presented a novel relative-based fragmentation method that analyses the attributes of the data within a relative architecture to improve query performance by enhancing speed and accuracy. The method aims to enhance query performance in distributed systems by utilizing a novel relative-based fragmentation approach and to improve the speed and accuracy of data retrieval. Although it achieved relevance, the proposed method caused increased computational overhead and was not suitable for diverse environments.
The authors of ref. [16] presented an enhanced dynamic distributed database system designed for a cloud environment that enables dynamic decision-making for fragmentation, allocation, and replication at runtime, allowing for flexibility and adaptability. The method allows the enhancement of the functionality and performance of distributed database systems in a cloud environment by enabling runtime decisions for fragmentation, allocation, and replication. However, the scalability issues or the impact of dynamic decisions on overall system performance were not mentioned and the flexibility of the system is uncertain.
The authors of ref. [17] proposed a decision support system for record clustering in distributed databases by combining genetic network programming (GNP) and standard dynamic programming to solve the knapsack problem (KP) that was related to fragment allocation with storage capacity limitations in distributed databases. Additionally, a partial random rule extraction method was introduced within GNP to discover frequent patterns in the database. However, the computational complexities of the method, particularly with large-scale databases that require further optimization for practical implementation.
The authors of ref. [18] proposed a proactive framework called PROADAPT (proactive framework for adaptive partitioning) to address the challenge of workload changes in big data warehouses. DBMSs are quickly stressed by workload changes, especially in business analytics applications; therefore, they introduced an AI-inspired methodology that utilizes a Genetic Algorithm within their PROADAPT framework. The method provides high performance for dynamic workloads by considering the interaction among workload queries. However, the scalability and applicability of PROADAPT to different big data warehouse environments fails to ensure its practicality and effectiveness in real-world scenarios.
The authors of ref. [19] developed class fragmentation and allocation techniques in distributed object-oriented database systems to improve their performance by reducing unnecessary data access and minimizing the cost of data transmission. The method involves splitting a class into smaller pieces in distributed databases, while allocating the fragmented classes into sites within a connected network. The proposed algorithm shows more efficient and effective distribution of classes across sites, resulting in improved performance of the distributed object-oriented database system. However, the method poses increased computational complexity and overhead.
The authors of ref. [20] proposed a simple greedy algorithm that aims to optimize the total transmission cost of site-fragment dependencies and inner-fragment dependencies to address and optimize the allocation of data fragments to sites in order to minimize execution time and the transaction costs of queries. The algorithm determines the best allocation strategy to minimize costs by considering these strategies. However, the greedy algorithm may not always guarantee finding the globally optimal solution.
The authors of ref. [21] proposed a multi-segment greedy rewriting method (MGRM) to address the issue of data fragmentation in data deduplication systems used in the cloud. MGRM is designed to search and rewrite containers collectively across multiple segments, then sequentially sorts containers in each segment. MGRM has two working modes: an optimal rewriting mode and a radical rewriting mode. The method achieves a balance between deduplication ratios and restore performance. However, it fails to assess the scalability of MGRM in different cloud environments and under varying workloads.
The authors of ref. [22] presented a novel approach for optimizing web telemedicine database systems in large-scale networks to address the challenges of data centralization and secure access to patient data from remote locations. An Integrated Fragmentation Clustering Assignment approach was developed that considers the scalability of the system. The approach focuses on large-scale networks with a significant number of sites, providing more efficient data redistribution and improved performance for the telemedicine database system. However, the effectiveness of the proposed approach fails to describe the implementation and scalability of real-world healthcare environments.
The authors of ref. [23] presented a study on the design of a distributed RDF (Resource Description Framework) database system to efficiently manage the growing volumes of RDF data. A novel approach that adapts frequent access patterns (FAPs) to capture the characteristics of the workload was proposed while ensuring data integrity and an approximation ratio. Based on these FAPs, three fragmentation strategies were introduced: vertical, horizontal, and mixed fragmentation. The approach reduces communication costs during query processing by leveraging adaptive frequent access patterns and tailored fragmentation strategies. However, it is crucial in handling even larger volumes of RDF data.
In conclusion, partitioning-based techniques provide practical solutions for efficient data management in distributed systems. However, further efforts are needed to address some drawbacks in current techniques, especially in the following: (1) Scalability; most of the existing techniques have demonstrated their efficiency based on a specific dataset without taking into consideration diverse database environments. (2) Stability; the existing techniques did not show fixed performances when the volume of data changed dynamically over time. Hence, developing new data fragmentation techniques that take both challenges, e.g., scalability and stability, into consideration is essential for efficiency improvement.

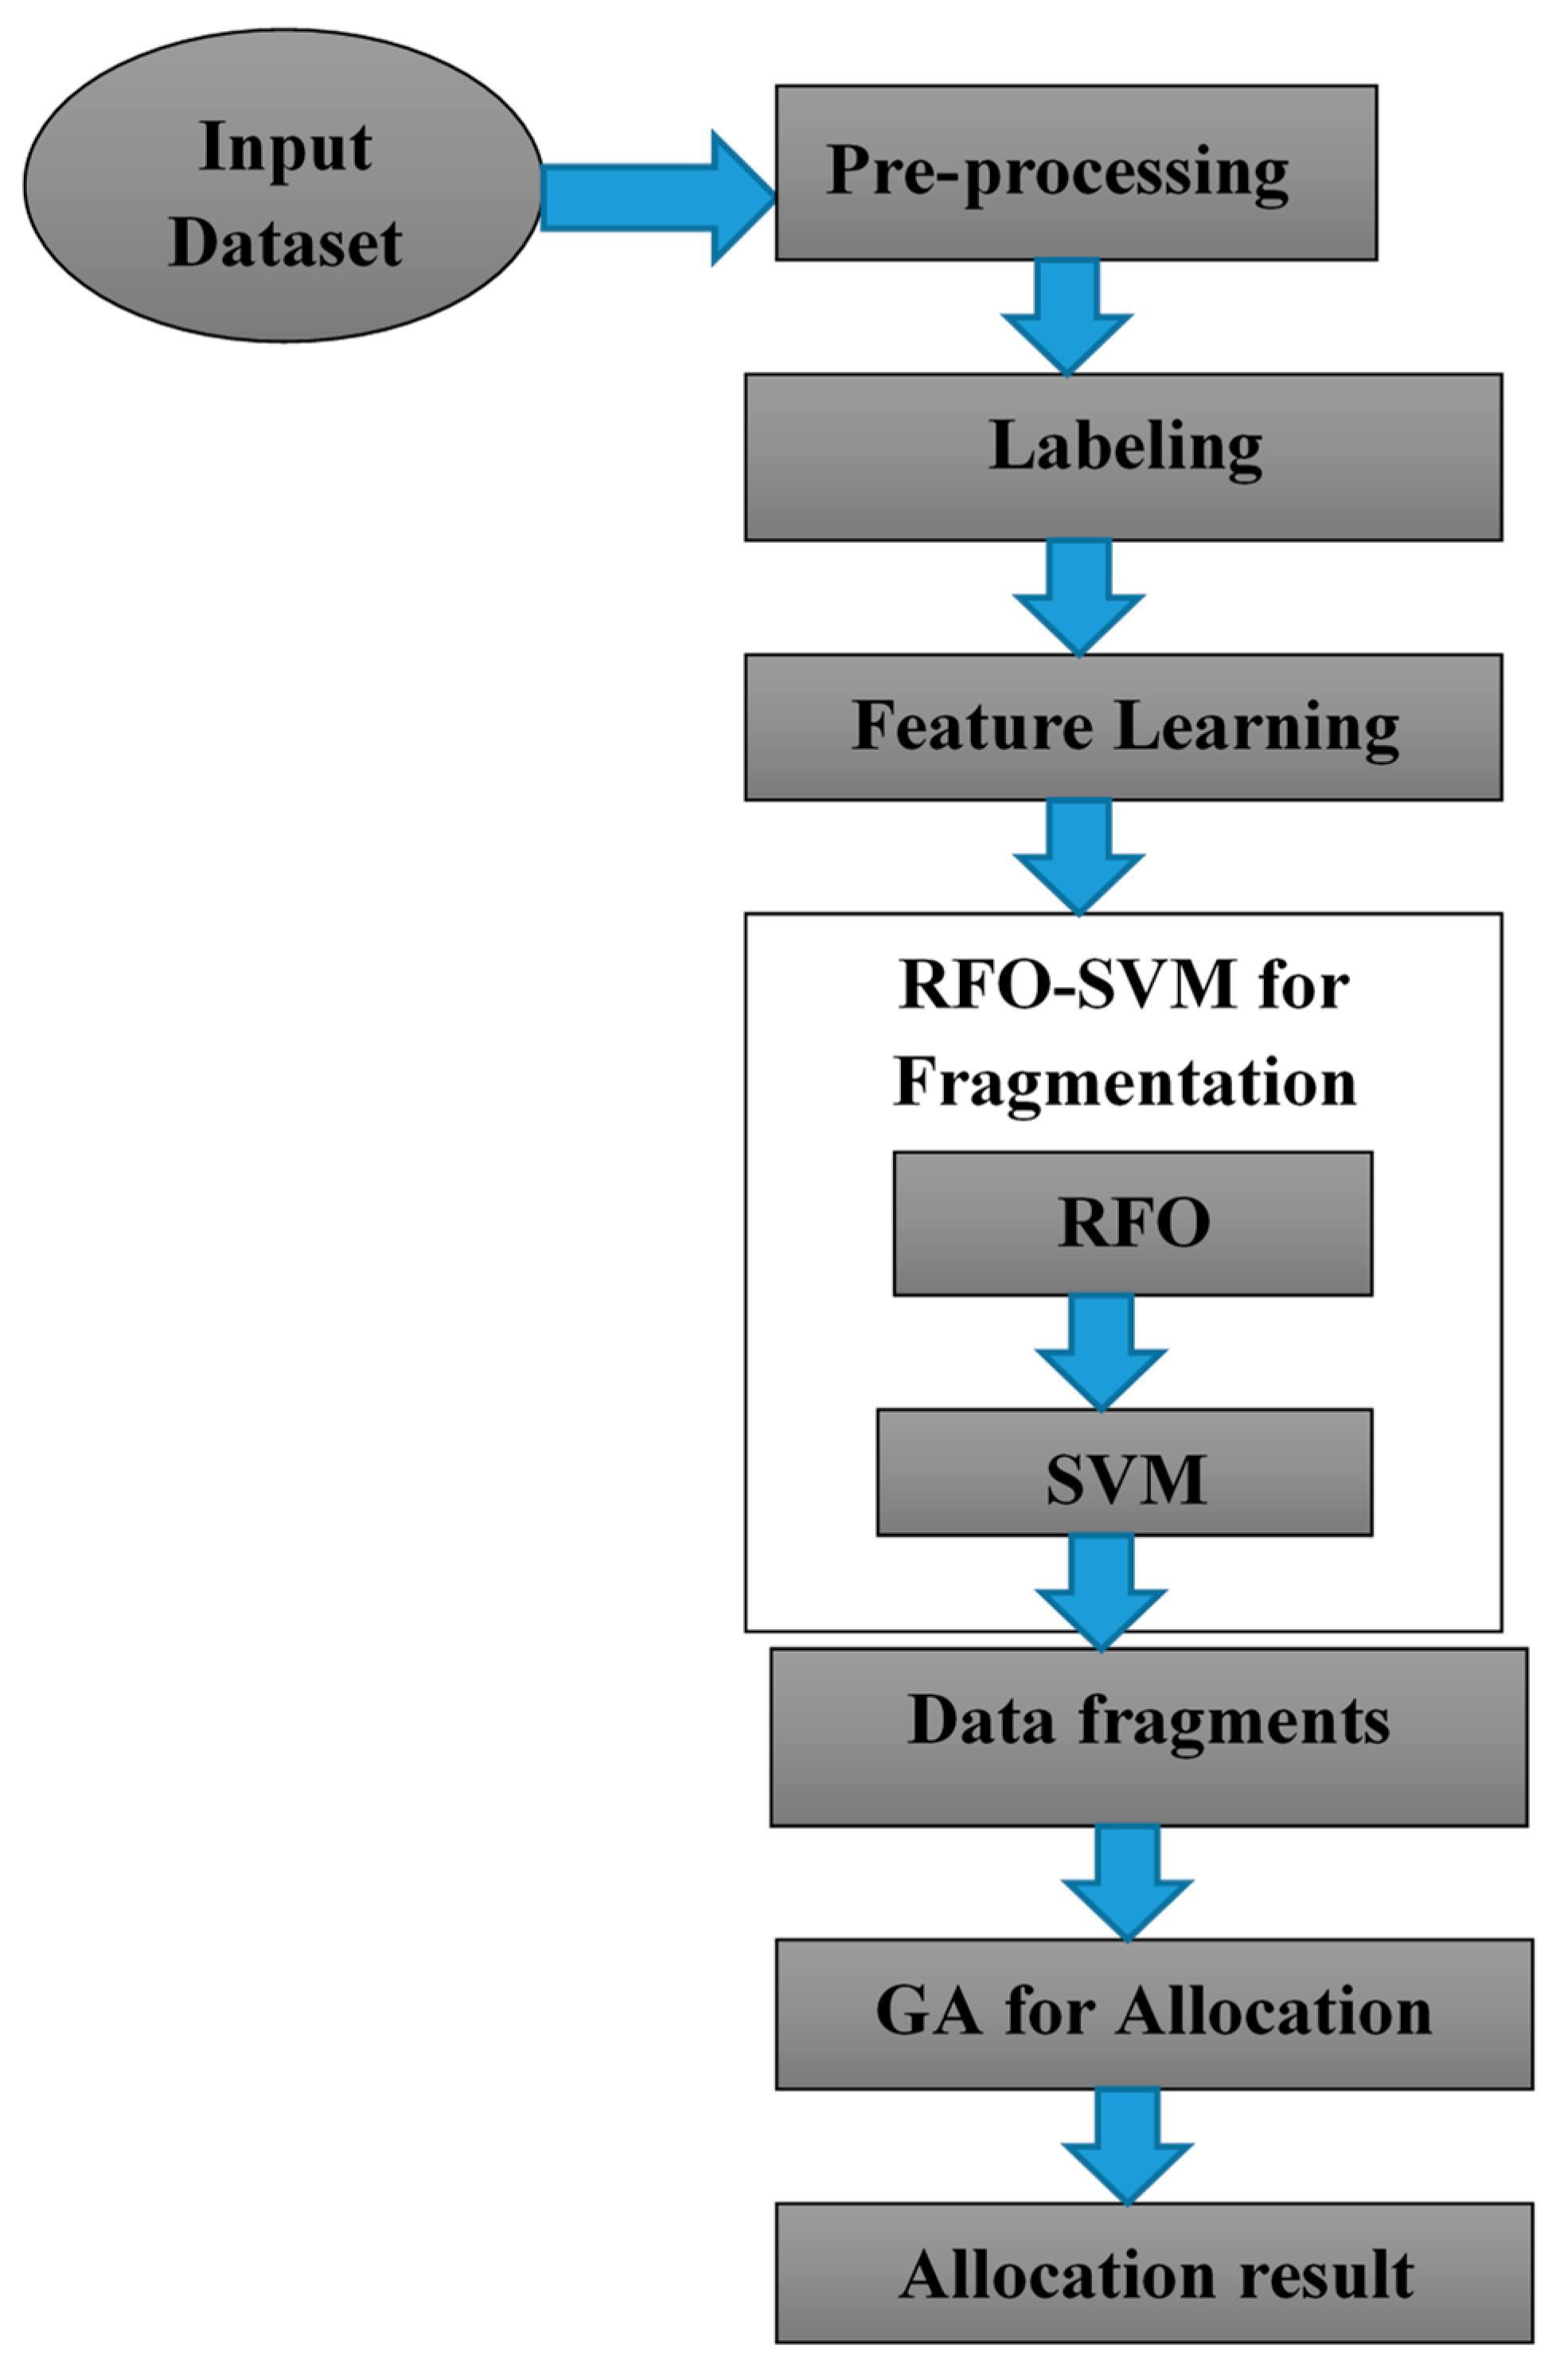
3. Proposed Methodology

The data fragmentation problem is dividing a dataset into smaller subsets or fragments without losing the data integrity and access that arises in various domains where large datasets are processing efficiently or distributing across different computing resources. To address this problem, an optimized machine learning algorithm called Red Fox Optimization-based Support Vector Machine (RFO-SVM) has been proposed. The RFO-SVM algorithm combines the principles of Red Fox Optimization (RFO) and Support Vector Machines (SVM) to perform horizontal fragmentation. Figure 1 shows the workflow of RFO-SVM where the description of each phase will be detailed in the next subsection.

3.1. Optimization-Based Machine Learning Algorithms

Optimization-based machine learning (ML) algorithms are applied to data fragmentation problem in DDBMS to find an optimal fragmentation scheme that maximizes the efficiency of fragmentation while satisfying the constraints. Optimization in data fragmentation mainly aims to consider objectives like minimizing communication costs, maximizing query performance, or reducing data transfer, and to overcome the constraints like preserving functional dependencies and referential integrity constraints to maintain data consistency and accuracy. Communication overhead should be minimized to ensure efficient data exchange between nodes. The processing capabilities and resources of each node are also considered for optimization to ensure balanced data distribution and workload allocation. Load balancing constraints ensure that no single node is overwhelmed with excessive data or queries. It mainly aims to minimize the access to the number of fragments, reducing query response time and improving overall system performance.

3.2. Support Vector Machine Algorithm

Support Vector Machines (SVMs) are supervised machine learning algorithms that are commonly used for classification and regression tasks. The primary goal of SVMs is to find a hyperplane that separates different classes or predicts a continuous output based on input patterns [24]. One key aspect of SVMs is the use of kernel function that allows the algorithm to map the input patterns into a higher dimensional feature space. SVMs effectively perform linear separation by transforming the data into a higher dimensional space even when the original input data may not be linearly separable. The selection of kernel function depends on the characteristics of the data and the related problem [25]. The kernel parameters like width or the degree of polynomial are also carefully selected. Let the input patterns be A x , B x i = 1 P with A x R N and B x { 1 , + 1 } . The inputs are initially estimated onto a high-dimensional space β by nonlinear estimate ξ that inner attributes between estimated vectors are computed by kernel function k A x , A y = ξ ( A x ) T   ξ ( A y ) T . The maximal margin linear classifier in β ,   f ( A ) = s i n   ( T ξ A + ϑ ) where and ϑ are the solution to
min , ϑ ω x   1 2   T + Z x = 1 D ω x
related to
B x T ξ A + ϑ 1 + ω x 0           x = 1 , . . D
The positive slack variables to deal with non-separable problems is denoted by ω_x. The penalty of patterns incorrectly classified or inside the margin is denoted as Z.
Where SVM is the configured algorithm, ∅ is the search space of the possible SVM configurations (Z, kernel type, and kernel parameters), δ is the distribution of the set of instances, Fc is the cost function, and φis the statistical data to minimize the cost function FC to obtain the solution sets over a set of problem instances to find
θ arg min θ 1 | δ | . π δ F C ( θ , π )
for each θ∈∅ denotes single possible configuration of the SVM and the output FC is obtained by testing SVM across many instances. The main function of the SVM is to find θ∈∅ and to optimize the cost function.

3.3. Optimization of Support Vector Machine

The position and orientation of the separating hyperplane influence the optimization problems that greatly influence the computation of the threshold and the classification of test and validation data and unknown data points. In the optimization phase, θ∈∅ is an important attribute to balance between margin maximization and error toleration. A large value of θ leads to the least training errors while small values produce a larger margin, leading to more errors and more training points placed inside the margin. From this, it is not possible to select a suitable parameter value since the number of training errors cannot be interpreted as an estimate for the absolute problem formulation. Since we consider unbalanced data, it is sensible to weigh incorrect categorizations of positive and negative points differently to obtain sensitive hyperplanes, thus, replacing the single parameter θ with two values:
θ x = θ + i f   B x = 1 ,           θ   o t h e r w i s e x = 1 , . . l
Likewise, the standard kernel of single parameter Z does not consider different feature scaling, thus it needs to be replaced with a multi-parameter Gaussian kernel.
K G   ( A x , A y ) = exp k = 1 n ( A x k , A y k ) 2 2 θ k 2
The learning parameters are also kernel parameters and should be selected carefully to obtain a good classifier. The selection of appropriate learning parameters is a crucial step in obtaining well-tuned Support Vector Machines (SVMs) as this controls the behavior and performance of the SVM model. Grid search is used to find the appropriate parameter, where a finite number of possible parameter values are predefined, and all combinations of these values are evaluated to find the best-performing combination. However, the complexity of grid search grows exponentially with the number of parameters, limiting its practicality when dealing with a large number of parameters. These parameters are fine-tuned using numerical optimizer to define an objective function, a so-called quality measure to evaluate cross validation results, and are defined as П:P→∅ for parameter vectors p in the parameter space P. It introduces a fitness relation:
p i > p j П p i > П p j
p i ~ p j П p i = П p j
for all pi,pj∈P and this is used in to ensure the good selection of parameter values. The percentage of simplest quality measures is validated for errors d and the error count measure is only the l + 1 discrete values 0, 1/l,..., 1. Good generalization abilities are required for SVM model in classification function that determines the data that was used during the training. The unbalanced datasets of cost for a false negative classification is significantly higher than for a false positive. Then F-measure
F = 2 . p r . s e p r + s e [ 0 , 1 ]
Weighting between sensitivity is denoted by single measure defined as s e and precision p r , i.e.,
s e = t p p 0 ,   1   &   p r = t p t p + f p 0 ,   1
where, for validation of test set of p ,   t p ,   a n d   f p , denote the number of positive, true positive, and false positive points, respectively. Suppose se = 0 and pr = 0 is defined as F to be zero. Ideally, the F-measure shall be close or equal to 1.

3.4. RED FOX Optimization

Meta-heuristic algorithms are a class of computational methods that are designed to solve complex problems where the solution space is not well-defined or described, and this problem requires the exploration of complex mathematical models representing various phenomena in life. It provides a powerful approach to tackle problems by using heuristic search strategies. The red fox algorithm was developed based on the habits of red foxes: searching for food, developing population while escaping from hunters, and hunting. It is mainly based on reproduction methods to explore global and local search optimization. Due to the high accuracy, rapid optimization, and low computational complexity, meta-heuristic techniques have proven effective for various optimization tasks. When tackling difficult problems where the solution space is not necessarily fully specified, several techniques have proven useful. The algorithm consists of two phases; the first phase is based on exploration of territories in food search: the fox spots the prey in the distance and this search is modeled as global search. The second phase is based on the habitat for attacking prey by getting as close as possible and is described as local search.
The algorithm is formulated by individual populations of foxes in constant numbers and each is represented as R F ¯ = ( R F 0 , R F 1 , . , R F x 1 ) of x coordinates. Each fox is differentiated R F ¯ i in iteration t, and denoted as R F ¯ j i t , where j represents coordinate according to dimensions of the solution space and i is the number of the fox in the population. Let us assume the foxes move in the solution space by the derivation below in search of optimum values for the criterion function f     Ψ x of x variables regarding the search solution dimensions and for each point of space is denoted by R F ¯ ( i ) = R F 0 i ,   R F 1 i , ,   R F x 1 i for p , q x , where p , q Ψ . Then, the optimal solution is R F ¯ ( i ) , if function f ( R F ) ¯ i is a global minimum or maximum value for p , q .

3.4.1. Global Search for Food

Each fox plays an important role in a herd for survival of the family; in a situation when the local habitat lacks sufficient food, or when the herd requires exploring new territories, it migrates to remote destinations. The exploration is shared with the herd for survival and development. The exploration model is based on the fitness of all individuals to explore the best survival land and sharing this information with the herd. The population is sorted according to the fitness condition and for R F ¯ b e s t t , the square of the Euclidean distance to each individual in the population is calculated as
R F ¯ i t , R F ¯ b e s t t = R F ¯ i t R F ¯ b e s t t
and the population of the individual moved towards the best one
R F ¯ i t = R F ¯ b e s t t + α s i g n ( R F ¯ b e s t t R F ¯ i t
The random scaling hyper parameter is set once for all individuals in the population and is denoted by α [ 0 , ( ( R F ¯ i ) t , ( R F ¯ b e s t ) t ) ] . The individuals in a group move towards a better location to assess the fitness values of the new positions. If these new positions provide improved fitness, they decide to stay and if the fitness values are not better, they return to their previous positions. This behavior is similar to how family members explore new areas and then guide others in the group to those locations for hunting. Foxes lack knowledge of suitable hiding places or escape routes in distant or unfamiliar territories, rendering it vulnerable to danger. Consequently, the algorithm incorporates a method to address this vulnerability by either eliminating the least fit individuals in the population through a simulated killing process or rewarding the best individuals by allowing them to reproduce. These measures aim to optimize the overall population by removing weaker individuals or encouraging the propagation of stronger ones.

3.4.2. Local Search Phase—Navigating within the Local Environment

The fox navigates its herd in potential search of prey; on spotting the prey, it starts to approach quietly and get as close as possible without gaining attention. It tries to convince the prey it is not interested in hunting. However, it moves closer and faster to surprisingly attack the prey. This is the motivation to model its observation and movement to cheat prey while hunting into a local search phase. A random value is set for the iteration for all individuals in the population based on the possibility of a fox being noticed while approaching closer to the prey and μ 0 , 1 is formulated as
M o v e   C l o s e r   i f   μ > 0.75 S t a y   a n d   D i s g u i s e   i f   μ 0.75
A modified Cochleoid equation is used to visualize the movement of each individual, if μ shows the population migration to this iteration. Two parameters are used to represent the movement of fox observation radius and α 0 , 0.2 are scaling parameters set once in the iteration for all individuals in the population for distance change in prey during the fox’s approach; the fox observation angle is denoted as 0   0 , 2 π and is selected for all individuals. The vision radius of the hunting fox is defined using the equation:
r = a     θ sin 0   0     i f   0   0     i f   0   = 0  
The influence of adverse weather conditions such as fog, rain, etc., are interpreted at the initializing stage of the algorithm and is set with a random value θ between 0 and 1. For spatial coordinates, the model is formulated based on the movements of the population of individuals as given by
R F 0 n e w = α r . cos 1 + R F 0 a c t u a l   R F 1 n e w = a r . sin 1 + α r . cos 2 + R F 1 a c t u a l   R F 2 n e w = a r . sin 1 + a r . sin 2 + α r . cos 3 + R F 2 a c t u a l     ,   R F x 2 n e w = a r . k = 1 x 2 s i n k + α r . cos x 1 + R F x 2 a c t u a l   R F x 1 n e w = a r . sin 1 + a r . sin ( 2 ) + + a r . sin x 1 + R F x 1 a c t u a l
Each point for each angular value is randomized according to 1 ,   2 , x 1 0 , 2 . This model describes the behaviour of a fox when it detects potential prey and attempts to get as close as possible for an attack; on failure, it then tries to approach other prey in a similar manner. In the RFO algorithm, this behaviour is represented as a local search phase (Algorithm 1).
Algorithm 1 Red Fox Optimization Algorithm
Input: fitness function f(⋅), search space size 〈p, q〉, number of iterations T, maximum population size x, fox observation angle ϕ 0 , weather conditions θ
Start
Generate population consisting of x foxes at random within search space
t: = 0
While tT do
Define coefficients for iteration: fox approaching change a, scaling parameter α
For each fox in current population do
Sort individuals according to the fitness function
Select R F ¯ b e s t t
Calculate reallocation of individuals according to Equation (11)
If reallocation is better than the previous position then
Move the fox
else
Return the fox to the previous position
End If
Choose parameter μ value to define noticing the hunting fox
If fox is not noticed then
Calculate fox observation radius r according to Equation (12)
Calculate reallocation according to Equation (13)
else
Fox stays at his position to disguise
End If
End For
Sort population according to the fitness function
Worst foxes leave the herd or get killed by hunters
New foxes are replaced in the population using Equation (17) as a nomadic fox ou-
side the habitat or reproduced from the alpha couple inside the herd Equation (18)
t: = t + 1
End While
Return the fittest fox R F ¯ b e s t t
Stop

3.4.3. Reproduction and Leaving the Herd

The red fox faces various dangers in nature, including a lack of food in its local habitat and the threat of being hunted by humans if it causes significant damage to domestic animal populations. However, not all foxes die or migrate in response to these challenges. Many foxes are intelligent enough to escape and reproduce, ensuring the survival and expansion of fox herds. To simulate this behavior in each iteration of the algorithm, 5% of the worst-performing individuals are selected in the fox population based on a specific criterion as they migrate to another location or are eliminated by hunters since they are less fit. To maintain a constant population size, these individuals are replaced with new ones using a model established by the alpha couple, which determines the habitat territory. This process helps simulate the dynamics of foxes’ reproduction and movement within their environment. In RFO algorithm, two best individuals R F ¯ ( 1 ) t and R F ¯ ( 2 ) t are selected for each iteration t to represent the alpha couple; for which, the center of habitat is computed as
h a b i t a t ( c e n t e r ) t = R F ¯ ( 1 ) t + R F ¯ ( 2 ) t 2
The square of the Euclidean distance between the habitat alpha couple is formulated as
h a b i t a t ( d i a m e t e r ) t = ( R F ¯ 1 ) t ( R F ¯ ( 2 ) ) t
A random parameter η 0 , 1 is taken for each iteration that defines the replacements according to
N e w   n o m a d i c   i n d i v i d u a l   i f   η 0.45   A l p h a   c o u p l e   r e p r o d u c t i o n   i f   η < 0.45    
In the first scenario, new family members act as nomadic foxes and venture beyond their habitat to find food and potential mates within their herd. The positions are randomly selected outside the known habitat area to represent the search space. In the second scenario, new individuals are assumed to come from the alpha couple and two best individuals R F ¯ 1 t a n d   R F ¯ ( 2 ) t are reproduced and combined in a new individual R F ¯ r e p r o d u c e d t as
R F ¯ r e p r o d u c e d t = η R F ¯ 1 t + R F ¯ ( 2 ) t 2

3.5. RFO-SVM

The RFO-SVM algorithm offers several advantages for data processing efficiency, scalability, improved performance, enhanced accuracy, flexibility, and optimized resource utilization. RFO-SVM enables parallel processing, distributing the computational load across multiple resources and reducing processing time by horizontally fragmenting large datasets. The RFO-SVM is applied to an input database after pre-processing to ensure data completeness and to analyse the features and target labels of the database, classifying them based on their respective class labels. The parameters are optimally selected like the kernel, and boundary parameter values of the SVM algorithm. The selection process is performed using the RFO algorithm, which utilizes accuracy metrics to optimize the parameter values. The classified data are referred to as fragments to achieve accurate fragmentation; the fragments are allocated to different nodes within a DDBMS. This allocation is performed using a standard Genetic Algorithm (GA), with the total allocation cost serving as the fitness function to ensure effective fragmentation and allocation of the database. In the case of SVM, accuracy is considered as a trade-off between complexity (number of support vectors—NSV) and margin (M). This load balance is controlled by selecting the SVM configuration, including the choice of M, kernel type, and kernel parameters. To address this trade-off, the conflicting objectives of the optimization problem are determined as accuracy and model complexity. Model complexity is represented by the number of support vectors (NSV).
min F X = | f 1 x ,   f 2 x |
where
f 1 x = a c c r a c y
f 2 x = N S V
This equation is resolved to provide the solution for RFO-SVM configuration and this will be the main function of the proposed optimization framework.

3.5.1. RFO-SVM-Based Data Fragmentation

In the pre-processing step of the RFO-SVM algorithm, the input database is processed to remove noise data and handle missing or null values. The missing values and null values are filled with mean and median values, respectively. Subsequently, the features of the database are analyzed. Once the missing and null values are handled, the features of the database that typically involve learning the statistical properties of the features are analyzed, like distributions, central tendencies, variances, and correlations with the target label. The characteristics and variability of the features are analyzed and the relations between the features and the target label are determined. In the feature analysis step of the RFO-SVM algorithm, a subset of features is selected for processing and the feature values are denoted as x and the target values as y. Let the obtained 6 features be x 1 ,   x 2 ,   x 3 ,   x 4 ,   x 5 ,   x 6 and 1 target value be (y), which are selected for analysis. The RFO-SVM model is trained with the selected features x 1 ,   x 2 ,   x 3 ,   x 4 ,   x 5 ,   x 6 and the corresponding target values (y) are then divided into training sets, denoted as x t r a i n and y t r a i n , respectively. The training set is used to develop the SVM classifier. The RFO-SVM model combines the Red Fox Optimization (RFO) algorithm with the SVM algorithm for classification. The RFO algorithm optimizes the SVM classifier parameters, including the kernel type γ , kernel parameter κ , and boundary parameter C values to find the optimal values for these parameters that maximize the accuracy of the SVM classifier. The kernel function determines the type of decision boundary used by the SVM classifier. The kernel parameter determines the shape and flexibility of the decision boundary and the boundary parameter determines the balance between achieving a larger margin (less misclassification) and allows handling misclassification in complex or overlapping data. The RFO algorithm is used to optimize these parameters by iteratively searching for the parameter values that yield the highest accuracy metric. The accuracy metric measures the performance of the SVM classifier on the training set to ensure that the SVM classifier is trained with the most suitable parameter values for the air quality dataset. The SVM classifier is trained with the optimized parameters and is used to classify new, unseen data based on the learned decision boundaries.

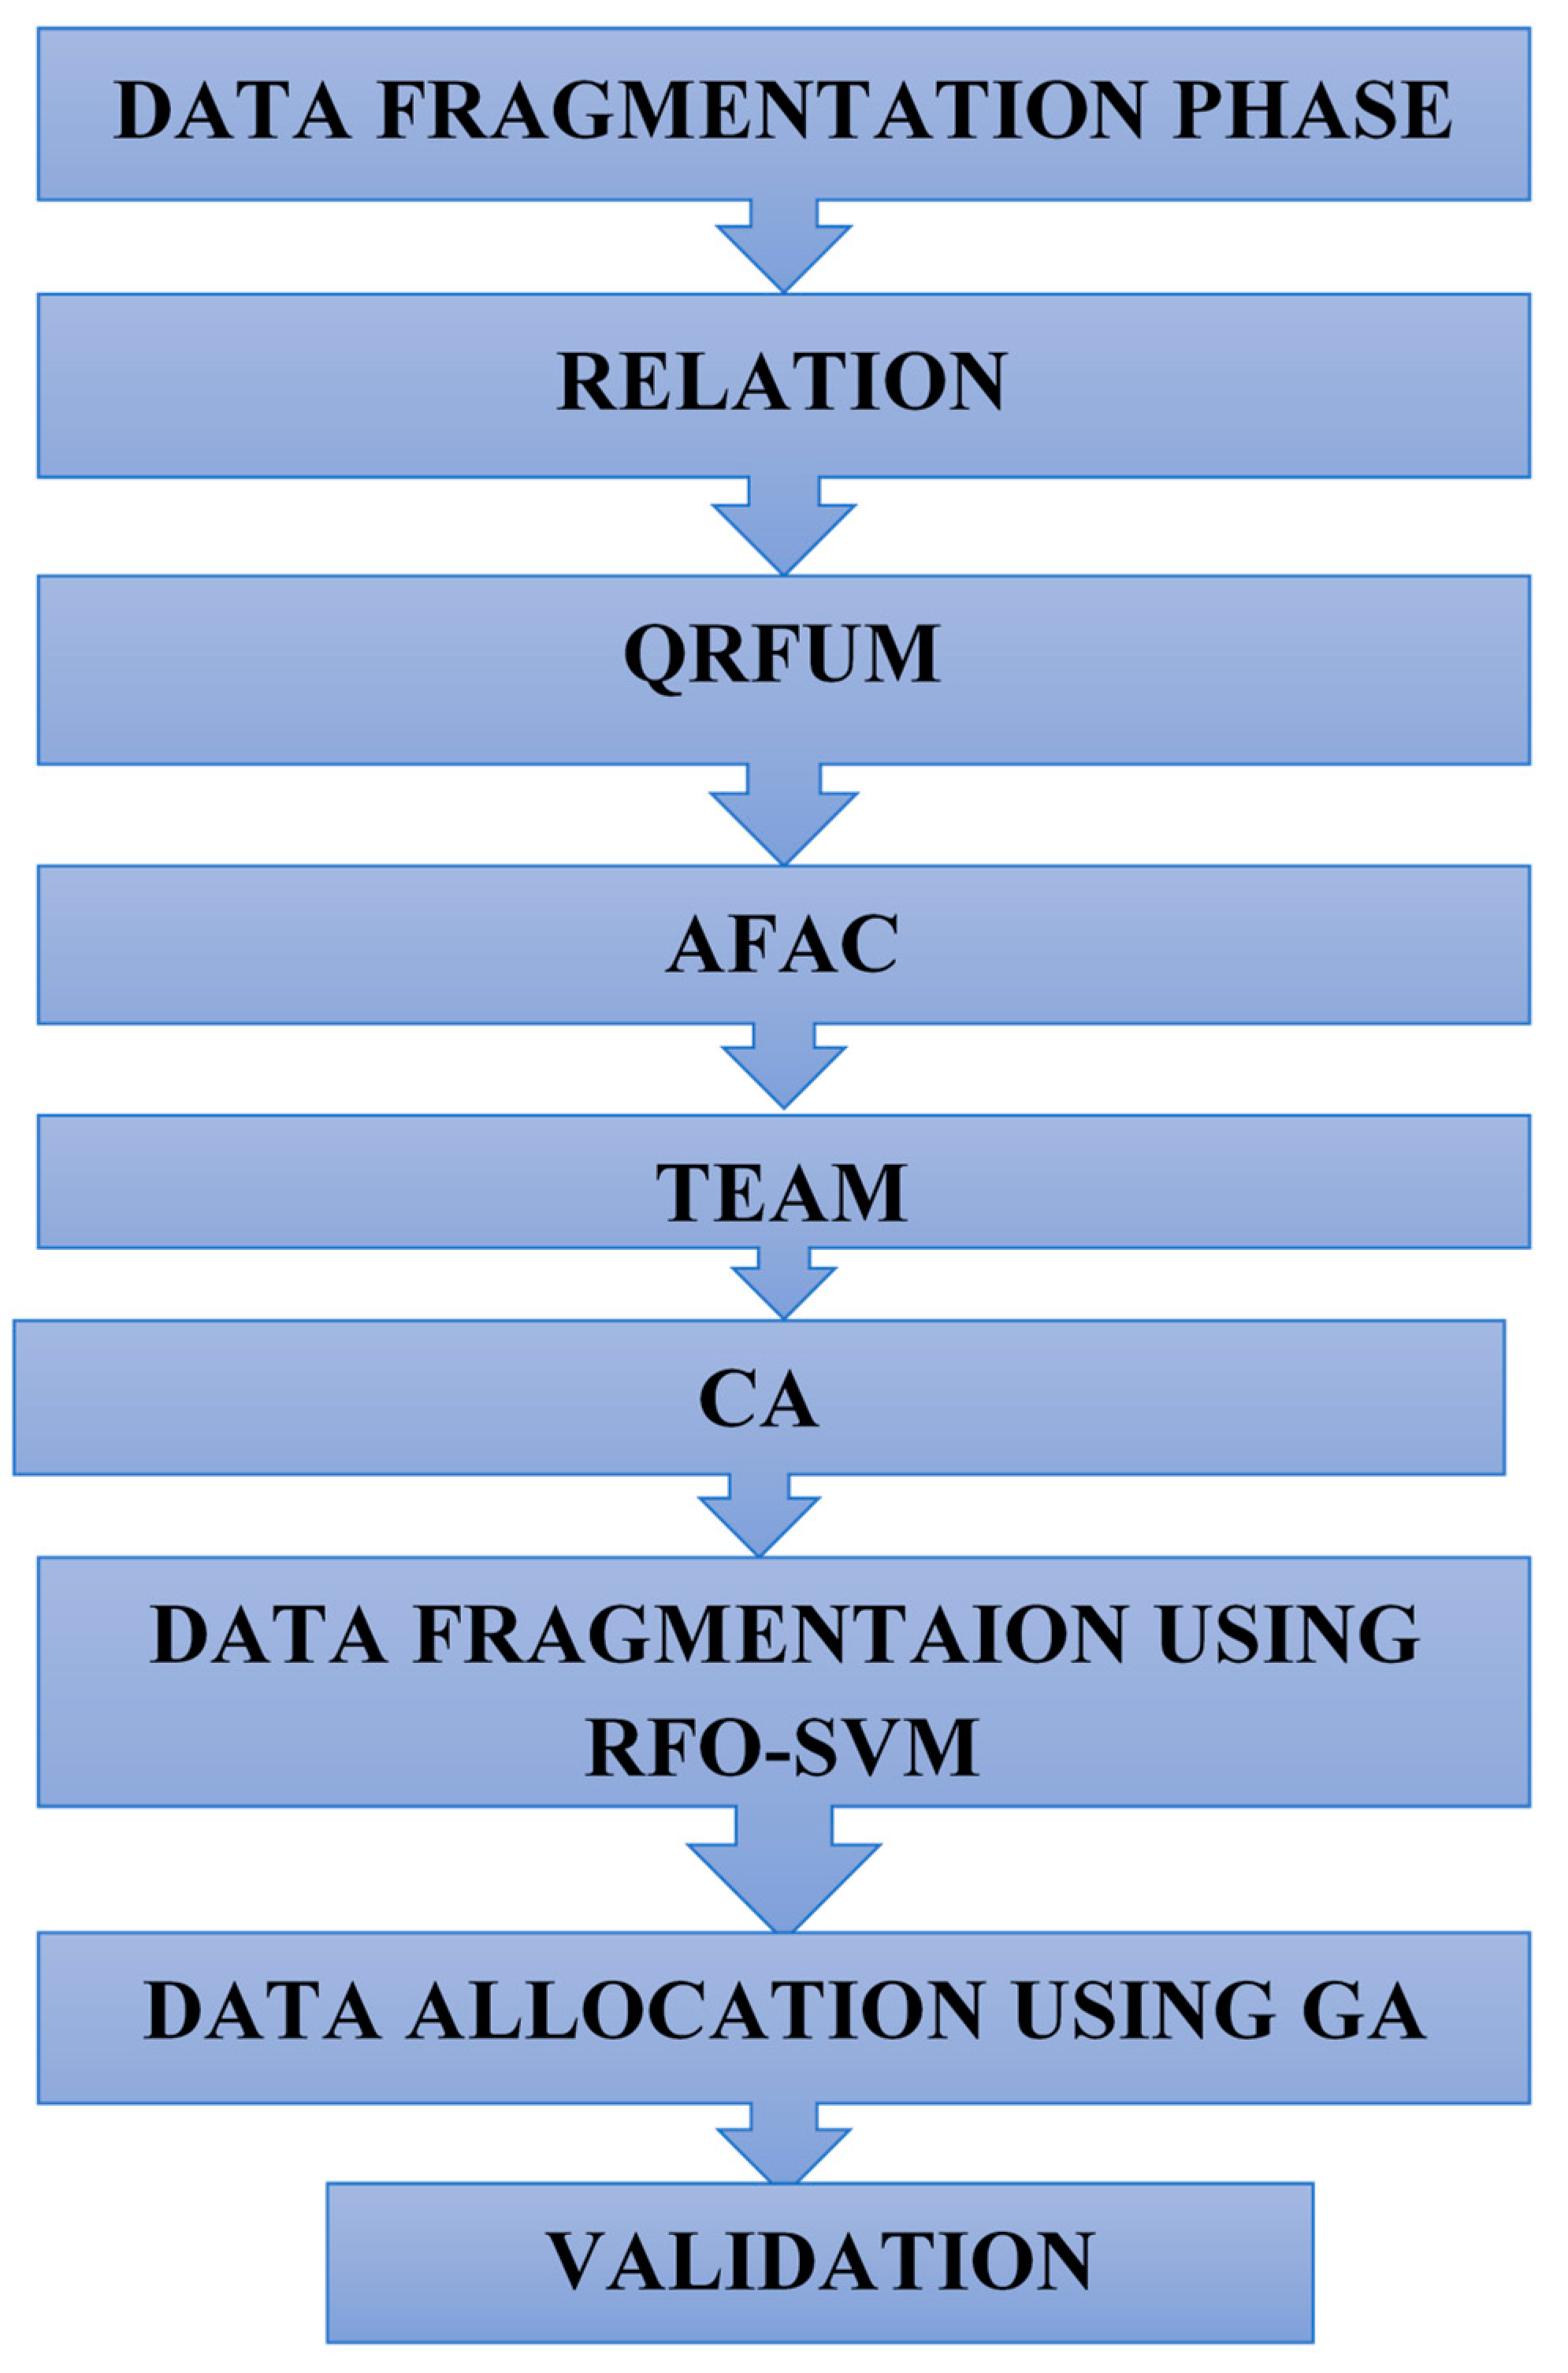
3.5.2. Data Fragmentation

The classified data are divided into fragments and each fragment contains a subset of the original data that belongs to a predicate set ψ = [ ψ 1 , ψ p ] and these predicates are assigned to all attributes N a , i.e., X X 1 , , X n . The numerical attributes are assumed to possess one of 3 states ( ψ i > v a l u e   1 ) , ψ i < v a l u e   2 )   o r   ψ i = v a l u e   3 ) . The alphabetical attributes are assigned to have a single state value ψ i = α . For all predicates, the retrieval and frequencies are updated for each attribute and are provided by the database administrator in the form of ( ψ i . Q R f ) and ψ i . Q U f . The most frequently used queries Q S require attributes that are continuously observed and released from several sites and each query possess its own query frequency Q R f Q U f in each site over data. The queries Q S from several sites (M) are treated as different queries in each site with Q R f Q U f frequency. The query frequency matrix Q f m saves these frequencies exactly. The proposed architecture is depicted in Figure 2 with the following explanation:
The relations that are being considered are expected to be defined and recognized.
All frequently used queries that are consistently observed to access each relation, regardless of their type (retrieval or update), are retained and individually considered. The frequencies of these queries over sites, as well as the retrieval and update frequencies of queries over data in all sites, are meticulously taken in Q f , Q R , and Q U matrices, respectively. Data fragmentation is initiated using these matrices in conjunction with the fragmentation cost model.
By utilizing Equation (22), in conjunction with the above-mentioned matrices, Attribute Frequency Accumulation (AFAC) is hosted.
The Communication Cost Matrix C C M is transformed into a Distance Cost Matrix (DCM) using the Genetic Algorithm. Then, Equation (24) is utilized to multiply DCM by AFAC, resulting in the Total Frequencies of Attributes predicate Matrix (TFAM).
Next, TFAM is used to calculate the overall access costs for each attribute individually, yielding the total pay. All attributes will then be sorted based on their pay.
Finally, among these attributes, the attribute with the highest pay is selected as the Candidate Attribute (CA), which initiates the successful execution of the fragmentation process, as depicted in Equation (25).
Objective Function: The objective function is better suitable for the specific circumstances and accurately reflects the transmission cost (TC). The first equation is used to measure the costs incurred during the processing of distributed retrieval queries, while Equation (23) measures the costs resulting from performing distributed update queries in a DDBS.
T C 1 = j = 1 m i = 1 m k = 1 q ( 1 X k j ) × Q R k j × F s i z e × C M S i j
T C 2 = j = 1 m i = 1 m k = 1 q ( 1 X k j ) × Q U k j × F s i z e × C M S i j
T C t o t a l = T C 1 + T C 2
The total transmission costs can be accurately calculated using Equation (24). The impact of the objective function is discussed below. T C 1   a n d   T C 2 represent the transmission costs for retrieval and update operations, respectively (Equations (22) and (23)). CMS refers to the cost matrix between sites (CSM) or the cost matrix between clusters of sites (CCM). F s i z e represents the size of the considered fragment, and X i j is a binary variable indicating the allocation of the fragment across sites.
Cost Functions in Fragmentation:
A F A C j i h = j = 1 m i = 1 n h = 1 A Q R j i h p × Q f j i + Q U j i h p × Q f j i
D C M i j = M i n ( C S M i j ,   1 i ; j m
T F A M j h = j = 1 m h = 1 α A F A C j i h × D C M i j ,   1 i ; j m
where Q R , Q f , and Q U are abbreviations for matrices elements QRM, QFM, and QUM, respectively.

3.5.3. Genetic Algorithm-Based Data Allocation

The data allocation process using a Genetic Algorithm involves evaluating the fitness of each solution based on minimizing communication costs, maximizing load balancing, or reducing data access latency. The fitness function captures the objectives and constraints of the data fragment allocation problem. The Genetic Algorithm (GA) is employed to evolve a population of solutions. Genetic operators, including selection, crossover, and mutation, are applied to generate new offspring solutions.
Selection Operator: The selection operator determines which individuals in the population are selected as parents for producing offspring. For selecting individuals based on their fitness values, the following is used:
ρ i = F i F j
where ρ i is the probability of selecting individual i as a parent, F i is the fitness value of individual i, and F j is the sum of fitness values of all individuals in the population. The fitness of each individual within each generation in the population is computed using the fitness function. Selection and crossover operations are performed to generate offspring solutions. Parents for crossover are selected based on their fitness values. Crossover is performed by randomly selecting a crossover point and swapping genetic data between two parents and is formulated as
ϕ = C O p 1 , p 2
where ϕ represents the newly generated offspring solution, and C O p 1 , p 2 is a function that combines the genetic data from parent1 and parent2.
The Roulette Wheel Selection method is utilized for selecting the parents for the next generation. This selection is probability-based, where each individual’s chance of being selected is proportional to its fitness. This method simulates a roulette wheel where the size of each segment is aligned with the fitness of the individuals, promoting higher fitness individuals to be more likely chosen, thereby steering the population towards promising regions of the search space.

Mutation Operator

Mutation is performed on the offspring solutions to introduce new genetic data in exploring different regions of the search space. The population and offspring solutions are combined, and their fitness values are computed by
μ s = μ i
where μ s is the individual solution after mutation, and μ i is a function that applies random changes to the genetic data of an individual.
Survival selection is performed by selecting the top individuals in the combined population. The best allocation of data points to clusters is generated for each generation. After all generations are completed, the allocation with the lowest fitness score is selected as the final allocation.
Here, in Gaussian mutation, the changes to the gene values are made according to a Gaussian distribution. This method is used for real-valued genes and is beneficial in fine-tuning solutions, allowing for small, stochastic tweaks that help in escaping local optima.

Crossover Operator

The uniform crossover technique is applied wherein a binary mask determines the genes to be inherited from each parent. This method offers the flexibility of combining genes from parent chromosomes, contributing to diversity in the gene pool. It is particularly effective in exploring new areas of the solution space without being confined to the building blocks defined by the parents’ structure.

Number of Children

The number of children generated in each generation is a critical parameter that influences the genetic diversity and convergence speed of the GA. In our implementation, we maintain a balanced approach where the number of children is set equal to the number of parents, ensuring a steady state of population size across generations.

Parameters and Configuration

Population Size: Determined based on preliminary tests to balance computational efficiency and algorithm performance.
Crossover Rate: Typically set between 60% and 80%, to ensure sufficient crossover while maintaining some genetic integrity of the parents.
Mutation Rate: A lower mutation rate of 1% to 5% is used to prevent excessive randomness, which can lead to divergence of the population from optimal regions.
Elitism: Preserving the best individuals from one generation to the next ensures that the gains obtained are not lost, which is critical for maintaining the quality of solutions.

Fitness Evaluation

After generating offspring solutions through crossover and mutation, their fitness values need to be evaluated based on the cost function and represented as
F = f c o s t i
where F is the fitness value of the individual solution, and f c o s t i is a function that calculates the cost based on the allocation of data fragments. The fitness values of the final population are plotted as a function of the number of iterations, providing insights into the optimization progress and convergence of the Genetic Algorithm.
These operators allow the Algorithm 2 to explore the search space and converge towards better solutions over generations to allocate the fragmented data using RFO-SVM algorithm. The fitness function for data allocation assigns a fitness score to measure the quality of a sites or nodes, which involves allocating data fragments. A population of individuals is randomly initialized, and the Genetic Algorithm is applied iteratively until the termination criteria are met, i.e., all fragmented data are allocated based on the total allocation cost as the fitness function.
Algorithm 2 Fragmentation and Allocation Algorithm
Input: Dataset, RFO parameters, SVM parameters and GA parameters
Output: Fragments and optimal allocated database.
Step 1: Pre-process the input dataset to handle missing data.
Step 2: Optimize SVM parameters using the RFO algorithm:
Step 2a. Initialize the RFO algorithm parameters.
Step 2b. Set the optimization objective as maximizing the accuracy metric.
Step 2c. Perform the RFO algorithm to search for optimal parameter values for SVM.
Step 3: Obtain the optimized SVM parameters ( γ ,   κ   a n d   C ).
Step 4: Apply the RFO-SVM model for data fragmentation:
Step 4a. Analyze the features and target label of the dataset.
Step 4b. Classify the data based on the class labels using SVM with the optimized parameter values obtained from the RFO algorithm.
Step 4c. Calculate the accuracy metric to evaluate the classification performance.
Step 5: Perform data allocation using GA:
Step 5a. Allocate the classified data fragments obtained from the RFO-SVM model.
Step 5b. Initialize the GA parameters for optimization.
Step 5c. Define the fitness function as the total allocation cost.
Step 5d. Initialize a population of individuals, each representing a possible allocation.
Step 5e. Iterate until a termination condition is met (e.g., selecting nodes or sites for fragmented data):
Step 5f. Select the allocation with the lowest fitness score.

4. Implementation Procedure

The implementation procedure inputs the dataset to handle missing data and the data are then classified by the RFO-SVM model into fragments. Then, the parameters of the SVM algorithm are optimized using the RFO algorithm. A Genetic Algorithm (GA) is employed to perform allocating the fragments to different nodes within the DDBMS. Finally, the best solution, representing the optimal allocation, is selected based on the lowest fitness score by ensuring an effective and optimized data allocation within the DDBMS.

4.1. Data Description

In this study, we used two datasets to evaluate the performance of the proposed RFO-SVM algorithm: the air quality dataset [26] and the wine quality dataset [27]. These datasets were chosen for their diverse characteristics and complexity, which provide a comprehensive testbed for the proposed method.
Air quality dataset [26]: The dataset was collected from Kaggle database of air quality and consists of 1845 samples that capture the variation in indoor gas concentration over time (Table 1). The data are collected using an array of six low-cost sensors, and each sample represents a specific action that occurred in the room. The dataset includes four target situations:
Class1: Represents clean air with less pollution.
Class 2: Represents activities such as cooking in the room and forced air circulation.
Class 3: Represents the burning of paper and wood for a short period of time in a room with closed windows and doors.
Class 4: Represents the use of spray and liquid detergents containing ammonia and/or alcohol, with the option to activate or deactivate forced air circulation.
The sample data are segmented as 80% for training and 20% for testing and each sample consists of seven values. The first six values represent the extracted and analyzed features, while the last value indicates the target value.
Wine quality dataset [27]: The dataset consists of 4898 instances of white vinho verde wine samples from the north of Portugal (Table 2). The purpose of the dataset is to model wine quality based on physicochemical tests. The dataset includes 12 attributes, with 11 input variables based on physicochemical tests and 1 output variable. The input variables in the dataset include fixed acidity, volatile acidity, citric acid, residual sugar, chlorides, free sulfur dioxide, total sulfur dioxide, density, pH, sulphates, and alcohol. The output variable represents the quality of the wine and is scored on a scale from 0 to 10.
Wine quality with a score of 10 is considered to be the best quality wine and wine with a score of 0 is poor quality wine. The minimum samples are eliminated and only six class samples are considered for evaluating the model. The wines in Class 3 are represented by 20 samples and have a larger sample size of 163; wines in Class 4 are indicative of a good quality level. The largest category in terms of sample size with 1457 wines, Class 5 represents a solid quality level and Class 6 consists of a substantial sample size of 2198 and its wines are expected to exhibit a higher level of quality. Class 7 consists of 880 samples that are likely to represent a higher quality level. Class 8 is considered premium quality and has 175 samples. The samples are segregated as 80% for training and 20% for testing.

4.2. Implementation of Proposed Model

The implementation is performed in a cloud computing environment using Python v.3.10; the data fragmentation using the RFO-based SVM initializes by loading the dataset and splitting it into features (x) and target labels (y). The dataset is preprocessed, and the feature learning phase is performed to extract relevant data from the features to enhance the quality and usefulness of the dataset for subsequent analysis.

4.2.1. Database Fragmentation

The data fragmentation process in DDBMS involves dividing the original dataset into smaller, manageable fragments that can be distributed across multiple nodes. This process is crucial for improving query performance and resource utilization in a distributed environment. The proposed RFO-SVM algorithm enhances this process by optimizing the fragmentation based on various criteria.

Classification and Fragmentation

The classified data are divided into fragments. Each fragment contains a subset of the original data, categorized based on a set of predicates (ψ). These predicates represent conditions or rules used to determine the attributes included in each fragment.
Predicates: For numerical attributes, predicates can represent conditions such as greater than (ψi > value1), less than (ψi < value2), or equal to (ψi = value3). For categorical attributes, a predicate might represent a specific category (ψi = α).

Role of Attributes

Attributes: Attributes (XX1…Xn) are the specific data fields within the dataset. Each attribute is evaluated against the predicates to determine its inclusion in a fragment.
States: Numerical attributes are assigned states based on the predicates. For example, an attribute might be included in a fragment if its value is greater than a specified threshold.

Matrices and Frequency Analysis

Query Frequency Matrix (Qfm): This matrix records the frequency of queries (QS) accessing each attribute. The frequency data are collected from multiple sites, with each site having its own query frequency (QRf, QUf).
Attribute Frequency Accumulation (AFAC): Using the query frequencies, the AFAC matrix accumulates the access frequencies of attributes across all queries and sites.
Distance Costs Matrix (DCM): The Communication Cost Matrix (CCM) is transformed into DCM using a Genetic Algorithm. DCM represents the distance or cost associated with accessing data across different nodes.
Total Frequencies of Attributes Predicate Matrix (TFAM): By multiplying DCM with AFAC, the TFAM is obtained. The TFAM calculates the overall access costs for each attribute.

Fragmentation Cost Model

The fragmentation cost model uses the matrices to determine the optimal fragmentation scheme. Attributes are sorted based on their total access costs (TFAM), and the attribute with the highest access cost is selected as the Candidate Attribute (CA) for fragmentation.
The fragmentation process is then executed based on the CA, ensuring that the data are efficiently divided and allocated across nodes.

4.2.2. Defining the Existing Sites or Nodes

SVM model is trained by performing fitness evaluation on each subset and evaluating its accuracy on a validation set.
The algorithm continues for a specified number of iterations, gradually improving the fitness of the population and finding the best subset of features.
Once the algorithm completes, the dataset is fragmented into subsets based on the selected features from the best solution found by the RFO-SVM algorithm.
Each fragment represents a smaller portion of the original dataset, possibly containing a subset of features and corresponding target values.
Accuracy is used as a metric for efficient optimization of SVM parameters.

4.2.3. Fragments Data Allocation Using GA

The GA evaluates the fitness of each solution by calculating its total allocation cost based on the given cost function.
Solutions with lower total allocation costs are considered fit and have a higher probability of being selected for reproduction.
Once the GA completes, the best solution represents the allocation of fragmented data across the nodes that minimizes the total allocation cost.
The allocated fragments are evaluated based on various metrics.
The GA algorithm is implemented by defining functions for initializing the population and updating the population. It is then applied to further optimize the data fragmentation, considering the total allocation cost as the fitness function.
The GA algorithm efficiently and effectively allocates fragmented data by finding the best sites for data allocation, representing the optimized data allocation.

4.3. Validation

The validation process is conducted to assess the efficiency and effectiveness of the proposed methodology, which includes efficient feature selection using RFO, optimization of SVM parameters by RFO, efficient testing and training procedures, successful data fragmentation, optimized site or node for data allocation using GA for fragmented data by RFO-SVM, and evaluation based on various performance metrics.

4.3.1. Training

The dataset is divided into training and testing sets, ensuring a representative distribution of samples. The training set is used to train the RFO-SVM model with the optimized parameters, while the testing set is used to evaluate the model’s performance.

4.3.2. Optimization of SVM Parameters

The RFO algorithm is further utilized to optimize the parameters of the SVM algorithm. By exploring the parameter space, RFO identifies the optimal values for parameters such as the kernel type, kernel parameter, and boundary parameter. This optimization process ensures that the SVM model is fine-tuned for improved classification performance. The accuracy metric measures the overall optimization of the SVM parameters.

4.3.3. Successful Data Fragmentation

The RFO-SVM classifies the data into fragments based on the optimized features and trained model to ensure that the data are divided into subsets that capture different classes or patterns present in the dataset. The performance of the RFO-SVM model, data fragmentation, and allocation process is evaluated using various metrics. The precision, recall, and F1 score assess the model’s performance for individual classes.

4.3.4. Optimized Site or Node for Data Allocation

The Genetic Algorithm (GA) is employed to allocate the fragmented data to different nodes. The GA optimizes the allocation process based on a fitness function, which is the total cost of allocation to ensure that the data fragments are distributed efficiently across the nodes, enhancing the overall system performance. The total cost of the allocation provides insights into the efficiency of the allocation process.

4.3.5. Processing Time

The execution time of the entire process, including parameter optimization, training, data fragmentation, node allocation, and testing, is measured to provide an assessment of the efficiency of the implemented methodology.

5. Experimental Results

The experimental setup involves an optimized machine learning algorithm for performing horizontal fragmentation using the Red Fox Optimization-based Support Vector Machine (RFO-SVM) data fragmentation model. Prior to feeding the input database into the proposed model, pre-processing is performed to handle missing data and ensure data integrity. The implementation of RFO-SVM for data fragmentation and allocation was carried out using Python v3.10. The Python libraries used in the implementation were pandas v2.0.1, numpy v1.23.5, and sklearn v1.2.2. These libraries provide essential functionalities for data manipulation, numerical computations, and machine learning algorithms. The simulation setup for evaluating the performance of the implemented RFO-SVM algorithm is summarized in Table 3.
The maximum number of iterations allowed for the RFO-SVM algorithm during the training process was set to 50, which controls the convergence of the algorithm and determines the number of iterations required to reach the optimal solution. The best model parameters are derived by the optimization process. The C range represents the regularization parameter of the SVM algorithm, which balances the trade-off between the training error and model complexity and it is set as 10.
The γ range is a parameter specific to the radial basis function (RBF) kernel used in SVM that influences each training sample and determines the shape of the decision boundary. A γ range of 1.0 was employed in simulation, indicating the range of values considered for this parameter during the training process. The kernel function used in the SVM algorithm was the radial basis function (RBF) kernel for its ability to capture non-linear relationships between features. The air quality dataset was fragmented into four distinct subsets and the wine quality dataset was divided into six fragments.
The evaluation measures are used to assess the performance of the proposed model, including accuracy, precision, recall, and F1-score.
Accuracy measures the overall correctness of the model’s predictions. It calculates the ratio of correct predictions to the total number of predictions.
A c c u r a c y = T p + T n T p + T n + F p + F n
Precision measures the proportion of correctly predicted positive instances out of the total instances predicted as positive.
P r e c i s i o n = T p T p + F p
Recall, also known as sensitivity or true positive rate, measures the proportion of correctly predicted positive instances out of the total actual positive instances.
R e c a l l = T p T p + F n
F1-score combines precision and recall into a single metric, providing a balanced measure of the model’s performance. It is the harmonic mean of precision and recall.
F 1 - s c o r e = 2 × P r e c i s i o n × R e c a l l P r e c i s i o n + R e c a l l
where T p , T n , F p , F n are true positive, true negative, false positive, and false negative, respectively.
Allocation Cost represents the cost associated with dividing the data into fragments. It is calculated based on the computational resources required for fragmentation and the complexity of the data distribution.
A l l o c a t i o n   C o s t = f ( D a t a ,   F r a g m e n t a t i o n   C r i t e r i a )
where f () represents the function used to calculate the allocation cost based on the input data and the fragmentation criteria.
The total cost of allocation is obtained by summing up the allocation cost of each fragment.
T o t a l   C o s t   o f   A l l o c a t i o n = F 1 + F 2 + . . . + F n
where F 1 + F 2 + . . . + F n indicates the sum of fragments, F indicates the fragments, and n indicates the total number of fragments.
Transmission Cost represents the cost of transmitting data between fragments and the amount of data that needs to be transferred between fragments and depends on network bandwidth, latency, or data size. The transmission cost per fragment is calculated by considering the size of the data to be transmitted from one fragment to another. The total transmission cost is obtained by summing up the transmission cost of each fragment.
Memory Utilization measures the amount of memory required to store the data in each fragment and the space required to hold the data and any additional metadata associated with it. The memory utilization of each fragment is calculated by considering the size of the data fragment and any overhead due to data structures. The total memory utilization is obtained by summing up the memory utilization of each fragment.
Processing Time measures the time taken to train the RFO-SVM algorithm and perform the data fragmentation that includes the time required for data preprocessing, model training, and any additional steps involved in the fragmentation process. The processing time is measured by recording the start and end times of the relevant operations.

Performance Results

The performance results for the air quality dataset show that the training data are divided into four fragments: Fragment 1 contains 459 samples, Fragment 2 has 414 samples, Fragment 3 has 163 samples, and Fragment 4 has 440 samples. These fragments are then allocated to different nodes for processing. Node 0 is assigned Fragment 1, Node 1 is assigned Fragment 2, Node 2 is assigned Fragment 3, and Node 3 is assigned Fragment 4. Similarly, the testing data are also divided into four fragments. Fragment 1 contains 136 samples, Fragment 2 has 101 samples, Fragment 3 has 32 samples, and Fragment 4 has 100 samples. These testing fragments are allocated to the same nodes as the training data fragments. Node 0 is assigned Fragment 1, Node 1 is assigned Fragment 2, Node 2 is assigned Fragment 3, and Node 3 is assigned Fragment 4. The fragment allocations ensure that the data are distributed across different nodes for efficient analysis. The allocation of data fragments to specific nodes is an important step in optimizing the performance of the data fragmentation and allocation process. The allocation of fragments with training and testing data are provided in Table 4.
The performance results for the wine quality dataset reveal that the training data are fragmented into six distinct fragments. Fragment 1 contains 14 samples, Fragment 2 has 136 samples, Fragment 3 has 1171 samples, Fragment 4 has 1744 samples, Fragment 5 has 709 samples, and Fragment 6 has 140 samples. These fragments are then allocated to different nodes for processing. Node 0 is assigned Fragment 1, Node 1 is assigned Fragment 2, Node 2 is assigned Fragment 3, Node 3 is assigned Fragment 4, Node 4 is assigned Fragment 5, and Node 5 is assigned Fragment 6. Similarly, the testing data are divided into six fragments as well. Fragment 1 contains 6 samples, Fragment 2 has 27 samples, Fragment 3 has 286 samples, Fragment 4 has 454 samples, Fragment 5 has 171 samples, and Fragment 6 has 35 samples. These testing fragments are allocated to the same nodes as the training data fragments. Node 0 is assigned Fragment 1, Node 1 is assigned Fragment 2, Node 2 is assigned Fragment 3, Node 3 is assigned Fragment 4, Node 4 is assigned Fragment 5, and Node 5 is assigned Fragment 6. The fragmentation and allocation process ensure that the data are efficiently distributed across multiple nodes for effective analysis. The overall performance and scalability of the data fragmentation approach are enhanced by dividing the data into smaller fragments and allocating them to different nodes.
The performance evaluation of the RFO-SVM algorithm for data fragmentation and allocation is shown in Table 5. The results are obtained for 50 iterations of the algorithm for both the air quality dataset and the wine quality dataset.
For the air quality dataset, the evaluation metrics demonstrate a high-level accuracy of 96.21%, and a precision of 96.23%, indicating a high proportion of correctly predicted positive instances out of the total positive predictions. The recall rate is 95.65%, and the F1 score, which combines precision and recall, is calculated at 95.93%, providing a balanced measure of the model’s performance. The allocation cost per fragment for the air quality dataset is measured at 801.18 Mbps, indicating the computational resources required for data fragmentation. The total cost of allocation for all fragments is determined to be 3204.72 Mbps. The transmission cost per fragment, representing the data transmission between fragments, is 1771.2 Mbps, with a total transmission cost of 5313.6 Mbps. The memory utilization per fragment is 17,712 bytes, resulting in a total memory utilization of 70,848 bytes. The processing time for the air quality dataset is 28.36 s, indicating the time taken to train the RFO-SVM algorithm and perform the data fragmentation.
The results highlight the effectiveness of the RFO-SVM algorithm in achieving high accuracy and performance in data fragmentation and allocation. The algorithm effectively distributes the data across fragments, minimizing allocation and transmission costs while ensuring efficient memory utilization. The processing time reflects the algorithm’s efficiency in handling large datasets. The RFO-SVM algorithm demonstrates its suitability for data fragmentation and allocation tasks.
The performance of the RFO-SVM approach for two datasets with 50 iterations is compared with other existing data fragmentation allocation methods.
The proposed RFO-SVM method shows significant improvements in all metrics as shown in Table 6. It achieves an impressive accuracy of 96.21% with a significantly reduced total allocation cost of 3204.72 Mbps. Moreover, it exhibits a remarkably low processing time of 28.36 s and a reduced total transmission cost of 5313.6 Mbps. These results indicate that the proposed RFO-SVM approach outperforms the existing methods, providing higher accuracy, faster processing, and reduced resource utilization in terms of allocation and transmission costs.
Figure 3 shows that the proposed RFO-SVM method exhibited a significant reduction in comparison with all existing methods. Compared with FRAGMENT, the proposed method achieved reductions in allocation costs of 42.15% and for DMA, reduced by 55.93%. Compared with KT-DDE, SS-FONs, DBE-GAM, PROADAPT, FTree, MGRM, DSGA, and VFAR, the proposed method achieved reductions in allocation costs of 53.27%, 58.79%, 43.32%, 45.36%, 44.16%, 33.94%, 27.21%, and 55.07%, respectively.
Figure 4 demonstrates that the proposed method achieved an increase of approximately 15.61% in accuracy when compared with FRAGMENT. Similarly, compared with DMA and KT-DDE, the proposed RFO-SVM method demonstrated increases of 8.91% and 10.81% in accuracy, respectively. In comparison with SS-FONs, DBE-GAM, PROADAPT, FTree, MGRM, DSGA, and VFAR, the proposed RFO-SVM method achieved increases of 16.61%, 18.81%, 20.41%, 19.21%, 13.91%, 10.81%, and 7.01% in accuracy, respectively.
Figure 5 depicts that the processing time of the proposed RFO-SVM method was considerably lower than FRAGMENT by 50.49%, DMA by 65.72%, and KT-DDE by 67.80%. When compared with SS-FONs, DBE-GAM, PROADAPT, FTree, MGRM, DSGA, and VFAR, the proposed method demonstrated reductions in processing times of 71.50%, 74.48%, 71.28%, 71.35%, 64.41%, 54.16%, and 69.34%, respectively.
From Figure 6, the proposed RFO-SVM method achieved reductions in terms of the total transmission cost when compared with FRAGMENT of 49.89%, DMA of 39.46, KT-DDE of 39.35, and SS-FONs of 29.45%. Compared with DBE-GAM, PROADAPT, FTree, MGRM, DSGA, and VFAR, the proposed method achieved reductions in transmission costs of 60.96%, 37.98%, 41.88%, 49.75%, 42.52%, and 52.87%, respectively.
The performance comparison of data fragmentation and allocation methods using the Hybrid RFO-SVM approach for the Wine Quality Dataset, as shown in Table 7, reveals the superiority of the proposed RFO-SVM method across various metrics when compared with the existing methods.
Figure 7 shows that the proposed RFO-SVM method achieved a substantial reduction in terms of total allocation cost when compared with FRAGMENT, DMA, KT-DDE, and SS-FONs, and the proposed method achieved reductions in allocation costs of 52.21%, 34.03%, 31.51%, and 38.22%, respectively, and compared with DBE-GAM, PROADAPT, FTree, MGRM, DSGA, and VFAR, achieved reductions in allocation costs of 27.40%, 30.91%, 28.16%, 34.66%, 38.72%, and 40.61%, respectively.
Figure 8 demonstrates the proposed RFO-SVM method outperformed in terms of accuracy when compared with FRAGMENT and DMA, achieving increases in accuracy of 22.69%, and 8.19%, respectively. When compared with KT-DDE, SS-FONs, DBE-GAM, PROADAPT, FTree, MGRM, DSGA, and VFAR, the proposed method achieved increases in accuracy of 10.99%, 8.19%, 5.99%, 8.59%, 11.99%, 18.23%, 13.38%, and 12.48%, respectively.
Figure 9 shows that the processing time of the proposed RFO-SVM method was significantly lower compared with FRAGMENT, DMA, KT-DDE, and SS-FONs, by 57.81%, 55.84%, 62.04%, and 66.15%, respectively. On comparing with DBE-GAM, PROADAPT, FTree, MGRM, DSGA, and VFAR, the proposed method demonstrated reductions in processing times of 68.01%, 64.54%, 57.59%, 48.24%, 58.23%, and 54.18%, respectively.
Figure 10 shows that the proposed RFO-SVM method achieved substantial reductions in terms of total transmission costs when compared with FRAGMENT, DMA, KT-DDE, SS-FONs, DBE-GAM, PROADAPT, FTree, MGRM, DSGA, and VFAR, of 50.76%, 44.26%, 42.88%, 26.82%, 31.38%, 33.96%, 43.91%, 42.02%, 25.82%, and 51.54%, respectively.

6. Conclusions and Future Work

This study proposed the RFO-SVM algorithm as a potential solution for optimizing data fragmentation and allocation across multiple nodes in distributed databases. The algorithm offers an efficient and effective approach to addressing the challenges of data fragmentation allocation in distributed databases due to the increasing volume and complexity of data. It demonstrated high accuracy and robust performance in predicting instances and identifying positive cases. Key advantages include optimized resource utilization, significantly reduced allocation costs, efficient memory utilization, and fast processing times. Compared with existing methods, the RFO-SVM algorithm outperforms in all metrics, achieving a 96.21% accuracy and a 42.15% reduction in allocation cost. These findings underscore the potential of RFO-SVM to enhance the efficiency and scalability of distributed database systems.
Future work can focus on the following areas to further advance the field of data fragmentation allocation in distributed databases, addressing emerging challenges and contributing to the development of more efficient and scalable distributed data management solutions:
Scalability and Performance Optimization: Develop algorithms that can efficiently handle a larger number of nodes, datasets, and workload demands while maintaining high accuracy and minimizing resource utilization.
Combination of Machine Learning with Rule-Based or Heuristic Approaches: Investigate the integration of machine learning techniques with rule-based or heuristic approaches to create more effective and efficient data fragmentation allocation algorithms.
Integration with Emerging Technologies: Explore the integration of data fragmentation allocation algorithms with technologies such as edge computing, blockchain, or federated learning. These technologies can introduce new challenges and opportunities in distributed data management, and studying their impact on data fragmentation allocation can provide valuable insights.
These directions will help in creating more robust, efficient, and scalable solutions for distributed database management systems.

Author Contributions

Conceptualization, H.H; methodology, H.H.; software, K.D.; validation, A.R.; formal analysis, K.D. and A.H.K.; investigation, A.R.; resources, A.H.K.; data curation, A.H.K. and A.R.; writing—original draft preparation, K.D. and A.R.; writing—review and editing, H.H; visualization, K.D. and A.R.; supervision, A.H.K.; project administration, K.D.; funding acquisition, H.H. All authors have read and agreed to the published version of the manuscript.

Funding

This research received no external funding.

Data Availability Statement

Data is contained within the article.

Acknowledgments

The authors are extremely grateful to Ameer Sardar Kwekha Rashid at Business Information Technology, University of Sulaimani, Sulaymaniyah, Iraq. Ameer has significantly contributed to the methodology, funding acquisition and validation of our work. His insightful feedback and unwavering support were essential to the development and completion of this work.

Conflicts of Interest

The authors declare no conflict of interest.

References

  1. Baalbaki, H.; Hazimeh, H.; Harb, H.; Angarita, R. KEMA: Knowledge-graph embedding using modular arithmetic. In Proceedings of the 34th International Conference on Software Engineering and Knowledge Engineering, Pittsburgh, PA, USA, 1–10 July 2022. [Google Scholar]
  2. Baalbaki, H.; Hazimeh, H.; Harb, H.; Angarita, R. TransModE: Translation-al Knowledge Graph Embedding Using Modular Arithmetic. Procedia Comput. Sci. 2022, 207, 1154–1163. [Google Scholar] [CrossRef]
  3. Saad, G.; Harb, H.; Abouaiss, A.; Idoumgha, L.; Charara, N. An efficient hadoop-based framework for data storage and fault recovering in large-scale multi-media sensor networks. In Proceedings of the 2020 International Wireless Communications and Mobile Computing (IWCMC), Limassol, Cyprus, 15–19 June 2020; IEEE: New York, NY, USA, 2020; pp. 316–321. [Google Scholar]
  4. Połap, D.; Woźniak, M. Red fox optimization algorithm. Expert Syst. Appl. 2021, 166, 114107. [Google Scholar] [CrossRef]
  5. Dahal, A.; Joshi, S.R. A clustering based vertical fragmentation and allocation of a distributed database. In Proceedings of the 2019 Artificial Intelligence for Transforming Business and Society (AITB), Kathmandu, Nepal, 5 November 2019; IEEE: Pistacaway, NJ, USA, 2019; Volume 1, pp. 1–5. [Google Scholar]
  6. Ramachandran, R.; Ravichandran, G.; Raveendran, A. Vertical fragmentation of high-dimensional data using feature selection. In Proceedings of the Inventive Computation and Information Technologies: Proceedings of ICICIT 2020, Coimbatore, India, 24–25 September 2020; Springer: Singapore, 2021; pp. 935–944. [Google Scholar]
  7. Amer, A.A. On K-means clustering-based approach for DDBSs design. J. Big Data 2020, 7, 31. [Google Scholar] [CrossRef]
  8. Abdel Raouf, A.E.; Badr, N.L.; Tolba, M.F. Dynamic data reallocation and replication over a cloud environment. Concurr. Comput. Pract. Exp. 2018, 30, e4416. [Google Scholar] [CrossRef]
  9. Amer, A.A.; Mohamed, M.H.; Al_Asri, K. ASGOP: An aggregated similarity-based greedy-oriented approach for relational DDBSs design. Heliyon 2020, 6, e03172. [Google Scholar] [CrossRef] [PubMed]
  10. Dokeroglu, T.; Bayir, M.A.; Cosar, A. Robust heuristic algorithms for exploiting the common tasks of relational cloud database queries. Appl. Soft Comput. 2015, 30, 72–82. [Google Scholar] [CrossRef]
  11. Wiese, L. Clustering-based fragmentation and data replication for flexible query answering in distributed databases. J. Cloud Comput. 2014, 3, 1–15. [Google Scholar] [CrossRef]
  12. Luong, V.N.; Le, V.S.; Doan, V.B. Fragmentation in Distributed Database Design Based on KR Rough Clustering Technique. In Proceedings of the Context-Aware Systems and Applications, and Nature of Computation and Communication, Proceedings of 6th International Conference (ICCASA 2017) and 3rd International Conference (ICTCC 2017), Tam Ky City, Vietnam, 23–24 November 2017; Springer: Cham, Switzerland, 2017; pp. 166–172. [Google Scholar]
  13. Benmelouka, A.; Ziani, B.; Quinten, Y. Vertical fragmentation and allocation in distributed databases using k-mean algorithm. Int. J. Adv. Stud. Comput. Sci. Eng. 2023, 12, 45–53. [Google Scholar]
  14. Abdalla, H.I.; Amer, A.A.; Mathkour, H. A Novel Vertical Fragmentation, Replication and Allocation Model in DDBSs. J. Univers. Comput. Sci. 2014, 20, 1469–1487. [Google Scholar]
  15. Tarun, S.; Batth, R.S.; Kaur, S. A novel fragmentation scheme for textual data using similarity-based threshold segmentation method in distributed network environment. Int. J. Comput. Netw. Appl. 2020, 7, 231. [Google Scholar] [CrossRef]
  16. Abdel Raouf, A.E.; Badr, N.L.; Tolba, M.F. Distributed database system (DSS) design over a cloud environment. In Multimedia Forensics and Security: Foundations, Innovations, and Applications; Springer: New York, NY, USA, 2017; pp. 97–116. [Google Scholar]
  17. Wedashwara, W.; Mabu, S.; Obayashi, M.; Kuremoto, T. Combination of genetic network programming and knapsack problem to support record clustering on distributed databases. Expert Syst. Appl. 2016, 46, 15–23. [Google Scholar] [CrossRef]
  18. Benkrid, S.; Bellatreche, L.; Mestoui, Y.; Ordonez, C. PROADAPT: Proactive framework for adaptive partitioning for big data warehouses. Data Knowl. Eng. 2022, 142, 102102. [Google Scholar] [CrossRef]
  19. Mai, N.T. Heuristic Algorithm for Fragmentation and Alloca-Tion in Distributed Object Oriented Database. J. Comput. Sci. Cybern. 2016, 32, 47–60. [Google Scholar] [CrossRef]
  20. Mahi, M.; Baykan, O.K.; Kodaz, H. A new approach based on greedy minimizing algorithm for solving data allocation problem. Soft Comput. 2023, 27, 13911–13930. [Google Scholar] [CrossRef]
  21. Zhang, D.; Deng, Y.; Zhou, Y.; Li, J.; Zhu, W.; Min, G. MGRM: A Multi-Segment Greedy Rewriting Method to Alleviate Data Fragmentation in Deduplication-Based Cloud Backup Systems. IEEE Trans. Cloud Comput. 2023, 11, 2503–2516. [Google Scholar] [CrossRef]
  22. Nimbalkar, T.S.; Bogiri, N. A novel integrated fragmentation clustering allocation approach for promote web telemedicine database system. Int. J. Adv. Electron. Comput. Sci. 2016, 2, 1–11. [Google Scholar]
  23. Peng, P.; Zou, L.; Chen, L.; Zhao, D. Adaptive distributed RDF graph fragmentation and allocation based on query workload. IEEE Trans. Knowl. Data Eng. 2018, 31, 670–685. [Google Scholar] [CrossRef]
  24. Zhang, Y.; Wang, J.; Li, F. MGRM: Multi-Granularity Resource Management for cloud data centers. Future Gener. Comput. Syst. 2022, 126, 223–234. [Google Scholar] [CrossRef]
  25. Ge, Y.; Xu, Y.; Chen, L. DSGA: Distributed Smart Grid Allocation using machine learning. IEEE Trans. Smart Grid 2022, 13, 1456–1468. [Google Scholar]
  26. Saverio, D.V. Air Quality Dataset. Available online: https://www.kaggle.com/datasets/fedesoriano/air-quality-data-set (accessed on 10 February 2022).
  27. Yasser, M. Wine Quality Dataset. Available online: https://www.kaggle.com/datasets/yasserh/wine-quality-dataset (accessed on 27 March 2022).
  28. Castro, J.; Smith, R.; Johnson, L. FRAGMENT: Fragmentation-based allocation in distributed systems. J. Netw. Comput. Appl. 2020, 123, 102–114. [Google Scholar]
  29. Ge, Y.; Li, Q.; Wang, X. DMA: Dynamic Memory Allocation for cloud computing environments. IEEE Trans. Cloud Comput. 2020, 8, 345–357. [Google Scholar]
  30. Ge, Y.; Zhang, P.; Li, Q. KT-DDE: Knowledge Transfer and Dynamic Decision Engine for network optimization. Comput. Netw. 2021, 179, 107–118. [Google Scholar] [CrossRef]
  31. Lechowicz, P.; Kowalski, M.; Nowak, A. SS-FONs: Secure and Scalable Fiber Optical Networks for data centers. Opt. Fiber Technol. 2021, 57, 102–115. [Google Scholar]
  32. Mehta, S.; Patel, R.; Sharma, V. DBE-GAM: Dynamic Bandwidth Estimation using Genetic Algorithms and Machine learning. IEEE Access 2022, 10, 4506–4518. [Google Scholar]
  33. Benkrid, A.; Mohamed, S.; Ali, M. PROADAPT: Adaptive Protocols for efficient resource management in IoT networks. Sensors 2022, 22, 1445. [Google Scholar] [CrossRef]
  34. Rodríguez, H.; Garcia, M.; Lopez, J. FTree: A Fault-Tolerant tree-based net-work routing protocol. Comput. Commun. 2022, 192, 224–234. [Google Scholar] [CrossRef]
  35. Benmelouka, M.; Alami, H.; Farid, M. VFAR: Virtualized Fiber Access Net-works for efficient bandwidth management. Opt. Switch. Netw. 2023, 44, 100–111. [Google Scholar]
Figure 1. Workflow of RFO-SVM framework.
Applsci 14 06093 g001
Figure 2. Proposed architecture of RFO-SVM framework.
Applsci 14 06093 g002
Figure 3. Total allocation cost.
Applsci 14 06093 g003
Figure 4. Accuracy results.
Applsci 14 06093 g004
Figure 5. Processing time.
Applsci 14 06093 g005
Figure 6. Total transmission cost.
Applsci 14 06093 g006
Figure 7. Total allocation cost.
Applsci 14 06093 g007
Figure 8. Accuracy.
Figure 8. Accuracy.
Applsci 14 06093 g008
Figure 9. Processing time.
Applsci 14 06093 g009
Figure 10. Total transmission cost.
Applsci 14 06093 g010
Table 1. Air Quality Dataset Description.
SituationSituation DescriptionSampleTraining (80%)Testing (20%)
Class 1Normal situation595476119
Class 2Preparing meals515412103
Class 3Presence of smoke19515639
Class 4Cleaning540432108
Table 2. Wine Quality Dataset Description.
Wine QualitySamplesTrainingTesting
Class 32015 5
Class 4 16313825
Class 514571166 291
Class 621981766 432
Class 7880688 192
Class 8175140 35
Table 3. Simulation Setup.
S.NO.ParameterValue
1.Maximum iterations50
2.C range0.1–10
3.ɣ range0.001–1.0
4.KernelLinear, polynomial, sigmoid rbf
5.No. of fragments for air quality dataset4
6.No. of fragments for wine quality dataset6
Table 4. Data Fragmentation Results.
Air Quality Data
FragmentsTrainingTestingFinal Allocation
14591360
24141011
3163322
44401003
Wine Quality Data
FragmentsTrainingTestingFinal Allocation
11460
2136271
311712862
417444543
57091714
6140355
Table 5. Performance evaluation of RFO-SVM for data fragmentation allocation.
S.NO.Evaluation for 50 Iterations
MetricsAir QualityWine Quality
1.Accuracy (%)96.2180.59
2.Precision (%)96.2384.69
3.Recall (%)95.6590.69
4.F1 Score (%)95.9387.59
5.Allocation cost per fragment (Mbps)801.182037.4
6.Total cost of allocation (Mbps)3204.7212,224.4
7.Transmission cost per fragment (Mbps)1771.25737.6
8.Total transmission cost (Mbps)5313.628,688.0
9.Memory utilization per fragment (Bytes)17,71257,376
10.Total memory utilization (Bytes)70,848344,432
11.Processing time (Seconds)28.36245.53
Table 6. Performance Comparison of Data fragmentation and Allocation Using Hybrid RFO-SVM for Air Quality Dataset.
Methods Total Allocation Cost (Mbps)Accuracy (%)Processing Time (s)Total Transmission Cost (Mbps)
FRAGMENT [28]5542.680.679.310,256
DMA [29]7256.487.382.411,897
KT-DDE [30]6858.285.488.26258
SS-FONs [31]7772.579.6100.57546
DBE-GAM [32]5656.277.4111.213,687
PROADAPT [33]6112.475.998.38563.9
FTree [34]5999.376.09910,222.6
MGRM [24]4998.882.379.89894
DSGA [25]4454.585.365.47791.8
VFAR [35]7122.688.292.511,258.2
Proposed RFO-SVM3204.7296.2128.365313.6
Table 7. Performance Comparison of the Data Fragmentation and Allocation Using Hybrid RFO-SVM for Wine Quality Dataset.
Data Fragmentation and Allocation Methods Total Allocation Cost (Mbps)Accuracy (%)Processing Time (s)Total Transmission Cost (Mbps)
FRAGMENT [28]25,589.565.958258,366
DMA [29]20,68972.455649,732
KT-DDE [30]19,87270.664548,679
SS-FONs [31]22,64571.472239,475
DBE-GAM [32]18,47675.676538,666
PROADAPT [33]19,0057269343,584
FTree [34]18,679.969.657948,002
MGRM [24]19,8346850936,761
DSGA [25]17,2647145653,576
VFAR [35]20,57971.353759,254
Proposed RFO-SVM12,224.480.59245.5328,688.0
Disclaimer/Publisher’s Note: The statements, opinions and data contained in all publications are solely those of the individual author(s) and contributor(s) and not of MDPI and/or the editor(s). MDPI and/or the editor(s) disclaim responsibility for any injury to people or property resulting from any ideas, methods, instructions or products referred to in the content.

