Article

A Novel Method for Wheat Spike Phenotyping Based on Instance Segmentation and Classification

by
Ziang Niu
,
Ning Liang
,
Yiyin He
,
Chengjia Xu
,
Sashuang Sun
,
Zhenjiang Zhou
and
Zhengjun Qiu
*
College of Biosystems Engineering and Food Science, Zhejiang University, Hangzhou 310058, China
*
Author to whom correspondence should be addressed.
These authors contributed equally to this work.
Appl. Sci. 2024, 14(14), 6031; https://doi.org/10.3390/app14146031
Submission received: 27 May 2024 / Revised: 1 July 2024 / Accepted: 8 July 2024 / Published: 10 July 2024
(This article belongs to the Special Issue Applications of Machine Learning in Agriculture)

Abstract

:
The phenotypic analysis of wheat spikes plays an important role in wheat growth management, plant breeding, and yield estimation. However, the dense and tight arrangement of spikelets and grains on the spikes makes the phenotyping more challenging. This study proposed a rapid and accurate image-based method for in-field wheat spike phenotyping consisting of three steps: wheat spikelet segmentation, grain number classification, and total grain number counting. Wheat samples ranging from the early filling period to the mature period were involved in the study, including three varieties: Zhengmai 618, Yannong 19, and Sumai 8. In the first step, the in-field collected images of wheat spikes were optimized by perspective transformation, augmentation, and size reduction. The YOLOv8-seg instance segmentation model was used to segment spikelets from wheat spike images. In the second step, the number of grains in each spikelet was classified by a machine learning model like the Support Vector Machine (SVM) model, utilizing 52 image features extracted for each spikelet, involving shape, color, and texture features as the input. Finally, the total number of grains on each wheat spike was counted by adding the number of grains in the corresponding spikelets. The results showed that the YOLOv8-seg model achieved excellent segmentation performance, with an average precision (AP) @[0.50:0.95] and accuracy (A) of 0.858 and 100%. Meanwhile, the SVM model had good classification performance for the number of grains in spikelets, and the accuracy, precision, recall, and F1 score reached 0.855, 0.860, 0.865, and 0.863, respectively. Mean absolute error (MAE) and mean absolute percentage error (MAPE) were as low as 1.04 and 5% when counting the total number of grains in the frontal view wheat spike images. The proposed method meets the practical application requirements of obtaining trait parameters of wheat spikes and contributes to intelligent and non-destructive spike phenotyping.

1. Introduction

Wheat is one of the most important staple crops in the world [1], and breeding high-yield wheat varieties is extremely important to ensure food security in agricultural production [2,3]. The phenotypic characteristics of wheat spikes, such as the number of spikelets, the number of spike grains, and the 1000-kernel weight, are important indicators reflecting the growth status and wheat yield [4]. Wheat spike phenotyping has extremely important research value for growth management, plant breeding, and yield estimation. Wheat is characterized by an inflorescence with the compound spike, and the wheat spike consists of a rachis and multiple spikelets, and the spikelets are arranged in an orderly fashion on the rachis. Each spikelet contains two or more florets. In general, only 1~3 florets are fertile and develop into grains [5]. The number of spikelets and florets directly affects the seed-setting quantity of wheat. In actual agricultural production, manual field investigation is used to count the wheat spikelets and grains in each spike. The traditional method is time-consuming, laborious, and subjective, which makes it difficult to ensure the accuracy of yield estimation [6,7]. Therefore, it is urgent to conduct wheat spike phenotyping accurately and count the number of grains in each spike in the field using rapid modern intelligent technology in the process of wheat breeding.
In recent years, image analysis technology has been widely used in wheat spike phenotyping with the development of agricultural intelligence [8,9,10,11]. Researchers have carried out an enormous amount of studies on the whole recognition and segmentation of wheat spikes in the field. In terms of traditional image processing methods, Fernandez-Gallego et al. [12] adopted a frequency filter and feature extraction, with different classification techniques, to segment wheat spikes based on RGB images. The results of the manual counting and algorithm counting exhibited high levels of accuracy and efficiency. Carlier et al. [13] automatically segmented the wheat spikes based on superpixel classification by exploiting features from RGB and multispectral cameras, and the support vector machine model yielded satisfactory segmentation and reached 94% accuracy. On the other hand, Zhang et al. [14,15] and Batin et al. [16] used different deep-learning models to realize the target recognition and instance segmentation of wheat spikes. The former research formed a YOLOv5s network with an improved attention mechanism, which can accurately detect the number of small-scale wheat spikes and better solve the problems of occlusion and cross-overlapping of the wheat spikes. The latter research proposed a network called WheatSpikeNet based on Cascade Mask RCNN architecture with model enhancements and hyperparameter tuning to provide state-of-the-art detection and segmentation performance on the SPIKE dataset.
The above researchers only realized the separation of the whole wheat spikes from the field environment, while some research further focused on more detailed wheat spike phenotyping like spikelet or grain. Qiu et al. [17] processed the side-view spike images and pre-annotated the spikelets through an unsupervised method based on the watershed algorithm, and a Faster RCNN model was retrained to detect and count the spikelets in each spike. Zhang et al. [18] used proposed Mask R-CNN models to segment the side-view wheat spikelets, and designed an automatic extraction algorithm for spike phenotypic parameters, including length, width, and the number of grains. Xu et al. [19,20] added an attention mechanism to the segmentation network, realizing a mean squared error (MSE) of 3.13 and a coefficient of determination (R2) of 0.93. However, the spike grain counting strategies of the above research were all based on side-view spikelet segmentation. Simply adding the number of spikelets on both sides of the spike may lead to errors, for a spikelet may contain more than two grains.
Most recent research has focused on the segmentation of wheat spikes from individual or group wheat, but ignored wheat spikes and more detailed structures where plenty of phenotyping information about wheat grain was contained. Due to the irregular and dense distribution of wheat spikelets and grains, the research illustrates more demands on the quality of the phenotyping method. Meanwhile, the researchers do not explore different varieties and growth periods of wheat and mostly rely on a destructive approach in a laboratory environment. Above all, this study proposed an accurate and fast method for wheat spike phenotyping in field environments, which considered different varieties and growth periods of wheat to strengthen practicality and generalization. The specific objectives of this study are as follows: (1) to conduct instance segmentation of the frontal wheat spikelets using a deep learning model; (2) to adopt a machine learning algorithm based on the image features of the wheat spikelets to classify and count the grains of wheat spikes; (3) to validate the performance of the model with different wheat varieties and growth periods.

2. Materials and Methods
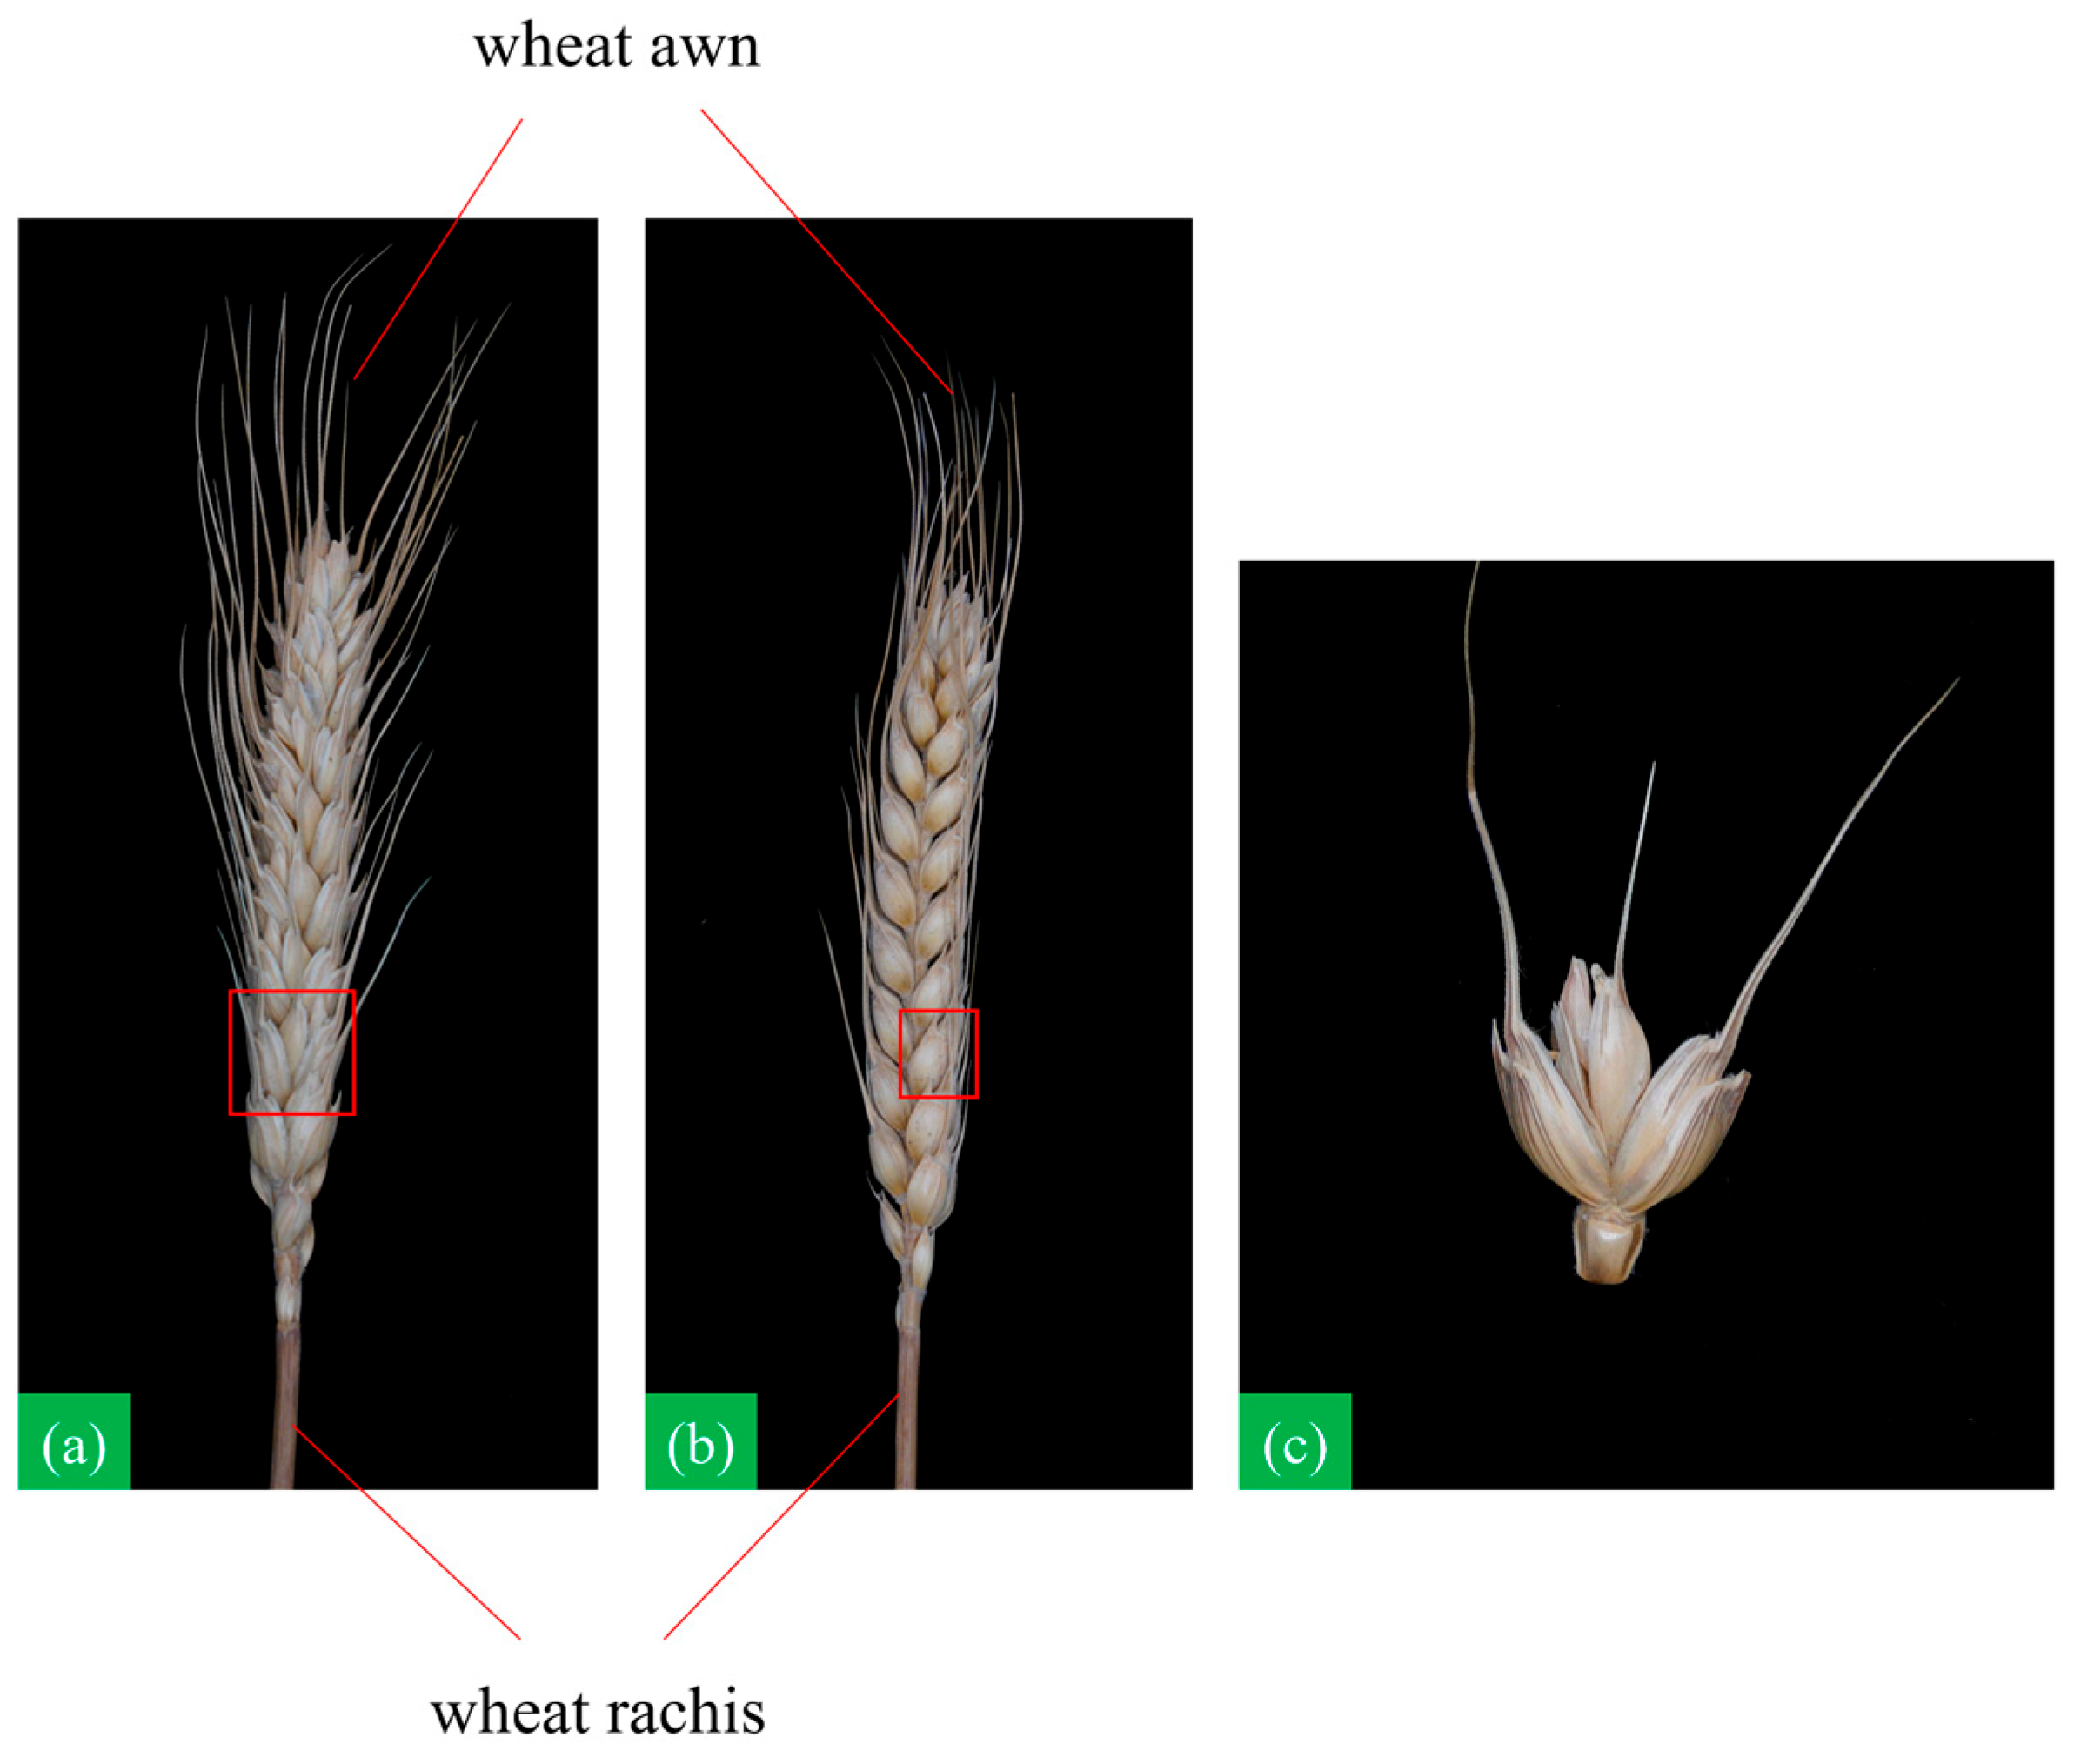
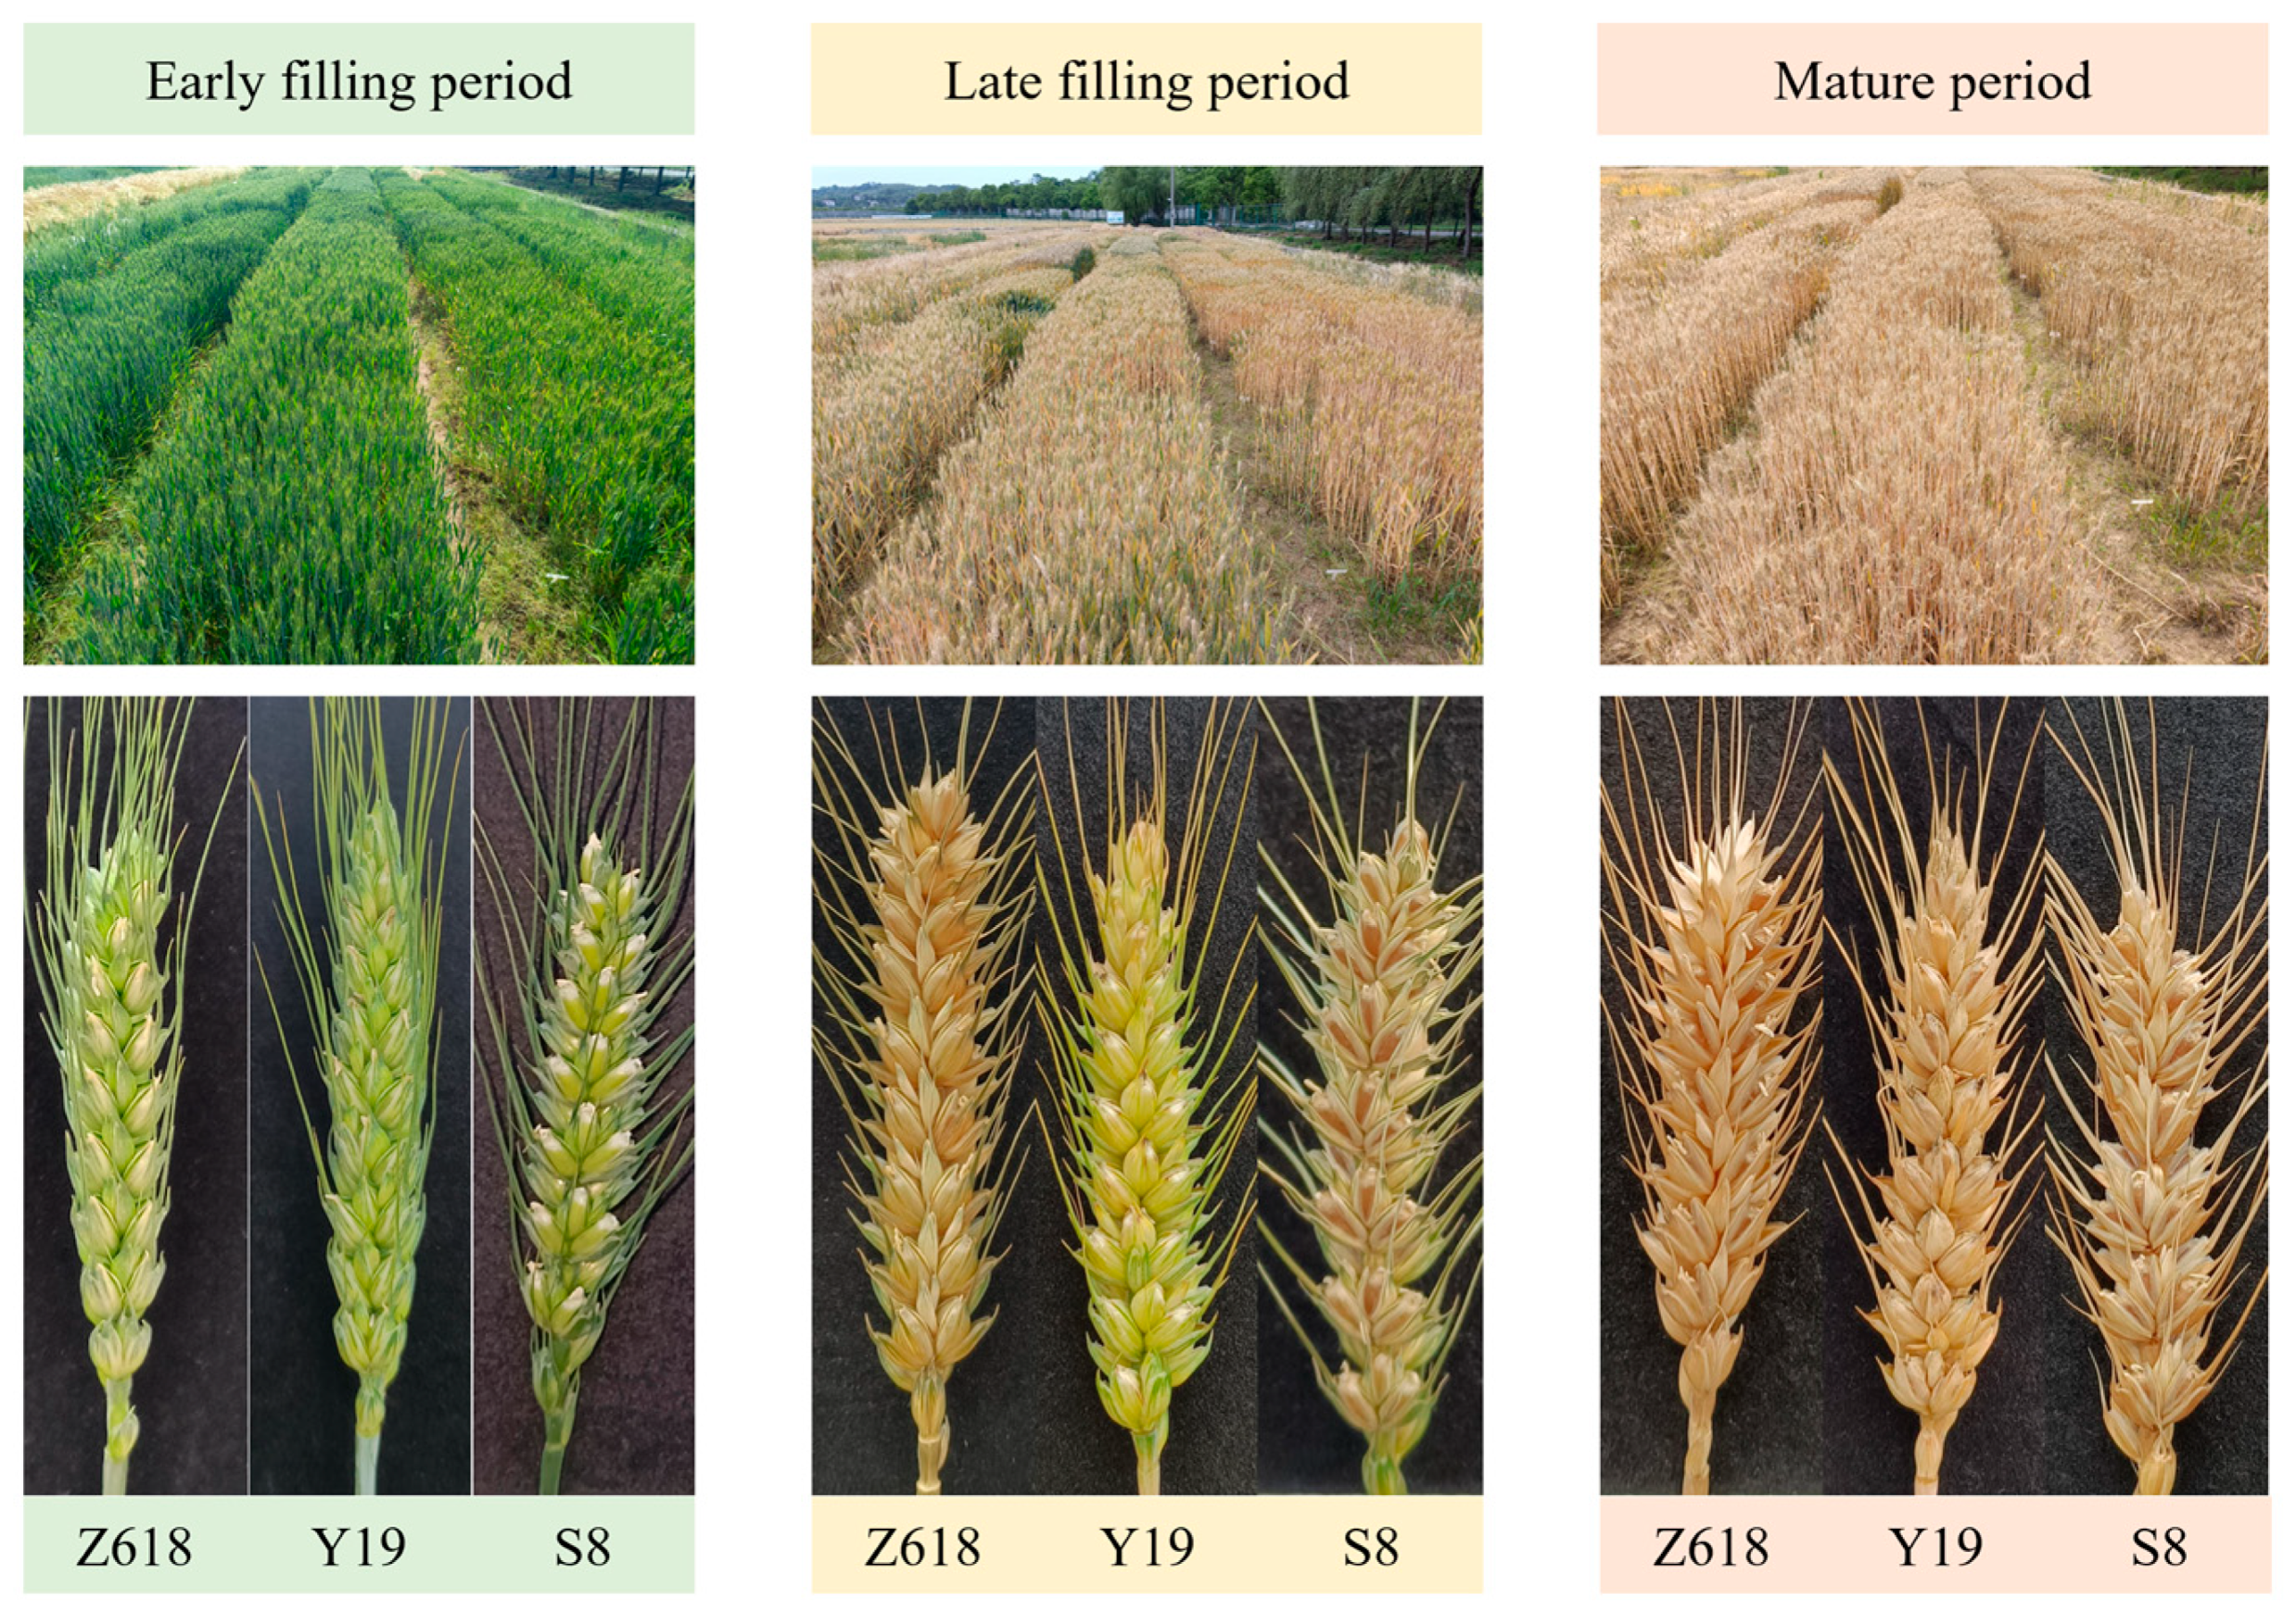
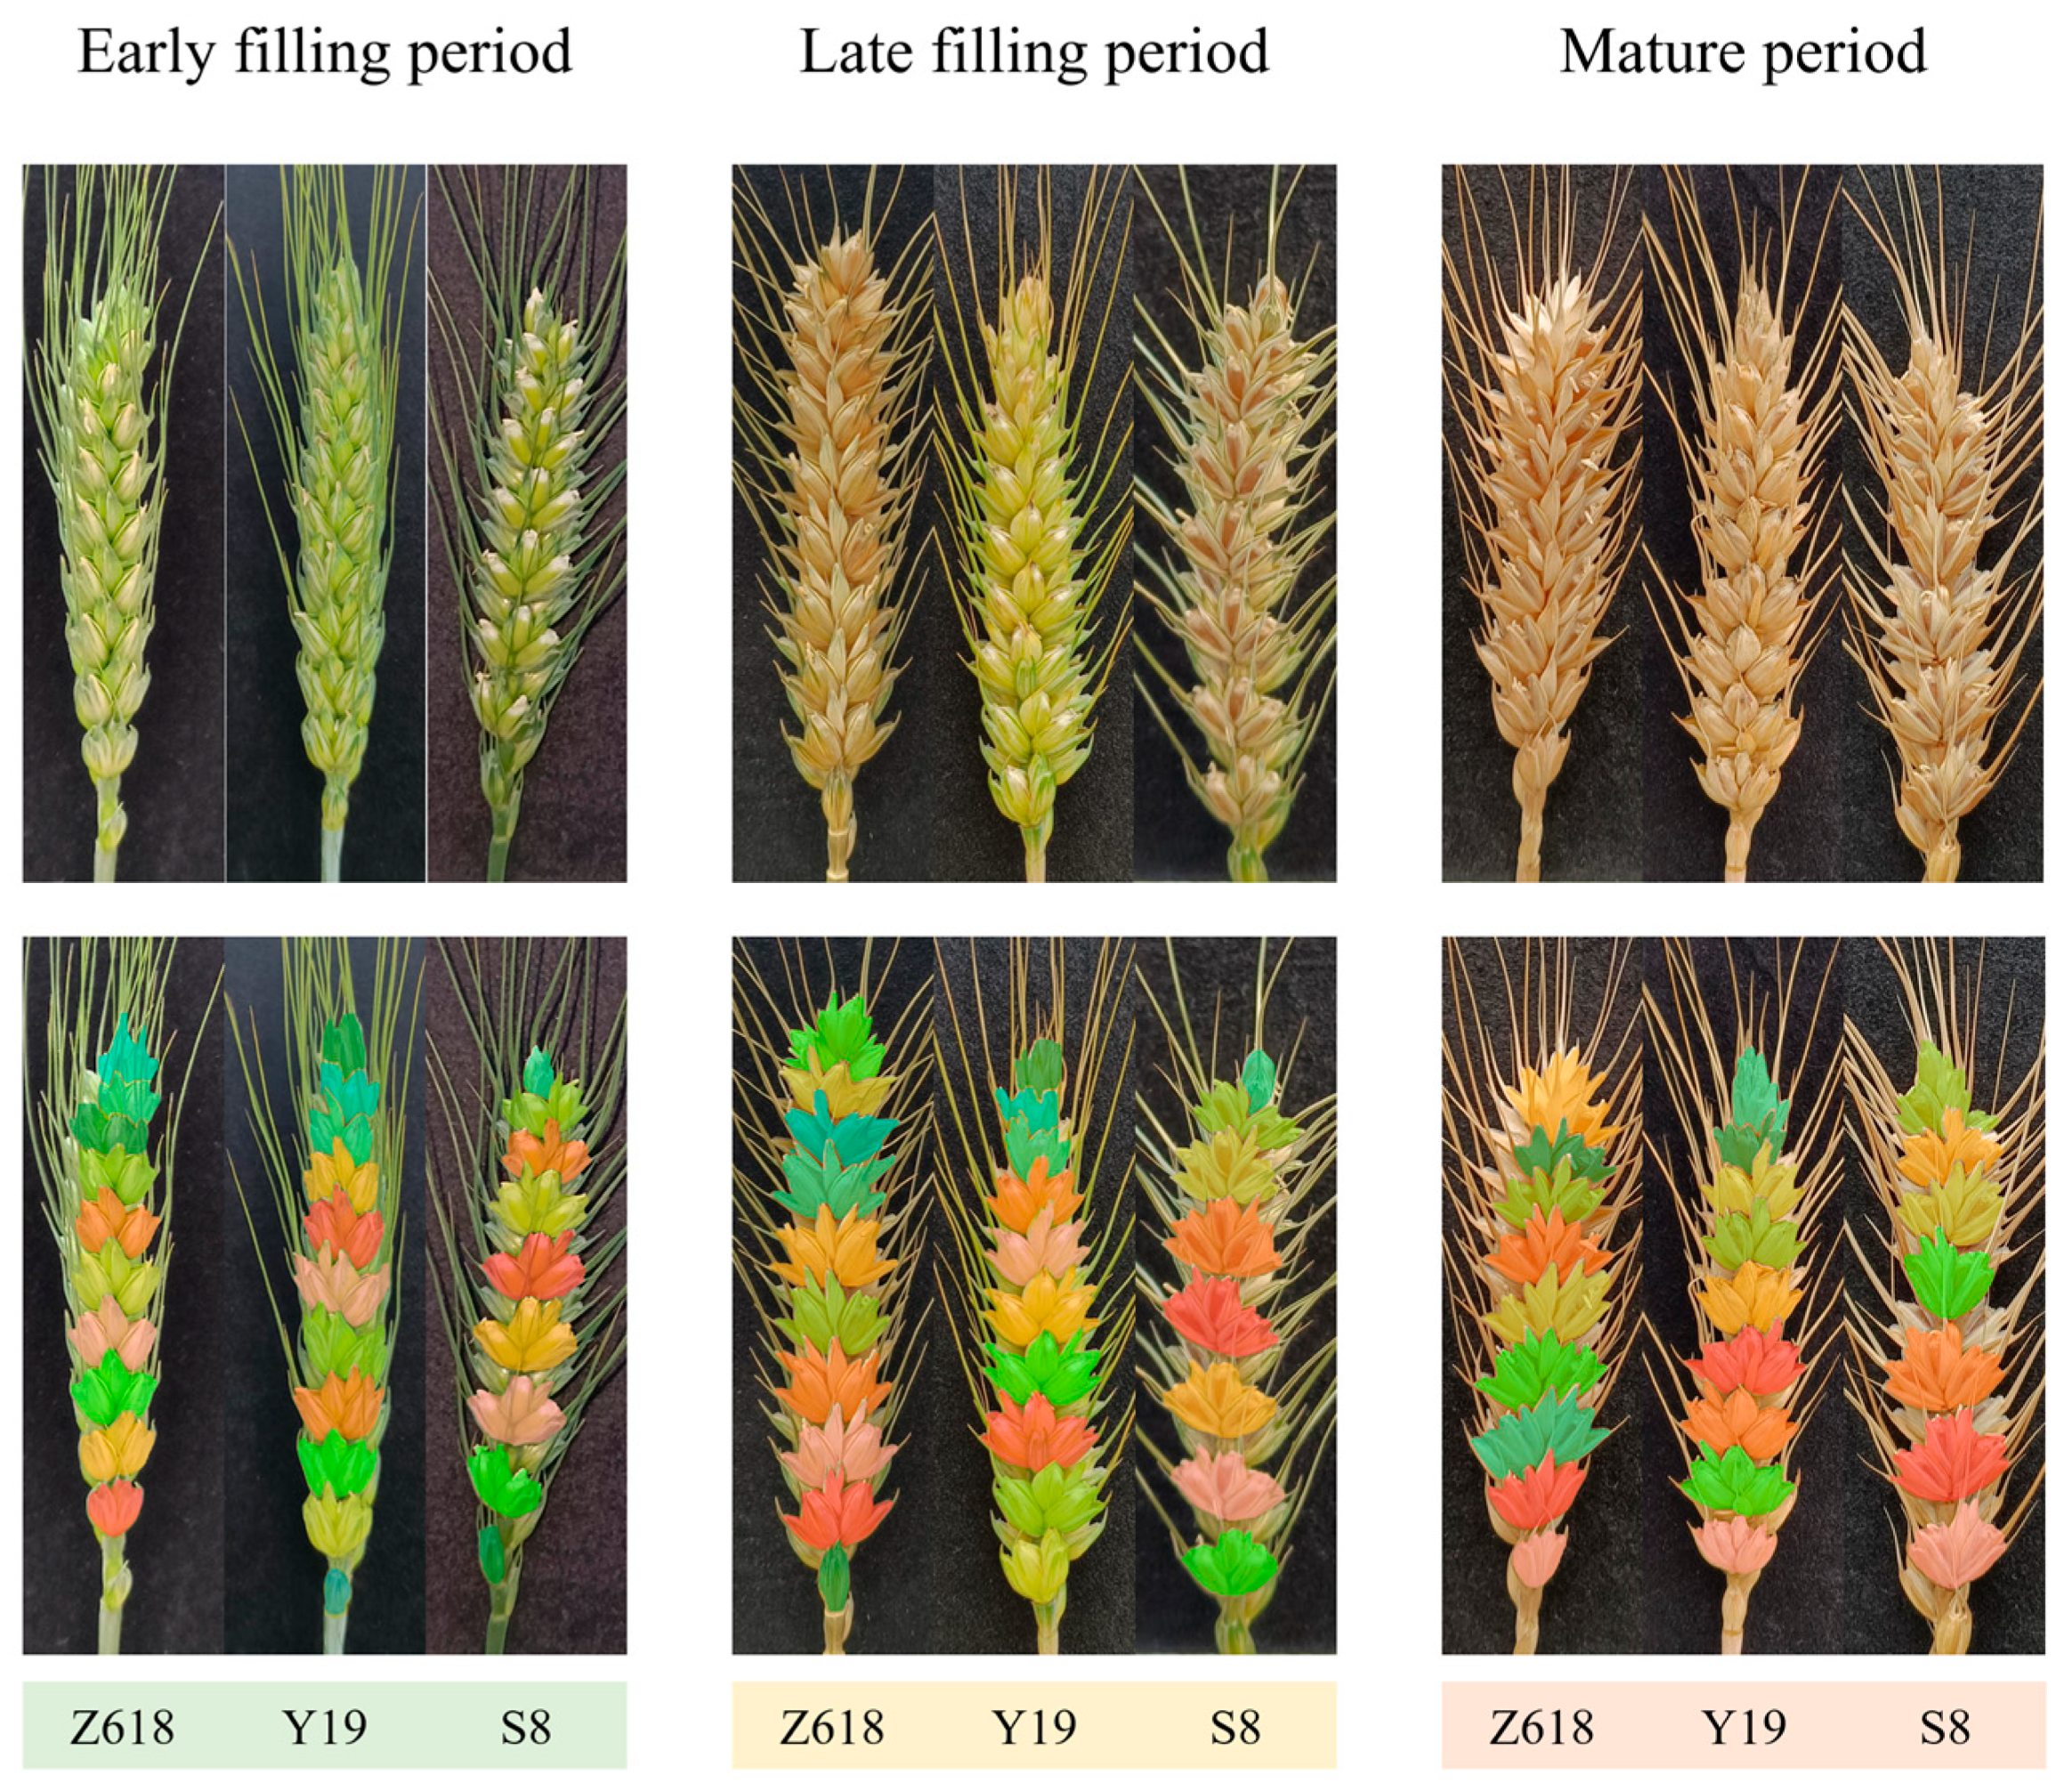
2.1. Wheat Sample

A wheat spike is a symmetrical-like structure, where spikelets are arranged interactively on the spike. At the end of the spikelets, wheat awns are distributed outwards. In Figure 1a,b, one of the spikelets is marked by a red bounding box, and Figure 1c shows a single instance of a wheat spikelet. Every spikelet has the possibility of possessing about 0~3 grains, which is highly related to the yield of wheat. For the sake of more precise phenotyping, this study analyzed the frontal view image of wheat spikes based on three steps: spikelet instance segmentation, grain number classification, and total grain count.
The experiment was conducted in the field at the Agricultural Science Changxing Test Station of Zhejiang University (30°15′ N, 120°13′ E). The wheat varieties involved in this study were “Zhengmai 618” (Z618), “Yannong 19” (Y19), and “Sumai 8” (S8). As shown in Figure 2, the three varieties had obvious differences in appearance. Z618 had plump grains, short awns, and spikelets with clear boundaries. Y19 had moderate awns, and its spikelets were closely distributed on the rachis, resulting in spikelets that occluded each other. S8 had relatively plump grains, long awns, and sparse spikelets. From the perspective of the growth period, the spikes were green at the early filling period, the starch accumulation of wheat grains was completed, and the shape and quantity of grains could be distinguished from the appearance. At the late filling period, the spikes turned from green to yellow and the grains became plump. The spikes turned yellow completely at the mature period. The grains were dehydrated, and their recognizability decreased compared to the filling period.
Wheat samples were collected at the early filling period, late filling period, and mature period on 22 April, 6 May, and 18 May 2022, respectively. The image collection equipment was a Xiaomi K40 smartphone with a resolution of 3472 × 3472 pixels, an aperture size of f/1.79, and a field of view (FOV) of 70 degrees. The sampling distance to the target was 15 cm without an additional light source. To eliminate the influence of the complex field environment and improve the focusing degree of wheat spikes, this study placed wheat spikes in front of a black board when collecting images. A white box with a size of 15 × 15 cm was fixed on the black board for scale calibration, unifying the collected images to the same scale. In total, the collected wheat spike datasets consisted of 450 spike images including 150 images of Z618, 150 images of Y19, and 150 images of S8, which consisted of all the growth periods discussed above.

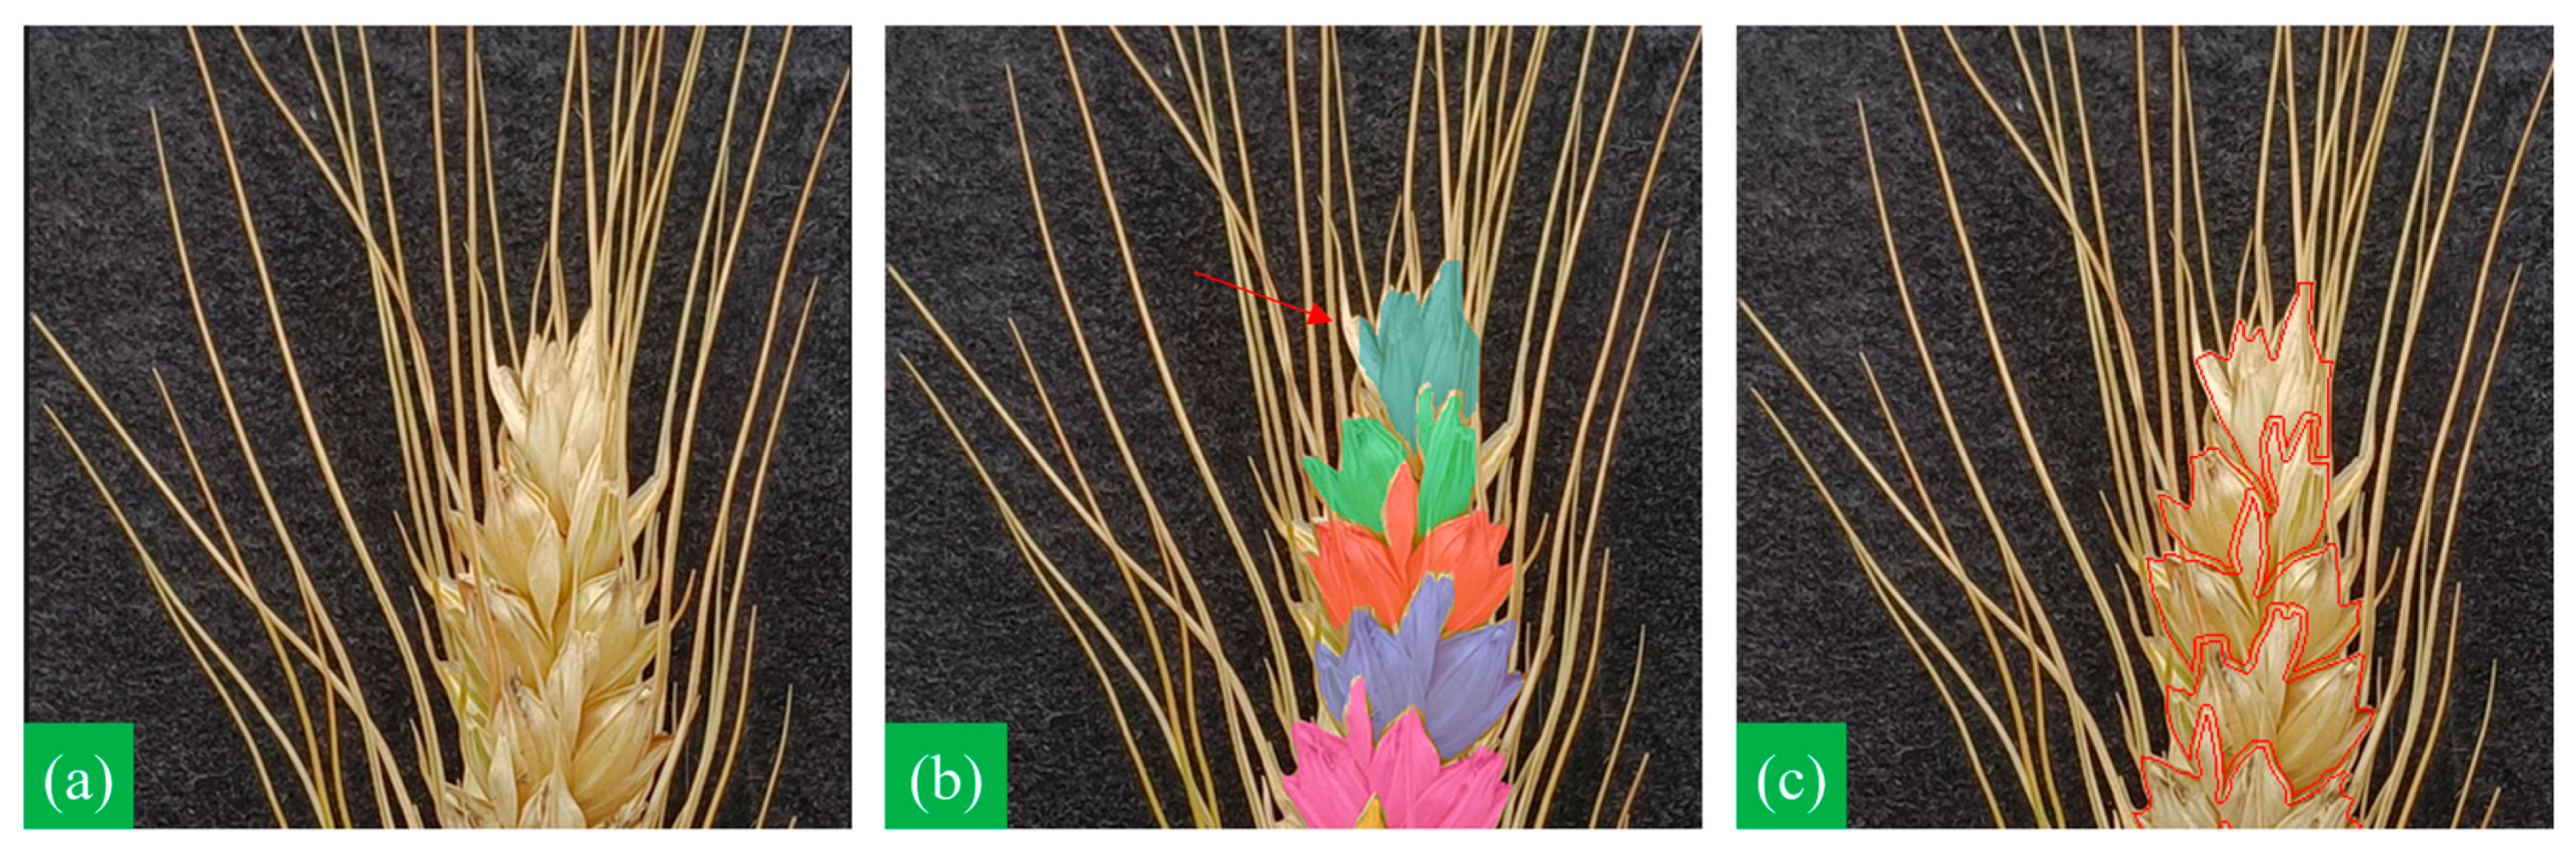
2.2. Spikelet Instance Segmentation Method

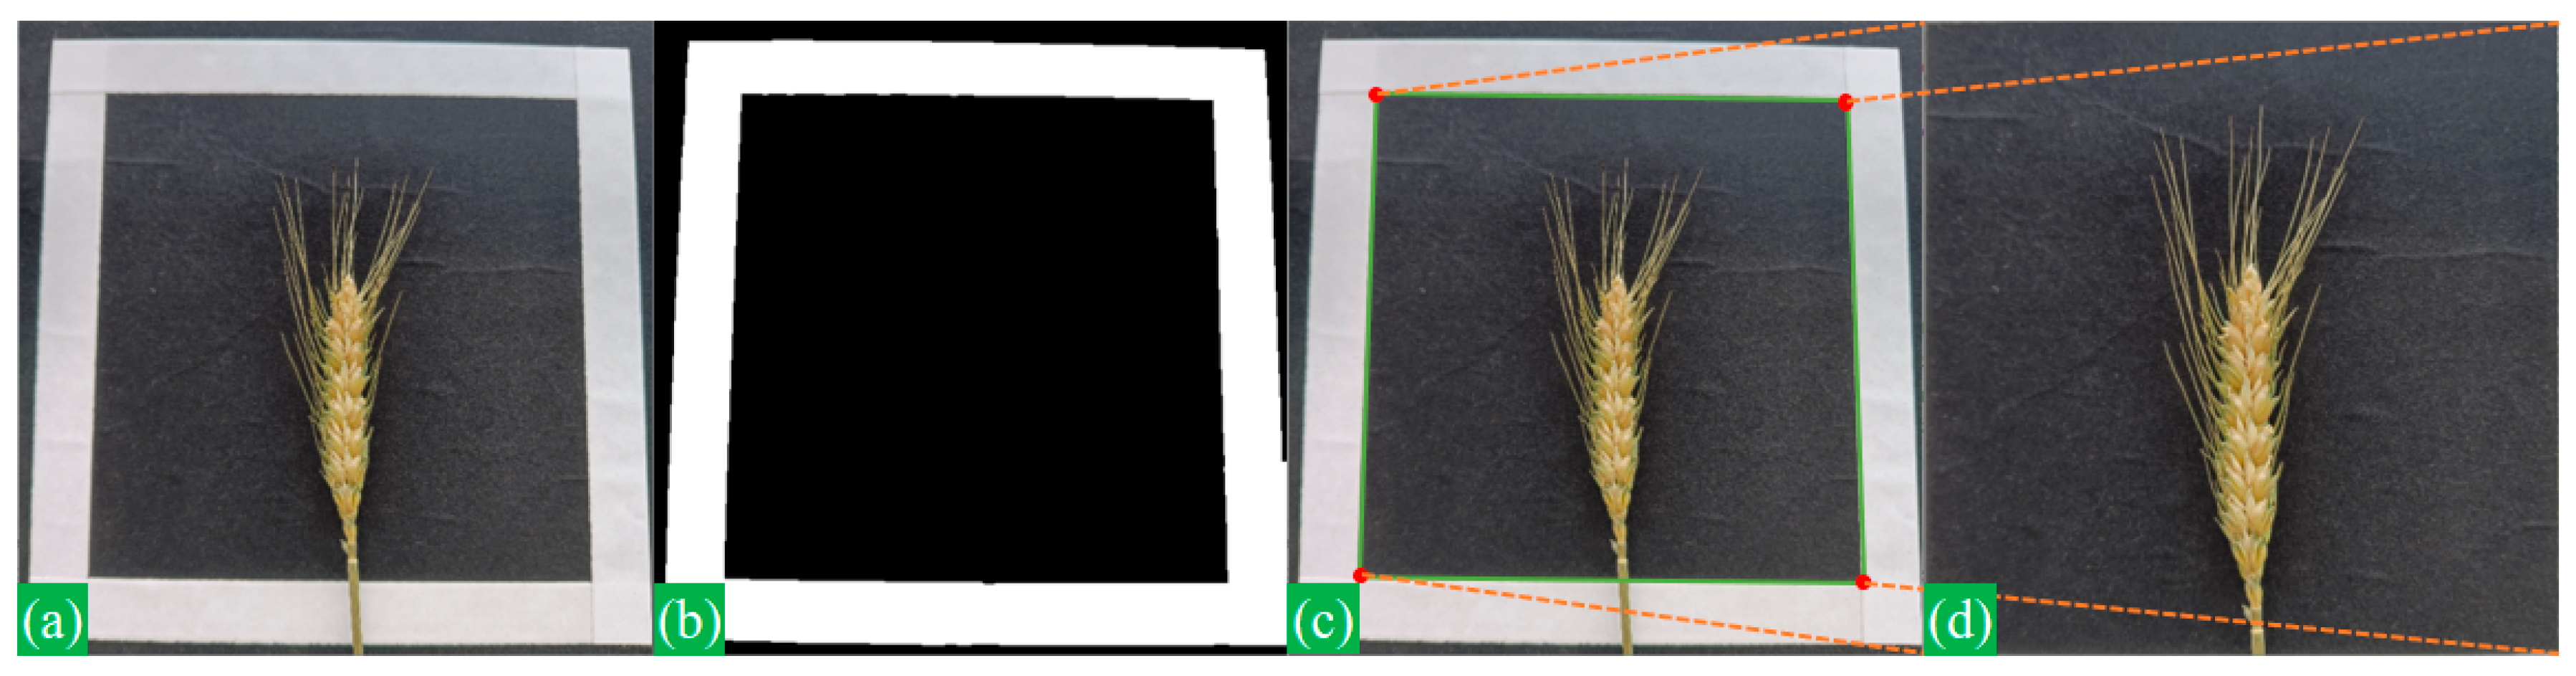
2.2.1. Image Perspective Transformation

As the wheat spike images were collected by a hand-held smartphone camera at different times in the field, the collected images could not be kept uniform in the collection distance and angle [21]. Therefore, varying degrees of perspective distortion appeared, as shown in Figure 3a. To improve the unity of the input images and the accuracy of the segmentation results, this study conducted the perspective transformation on the wheat spike image. The original image was first converted from RGB to grayscale, and the white box of the black board was extracted by the OTSU threshold algorithm. The OTSU algorithm is a method used for automatic image thresholding to separate pixels into two classes based on maximizing the between-class variance. Still, the wheat rachis occluded the bottom of the white box, causing a gap in the white box. A morphological closing operation is used to process the white box to close it, as shown in Figure 3b.
Then, the internal contour of the white box was fitted by the polygonal approximation method. The maximum distance threshold between the contour and the fitting polygon was 0.1 times the contour perimeter. The internal contour of the white box with perspective deformation was fitted as a quadrilateral by polygonal approximation, and the four vertices of the fitted quadrilateral were regarded as the four corner points of the internal contour, as shown in Figure 3c. According to Equation (1), the perspective transformation matrix M was obtained through four pairs of coordinates: the four corner points and their perspective coordinates. Since the perspective transformation deleted some pixels of the image, the size of the perspective image was set as 2400 × 2400 pixels uniformly, where the perspective coordinates of the four corner points were (0, 0), (2400, 0), (0, 2400), and (2400, 2400), respectively. Therefore, the perspective coordinates of each pixel in the spike image were obtained through Equations (1) and (2), and the original spike image was projected to a new unified plane to realize the perspective transformation, as shown in Figure 3d.
x y z = M x y z
M = T 1 T 1 T 1 a 33
where (x,y) are the coordinates of the pixel in the original spike image, z defaults to 1, M is the perspective transformation matrix, and (x’,y’) are the perspective coordinates. T 1 = a 11 a 12 a 21 a 22 is used for the linear transformation, T 2 = a 13 a 23 T is for the perspective transformation, and T 3 = a 31 a 32 is for the image translation.

2.2.2. Image Augmentation

To enhance the model performance and robustness, this study implemented image augmentation for the wheat spike dataset. Every image had a certain probability of passing through the following data augmentation strategy: affine (scaling, translation, rotation, and shear), horizontal flip, brightness, contrast, Gaussian blur, and Gaussian noise.
  • Scaling: Randomly scaling the image within a range of 0.8 to 1.2 times its original size;
  • Translation: Randomly translating the image horizontally and vertically up to 20% of pixels;
  • Rotation: Randomly rotating the image within a range of −15 to +15 degrees;
  • Shear: Randomly applying shear transformations up to 10 degrees;
  • Horizontal Flip: Each image had a 50% chance of being flipped horizontally;
  • Brightness: Randomly adjusting the brightness by a factor ranging from 0.8 to 1.2;
  • Contrast: Randomly adjusting the contrast by a factor ranging from 0.8 to 1.2;
  • Gaussian Blur: Applying Gaussian blur with a kernel size of 5 × 5 with a probability of 30%;
  • Gaussian Noise: Adding Gaussian noise with a variance of 0.01 with a probability of 30%.
Augmentation was executed three times with random probability. The origin dataset was augmented from 450 images to 1800 images, which means every variety of wheat spike increased from 150 images to 600 images.

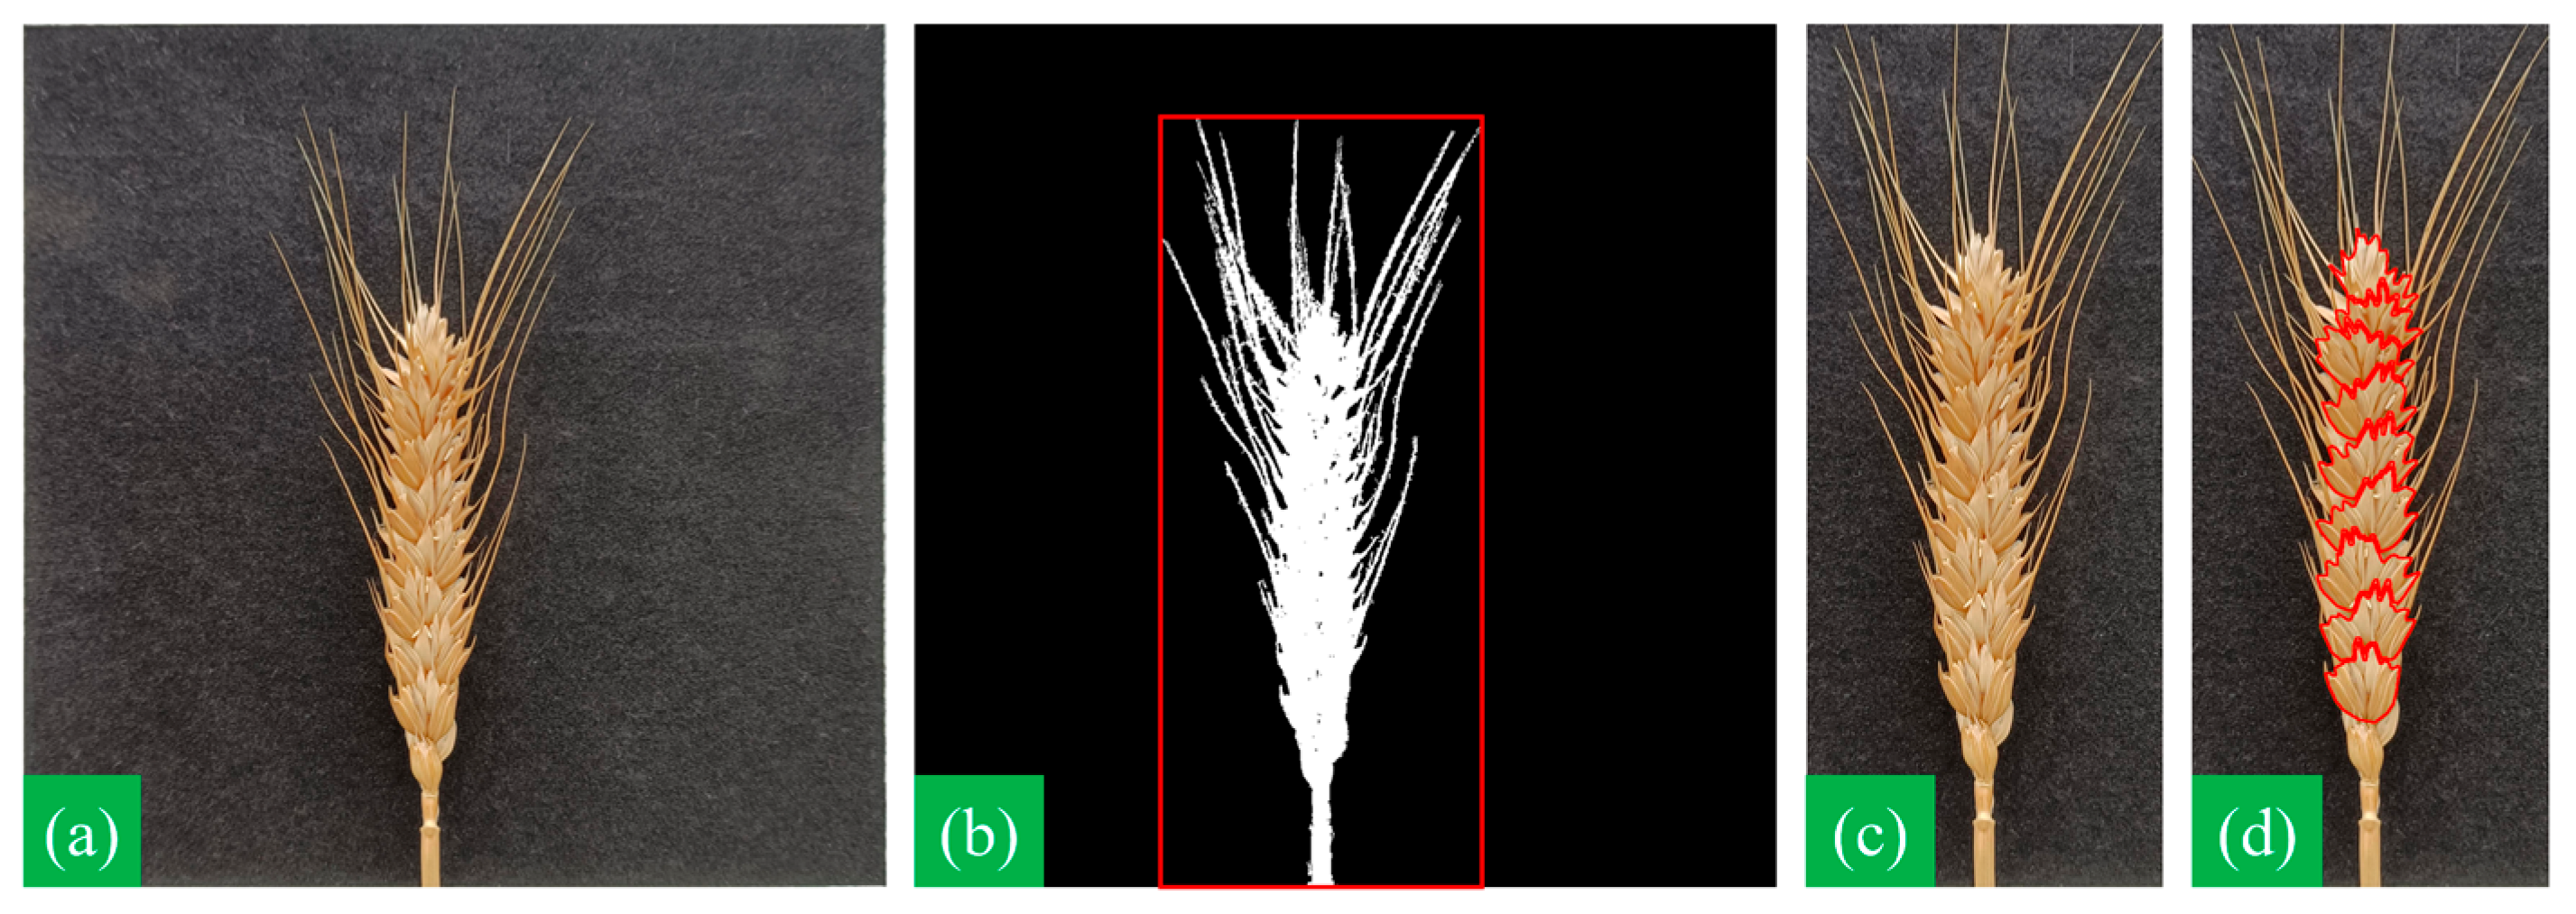
2.2.3. Image Optimization

The sizes of the wheat spike images were 2400 × 2400 pixels after the image perspective transformation. The perspective image had many ineffective background pixels for wheat varieties with shorter awns, such as Z618 and Y19. If the whole images were used as the input data, the calculation amount of the model would be increased and the operation efficiency would be reduced considerably. Therefore, this study preprocessed the perspective image based on the following method to reduce the size of the input images and improve the quality of the input dataset. First, the perspective image Figure 4a was converted from RGB to the HSV color space. Second, the pixels with HSV values ranging from (15, 43, 46) to (77, 255, 255) were selected, where the color of the wheat spike (green to yellow) was mainly distributed. Then, we cropped the perspective image along the bounding rectangle of selected pixels (shown in Figure 4b), and determined the remained region as the input image (shown in Figure 4c). According to the specific shape of each wheat spike, the spike images were reduced from the uniform sizes of 2400×2400 pixels to a horizontal length of 239~2347 pixels and a vertical length of 1482~2400 pixels. This study used Labelme 5.0.1 to annotate the size-optimized images to obtain the labels, as shown in Figure 4d.

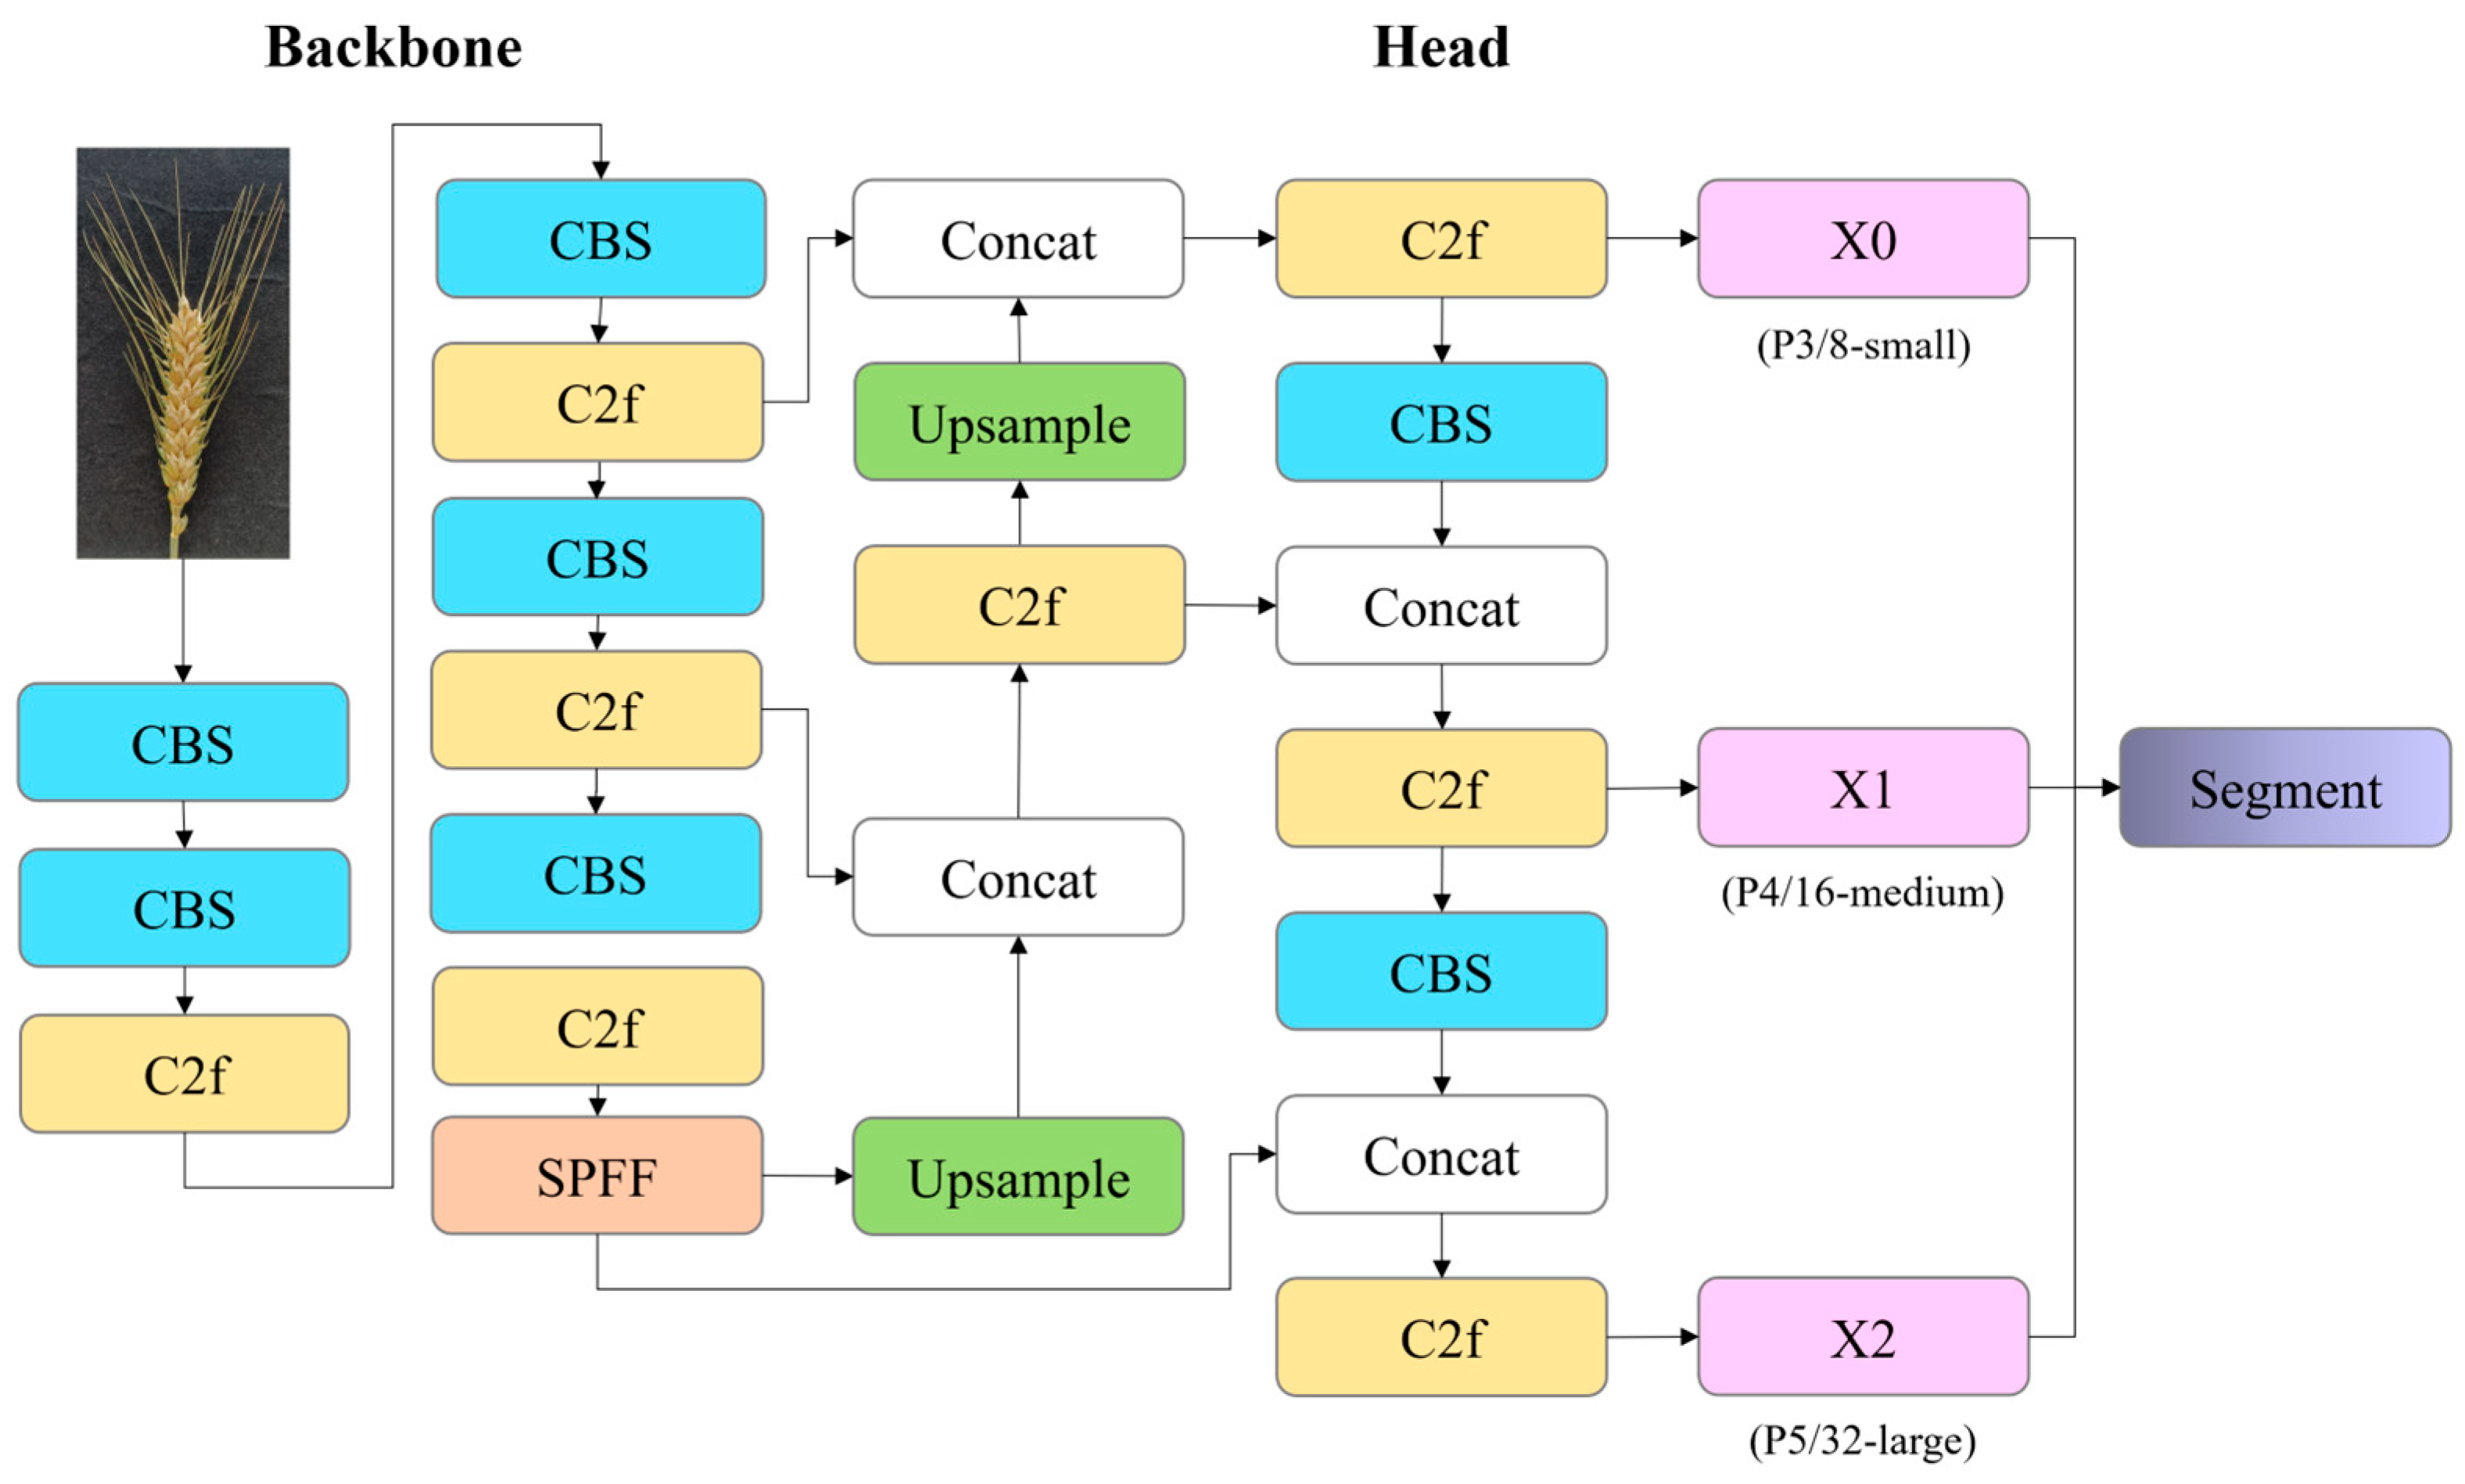
2.2.4. Instance Segmentation Model

Wheat spikelets densely distributed in the spike make it hard for the traditional method to clearly segment the targets. Therefore, a deep learning-based instance segmentation model should be considered. YOLO is a typical model that can be applied to classification, detection, and segmentation tasks and is well known for its speed and accuracy. As a one-stage segmentation model, YOLO inferences the instance directly from the entire feature map without cropping or aligning the region of interest (ROI), which enhances its perception for relatively big targets (>50 × 50 pixels). On the contrary, the two-stage model downscales all ROI masks, potentially losing edge information for wheat spikelets (approximately 50 × 50~200 × 200 pixels). This study adopted a recently published model, YOLOv8-seg, as the instance segmentation model.
As shown in Figure 5, the network extracted features of the images using a backbone consisting of CBS and C2f. CBS was a set of convolution modules, including convolution, batch normalization, and SiLU activation, while the C2f module was for enhancing gradient current. Then, multi-scale features were fused in the head of the network. There were three scales of segment heads at the end of the network for small-scale, medium-scale, and large-scale wheat spikelets. After the segment module, the class of every pixel could be distinguished. This study selected the YOLOv8s-seg model for the balance of accuracy and speed, which was pre-trained on the COCO dataset to improve efficiency and accuracy. The model in this study was finetuned by the training dataset for 100 epochs, and AdamW optimization was selected with a learning rate of 1 × 10⁻³, momentum of 0.9, weight decay of 5 × 10⁻⁴, and batch size of 8.
The input datasets for spikelet segmentation consisted of 1800 spike images in total, including 600 spike images of Z618, 600 spike images of Y19, and 600 spike images of S8. The training and test datasets were divided by 8:2 when segmenting the wheat spike images. The YOLOv8-seg model was trained using Python 3.8.18, PyTorch 1.13.1, and Cuda 11.6 in an NVIDIA GeForce RTX 1080Ti GPU device with 11 GB RAM.

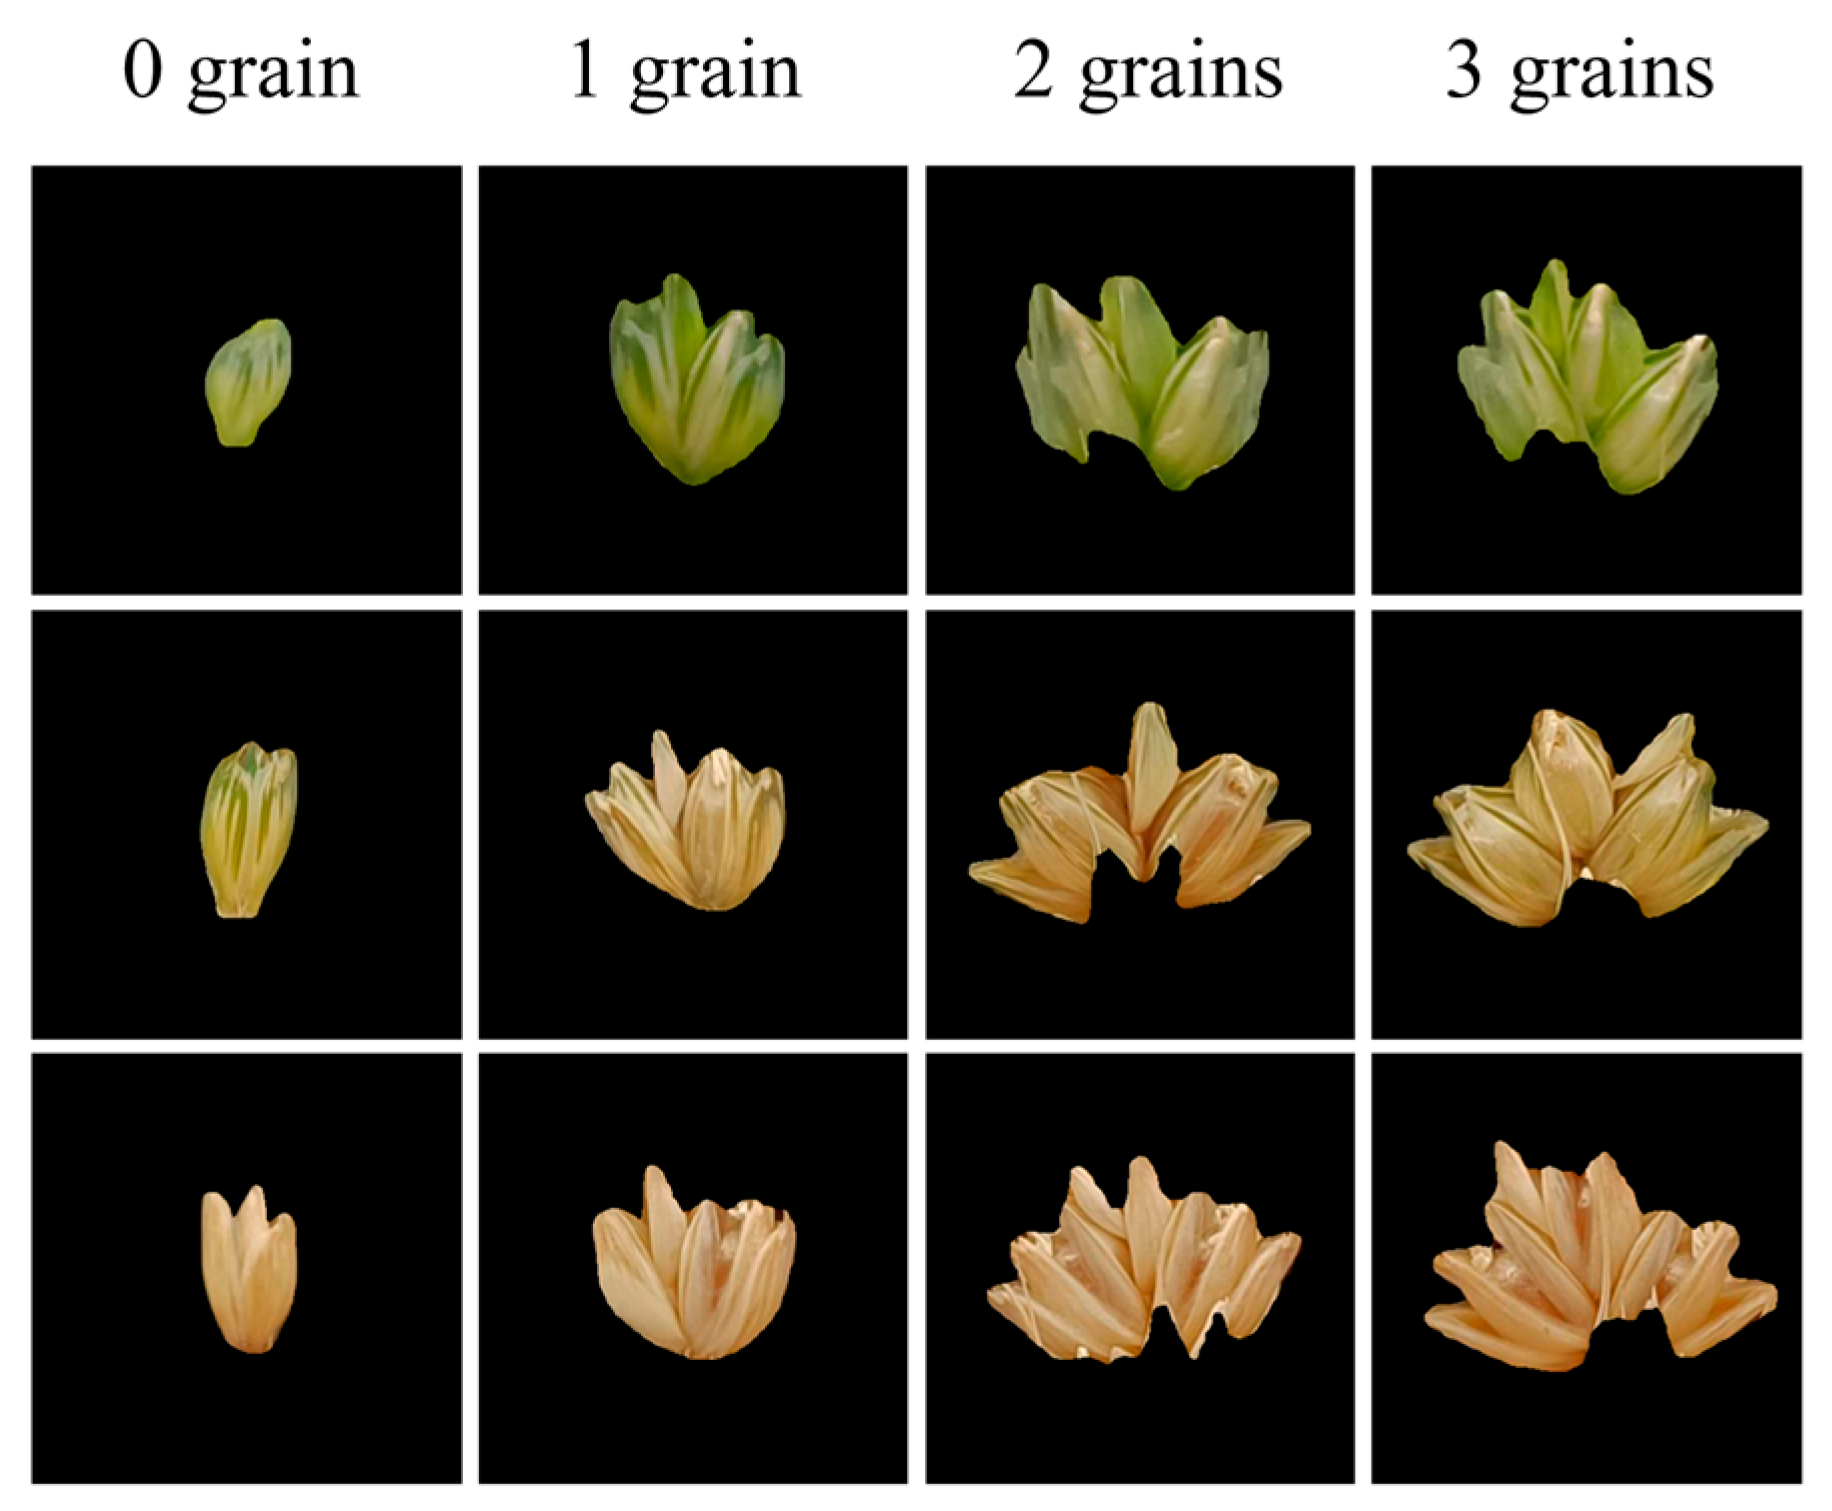
2.3. Wheat Grain Counting Method

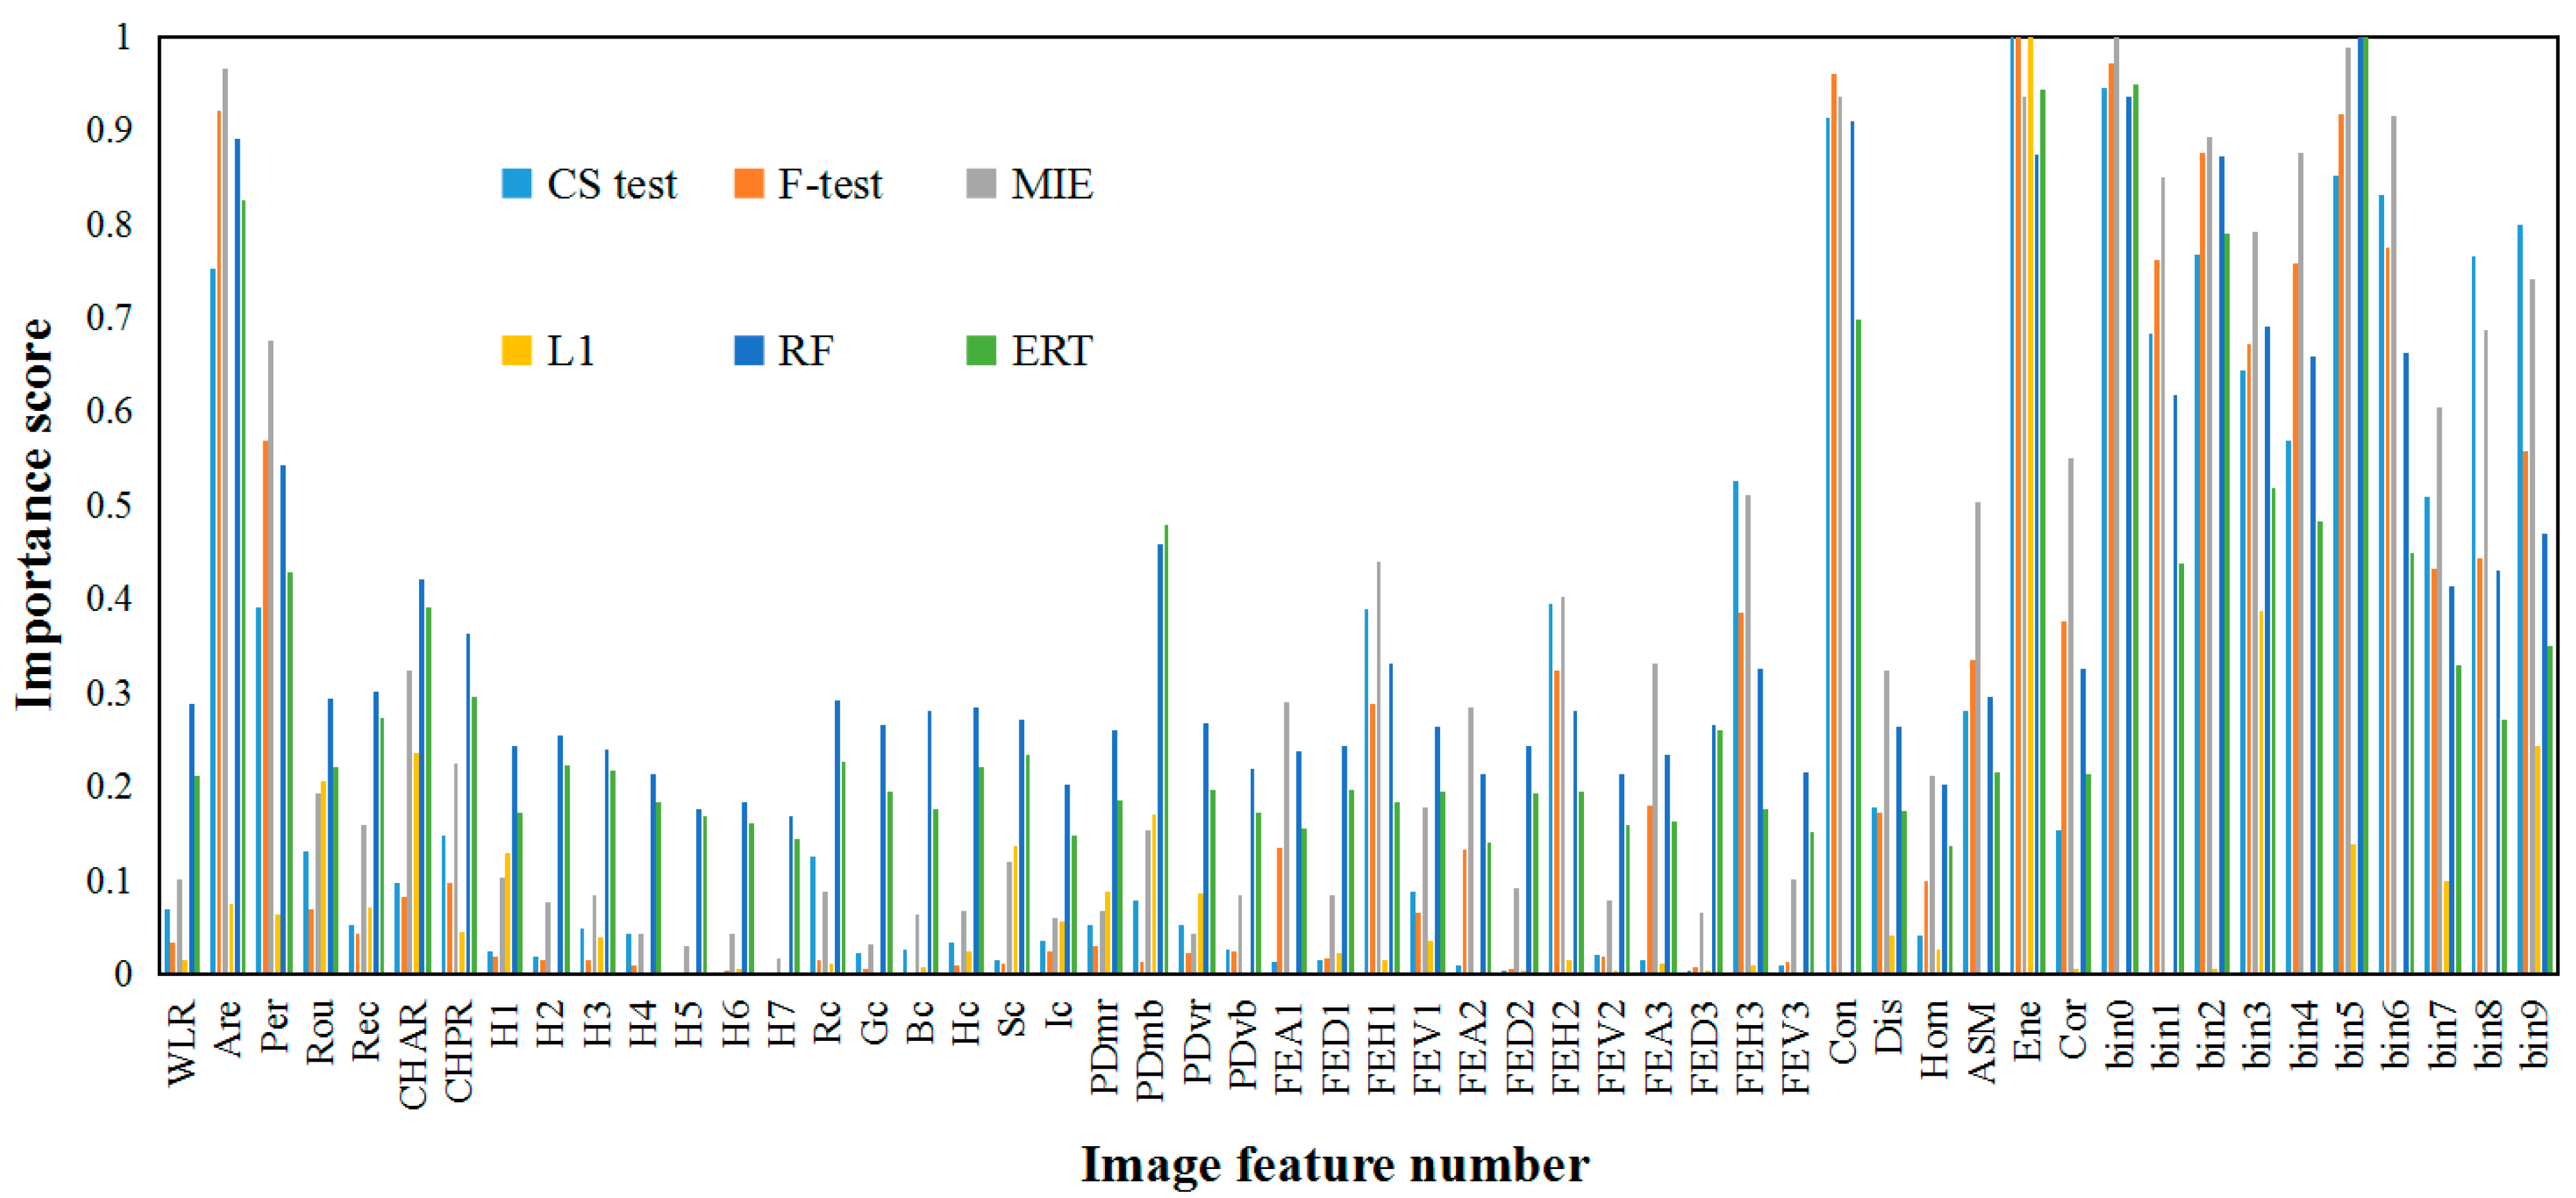
2.3.1. Image Feature Extraction and Selection

All wheat spikelets were extracted separately based on the YOLOv8-seg instance segmentation model. As shown in Figure 6, it was difficult to directly segment the grains from wheat spikelets, because the dense structure and different morphology of grains made it hard for even experts to tell which region belongs to which grain. However, it was possible to empirically distinguish the number of grains in the spikelet. Therefore, the classification method was applied to the counting of grains by extracting image features as input. A single spikelet of the specific variety and growth period generally contained 0~3 wheat grains, and the spikelets with different amounts of wheat grains had differences in shape, color, and texture.
The shape features included width-length ratio (WLR), area (Are), perimeter (Per), roundness (Rou), rectangularity (Rec), convex hull area ratio (CHAR), convex hull perimeter ratio (CHPR), and 7 Hu invariant moments (H1~H7). The color features included 7 average values and 2 variances, involving the average values of the red component (Rc), green component (Gc), blue component (Bc), hue component (Hc), saturation component (Sc), brightness component (Ic), G-R (PDmr), and G-B (PDmb), and the variances of G-R (PDvr) and G-B (PDvb) [22]. The texture features included 12 two-dimensional Discrete Wavelet Transform features, 6 Gray Level Co-occurrence Matrix features, and 10 uniform rotation-invariant features of Local Binary Patterns. The two-dimensional Discrete Wavelet Transform features consisted of low-frequency textures (FEA1, FEA2, and FEA3), diagonal textures (FED1, FED2, and FED3), horizontal textures (FEH1, FEH2, and FEH3), and vertical textures (FEV1, FEV2, and FEV3) at the first, second, and third levels [23]. The Gray Level Co-occurrence Matrix features consisted of contrast (Con), dissimilarity (Dis), homogeneity (Hom), angular second moment (ASM), energy (Ene), and correlation (Cor) [24]. The uniform rotation-invariant features of Local Binary Patterns consisted of bin0, bin1, bin2, bin3, bin4, bin5, bin6, bin7, bin8, and bin9 [25].
In this study, different feature selection methods were further used to obtain the most important features from all 52 spikelet image features, including chi-square (CS) test, F-test, mutual information entropy (MIE), L1 regularization (L1), random forest (RF), and extremely randomized trees (ERT). After feature selection, the spikelet image features lost a little effective information, but it could enhance the interpretability of the model and improve the classification efficiency, which had important research and application value in actual agricultural production.

2.3.2. Grain Counting Model

This study extracted 52 shape, color, and texture features from each spikelet image according to the above image feature extraction. The categories of the spikelet grain quantities were classified by the corresponding spikelet image features through the machine learning algorithm, and the number of the grains in frontal view spike image was counted by adding the number of grains in the corresponding spikelets, as shown in Figure 7. For the sake of determining the optimal method for grain number classification, this study adopted 7 machine learning models, including SVM, Decision Tree (DT), random forest (RF), Gradient Boosting Decision Tree (GBDT), K-Nearest Neighbor (KNN), Naive Bayes (NB), and Linear Discriminant Analysis (LDA). The training and test datasets were divided by 8:2 when modeling the number and image features of wheat spikelet grains.

2.4. Model Evaluation

2.4.1. Evaluation of Instance Segmentation Model

The loss of the instance segmentation model is used to measure the inconsistency between the actual and predicted values, and the model performance is improved as the loss decreases. The loss involves five aspects of calculation, including bounding box loss, segmentation loss, classification loss, and distribution focal loss. This study adopted the precision, recall, and AP of the COCO dataset to evaluate the segmentation performance of the YOLOv8-seg model, and AP values included AP@[0.50] and AP@[0.50:0.95] of the mask image. AP@[0.50] was calculated by fixing the intersection over union (IoU) at 0.5 and AP@[0.50:0.95] was the average precision when the IoU ranged from 0.5 to 0.95 with an interval of 0.05. In addition, this study adopted the accuracy (A) of the category to evaluate the classification performance of the model. The predicted category of a single wheat spike depended on the mode of the predicted categories of all the corresponding spikelets.

2.4.2. Evaluation of Grain Counting Model

The accuracy, precision, and F1 score were used to evaluate the performance of the grain counting model. The F1 score is an indicator used to measure the accuracy of the dichotomous (or multitask dichotomous) model in statistics, which takes into account effectively both precision and recall of the classification model. For the evaluation of the grain counting model, true positive (TP) represents the number of spikelets that correctly predicted the grain quantity category, false negative (FN) represents the number of spikelets that predicted the current category as the other categories, and false positive (FP) represents the number of spikelets that predicted the other categories as the current category. Furthermore, the receiver operating characteristic curve (ROC) can visually display the performance of the grain counting model, with each point on the curve reflecting the sensitivity to the same signal stimulus. The area under the ROC curve is defined as AUC. The higher the AUC value, the better the overall performance of the grain counting model.

3. Results and Discussion

3.1. Segmentation Results of Wheat Spike

This study used the YOLOv8-seg instance segmentation model to segment wheat spike images from four datasets, including the Z618 dataset, the Y19 dataset, the S8 dataset, and the total dataset containing three varieties (TV). The training loss curves of the four datasets tended to be converged and stable when YOLOv8-seg models were trained to the 70th epoch, and the training loss of segmentation was reduced to about 0.8 at the 70th epoch. The instance segmentation results of YOLOv8-seg models for different datasets are shown in Table 1. According to Table 1, the model trained by Z618, Y19, S8, and TV datasets showed great segment performance, where the precision and recall were all above 0.97, with some even up to 0.99, indicating high accuracy and sensitivity to wheat spikelet area. Under conditions with an IOU threshold of 0.5, the AP of the model equaled 0.98~0.99. A more stringent IOU threshold, between 0.5 and 0.95, reduced the AP to around 0.85, but still within the range available for wheat spikelet segmentation. Compared to other research based on similar experiment settings, Xu et al. [19] achieved recall of 0.9116 and precision of 0.9204 using CBAM-HRNet, a network based on stage structure, parallel convolutional branching, and multi-resolution fusion modules. Geng et al. [20] realized recall of 0.9130 and precision of 0.9257 based on TransUNet. The comparison results showed that the YOLOv8-seg model adopted in this study fitted the task well and achieved good instance segmentation performance.
The Z618 and Y19 datasets shared the best segmentation performance among single variety datasets, which was mainly because these two varieties of wheat spike both had plump grains, short awns, and spikelets with clear boundaries. The S8 spikes had the longest and thickest awns, which often easily occluded parts of the spikelets, especially during the late filling period. This resulted in more incorrect results between the spikelets and awns segmented by the YOLOv8-seg model. As shown in Figure 8, there were occasions when the model ignored or misidentified the pixels of the wheat spikelet on the top of the spike. Meanwhile, when viewed from the front, the S8 spikelets on the front and back were staggered on the rachis due to the sparse distribution of spikelets. The frontal spikelets were often segmented wrongly as the back ones, and vice versa. Therefore, the S8 dataset performed worst among all the datasets, especially in the recall indicator, which fell to 0.973.
The TV dataset combined with all three varieties performed equally well. The precision of the model maintained 0.994 and the recall reached 0.979. Meanwhile, the AP of the TV dataset was higher than those of all the Z618, Y19, and S8 datasets. AP@[0.50] and AP@[0.50:0.95] reached 0.993 and 0.858, respectively, and the higher AP values indicated that the segmentation performance of wheat spikelets could be improved by combining three datasets of different varieties. On the one hand, the TV dataset contained more wheat spike images than the Z618, Y19, and S8 datasets, and the YOLOv8-seg model learned more spikelet features from the extra spike images. On the other hand, the TV dataset contained more wheat varieties than the Z618, Y19, and S8 datasets. Although the spikelets were different in morphology for the three varieties, there were still many similar image features for these spikelets. The YOLOv8-seg model could extract complementary image features from the three varieties of wheat spikes, which was conducive to spikelet segmentation. Therefore, the overall instance segmentation performance was optimal for the YOLOv8-seg model trained by three varieties of wheat spikes, as shown in Figure 9. The average segmentation time of the model was 40 ms, which indicated that the YOLOv8-seg model provided technical support for fast and accurate wheat spike segmentation.
For the Z618, Y19, and S8 datasets, the wheat spike images were classed into four categories, including the background, wheat spikes at the early filling period, wheat spikes at the late filling period, and wheat spikes at the mature period. For the TV datasets, the wheat spike images were classed into the background and nine categories of spikes, including Z618efs, Z618lfs, Z618ms, Y19efs, Y19lfs, Y19ms, S8efs, S8lfs, and S8ms. The category of the wheat spike was determined by the mode of the predicted categories of all the corresponding spikelets using the YOLOv8-seg model. As shown in Table 1, the Z618, Y19, S8, and TV datasets achieved very high precision for predicting categories of wheat spikes, and all the A values reached 100%. Such excellent classification performance was caused by the following reasons. The main reason was that this study used the mode of the predicted categories of all the spikelets to represent the category of the corresponding wheat spike, which could effectively eliminate a small part of the wrong predicted categories of the spikelets and greatly improve the precision. As for the Z618, Y19, and S8 datasets, there were clear differences in appearance for the wheat spikes, including color, size, and texture. The wheat spikes had characteristic bright green and golden yellow bodies at the early filling and mature periods, respectively. The size of the wheat spikes reached the maximum at the late filling period. The spike textures also changed significantly along with the advance of the wheat growth period, such as regularity, contrast, coarseness, directionality, etc. As for the TV dataset, the YOLOv8-seg correctly predicted the categories of most spikelets in one single wheat spike due to some differences in appearance for the three varieties of wheat. Therefore, the increase in the number of categories did not reduce the precision of the TV dataset.

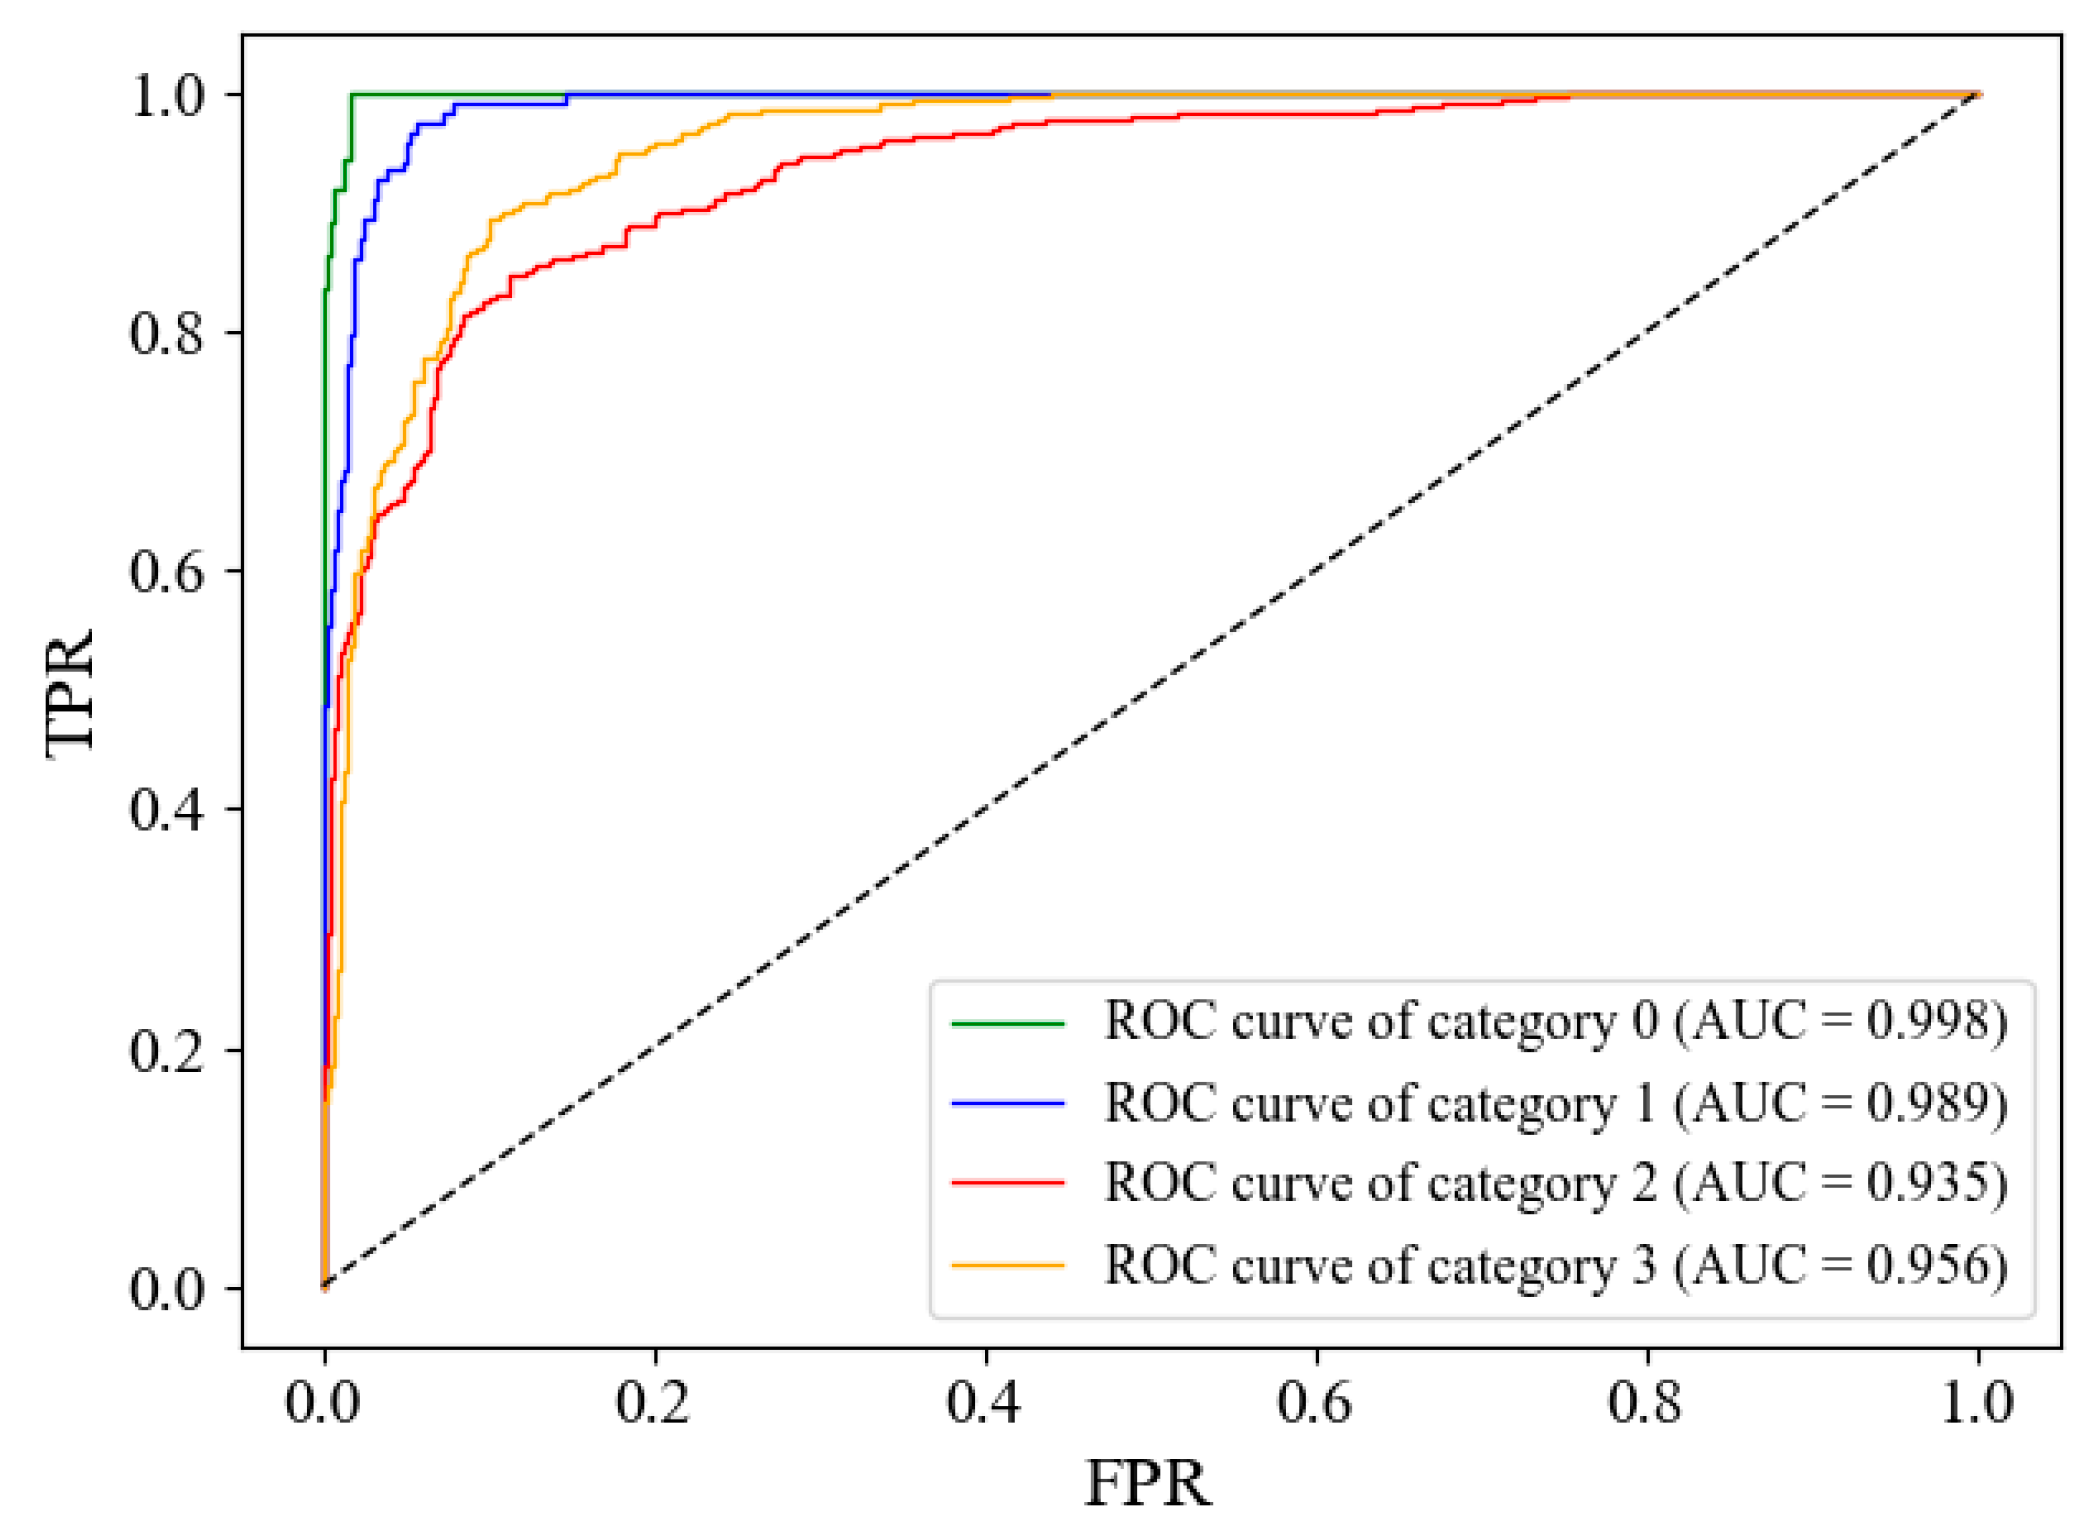
3.2. Classification Results of Spikelets

This study used different machine learning models to count the wheat grains of segmented spikelets based on the 52 spikelet image features involving shape, color, and texture features. In this study, 450 wheat spike images were collected from the field, and a total of 4193 spikelets were segmented with the number of grains per spikelet between 0 and 3 through the instance segmentation of the YOLOv8-seg model.
As shown in Table 2, the training and testing accuracy of seven machine learning models, including SVM, DT, RF, GBDT, KNN, NB, and LDA, were all above 0.7, which proved that the 52 image features of the spikelets had a strong correlation with the number of their grains. The accuracy, precision, recall, and F1 score of the NB, LDA, and DT were relatively lower than those of the other four models. The results demonstrated that there was a complex nonlinear correlation between 52 image features of the spikelets and the number of their grains. The logical structures of the above three models were too simple to fully explore the nonlinear correlation, resulting in more misclassification between neighboring categories with insignificant differences in image features and lower accuracy in training and testing datasets. The KNN model improved the classification accuracy for different grain quantities by increasing the number of nearest neighbors appropriately, and the model was less insensitive to abnormal spikelet image features than other models. The RF model introduced randomness in the classification decision for different grain quantities to decrease the possibility of overfitting problems, and also realized the classification of high-dimensional spikelet image features without dimension reduction. GBDT model accumulated the classification results of multiple decision trees to count the number of spikelet grains and reduced classification losses along the direction of the fastest gradient decline of the square loss function.
Therefore, KNN, GBDT, and RF had improved classification performance in accuracy, precision, recall, and F1 score of training or testing datasets. The SVM model solved the linear inseparability problem of high-dimensional spikelet image features through the kernel function and avoided the overfitting problem caused by outliers by introducing a penalty slack variable. This study adopted the radial basis function to map high-dimensional spikelet image features and determined its optimal parameters, with the penalty slack variable as 1 and the kernel function parameter as 0.02 through the grid search method. The SVM model achieved the best classification performance among the seven machine learning models. The accuracy of training datasets, and the accuracy, precision, recall, and F1 score of testing datasets reached 0.870, 0.855, 0.860, 0.865, and 0.863, respectively.
In order to further explore the feasibility and stability of SVM performance in the classification of spikelet grain quantities, this study obtained the confusion matrices and ROC curves, as shown in Figure 10 and Figure 11. The confusion matrices demonstrated that almost all wrong classifications appeared in neighboring categories. The spikelets containing zero or one wheat grain had low classification errors. However, the spikelets containing two grains were easily predicted as those containing three grains and vice versa. The AUC values of ROC curves also verified that the SVM model had better classification results for the spikelets containing zero and one grain, and it had slightly worse results for the spikelets containing two and three grains. Some of the spikelets containing two and three grains had certain similarities in the extracted image features, resulting in larger classification errors of the latter two categories of spikelets. Despite all that, the SVM model still achieved excellent overall classification performance in accuracy, precision, recall, and F1 score, and was stable. It is feasible to classify the spikelet grain quantities by the machine learning model with the spikelet image features as inputs.
The feature importance scores obtained by the six feature selection methods in Figure 12 show that there were different degrees of importance for the 52 image features in the classification of spikelets. From the overall analysis, the correlation between texture features and grain number was the highest, while the correlation between color features and grain number was the lowest. In more detail, the features that were highly correlated with grain number were Are, Per, CHAR, CHPR, FEH1, FEH2, FEH3, Con, Ene, and bin0~bin9. The features that were weakly correlated with grain number were WLR, H1~H7, Ic, FED3, FEV3, and Hom. This study set the importance score threshold at 0.2 to select more correlated features from all 52 spikelet image features. The classification results of the spikelets are based on selected features and the SVM model, as shown in Table 3.
The SVM models with the image features selected by the CS test and F-test had the worst overall performance in predicting the grain number of spikelets. MIE, L1, and ERT had more advantages in mining nonlinear correlation, thus the SVM models with the image features selected by the above three methods had superior performance. The overall performance in classifying spikelets based on the features selected by RF was closest to that achieved when classifying spikelets based on all features. The accuracy of training datasets and the accuracy, precision, recall, and F1 score of testing datasets reached 0.838, 0.840, 0.843, 0.845, and 0.844, respectively. RF removed nearly half of the unimportant features and improved the efficiency of the SVM model. Therefore, the feature selection method, RF, achieved the best comprehensive performance in classification efficiency and accuracy.

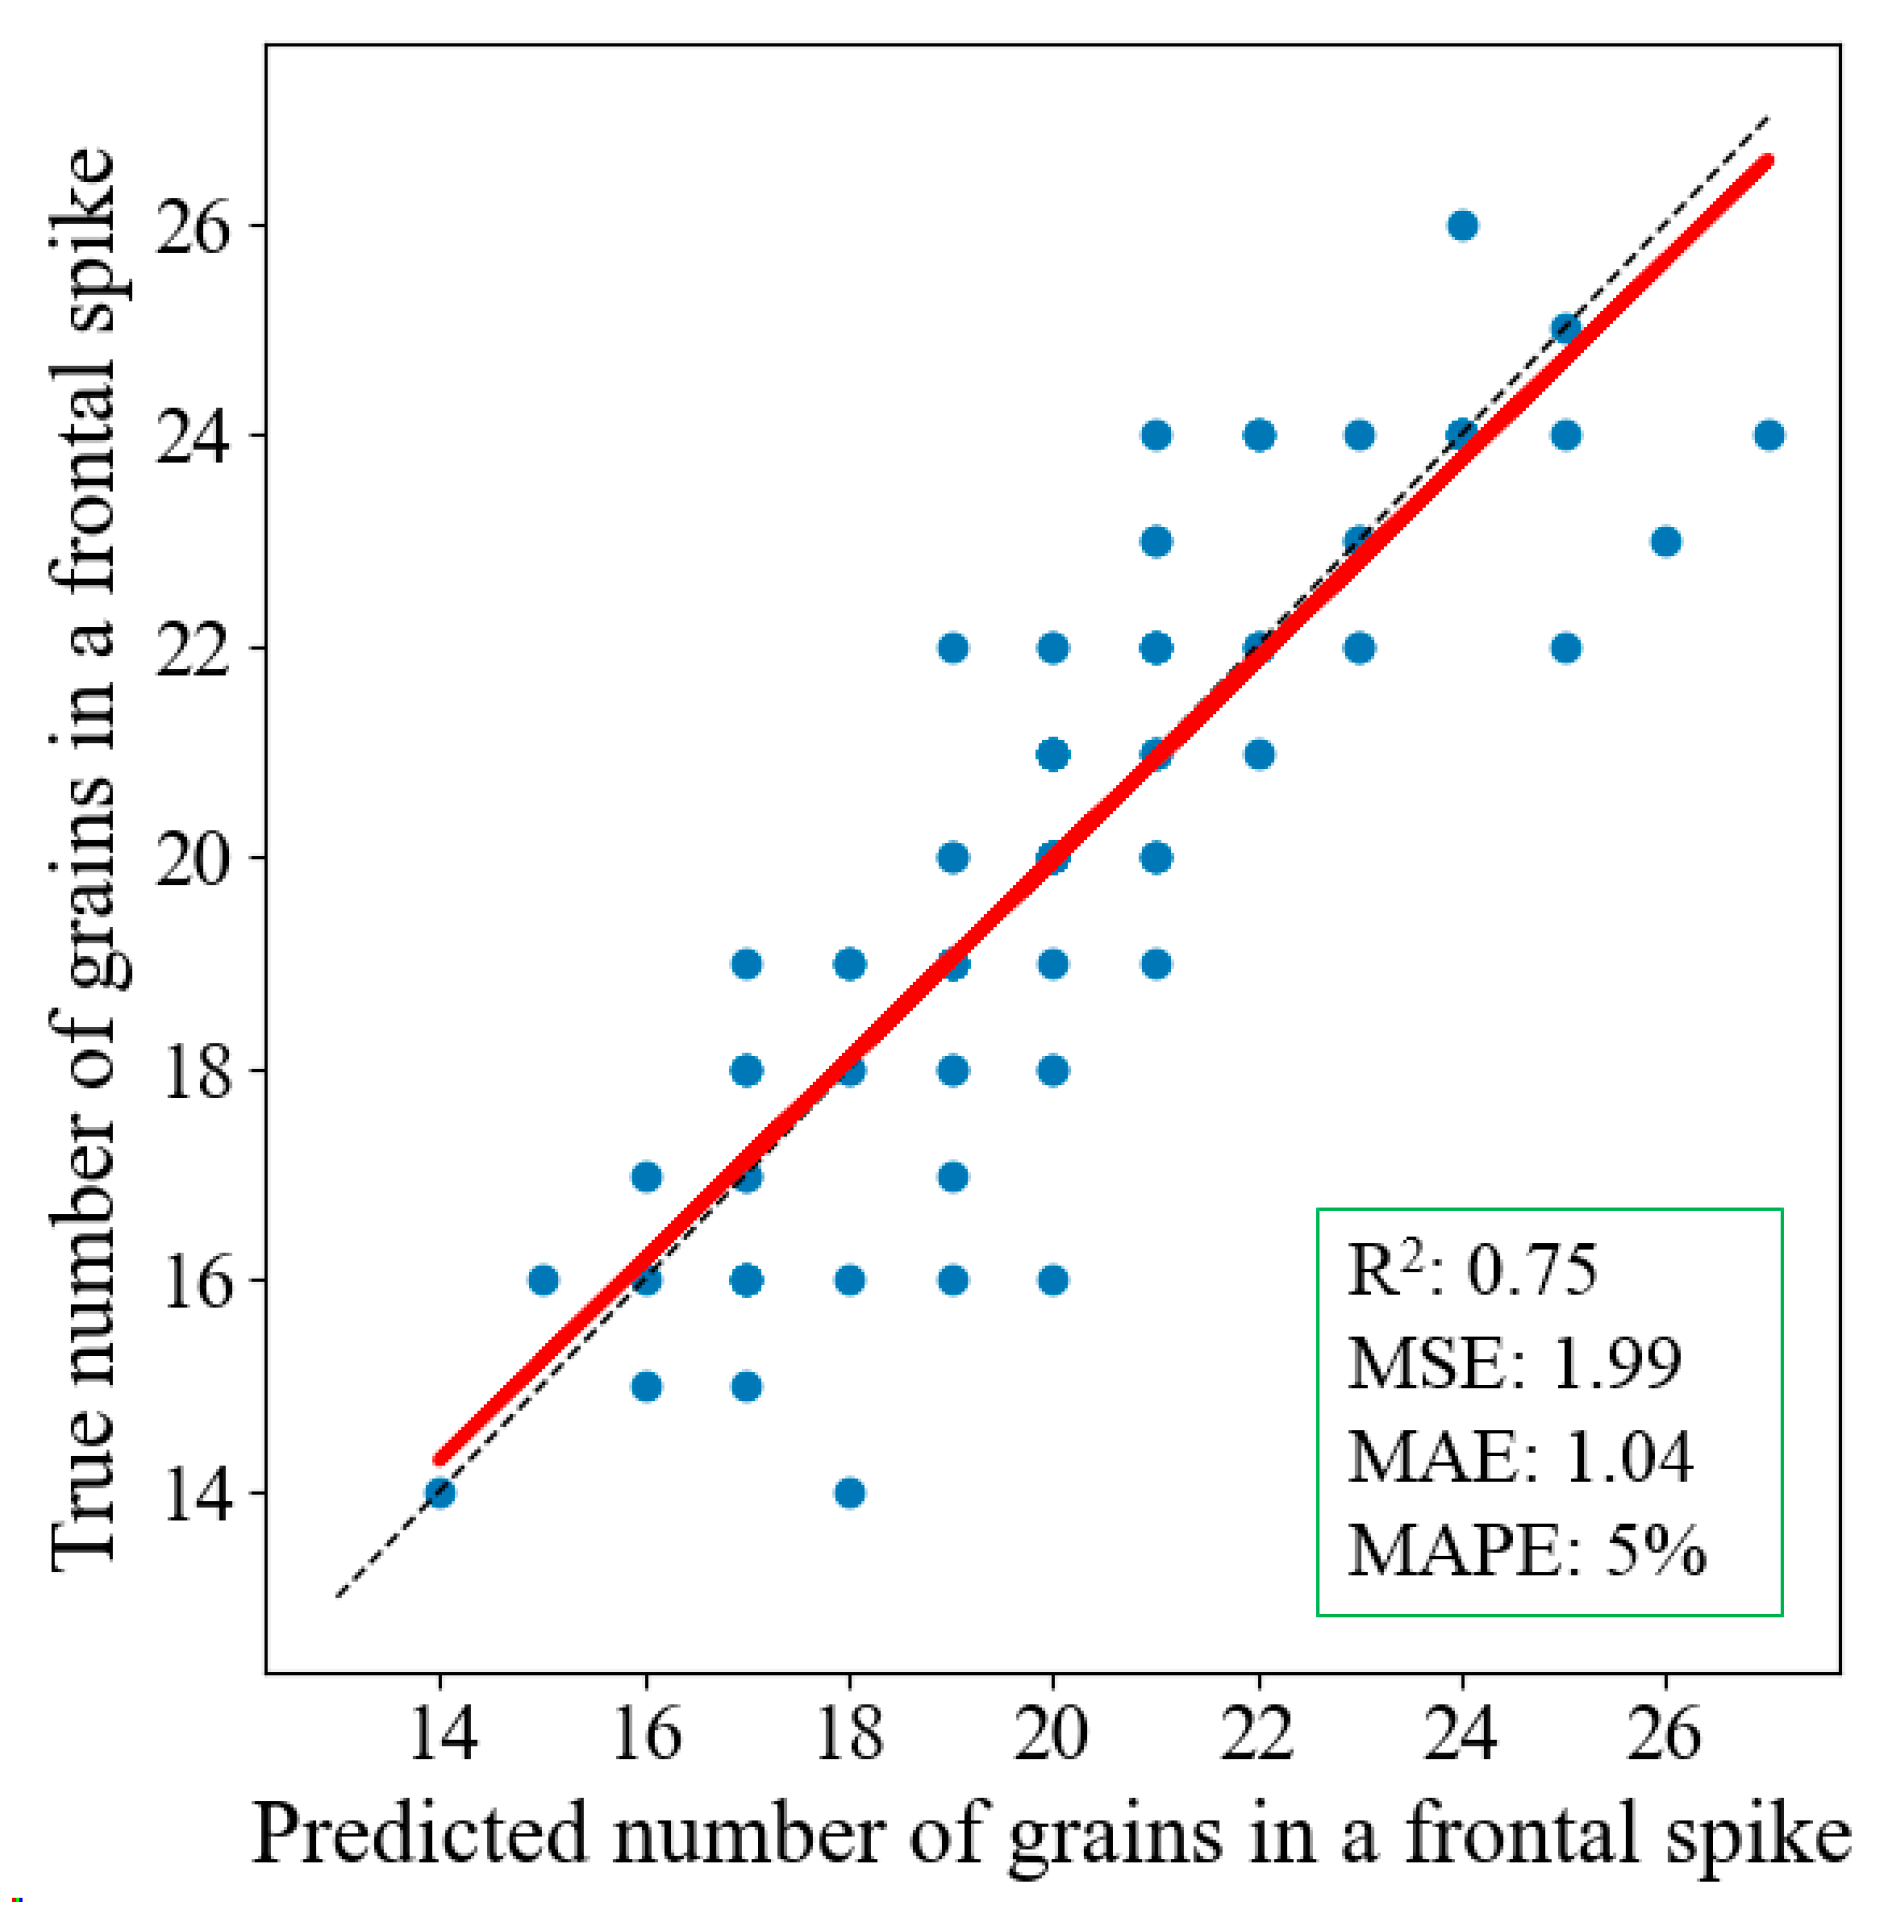
3.3. Counting Results of Wheat Grains

After classifying the wheat grain quantities of the spikelets by the SVM model, this study added the number of grains in the corresponding spikelets together to automatically count the number of grains in the frontal spikes. Figure 13 shows the regression results of the true and predicted numbers of grains in frontal spikes. The regression dataset was the test dataset used to model the categories of spikelet grain quantities, and consisted of 843 spikelets and 90 spikes in three varieties and three growth periods. Each frontal spike contained 7~12 spikelets for different varieties and growth periods. Each spikelet contained 0~3 grains, and each frontal spike contained 14~26 wheat grains. As shown in Figure 13, this study correctly predicted the grain number of about two-thirds of the spikes, and the number of grains in the remaining spikes was incorrectly predicted with the maximum prediction error of four grains. The R2 and MSE of the regression were 0.75 and 1.99, respectively, which proved that there was a good prediction of the number of grains in frontal spikes. Furthermore, the MAE was as low as 1.04, while the MAPE was 5%, and the two indicators indicated that the true and predicted numbers had a small degree of difference. Compared to previous research, Xu et al. [20] realized an R2 of 0.93, MSE of 3.13, and MAE of 2.30. Despite the relatively low R2 acquired, our study showed superiority in the indicators of precision and accuracy, which are more crucial for measurement. Therefore, this study achieved a satisfactory effect in counting the number of grains in frontal spikes.

4. Conclusions

Facing the present problems of wheat spike phenotyping, a rapid and accurate method was proposed to obtain the parameters of spikelets and grains based on instance segmentation and classification in this study. The YOLOv8-seg model was used to realize the instance segmentation of the frontal wheat spikes, and the classification of wheat varieties and growth periods. Furthermore, 52 image features were extracted for each spikelet to classify the number of spikelet grains and the total number of spike grains. The YOLOv8-seg model achieved excellent segmentation and classification performance, and its precision, recall, AP@[0.50], and AP@[0.50:0.95] reached 0.994, 0.979, 0.993, and 0.858, respectively. The SVM model also had good classification performance for the number of grains in spikelets, and its accuracy, precision, recall, and F1 score reached 0.855, 0.860, 0.865, and 0.863, respectively. MAE and MAPE were as low as 1.04 and 5% when counting the total number of grains in the frontal wheat spike. In future research, continuous improvement of wheat spike phenotyping is needed. Concretely, increasing the varieties and growth periods of wheat samples and building a complete database and analysis models to serve spike phenotyping might be a promising approach.

Author Contributions

Conceptualization, Z.Q.; Methodology, Z.N. and N.L.; Validation, Y.H. and S.S.; Formal Analysis, C.X.; Investigation, Z.Q.; Resources, Z.Z.; Data Curation, Z.N.; Writing—Original Draft Preparation, N.L.; Writing—Review and Editing, Z.N.; Visualization, C.X.; Supervision, Z.Q.; Project Administration, Z.Z.; Funding Acquisition, Z.Q. All authors have read and agreed to the published version of the manuscript.

Funding

This work was funded by the China National Key Research and Development Plan Project (2023YFD2000101).

Institutional Review Board Statement

Not applicable.

Informed Consent Statement

Not applicable.

Data Availability Statement

The raw data supporting the conclusions of this article will be made available by the authors on request.

Conflicts of Interest

The authors declare no conflicts of interest.

References

  1. Wei, B.; Jiao, Y. Grain size control in wheat: Toward a molecular understanding. Seed Biol. 2024, 3, e007. [Google Scholar] [CrossRef]
  2. Yang, G.; Li, X.; Liu, P.; Yao, X.; Zhu, Y.; Cao, W.; Cheng, T. Automated in-season mapping of winter wheat in China with training data generation and model transfer. ISPRS J. Photogramm. Remote Sens. 2023, 202, 422–438. [Google Scholar] [CrossRef]
  3. Zhou, X.; Zhao, Y.; Ni, P.; Ni, Z.; Sun, Q.; Zong, Y. CRISPR-mediated acceleration of wheat improvement: Advances and perspectives. J. Genet. Genom. 2023, 50, 815–834. [Google Scholar] [CrossRef] [PubMed]
  4. Srivastava, A.K.; Safaei, N.; Khaki, S.; Lopez, G.; Zeng, W.; Ewert, F.; Gaiser, T.; Rahimi, J. Winter wheat yield prediction using convolutional neural networks from environmental and phenological data. Sci. Rep. 2022, 12, 3215. [Google Scholar] [CrossRef] [PubMed]
  5. Genaev, M.A.; Komyshev, E.G.; Smirnov, N.V.; Kruchinina, Y.V.; Goncharov, N.P.; Afonnikov, D.A. Morphometry of the Wheat Spike by Analyzing 2D Images. Agronomy 2019, 9, 390. [Google Scholar] [CrossRef]
  6. Madec, S.; Jin, X.; Lu, H.; De Solan, B.; Liu, S.; Duyme, F.; Heritier, E.; Baret, F. Ear density estimation from high resolution RGB imagery using deep learning technique. Agric. For. Meteorol. 2019, 264, 225–234. [Google Scholar] [CrossRef]
  7. Xiong, B.; Wang, B.; Xiong, S.; Lin, C.; Yuan, X. 3D Morphological Processing for Wheat Spike Phenotypes Using Computed Tomography Images. Remote Sens. 2019, 11, 1110. [Google Scholar] [CrossRef]
  8. Wang, Y.; Wang, F.; Li, K.; Feng, X.; Hou, W.; Liu, L.; Chen, L.; He, Y.; Wang, Y. Low-light wheat image enhancement using an explicit inter-channel sparse transformer. Comput. Electron. Agric. 2024, 224, 109169. [Google Scholar] [CrossRef]
  9. Zhang, K.; Yan, F.; Liu, P. The application of hyperspectral imaging for wheat biotic and abiotic stress analysis: A review. Comput. Electron. Agric. 2024, 221, 109008. [Google Scholar] [CrossRef]
  10. Liu, T.; Wu, F.; Mou, N.; Zhu, S.; Yang, T.; Zhang, W.; Wang, H.; Wu, W.; Zhao, Y.; Sun, C.; et al. The estimation of wheat yield combined with UAV canopy spectral and volumetric data. Food Energy Secur. 2024, 13, e527. [Google Scholar] [CrossRef]
  11. Ning, L.; Sun, S.; Zhou, L.; Zhao, N.; Taha, M.; He, Y.; Qiu, Z. High-throughput instance segmentation and shape restoration of overlapping vegetable seeds based on sim2real method. Measurement 2022, 207, 112414. [Google Scholar] [CrossRef]
  12. Fernandez-Gallego, J.A.; Lootens, P.; Borra-Serrano, I.; Derycke, V.; Haesaert, G.; Roldán-Ruiz, I.; Araus, J.L.; Kefauver, S.C. Automatic wheat ear counting using machine learning based on RGB UAV imagery. Plant J. 2020, 103, 1603–1613. [Google Scholar] [CrossRef] [PubMed]
  13. Carlier, A.; Dandrifosse, S.; Dumont, B.; Mercatoris, B. Wheat Ear Segmentation Based on a Multisensor System and Superpixel Classification. Plant Phenomics 2022, 2022, 9841985. [Google Scholar] [CrossRef] [PubMed]
  14. Zhang, D.; Luo, H.; Wang, D.; Zhou, X.; Li, W.; Gu, C.; Zhang, G.; He, F. Assessment of the levels of damage caused by Fusarium head blight in wheat using an improved YoloV5 method. Comput. Electron. Agric. 2022, 198, 107086. [Google Scholar] [CrossRef]
  15. Zang, H.; Wang, Y.; Ru, L.; Zhou, M.; Chen, D.; Zhao, Q.; Zhang, J.; Li, G.; Zheng, G. Detection method of wheat spike improved YOLOv5s based on the attention mechanism. Front. Plant Sci. 2022, 13, 993244. [Google Scholar] [CrossRef] [PubMed]
  16. Batin, M.A.; Islam, M.; Hasan, M.M.; Azad, A.; Alyami, S.A.; Hossain, M.A.; Miklavcic, S.J. WheatSpikeNet: An improved wheat spike segmentation model for accurate estimation from field imaging. Front. Plant Sci. 2023, 14, 1226190. [Google Scholar] [CrossRef] [PubMed]
  17. Qiu, R.; He, Y.; Zhang, M. Automatic Detection and Counting of Wheat Spikelet Using Semi-Automatic Labeling and Deep Learning. Front. Plant Sci. 2022, 13, 872555. [Google Scholar] [CrossRef] [PubMed]
  18. Zhang, R.; Jia, Z.; Wang, R.; Yao, S.; Zhang, J. Phenotypic Parameter Extraction for Wheat Ears Based on an Improved Mask-rcnn Algorithm. Inmateh-Agric. Eng. 2022, 66, 267–278. [Google Scholar] [CrossRef]
  19. Xu, X.; Geng, Q.; Gao, F.; Xiong, D.; Qiao, H.; Ma, X. Segmentation and counting of wheat spike grains based on deep learning and textural feature. Plant Methods 2023, 19, 77. [Google Scholar] [CrossRef]
  20. Geng, Q.; Zhang, H.; Gao, M.; Qiao, H.; Xu, X.; Ma, X. A rapid, low-cost wheat spike grain segmentation and counting system based on deep learning and image processing. Eur. J. Agron. 2024, 156, 127158. [Google Scholar] [CrossRef]
  21. Liu, Y.; Noguchi, N.; Liang, L. Development of a positioning system using UAV-based computer vision for an airboat navigation in paddy field. Comput. Electron. Agric. 2019, 162, 126–133. [Google Scholar] [CrossRef]
  22. Alkhudaydi, T.; Reynolds, D.; Griffiths, S.; Zhou, J.; de la Iglesia, B. An Exploration of Deep-Learning Based Phenotypic Analysis to Detect Spike Regions in Field Conditions for UK Bread Wheat. Plant Phenomics 2019, 2019, 7368761. [Google Scholar] [CrossRef] [PubMed]
  23. Syed, S.H.; Muralidharan, V. Feature extraction using Discrete Wavelet Transform for fault classification of planetary gearbox—A comparative study. Appl. Acoust. 2022, 188, 108572. [Google Scholar] [CrossRef]
  24. Elsherbiny, O.; Zhou, L.; Feng, L.; Qiu, Z. Integration of Visible and Thermal Imagery with an Artificial Neural Network Approach for Robust Forecasting of Canopy Water Content in Rice. Remote Sens. 2021, 13, 1785. [Google Scholar] [CrossRef]
  25. Xia, M.; Li, S.; Chen, W.; Yang, G. Perceptual image hashing using rotation invariant uniform local binary patterns and color feature. Adv. Comput. 2023, 130, 163–205. [Google Scholar] [CrossRef]
Figure 1. Structure of wheat spike. (a) Frontal view; (b) side view; (c) wheat spikelet.
Applsci 14 06031 g001
Figure 2. Wheat spike image collection.
Applsci 14 06031 g002
Figure 3. Perspective transformation of wheat spike image. (a) Original image; (b) white box; (c) corner points of internal contour; (d) perspective image.
Applsci 14 06031 g003
Figure 4. Optimization of wheat spike image. (a) Perspective image; (b) bounding rectangle of spike; (c) size-optimized image; (d) label.
Applsci 14 06031 g004
Figure 5. Structure of YOLOv8-seg for the instance segmentation.
Applsci 14 06031 g005
Figure 6. Examples of spikelets with different numbers of grains.
Applsci 14 06031 g006
Figure 7. Process of counting spikelet grains.
Applsci 14 06031 g007
Figure 8. Example of instance segmentation result (S8 wheat spike). (a) Original image; (b) segmentation result; (c) ground truth. The part pointed by the arrow is the unsegmented part of the spikelet.
Applsci 14 06031 g008
Figure 9. Instance segmentation results in wheat spikes at different growth periods.
Applsci 14 06031 g009
Figure 10. Confusion matrices of SVM model on training and test datasets. (a) Training dataset; (b) Test dataset.
Applsci 14 06031 g010
Figure 11. ROC curves and AUC values of SVM model on test dataset.
Applsci 14 06031 g011
Figure 12. Importance score of spikelet image feature based on different feature selection methods.
Applsci 14 06031 g012
Figure 13. Regression results for counting grains in the single wheat spike. The blue dot reflects the difference between the predicted number and true number. The dot on the dotted line means the prediction is correct. The red line is a line that fits all the dots.
Applsci 14 06031 g013
Table 1. Instance segmentation results of YOLOv8-seg models for different datasets.
DatasetMask ImageCategory
PrecisionRecallAP@[0.50]AP@[0.50:0.95]A
Z6180.9940.9890.9950.850100%
Y190.9980.9880.9930.855100%
S80.9950.9730.9870.857100%
TV0.9940.9790.9930.858100%
Table 2. Classification results of the spikelets based on different models.
ModelA of Training
Dataset
A of Test
Dataset
P of Test
Dataset
R of Test
Dataset
F1 Score of Test
Dataset
NB0.7340.7130.7100.7610.724
LDA0.8050.7970.7860.8230.801
DT0.8180.8010.7930.7780.780
KNN0.8410.8230.8390.8280.832
GBDT0.8610.8350.8270.8260.827
RF0.8630.8330.8450.8410.843
SVM0.8700.8550.8600.8650.863
Table 3. Classification results of the spikelets based on selected features and SVM.
Feature Selection
Methods
A of Training
Dataset
A of Test
Dataset
P of Test
Dataset
R of Test
Dataset
F1 Score of Test
Dataset
CS test0.7420.7600.7850.7380.756
F-test0.7420.7580.7840.7370.755
MIE0.7980.8190.8270.8330.830
L10.7910.8050.8070.8110.809
RF0.8380.8400.8430.8450.844
ERT0.8010.8120.8120.8210.815
Disclaimer/Publisher’s Note: The statements, opinions and data contained in all publications are solely those of the individual author(s) and contributor(s) and not of MDPI and/or the editor(s). MDPI and/or the editor(s) disclaim responsibility for any injury to people or property resulting from any ideas, methods, instructions or products referred to in the content.

