Article

Analysis of Bullet Impact Locations in the 10 m Air Pistol Men’s Competition Based on Covariance

1
Department of Physical Education, Sangmyung University, Seoul 03016, Republic of Korea
2
Department of Human-Centered AI, Sangmyung University, Seoul 03016, Republic of Korea
*
Author to whom correspondence should be addressed.
Appl. Sci. 2024, 14(14), 6006; https://doi.org/10.3390/app14146006
Submission received: 10 June 2024 / Revised: 3 July 2024 / Accepted: 8 July 2024 / Published: 10 July 2024
(This article belongs to the Special Issue State-of-the-Art of Computer Vision and Pattern Recognition)

Abstract

:
The purpose of this study was to quantify the bullet impact locations of the men’s 10 m air pistol competition and propose objective metrics for evaluating shooting techniques. We automatically collected data from the top 20 competitors’ shooting results using computer vision techniques. Metrics such as x-variance, y-variance, covariance, x-mean, y-mean, root mean square error (RMSE), x-mean score, and y-mean score were computed to investigate correlations among rankings, left–right and up–down shot groups, aiming relationships, and precision. Covariance analysis revealed significant interactions between horizontal and vertical aiming, highlighting the importance of balanced coordination between these directions for high performance. Athletes with lower covariance values, indicating less variation between horizontal and vertical aiming, tended to achieve higher rankings. Additionally, top-ranked athletes exhibited lower RMSE values, underscoring the importance of precision in achieving high scores. In conclusion, this study analyzed the correlation between x and y through covariance, examined its relationship with competition rankings, and proposed new indicators for training and performance enhancement. This study is novel in that it provides quantitative data to correct poor aiming and shooting habits by performing a covariance-based bidirectional correlation analysis, rather than simply analyzing bullet impact locations in a single horizontal or vertical direction. Our approach establishes a foundation for more data-driven and objective evaluations in the sport of shooting.

1. Introduction

Shooting is a sport where athletes use a prescribed firearm to hit targets at a set distance, requiring a very high level of concentration and the ability to accurately detect bullet impact locations on target. The technical factors for improving shooting performance include posture balance and stability, gun-hold and muzzle stability, triggering, and coordination of technical movements [1]. Air rifle shooting involves a standing position where the athlete maintains balance by standing with feet shoulder-width apart and aligning their body directly with the target. In the 10 m air pistol event, accuracy and stability are of utmost importance, and it is crucial to minimize muzzle movement to maintain a steady aim for high scores [2]. Changes in muzzle position are closely related to performance in air pistol shooting [3]. In shooting, standstill or stability is reported to determine performance scores and outcomes, as evidenced by numerous studies [4,5]. The stability of gun-hold has been a key focus in research related to shooting training [6]. To achieve high scores in competitions, it is necessary to enhance the efficiency of shooting techniques and objectively evaluate the continuity of these techniques. It is important not just to hit the 10-point zone but to strike the exact center of the target [7]. Providing objective feedback through sports performance analysis is essential not only for enhancing athletes’ performance but also as crucial data for coaches in designing training systems and conducting on-field guidance [8]. To evaluate and improve athletes’ shooting techniques, analyzing the target shot positions is essential. This analysis helps identify technical characteristics such as shooting patterns and posture stability, which can be used to develop training and strategies.
Existing studies have been conducted to provide objective data through a sports science approach in shooting sports, but most of them have been related to sports psychology [5,9]. Additionally, elements such as aiming and timing have been analyzed using coaching machines, but there have been few studies that analyzed the results of actual competitions. In the context of shooting technique training, emphasis was placed on the importance of posture stability and aiming accuracy [10].
This study aims to propose a new analysis method for shooting events by localizing the impact positions of shots and conducting variance analysis, thereby providing objective data for improving athletic performance. The proposed method was applied to actual ISSF competitions, focusing on the analysis of shot impact positions in 10 m air pistol shooting. By analyzing the correlation between horizontal and vertical aiming, unique shooting patterns of each athlete were identified. This approach distinguishes itself from previous research by offering new indicators for future training and performance enhancement. Extracting impact position data through image coordinate localization does not require sensors or additional equipment, enabling comprehensive post-game analysis and classification of factors for a better understanding of overall performance.

2. Related Works

Shooting is a sport that demands precision and focus. Athletes must constantly train and enhance their performance to achieve optimal results. In recent years, advancements in sports analytics technology have provided new ways to understand athletes’ shooting performance, patterns, and target analysis.
Previous research on shooting performance has effectively utilized computer vision-based training systems, automatic scoring systems, and SCATT optical shooting test systems as tools for analyzing and improving shooting performance. SCATT, in particular, is primarily used for analyzing shot distribution in shooting events. It attaches a laser device to the barrel of the gun to monitor movement in real-time.
Another important trend in this field is the analysis of shooting patterns to improve athletes’ aiming accuracy and stability [11,12]. Through the analysis of shooting patterns, it is possible to assess athletes’ aiming accuracy and stability and to develop strategies to enhance performance by examining their relationship with scores [13,14].
Additionally, target analysis is a significant research area for evaluating the components and assessing enhancements in shooting performance as shown in Table 1. Prior research has utilized optical training devices and image acquisition technology to analyze key technical components and develop automatic target scoring and technology evaluation systems. Target analysis research provides crucial indicators of shooting performance, and the results can be used to develop and improve athletes’ training programs.
However, directly installing sensors on the target to detect the impact point location enables precise tracking of projectiles, but it may involve high installation costs and reduced accuracy due to sensor damage [22]. Furthermore, research such as that on real-time scoring of air rifle shooting scores using image processing techniques from camera footage of targets captures real-time video of the target [23] and extracts the position of the impact point using image processing algorithms, eliminating the need for physical sensors. However, this method requires advanced image processing techniques and may be affected by lighting conditions or camera quality [22,24,25,26,27]. Both sensor-based approaches and real-time image processing-based approaches provide important insights into the performance of shooting athletes. However, they face practical challenges in being applied to actual competitions due to environmental constraints. Additionally, for analyzing athletes’ shot impacts, the SCATT system commonly used in shooting cannot be attached to the firearm at actual competition venues, making it difficult to collect data outside of training sessions. As a result, there has been little research on analyzing shot distribution in actual competitions, and there have been no studies on analyzing the correlation between horizontal and vertical directions or proposing performance indicators based on shot distribution. There is a growing recognition of the need for new methods of collecting competition data and presenting new performance indicators.

3. Methods

3.1. Extraction of Bullet Impact Point Location Information

The sensor-based and real-time image processing methods traditionally used to collect shot information have limitations in practical application to actual competitions and in analyzing large amounts of data. However, the post-shot image position coordinate extraction method proposed in this study can process large amounts of data without environmental constraints and effectively analyze data obtained from actual competitions to evaluate each athlete’s shooting pattern.
To extract the bullet impact locations on the target, we developed a simple template matching-based position detection software. The collected target images have a fixed resolution of 480 × 480 pixels, and the circular size of the bullet impact locations marked on the target is also consistent. Therefore, it can be implemented easily without considering various geometric variables. The following steps were followed for this purpose.

3.1.1. Extraction of Image x and y Coordinates

The x and y positions of the bullet impact locations are detected from the target images using template matching. Examples of the target, the bullet impact template, and the detected results are shown in Figure 1. The bullet impact template searches from the top-left of the target image, performing a horizontal scan, and calculates the correlation with the image pixels that match the template. The top 10 positions with the highest correlation values are determined to be the bullet impact locations. If bullet impact locations overlap completely, the top 10 positions might not be detected accurately, so the detected positions are manually adjusted as needed.

3.1.2. Calculation of Bullet Impact Position Coordinates

The extracted image coordinate values were extracted based on the position of 240 pixels, 240 pixels (x, y) in the center, and calculated based on the actual center value of the target, 0, 0 (x, y). The actual impact coordinates of each bullets were calculated and recorded as data.

3.1.3. Calculation of Scores by x, y Coordinates

To analyze the correlation between x and y coordinates, scores were classified and calculated based on each coordinate. Using a computer vision approach on target images provided by ISSF, positions with pixel values equal to or greater than 62 were assigned 10 points, those below were assigned 9 points, and positions below 148 were assigned 8 points.

3.2. Data Collection and Statistical Analysis

The International Shooting Sport Federation (ISSF) publicly releases target results for each event. We collected the results of the 10 m qualification event from the ISSF Grand Prix through the official website, excluding target results of 7 points or lower. As shown in Figure 2, we analyzed six targets per athlete, and using the extracted coordinate data, we utilized Microsoft Excel to calculate the variance of x and y coordinates, covariance, x-mean, y-mean, x-mean score, and y-mean score of the shot data. We then analyzed the correlation according to ranking. For covariance, x-mean, and y-mean, absolute values were used to determine the absolute position of the results.
We obtained the variance of x and y using the variance function formula “= Var (data range)” and the formula for variance is as follows (1).
V a r ( X ) = i = 1 n ( X i X ¯ ) 2 n
The covariance function formula “= COVAR (array1, array2)” where array1 and array2 are the two data sets for which covariance is to be calculated. The covariance between two variables can be calculated using Formula (2).
c o v ( X ,   Y ) = i = 1 n ( X i X ¯ ) ( Y i Y ¯ ) n
Using the mean values of x and y, we calculated the root mean square error (RMSE), and the formula for calculation is as follows (3).
R M S E = i = 1 n ( y i ^ y i ) 2 n

3.3. Feature Indicators

The feature indicators used in this study include x-variance, y-variance, covariance, x-mean, y-mean, root mean square error, x-mean score, and y-mean score. These key indicators carry the following meanings.
  • X-variance
The x-variance represents the distribution of data in the x-axis direction, indicating the range of left–right shot impacts. A large x-variance indicates that the data are widely spread in the left–right direction.
  • Y-variance
The y-variance represents the distribution of data in the y-axis direction, indicating the range of shot impacts in the up–down direction. A large y-variance indicates that the data are widely spread in the up–down direction.
  • Covariance
The covariance represents the relationship between x-variance and y-variance variables, indicating the correlation between left–right aiming and up–down aiming. If the covariance value is positive, it means there is a tendency for left–right aiming and up–down aiming to increase or decrease together, whereas if it is negative, it indicates a tendency for up–down aiming to decrease when left–right aiming increases.
  • X-mean
X-mean represents the average of the x-axis data, indicating the central position of the overall left–right shot impact data. A higher x-mean value indicates deviation from the central value 0, reflecting the accuracy of left–right aiming.
  • Y-mean
Y-mean represents the average of the y-axis data, indicating the central position of the overall up–down shot impact data. A higher y-mean value indicates deviation from the central value 0, reflecting the accuracy of up–down aiming.
  • Root mean square error (RMSE)
RMSE is a metric for evaluating the precision of bullet impact locations, with a smaller RMSE value indicating more precise bullet impact locations.
  • X-mean score
X-mean score represents the accuracy of scores in the left–right direction, calculated as the average value of scores based on the x-axis. A higher x-mean score value indicates greater accuracy in the left–right direction.
  • Y-mean score
Y-mean score represents the accuracy of scores in the up–down direction, calculated as the average value of scores based on the y-axis. A higher y mean score value indicates greater accuracy in the up–down direction.
Through correlation analysis between specific indicators and rankings, we aim to identify the key factors influencing rankings and formulate strategies to improve athletes’ performance.

4. Results

4.1. Competition Analysis Results

We conducted individual analysis of the shooting pattern tendencies of male air pistol shooters who participated in the ISSF Grand Prix 10 m event, from the 1st to the 20th ranking, based on the competition’s target results. In the qualification round of the competition, each shooter fires 10 shots six times, and the total score determines the ranking. In this study, we extracted data for each shooter’s 60 shots and excluded results of seven points or lower.
Through the analysis of the actual competition’s bullet impact locations’ image coordinates, we could examine shooting patterns such as stability in the left–right and up–down directions. Quantitative data on bullet impact locations, which were not previously available for analysis, allowed us to gain insights. The analysis results of the ISSF Grand Prix 2024 Men’s 10 m Air Pistol Qualification rankings from 1st to 20th are presented in Table 2 below.

4.2. Correlation Analysis between Rankings and Key Indicators

The correlation analysis results between ranking and x-dispersion indicating the left–right directional distribution are shown in Figure 3a. Although the R-squared value is 0.1549, indicating a weak correlation, the trend line shows a positive trend. This suggests a weak correlation between ranking and left–right directional distribution, implying that players with lower rankings tend to have a larger dispersion in their shooting patterns.
The correlation analysis results between ranking and y-dispersion indicating the up–down directional distribution are shown in Figure 3b. Although the R-squared value is 0.1866, indicating a weak correlation, the trend line shows a positive trend. This suggests a weak correlation between ranking and up–down directional distribution, implying that players with lower rankings tend to have a larger dispersion in their shooting patterns.
The covariance results were used to examine the relationship between left–right aiming and up–down aiming. Players with positive covariance values tend to have their left–right and up–down aiming increase or decrease together, indicating an interaction between the two directions of aiming. On the other hand, players with negative covariance values tend to have their up–down aiming decrease when their left–right aiming increases, and vice versa. These results suggest that left–right and up–down aiming influence each other and impact the shooting outcomes.
To examine the correlation between ranking and covariance, the covariance was calculated as an absolute value, and the results are shown in Figure 3c. Although the R-squared value is 0.0178, indicating a weak correlation, the trend line shows a positive trend. This suggests that the interaction between left–right and up–down aiming in shooting patterns may influence the ranking.
To examine the correlation between ranking and the mean position in the left–right direction, the calculations were performed using absolute values, and the results are shown in Figure 3d. With an R-squared value of 0.0048, indicating an almost negligible correlation, it can be concluded that there is no significant correlation between ranking and the mean position in the left–right direction.
To examine the correlation between ranking and the mean position in the up–down direction, calculations were performed using absolute values, and the results are shown in Figure 3e. With an R-squared value of 0.0809, indicating a moderate correlation, the trend line shows a positive trend. This suggests that as the ranking decreases, there is a tendency to move further away from the vertical center position.
For analyzing the precision of bullet impact locations, the root mean square error (RMSE) values were calculated, and the correlation analysis results between ranking and RMSE are shown in Figure 3f. With an R-squared value of 0.0808, indicating a moderate correlation, the trend line also shows a positive trend. This implies that as the ranking number increases, the RMSE values tend to increase, indicating that players with lower rankings may have lower bullet impact location precision. This analysis could help in devising strategies to improve players’ precision and exploring avenues for enhancing overall performance.
To analyze the mean scores in the left–right direction based on ranking, the correlation between ranking and the mean score in the x-direction was examined, and the results are shown in Figure 3g. With an R-squared value of 0.0245, indicating a weak correlation, the trend line shows a negative trend. This suggests that as the ranking decreases, there is often a tendency to record lower scores in the left–right direction. In other words, there may be differences in the accuracy of left–right aiming based on ranking.
For analyzing the mean scores in the up–down direction based on ranking, the correlation between ranking and the mean score in the y-direction was examined, and the results are shown in Figure 3h. With an R-squared value of 0.0056, indicating almost no correlation, it can be concluded that there is hardly any significant relationship between ranking and the mean score in the up–down direction.

4.3. Player-Specific Case Analysis

Examining each player’s shooting data individually allows us to assess their shooting accuracy and stability through bullet impact location analysis. This enables us to identify areas where each player may need to focus more. Additionally, we can understand the characteristics of left–right and up–down aiming and derive individual training and strategic plans to improve aiming skills and enhance overall performance. The five analyzed cases follow.

4.3.1. Shooting Pattern Analysis #1

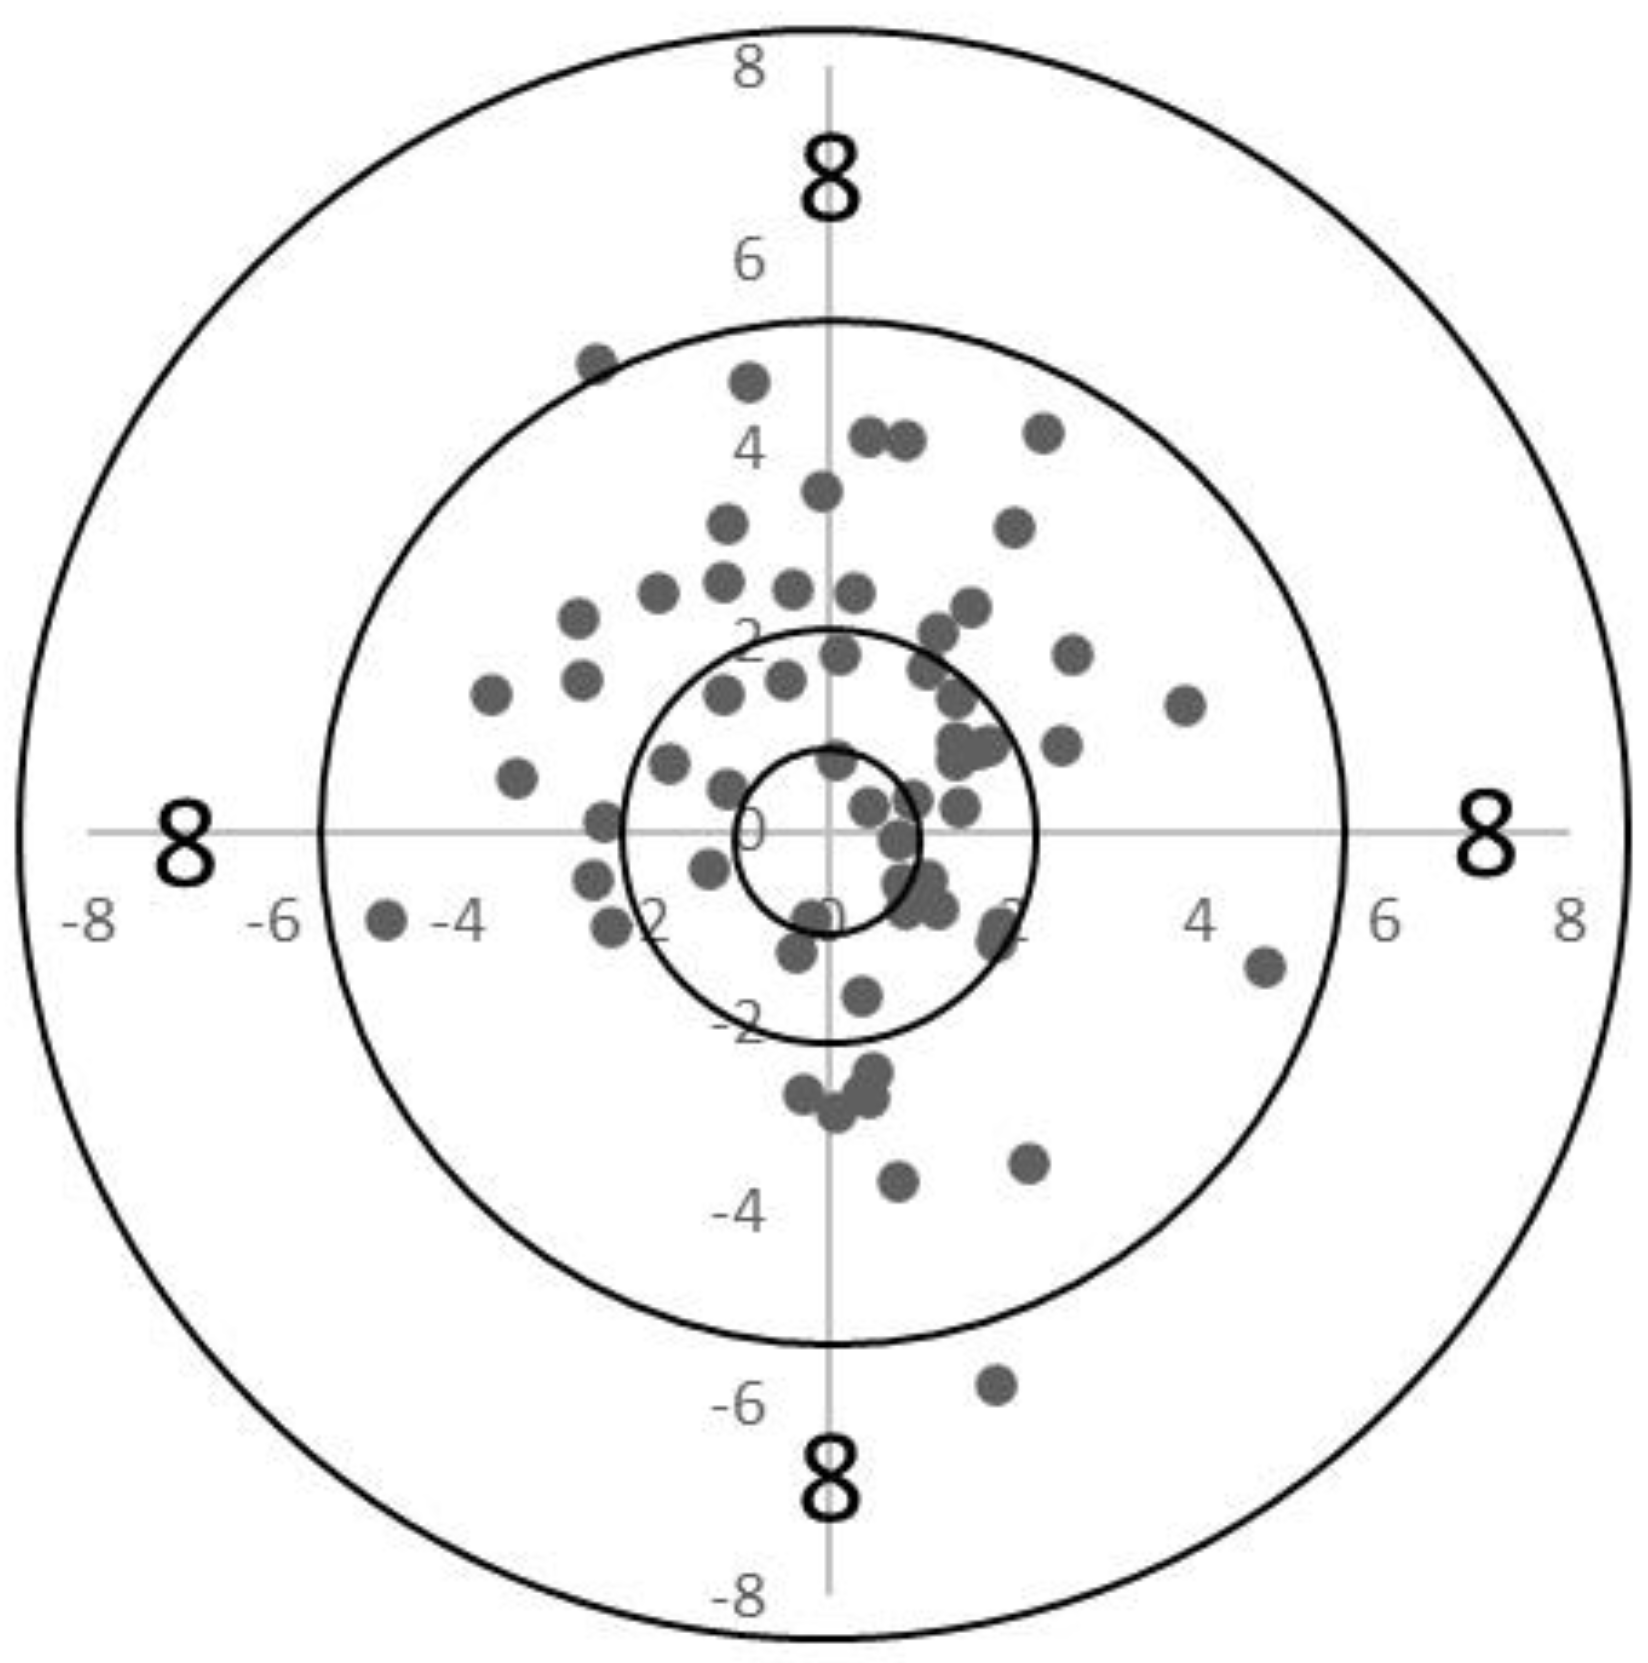
As shown in Figure 4 and Table 3, the x-dispersion is 3.021, and the y-dispersion is 2.916, indicating no significant difference between left–right and up–down aiming. The covariance is −0.711, suggesting a tendency for the y-dispersion to decrease when the x-dispersion increases, and vice versa. For the player in analysis case 1, the mean position for left–right aiming is slightly to the left of the target center with an x-mean value of −0.143, and the up–down aiming is slightly below the center with a y-mean value of −0.681. These results indicate a tendency for the player’s shooting pattern to be slightly biased to the left and downward. The RMSE is 0.696, indicating moderate precision. The mean scores for each direction show an x-mean score of 9.950 and a y-mean score of 9.933, with a slightly higher 10-point hit rate in the left–right direction.

4.3.2. Shooting Pattern Analysis #2

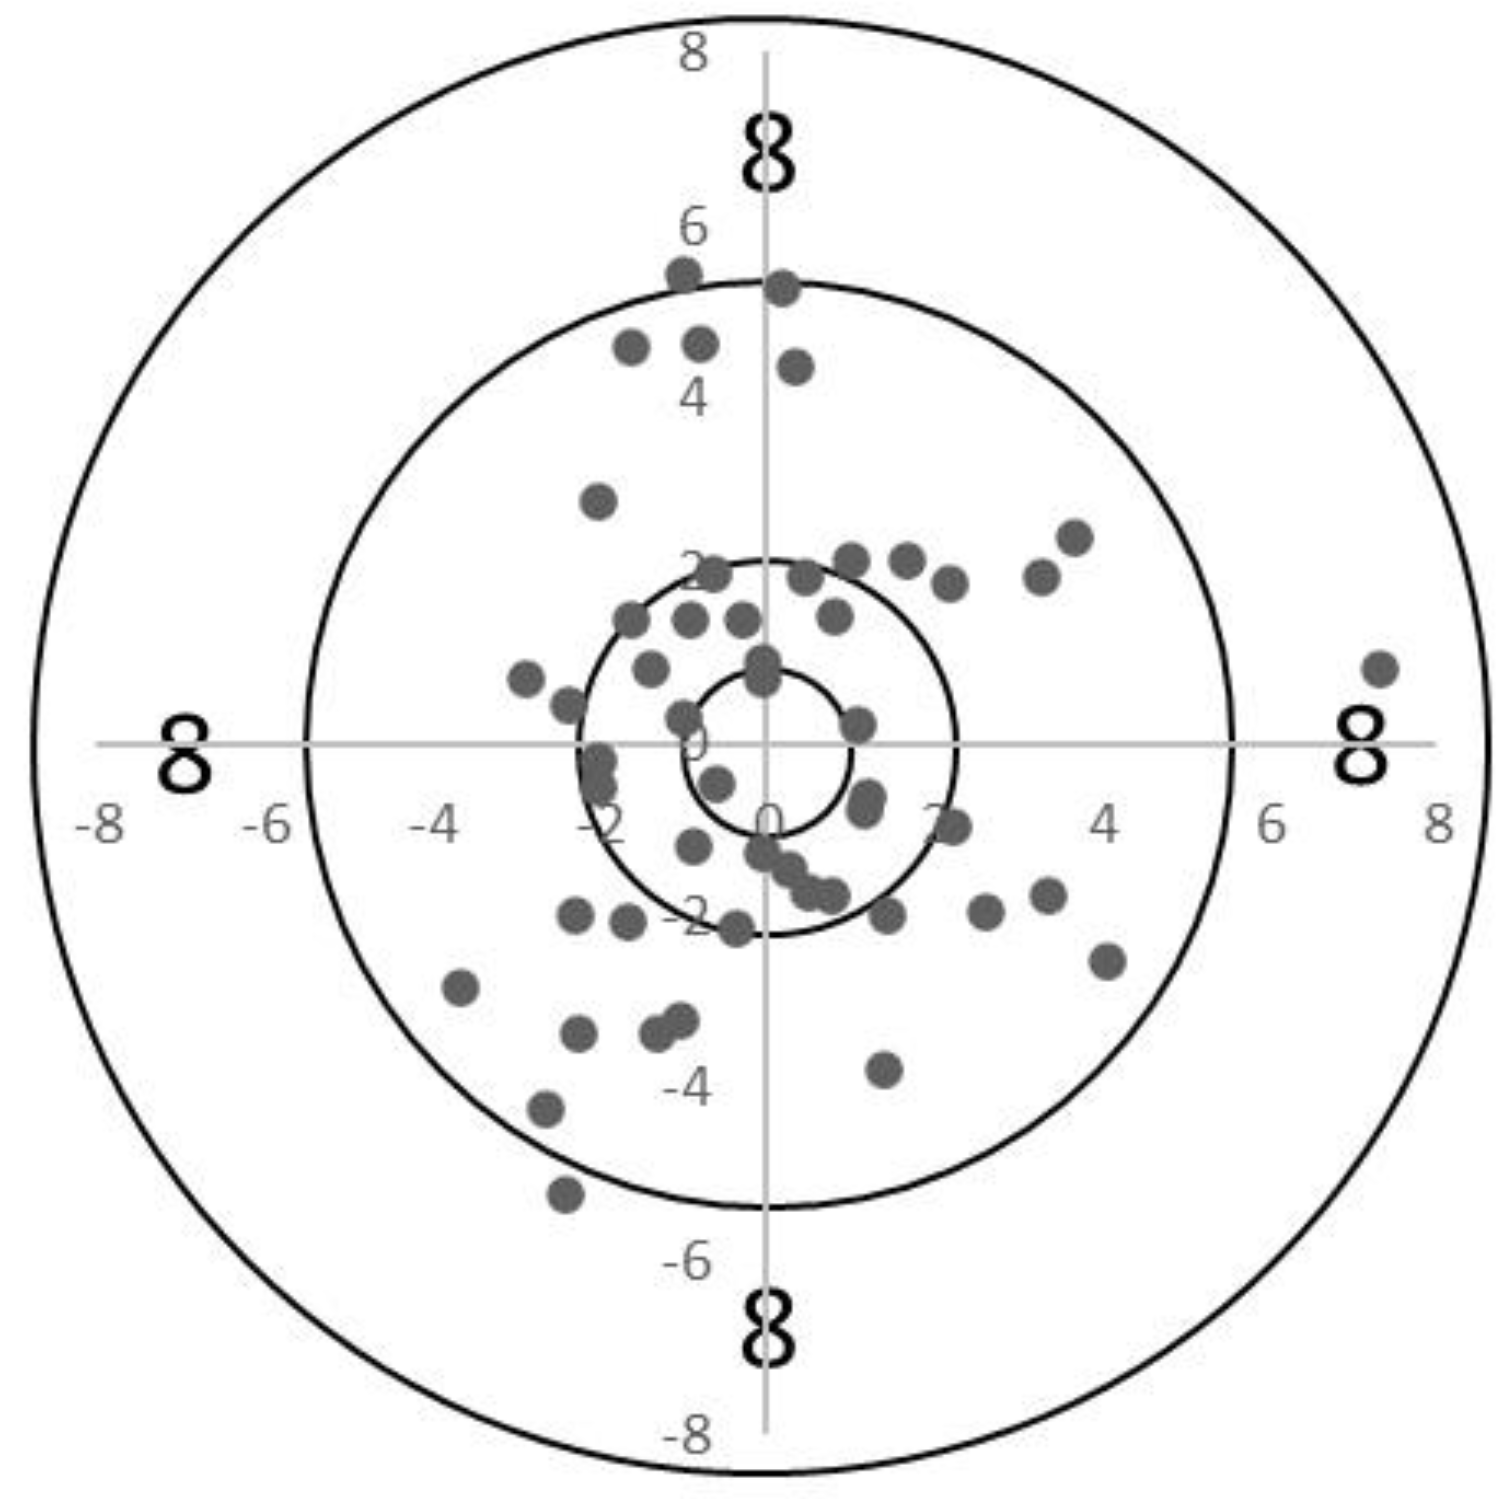
As shown in Figure 5 and Table 4, the x-dispersion is 3.366, and the y-dispersion is 4.988, indicating greater dispersion in up–down aiming compared to left–right aiming. The covariance is −0.558, suggesting a tendency for the y-dispersion to decrease when the x-dispersion increases, and vice versa. For the player in analysis case 2, the mean position for left–right aiming is slightly to the right of the target center with an x-mean value of 0.156, and the up–down aiming is slightly above the center with a y-mean value of 0.519. These results indicate a tendency for the player’s shooting pattern to be slightly biased to the right and upward. The RMSE is 0.542, indicating high precision. The mean scores for each direction show an x-mean score of 9.917 and a y-mean score of 9.767, with a slightly higher 10-point hit rate in the left–right direction.

4.3.3. Shooting Pattern Analysis #3

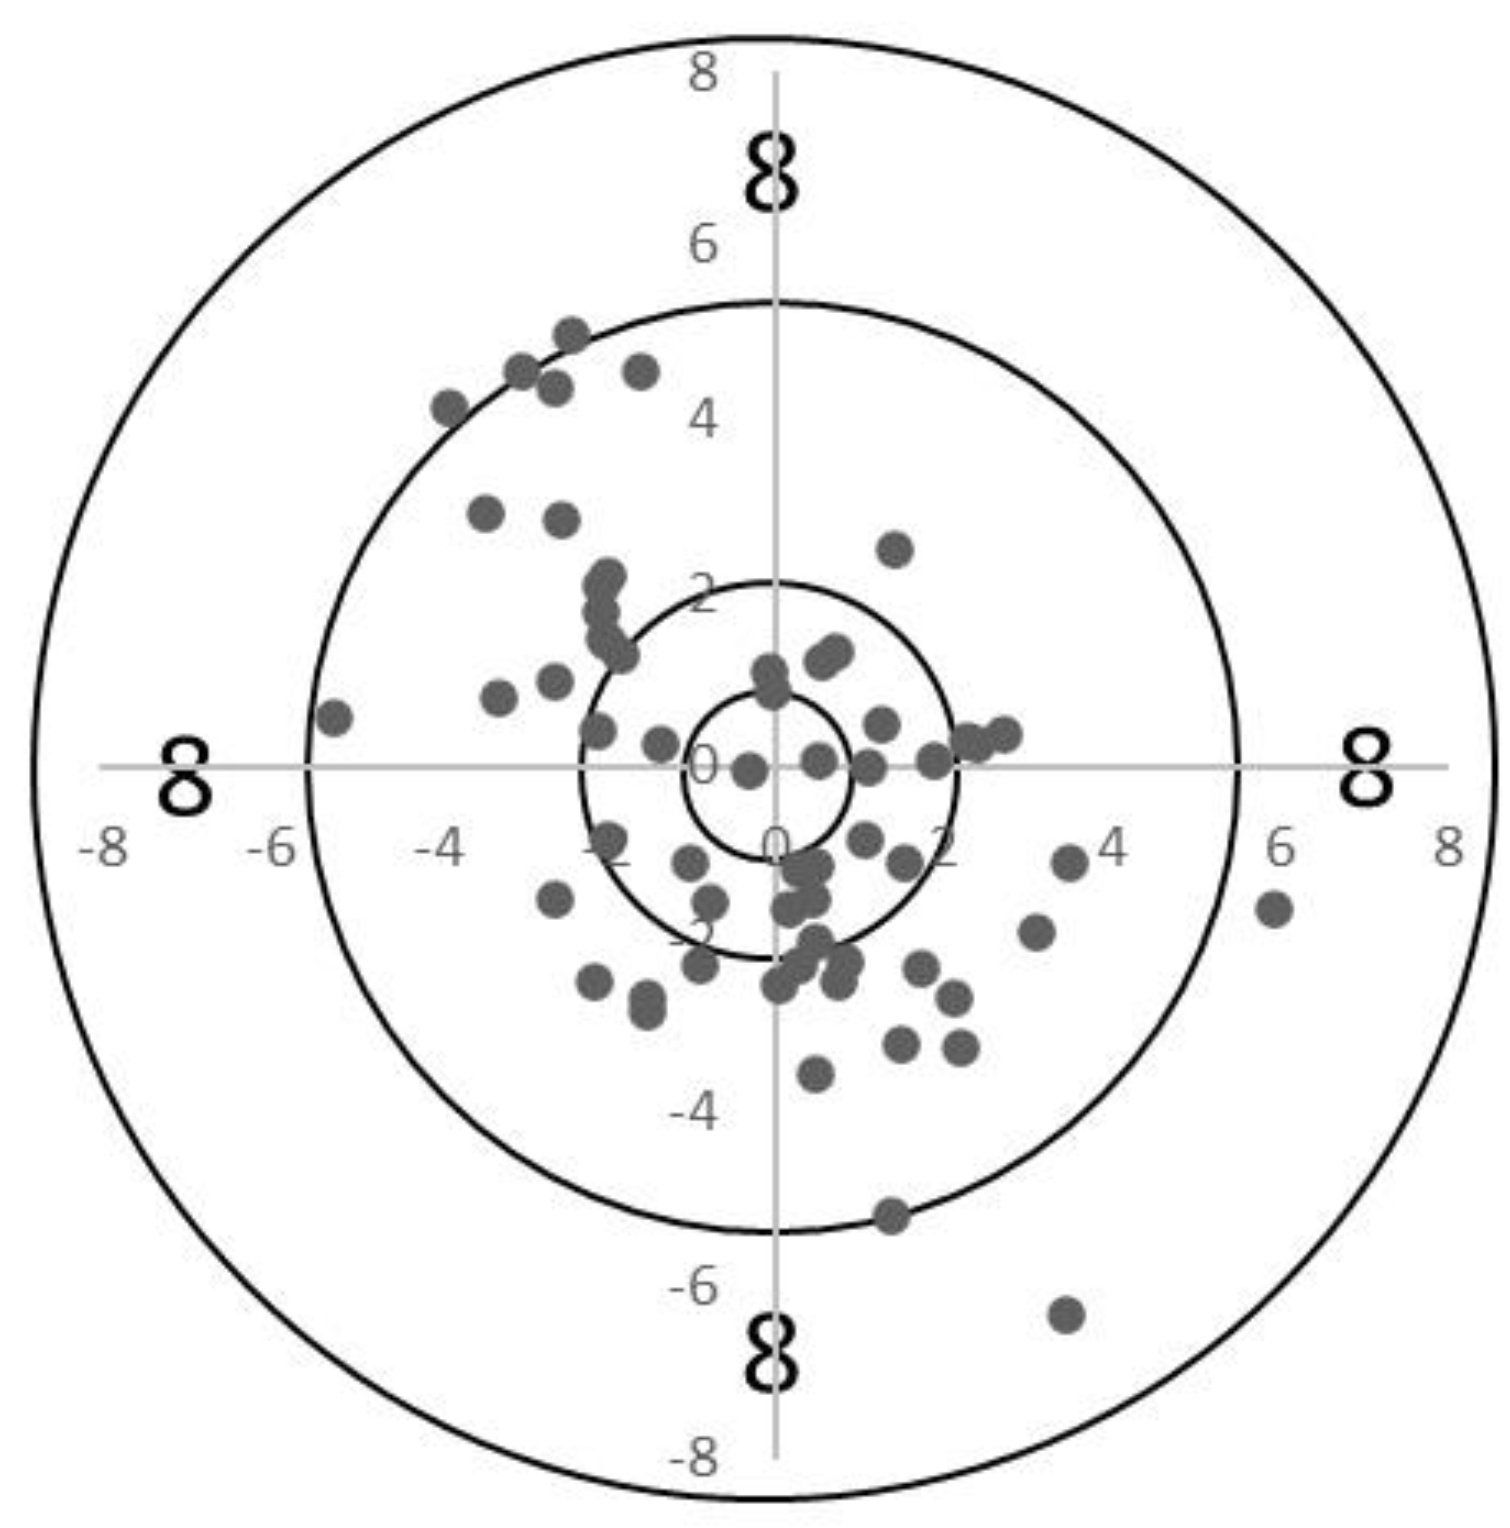
As shown in Figure 6 and Table 5, the x-dispersion is 4.159, and the y-dispersion is 5.878, indicating greater dispersion in up–down aiming compared to left–right aiming. The covariance is 0.631, suggesting a tendency for the y-dispersion to increase when the x-dispersion increases. For the player in analysis case 3, the mean position for left–right aiming is slightly to the left of the target center with an x-mean value of −0.019, and the up–down aiming is slightly above the center with a y-mean value of 0.038. The RMSE is 0.042, the smallest among all subjects, indicating the highest precision.

4.3.4. Shooting Pattern Analysis #4

As shown in Figure 7 and Table 6, the x-dispersion is 4.604 and the y-dispersion is 5.721, indicating greater dispersion in up–down aiming compared to left–right aiming. The covariance is −2.681, the largest absolute covariance value among all subjects, suggesting a strong tendency for the y-dispersion to decrease when the x-dispersion increases, and vice versa. For the player in analysis case 4, the mean position for left–right aiming is slightly to the left of the target center with an x-mean value of −0.201, and the up–down aiming is slightly below the center with a y-mean value of −0.260. These results indicate a tendency for this player’s shooting pattern to have increased deviation in one direction when accuracy improves in the other direction.

4.3.5. Shooting Pattern Analysis #5

As shown in Figure 8 and Table 7, the x-dispersion is 7.228, and the y-dispersion is 3.560, indicating significantly greater dispersion in left–right aiming compared to up–down aiming. This is the largest left–right dispersion result among all subjects. The covariance is −0.356, indicating a negative value, suggesting a tendency for the y-dispersion to decrease when the x-dispersion increases, or conversely, for the y-dispersion to increase when the x-dispersion decreases. For the player in analysis case 5, the mean position for left–right aiming is slightly to the right of the target center with a x-mean value of 0.408, and the up–down aiming is slightly below the center with a y-mean value of −0.309. Additionally, looking at the mean scores for each direction, the x-mean score is 9.700, and the y-mean score is 9.883, which is the lowest x-mean score among all subjects. These results indicate that the player’s shooting pattern often deviates from the 10-point aiming in the left–right direction.

5. Discussion

In shooting disciplines, accuracy and precision are the most crucial factors in competitions. To improve these aspects, it is essential to understand and analyze the shooting patterns of athletes. In this study, we utilized data from the ISSF Grand Prix 2024 Men’s 10 m Air Pistol Competition to comprehensively examine statistics regarding the overall bullet impact locations and analyze the shooting patterns of individual players. Through this analysis, we were able to identify various factors influencing shooting outcomes and gain valuable insights for enhancing performance in competitions.
In this study, we examined the correlation between ranking and various aspects such as bullet impact locations distribution, covariance, mean position, precision, and mean scores. Particularly, we investigated outlier patterns from the perspective of dispersion for each player, aiming to understand how individual shooting styles or specific aiming habits may influence competition outcomes. This analysis aids in devising tailored training plans for improving players’ performance and achieving precise aiming.

5.1. Competition Analysis

Based on actual competition cases from ISSF tournaments, we conducted an analysis of each player’s bullet impact locations. Through dispersion analysis of hit position variance, we identified each player’s shooting style and stability, allowing for a quantitative comparison and evaluation of their bullet impact location pattern and performance. What sets this study apart is the presentation of new performance metrics through dispersion analysis, enabling the derivation of individualized training and strategic plans to enhance players’ performance. By analyzing bullet impact locations image coordinates from real competitions, we could examine shooting patterns such as left–right and up–down stability for each player, utilizing quantitative data on bullet impact locations that were previously unobservable.

5.2. Rankings and Feature Indicator Correlation

The correlation between the x-variance, representing the distribution in the left–right direction, and the ranking showed a weak positive trend with an R-squared value of 0.1549. This indicates that as the ranking decreases, the shot patterns in the left–right direction tend to widen, suggesting a decrease in stability. It also implies that improving the aiming precision in the left–right direction becomes crucial as the ranking decreases. We found that the accuracy of shooting athletes is mainly affected by the sway in the anterior-posterior direction. Thus, reducing the sway in the anterior-posterior direction is essential for improving shooting accuracy [22].
The correlation between the y-variance, representing the distribution in the up–down direction, and the ranking showed a weak positive trend with an R-squared value of 0.1866. This indicates that athletes with lower rankings may exhibit wider shot patterns in the up–down direction, suggesting a need for improving the accuracy of up–down aiming, particularly for athletes with lower rankings.
In shooting, there is a tendency for aiming in the horizontal and vertical directions to change together or in opposite directions. This interaction can be assessed through covariance, and in this study, the covariance between the horizontal direction (x) and the vertical direction (y) was analyzed to examine its correlation with rankings.
When covariance is positive, it indicates a tendency for aiming in both horizontal and vertical directions to increase or decrease together. This suggests that the aiming in both directions interacts with each other and influences the shooting pattern. In cases where this tendency is observed, focusing on maintaining balance between aiming in both directions is necessary to enhance aiming stability.
On the other hand, when the covariance is negative, it indicates that when the horizontal direction increases, the vertical direction decreases, or vice versa. This suggests that aiming in both directions may interact in opposite directions, leading to a higher possibility of aiming instability. Players exhibiting such patterns may require training and strategies to enhance the consistency of their aiming.
Examining the correlation between covariance and ranking, the R-squared value of 0.0178 was observed for the absolute value of covariance. This indicates a weak positive trend, suggesting that the interaction between horizontal and vertical aiming may have a slight influence on ranking. It implies that maintaining a balance between aiming in both directions can positively impact shooting performance.
Analysis of the average position in the horizontal direction provides insight into the accuracy and consistency of horizontal aiming. The average position indicates how far the shots deviate from the horizontal center of the target. The correlation between ranking and the average position in the horizontal direction showed an R-squared value of 0.0048, indicating no significant correlation. This suggests that the average position in the horizontal direction does not directly influence ranking.
Analysis of the average position in the vertical direction allows understanding of the accuracy and consistency of vertical aiming. The average position indicates how far the shots deviate from the vertical center of the target. The correlation between ranking and the average position in the vertical direction showed an R-squared value of 0.0809, indicating a weak positive trend. This implies that players with lower rankings tend to deviate more from the vertical center.
The precision of the bullet impact locations can be determined through the root mean square error (RMSE). The RMSE represents the distance between the bullet impact locations and the center position, with smaller values indicating a more precise shooting pattern. The correlation between ranking and RMSE showed an R-squared value of 0.0808, indicating a weak positive trend. This suggests that lower rankings are associated with lower precision in the bullet impact locations, implying that additional efforts to improve precision may be necessary for lower-ranked players.
Analysis based on the average score in the horizontal direction measures how far the shots deviate from the horizontal center of the target, evaluating the accuracy of scores in the horizontal direction. The correlation between ranking and the average score in the horizontal direction showed an R-squared value of 0.0245, indicating a weak negative trend. This suggests that lower rankings are associated with lower scores in the horizontal direction, implying that improving accuracy in the horizontal direction may contribute to an increase in ranking.
Analysis based on the average score in the vertical direction measures how far the shots deviate from the vertical center of the target, evaluating the accuracy of scores in the vertical direction. The correlation between ranking and the average score in the vertical direction showed an R-squared value of 0.0056, indicating almost no correlation. This suggests that the average score in the vertical direction does not significantly influence ranking.

5.3. Player-Specific Case Analysis

Player-specific case analysis involves individually examining the bullet impact location data of each player to understand their shooting patterns and technical characteristics. Additionally, it involves identifying outlier patterns from a variance perspective. Through this process, a comprehensive understanding of each player’s aiming accuracy, bullet impact locations precision, lateral and vertical dispersion, covariance, mean position, and other factors can be obtained. Analyzing this data allows us to identify how each player’s shooting style or specific aiming habits may influence match outcomes, and enables the formulation of tailored training plans for improving competitive skills.

6. Conclusions

Shooting is a discipline that requires both accuracy and precision. Therefore, it is important to analyze individual shooting patterns and the technical characteristics of each player to find ways to improve aiming accuracy and competitive performance. In this study, we utilized data from the ISSF Grand Prix 2024 Men’s 10 m Air Pistol competition to quantify the bullet impact location results and propose new metrics for the objective evaluation of shooting skills. We converted the shot results of the top 20 participants into image coordinates and calculated x-variance, y-variance, covariance, x-mean, y-mean, root mean square error (RMSE), x-mean score, and y-mean score. This enabled us to analyze the correlation between the distribution of shots in the horizontal and vertical directions, the relationship between horizontal and vertical aiming, horizontal mean position, vertical mean position, bullet impact locations precision, horizontal mean score, vertical mean score, and ranking. Additionally, we examined outlier patterns from a statistical perspective through individual case analyses.
Through the research findings, we elucidated the relationship between the distribution of shots in the horizontal and vertical directions and ranking, thereby clarifying the relationship between shooting patterns and competition outcomes. Particularly, by analyzing covariance, we were able to understand how aiming in the horizontal and vertical directions interact, quantifying their impact on the stability and accuracy of shooting. This enabled us to propose directions for improving shooting skills and enhancing performance based on objective data rather than subjective judgments.
In future research, analysis across various shooting disciplines and distances beyond the 10 m air pistol event will be necessary to develop a more comprehensive approach to improving shooting performance. Building upon this, enhanced training strategies and strategies for improving competition skills can be fortified. The introduction of such novel approaches and metrics will serve to enhance the performance of shooting athletes, leading to better outcomes.

Author Contributions

Conceptualization, E.L.; methodology, J.-Y.M.; software, E.L.; validation, J.-Y.M. and E.L.; formal analysis, J.-Y.M.; investigation, J.-Y.M.; resources, J.-Y.M.; data curation, J.-Y.M.; writing—original draft preparation, J.-Y.M.; writing—review and editing, E.L.; visualization, J.-Y.M.; supervision, E.L.; project administration, E.L.; funding acquisition, E.L. All authors have read and agreed to the published version of the manuscript.

Funding

This research was conducted with the support of the “Convergence Graduate School Support Program for the Sports Industry” funded by the Ministry of Culture, Sports and Tourism of the Republic of Korea and the Korea Sports Promotion Foundation (B0080319002396).

Institutional Review Board Statement

Not applicable.

Informed Consent Statement

Not applicable.

Data Availability Statement

The data used in this study is publicly available from ISFF and can be accessed via the following URL: https://www.issf-sports.org (accessed on 7 July 2024).

Conflicts of Interest

The authors declare no conflicts of interest.

References

  1. Hwang, S.Y.; Park, J. A descriptive review of shooting skills and physical factors of shooters. Sports Sci. 2023, 41, 217–228. [Google Scholar] [CrossRef]
  2. Jeong, I.S. A study on the effect of coaching machine training on improving the performance of shooting players. J. Korean Soc. Sports Sci. 2020, 29, 1159–1167. [Google Scholar]
  3. Hawkins, R. Identifying mechanic measures that best predict air-pistol shooting performance. Int. J. Perform. Anal. Sport 2011, 11, 499–509. [Google Scholar] [CrossRef]
  4. Joo, D.Y.; Kim, M.G. The effect of body stability on a shooter’s aiming shot. Korean Sports Res. 2004, 15, 551–566. [Google Scholar]
  5. Woo, C.H.; Lee, G.S. Kinematic analysis of pistol shooting. Korean J. Kinesiol. 2000, 9, 81–101. [Google Scholar]
  6. Lee, Y.; Kim, S. The effect of core muscle strengthening exercises using an unstable support surface on the balance ability and shooting scores of shooters. J. Orthop. Sports Phys. Ther. 2020, 16, 77–84. [Google Scholar] [CrossRef]
  7. Kim, S.; Lee, K.C. The effect of air pistol aiming on scoring. Coach. Competency Dev. J. 2004, 6, 165–173. [Google Scholar]
  8. Eom, H.J.; Kim, J.A.; Choi, H. Analysis of the efficiency of volleyball game analysis program input information settings and technical performance: Focusing on women’s games in the 2018–2019 professional volleyball regular season. Korean J. Phys. Educ. Meas. Eval. 2020, 22, 137–161. [Google Scholar]
  9. Choi, J.; Kim, A. A literature review on the improvement of physical strength and performance of shooting athletes. J. Korean Soc. Sports Converg. 2021, 19, 27–33. [Google Scholar]
  10. Kim, S.E.; Cho, C.R. The impact of each technical factor on air rifle shooting on scoring. Korean J. Sports Sci. 2004, 13, 753–761. [Google Scholar]
  11. Kim, Y.; Kim, G.S. Kinematic analysis of air pistol shooting posture between excellent and non-excellent athletes. Korean J. Kinesiol. 2009, 19, 509–517. [Google Scholar]
  12. Kim, K.W.; Jeon, G.G. The effect of stabilization of muzzle and posture on performance when shooting an air rifle. J. Korean Soc. Sports Sci. 2013, 22, 1169–1178. [Google Scholar]
  13. Dall, I.; Park, J.L. Shot distribution in target archery, with application to arrow selection. Proc. Inst. Mech. Engineers. J. Sports Eng. Technol. 2022, 17543371221130537. [Google Scholar] [CrossRef]
  14. Mononen, K.; Konttinen, N.; Viitasalo, J.; Era, P. Relationships between postural balance, rifle stability and shooting accuracy among novice rifle shooters. Scand. J. Med. Sci. Sports 2007, 17, 180–185. [Google Scholar] [CrossRef] [PubMed]
  15. Liang, H.W.; Kong, B. A shooting training and instructing system based on image analysis. In Proceedings of the 2006 IEEE International Conference on Information Acquisition, Veihai, China, 20–23 August 2006; IEEE: New York, NY, USA; pp. 961–966. [Google Scholar]
  16. Mon-López, D.; Tejero-González, C.M. Validity and reliability of the Target Scan ISSF Pistol & Rifle application for measuring shooting performance. Scand. J. Med. Sci. Sports 2019, 29, 1707–1712. [Google Scholar] [PubMed]
  17. Lang, D.; Zhou, A. Determinants of shooting performance in elite air rifle shooters. Sports Biomech. 2022, 1–11. [Google Scholar] [CrossRef] [PubMed]
  18. Baca, A.; Kornfeind, P. Stability analysis of motion patterns in biathlon shooting. Hum. Mov. Sci. 2012, 31, 295–302. [Google Scholar] [CrossRef] [PubMed]
  19. Quan, C.H. Relationship between aiming patterns and scores in archery shooting. Korean J. Appl. Biomech. 2016, 26, 353–360. [Google Scholar] [CrossRef]
  20. Olsson, E.; Laaksonen, M.S. Key technical components for air pistol shooting performance. Int. J. Perform. Anal. Sport 2021, 21, 348–360. [Google Scholar] [CrossRef]
  21. Lin, Z.; Wu, S. The design and implementation of shooting training and intelligent evaluation system. In Emerging Computation and Information Technologies for Education: Proceedings of 2012 International Conference on Emerging Computation and Information Technologies for Education (ECICE 2012); Springer: Berlin/Heidelberg, Germany, 2012; pp. 107–115. [Google Scholar]
  22. Ding, P.; Zhang, X.; Fan, X.; Cheng, Q. Design of automatic target-scoring system of shooting game based on computer vision. In Proceedings of the 2009 IEEE International Conference on Automation and Logistics, Shenyang, China, 5–7 August 2009; pp. 825–830. [Google Scholar]
  23. Kim, S. Real-time scoring of air rifle shooting using image processing techniques. J. Korean Soc. Inf. Technol. 2015, 13, 33–41. [Google Scholar]
  24. Lee, T.G.; Lim, C.G.; Kim, K.C.; Kim, Y.M. Extracting the Point of Impact from Simulated Shooting Target based on Image Processing. J. Internet Comput. Serv. 2010, 11, 117–128. [Google Scholar]
  25. Rudzinski, J.; Luckner, M. Low–cost computer vision based automatic scoring of shooting targets. In Knowledge Engineering, Machine Learning and Lattice Computing with Applications: 16th International Conference, KES 2012, San Sebastian, Spain, 10–12 September 2012; Revised Selected Papers 16; Springer: Berlin/Heidelberg, Germany, 2013; pp. 185–195. [Google Scholar]
  26. Aryan, P.R. Vision based automatic target scoring system for mobile shooting range. In Proceedings of the 2012 International Conference on Advanced Computer Science and Information Systems (ICACSIS), Depok, Indonesia, 1–2 December 2012; pp. 325–329. [Google Scholar]
  27. Ali, F.; Mansoor, A.B. Computer vision based automatic scoring of shooting targets. In Proceedings of the 2008 IEEE International Multitopic Conference, Karachi, Pakistan, 23–24 December 2008; pp. 515–519. [Google Scholar]
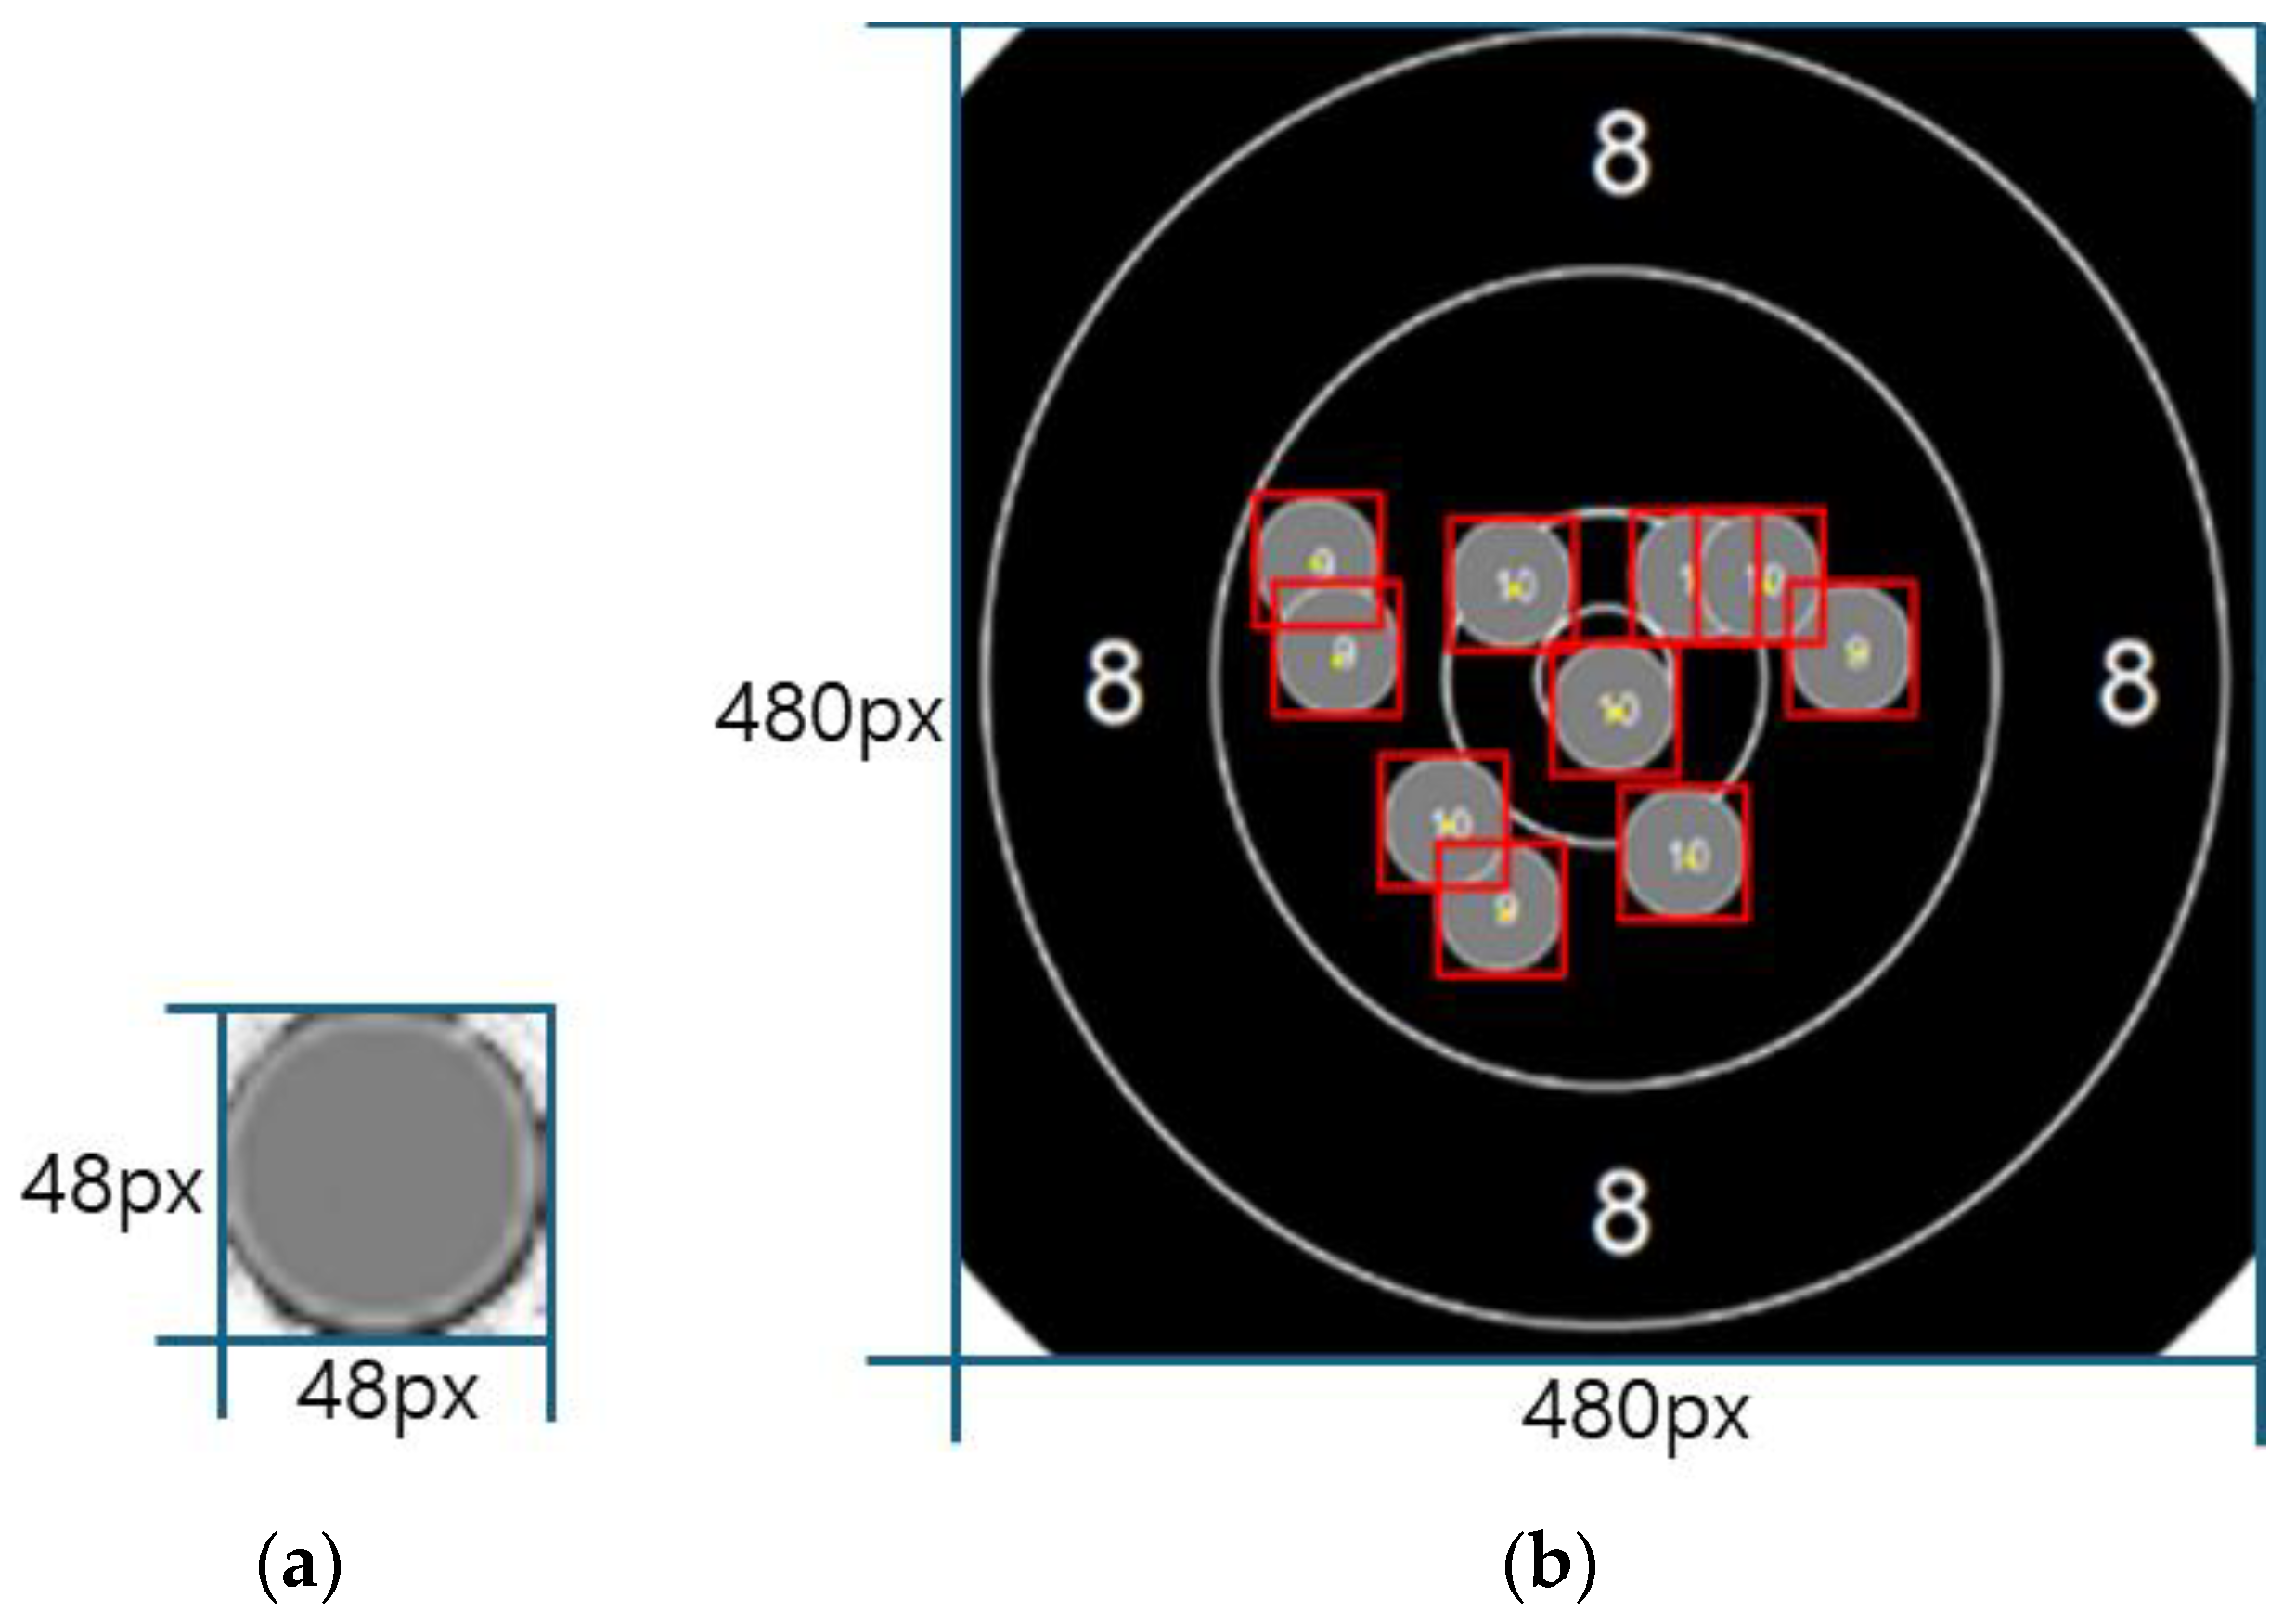
Figure 1. Example of detecting bullet impact locations on the target image using template matching. (a) The bullet impact template used. (b) Example of the top 10 correlation positions detected on the target image using template matching (red boxes).
Applsci 14 06006 g001
Figure 2. Example of collected ISSF image data (6 target results per player).
Applsci 14 06006 g002
Figure 3. Correlation analysis of feature indicators. (a) Correlation between ranking and x-dispersion. (b) Correlation between ranking and y-dispersion. (c) Correlation between ranking and covariance. (d) Correlation between ranking and x-mean. (e) Correlation between ranking and y-mean. (f) Correlation between ranking and RMSE. (g) Correlation between ranking and x-mean score. (h) Correlation between ranking and y-mean score.
Applsci 14 06006 g003
Figure 4. Shooting pattern analysis #1.
Applsci 14 06006 g004
Figure 5. Shooting pattern analysis #2.
Applsci 14 06006 g005
Figure 6. Shooting pattern analysis #3.
Applsci 14 06006 g006
Figure 7. Shooting pattern analysis #4.
Applsci 14 06006 g007
Figure 8. Shooting pattern analysis #5.
Applsci 14 06006 g008
Table 1. Overview of Prior Research on Shooting Performance and Target Analysis.
Research AreaAuthor(s) & YearTitleMain Content
Shooting
performance
Liang and Kong, 2006 [15]A shooting training and instructing system based on image analysisDesigning and implementing a computer-assisted shooting training and coaching system. After the camera captures the target image, the aiming point marked by the laser spot is extracted from the image, and the corresponding score is calculated and printed on the screen in real-time.
Mon-Lopez and Tejero-Gonzalez, 2019 [16]Validity and reliability of the Target Scan ISSF Pistol & Rifle application for measuring shooting performanceConfirming the validity and reliability of the Target Scan ISSF Pistol and Rifle application, an automatic mobile application that measures shooter performance through image analysis
Lang and Zhou, 2022 [17]Determinants of shooting performance in elite air rifle shootersConfirming the determinants of shooting ability in elite 10 m air rifle shooters using the SCATT optical shooting test system and force platform
Shooting
patterns
Baca and Kornfeind, 2012 [18]Stability analysis of motion patterns in biathlon shootingAnalyzing the aiming stability of nine biathlon athletes. Reconstructing the horizontal and vertical movements of the rifle barrel using a video-based system.
Quan, 2016 [19] Relationship between aiming patterns and scores in archery shootingInvestigating the relationship between archery aiming patterns and scores using nine accelerometers on four middle school students at the elementary school level
Target
analysis
Olsson and Laaksonen, 2021 [20]Key technical components for air pistol shooting performanceUsing an optical training device to measure shooting scores and 17 trajectory variables of aiming points
Lin and Wu, 2012 [21]The design and implementation of shooting training and intelligent evaluation systemAutomatic target scoring and skill assessment through tracking records of shooting aiming points obtained via video acquisition
Table 2. ISSF Grand Prix 2024 Men’s 10 m Air Pistol Target Analysis Results.
RankingTotal ScoreX-VarianceY-VarianceCovarianceX-MeanY-MeanRMSEX-Mean
Score
Y-Mean
Score
15843.0212.916−0.711−0.143−0.6810.696 9.950 9.933
25824.3303.358−0.576−0.206−0.7820.809 9.900 9.950
35813.7123.977−0.7990.39−0.4770.616 9.800 9.900
45813.9133.596−0.5260.2540.2740.374 9.850 9.850
55783.3664.988−0.5580.1560.5190.542 9.917 9.767
65773.5365.9180.046−0.184−0.2680.325 9.900 9.817
75774.1595.8780.631−0.0190.0380.042 9.820 9.820
85753.1644.5670.123−0.521−0.5000.722 9.900 9.950
95754.8884.258−0.4920.788−0.4300.898 9.717 9.867
105744.7345.107−1.620.403−0.8620.952 9.740 9.900
115744.6045.721−2.681−0.201−0.2600.329 9.850 9.850
125745.2915.453−0.327−0.888−0.6961.128 9.850 9.900
135737.2283.560−0.3560.408−0.3090.512 9.700 9.883
145733.5745.882−0.892−0.355−0.0830.365 9.900 9.750
155734.7234.389−0.293−0.224−0.8950.923 9.883 9.950
165733.1462.910−0.665−0.147−0.6990.714 9.950 9.933
175725.8074.481−0.9710.195−0.3680.416 9.783 9.917
185714.5737.2990.3120.085−0.7570.762 9.867 9.867
195704.9915.8621.2310.216−0.3520.413 9.800 9.820
205703.8965.422−0.771−0.486−1.5701.644 9.883 9.967
Table 3. Shooting pattern analysis #1.
RankingTotal ScoreX-VarianceY-VarianceCovarianceX-MeanY-MeanRMSEX-Mean
Score
Y-Mean
Score
15843.0212.916−0.711−0.143−0.6810.696 9.950 9.933
Table 4. Shooting pattern analysis #2.
RankingTotal ScoreX-VarianceY-VarianceCovarianceX-MeanY-MeanRMSEX-Mean
Score
Y-Mean
Score
55783.366 4.988 −0.558 0.156 0.519 0.5429.9179.767
Table 5. Shooting pattern analysis #3.
RankingTotal ScoreX-VarianceY-VarianceCovarianceX-MeanY-MeanRMSEX-Mean
Score
Y-Mean
Score
75774.1595.8780.631−0.0190.0380.0429.8209.820
Table 6. Shooting pattern analysis #4.
RankingTotal ScoreX-VarianceY-VarianceCovarianceX-MeanY-MeanRMSEX-Mean
Score
Y-Mean
Score
115744.6045.721−2.681−0.201−0.2600.3299.8509.850
Table 7. Shooting pattern analysis #5.
RankingTotal ScoreX-VarianceY-VarianceCovarianceX-MeanY-MeanRMSEX-Mean
Score
Y-Mean
Score
135737.2283.560−0.3560.408−0.3090.5129.7009.883
Disclaimer/Publisher’s Note: The statements, opinions and data contained in all publications are solely those of the individual author(s) and contributor(s) and not of MDPI and/or the editor(s). MDPI and/or the editor(s) disclaim responsibility for any injury to people or property resulting from any ideas, methods, instructions or products referred to in the content.