Article

Experimental Thrust and Specific Impulse Analysis of Pulsed Detonation Combustor

1
Romanian National Research & Development Institute for Gas Turbines COMOTI, 220D Iuliu Maniu, 061126 Bucharest, Romania
2
Faculty of Aerospace Engineering, National University of Science and Technology POLITEHNICA Bucharest, 1-7 Polizu Street, 1, 011061 Bucharest, Romania
3
Institute of Applied Physics, Moldova State University, Academiei Street, 5, MD-2028 Chisinau, Moldova
*
Author to whom correspondence should be addressed.
Appl. Sci. 2024, 14(14), 5999; https://doi.org/10.3390/app14145999
Submission received: 21 June 2024 / Revised: 6 July 2024 / Accepted: 8 July 2024 / Published: 10 July 2024
(This article belongs to the Section Transportation and Future Mobility)

Abstract

:
Detonation combustion represents a significant advancement in efficiency over traditional deflagration methods. This paper presents a Pulsed Detonation Combustor (PDC) model that is designed with an aerodynamic mixing chamber featuring Hartmann–Sprenger resonators and crossflow injection. This design enhances operational cycle frequency and enables sustained detonation over short distances (below 200 mm). The PDC’s performance was evaluated through a comprehensive full-factorial experimental campaign, incorporating four factors with four discrete levels each. Testing was conducted using both hydrogen/air and hydrogen/oxygen mixtures, highlighting the PDC’s potential as a carbon-free combustion chamber suitable for both air-breathing and space-based propulsion systems. One advantage is the versatility of our PDC breadboard, which lies in its applicability to both terrestrial and in-space applications, such as interplanetary travel or trajectory corrections. Thrust measurements were recorded using a load cell and time-averaged thrust levels were determined over the detonation cycle and are reported herein, together with the specific impulse. The results underscore the PDC’s promise as an efficient propulsion technology for future aerospace applications.

1. Introduction

One of the most pressing challenges for this century is greenhouse gas emission reduction and pollution mitigation. With increasing demand for energy production and more drastic regulations, the European Commission set the target for a 55% reduction in greenhouse gas emissions by 2030; in 2050, Europe should be the first climate-neutral continent, through the adoption of the Green Deal [1]. To confirm the worldwide commitment, at the COP28 UN Climate Conference it was agreed that the parties present should reduce greenhouse gas emissions by 43% by 2030 to limit the temperature increase at 1.5 °C compared to pre-industrial levels [2].
Conventional engines based on the Brayton cycle are today limited in terms of efficiency, and progress is slow regarding weight reduction and temperature increase in combustors. Ever-increasing the temperature inlet turbine (TIT) and the pressure ratio of gas turbine engines demands more advanced quality manufacturing and material types, like ceramic matrix composites (CMC), while turbine blades require more complex cooling methods, for which using over 10% from the compressor air mass flow is not uncommon [3,4]. To overcome these limitations, changing the core engine combustion might be a solution. Moving from the slow flame speed of the deflagration process to the supersonic propagation velocities of detonation is one option. This type of pressure-gain combustion (PGC) was analyzed, with encouraging results. Gulen et al. [4] compared the net combined cycle efficiency of pressure-constant and pressure-gain combustion engines, with an almost 5% increase for the PGC-based option, while other studies have indicated even higher efficiency increases [5].
With the advent of Brayton cycle-based gas turbine engines (GTE), interest into detonation engines fell short, though it has been proposed for jet propulsion applications since 1940s [6]. Insights [7,8,9] into pulsed detonation engines (PDEs) and rotating detonation engines (RDEs) have been made since then, and in recent years these have regained attention. In 2004, an air-breathing PDE demonstrator was deployed on an aircraft [9], followed in 2021 by a suborbital module launched on a sounding rocket to test a RDE as the main source of propulsion and a PDE for the reaction control system (RCS) [10].
Pulsed detonation combustor (PDCs) operation is described by the next steps: filling, ignition and detonation initiation, propagation and blowout with purging. Filling speed is the main factor that limits the cycle frequency of PDCs, with high implications in performance [11]. Another important aspect in PDCs is Deflagration-to-Detonation Transition (DDT) enhancement. To increase the flame speed enough that DDT occurs, high turbulence is needed [10].
In most PDCs, for filling fresh combustible mixture into PDCs, mechanical or solenoid valves are used, while Shchelkin spirals are deployed for DDT enhancement. Rotary valves with as 50 Hz frequency are presented by Carter et al. [12], while Wang et al. [13] and Li et al. [14] achieved 40 Hz and 49 Hz, respectively, by means of solenoid valves. Due to their mechanical limitation and reliability, valveless systems were proposed, where detonation products can enter the feed lines [15]. Also, Shchelkin spirals have limited lifespans because of the damage from high temperature reactive products, so supersonic jet crossflow for turbulence enhancement was studied [16]. Valveless and semi-valveless examples were examined by Wang et al. [13] and Matzouka et al. [17], with a maximum frequency of 110 Hz and 1916 Hz, respectively.
The PDC introduced in this paper is a concept developed by our team, which builds on previous methodologies [18]. The design incorporates Hartmann–Sprenger resonators and crossflow gas injections, which serve a dual purpose: they create an aerodynamic valve to regulate fuel admission into the PDC and enhance mixing and turbulence upstream of the ignition point for the fresh mixture. By integrating an obstacle at the end of the detonation chamber, our model achieves detonation within a length of less than 200 mm. Switching oxidizers without geometry modifications of PDCs represents a challenge in ensuring detonation attainment. The detonation cell size (λ) is dependent on the mixture and pressure input of the supply gasses [19]. For instance, H 2 / O 2 mixtures have a smaller cell size compared to H 2 / a i r mixtures at the same feed pressure, resulting in a faster DDT. Additionally, H 2 / O 2 mixtures are more prone to detonation because nitrogen ( N 2 ) acts as a heat sink, slowing down the combustion process. Therefore, the sizing of the geometry is critical [20].
To evaluate the performance of PDEs, experimental studies in the field are necessary. For combustion wave speed analysis and for confirming detonation existence, high frequency sensors are implemented on combustor tubes, like thermocouples or piezoelectric pressure transducers. Also, flow mass and thrust measurement are necessary to determine the specific impulse or equivalence ratio. Kasahara et al. [21] measured the mass and pressure difference in their propellant tanks to determine the time-average mass flow of their oxygen and ethylene mixture. Also, thrust was evaluated with a spring-damper mechanical model applied to their load cell to compensate for their high impulsive thrust. In this way, specific impulse values up to 305 s were obtained [21].
Matsouka et al. [22] studied a PDE in low-ambient pressure with a time-averaged thrust of 3.2 N and specific impulse at 154 s. Mass flows of 6.4 g/s of liquid nitrous oxide and 0.7 g/s gaseous ethylene were determined through the water substitute method, where gas was collected in a tank at atmospheric pressure. The pressure value in the detonation tube was measured with piezoelectric transducers to validate a quasi-state model, used in calculating time-averaged thrust and specific impulse. Buyakofu et al. [23] ground tested an S-shaped RCS developed from previous work [15], that ran on a stoichiometric mixture of gaseous oxygen and methane, with a total mass flow of 14.8 g/s. The flow was supposed to be choked at the throats, so mass flow was estimated using piezoelectric pressure transducers upstream of the methane injector. Engine configuration was temporarily changed to install it with a load cell, and in this way the time-averaged thrust was measured at 8.27, 8.39, 8.72 and 9.17 N at 1, 2, 5 and 10 Hz, respectively [23]. On the demonstrator itself, a total mass flow of 11.9 g/s was determined with the same method as presented before, while angular velocity was evaluated instead of thrust, being used as a Gaussian distribution of the telemetric data received at the end of the mission.
Li et al. [14] measured the mass flow of gaseous oxygen by collecting it at cold-test conditions, while in the case of liquid kerosene, an orifice meter was used. Thrust is determined with a dynamic piezoelectric transducer and a specific impulse up to 197 s is estimated at an operating frequency of 49 Hz, based on obtained mass flows and thrust [14]. A PDE with gaseous oxygen and liquid kerosene was studied by Wang et al. [24], where they obtained thrust values of 43.9 N at 35 Hz and 50 N at 40 Hz with a calibrated load cell. Calibration was performed to assess the influence of feed lines on the PDE-load cell assembly, using a piston that applied forces up to 700 N [24]. In another study, they moved on to oxygen-enriched air, and mixed and measured the thrust with a piezoelectric transducer that had a sampling speed of 200 kS/s [25]. Mass flow was determined using pressure and mass difference in the feed tank for oxidizer and fuel, respectively [25].
This research paper is part of an extensive experimental campaign for both hydrogen/air and hydrogen/oxygen PDC operation under atmospheric conditions. The aim of this study is to disseminate the impact of several parameters (i.e., ER, oxidizer pressure, exhaust pipe length and spark plug frequency) on the PDC performances expressed in terms of time-average thrust levels, and the total and fuel specific impulse.

2. Materials and Methods

2.1. Experimental Model

The research presented in this paper centers on an experimental model that employs a passive control approach to initiate pulsating detonation within the pulsed detonation combustor (PDC). This is achieved by creating consecutive transverse counter-rotating vortex structures, which are well-suited for high-speed mixing, without the need for any moving mechanical components. To enhance the mixing process, two synchronized Hartmann wave generators, as discussed in previous studies [16], are utilized. The PDC prototype (Figure 1) is composed of three primary components: the Injection and Mixing Chamber, the Ignition Chamber, and the Detonation Tube.
The fuel, gaseous hydrogen, is introduced axially into a cylindrical premixing chamber through a nozzle (3—fuel inlet). Air or oxygen enters perpendicularly via two tangential channels (1—oxidizer inlet). These streams pass through Hartmann resonators (8), generating high-frequency pressure pulsations upstream (2—end wall, 4—air passage window, 5—perforated plate). This setup creates a torsional vortex of alternating rotational sense (6—vortex generation chamber) from the colliding oxidant jets, mixing the oxidizer and fuel while forming an aerodynamic valve that regulates the axial fuel inlet. High vortex intensity means there is low static pressure in the chamber, which allows fuel injection and mixing with the oxidizer. As the vortex decelerates, creating a stagnation zone with high static pressure, the aerodynamic valve closes, blocking fuel entry. Further insights into vortex generation using crossflow jets and its impact on DDT promotion can be found in reference [26].
The premixing chamber connects to the detonation chamber via a diaphragm (7) with a central hole, accelerating the flow to supersonic speeds. When the aerodynamic valve is open, the flow in the premixing chamber is mainly tangential, minimizing the flow to the detonation chamber. Upon valve closure, the increased pressure in the premixing chamber pushes the fresh mixture supersonically into the detonation chamber, preceded by a shock wave.
Inside the detonation chamber, a spark plug ignites the mixture, creating a combustion wave. The wave is halted upstream by the diaphragm, while the shock wave, initially faster, encounters a diameter jump at the chamber exit. This interaction should allow the combustion wave to catch up, forming a detonation wave that propagates through the exhaust pipe to the PDE’s open end [27].
Figure 1. Pulsed detonation chamber architecture [27].
Applsci 14 05999 g001

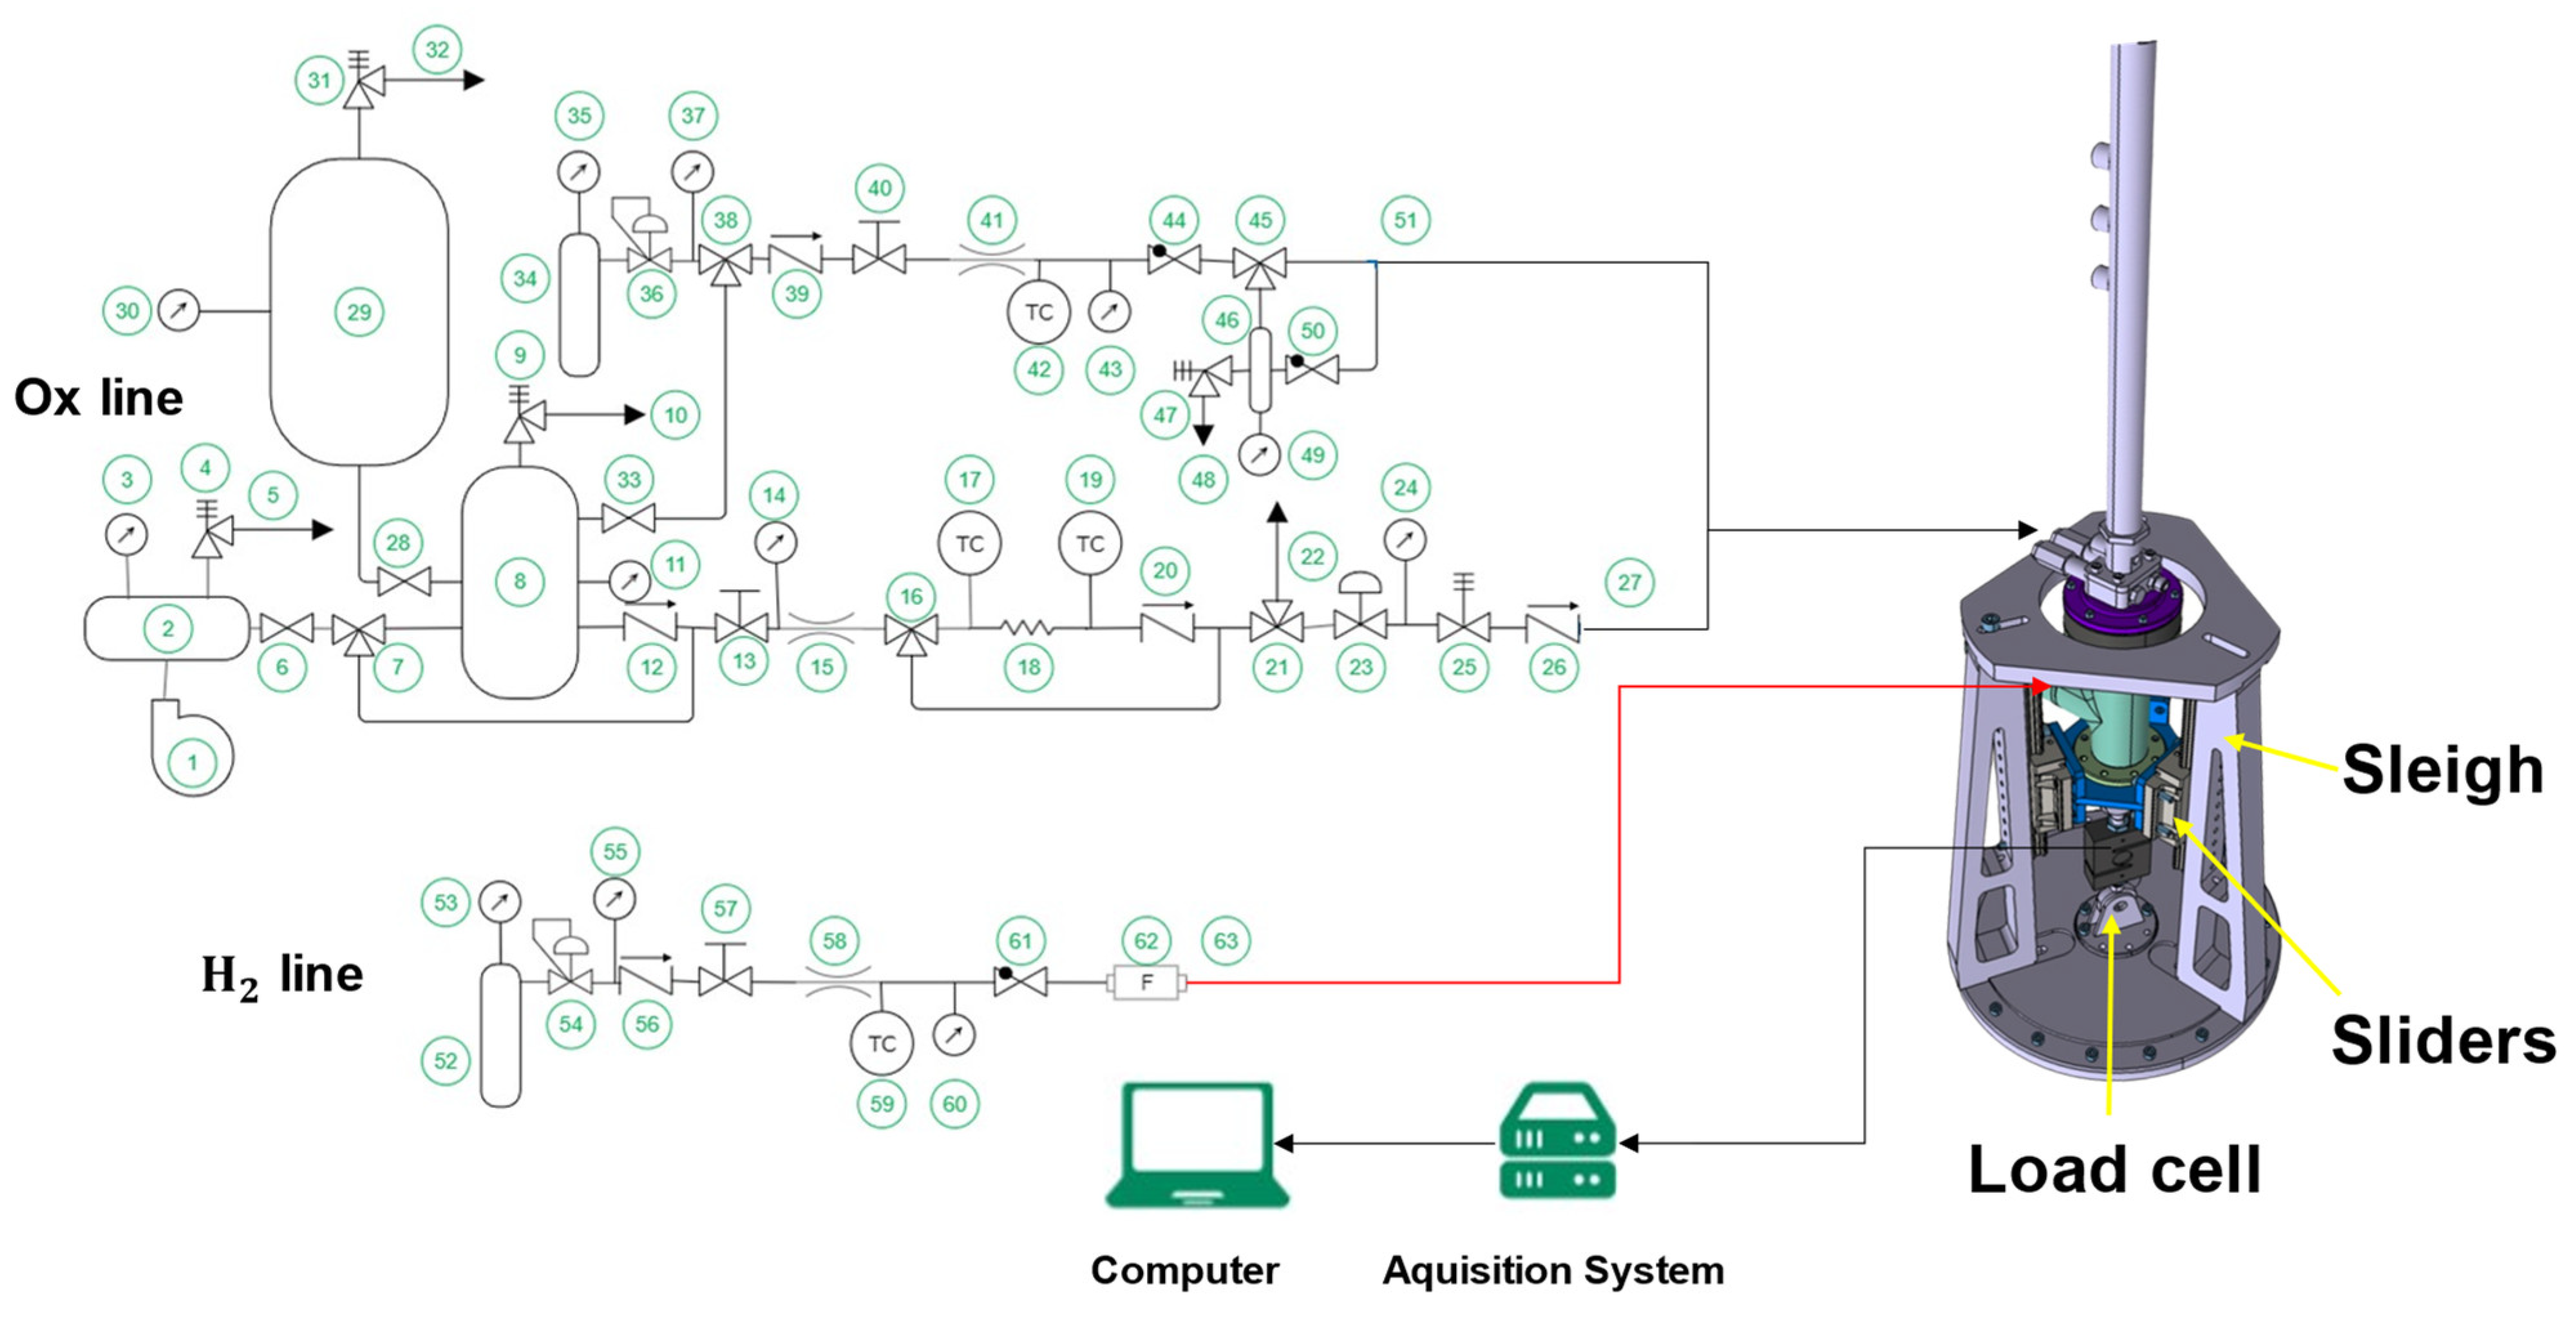
2.2. Experimental Setup

The schematic of the PDC experimental facility is presented in Figure 2. The main features are the high-pressure fuel (hydrogen) and oxidizer (air or oxygen) supply lines, a command-and-control panel, and the data acquisition system. The main air supply line can provide a maximum pressure of 11 bar, at a maximum temperature of 750 K (via an electric heater placed on the line) and a maximum mass flow rate of up to 1 kg/s. The oxygen supply line can provide a maximum pressure of 20 bar at ambient temperature and a maximum mass flow rate of 0.2 kg/s. The hydrogen supply line can provide a maximum pressure of 20 bar at ambient temperature and a maximum mass flow rate of 0.05 kg/s. The rig employs a variable frequency spark plug for ignition. ALICAT MQ-250SLPM-D (from ALICAT Scientific Inc., Tucson, AZ, USA) for hydrogen (position 58) and ALICAT MQ-2000SLPM-D (from ALICAT Scientific Inc., Tucson, AZ, USA) for oxidant (position 41) flowmeters are incorporated into the hydrogen and air/oxygen supply lines to record the operating conditions in terms of pressure, flow rate and temperature, hence the equivalence ratio can be determined. As a safety measure, hydrogen sensors are continuously monitored within the test setup. One-way valves and flame arrestors are also mounted on the gas lines for safety purposes. The rest of the positions in Figure 2 are described extensively in [27].
For thrust measurements, a STA-3-100 LCM Systems load cell sensor (from LCM Systems, Newport, UK) with 20 gF accuracy is employed. The PDC breadboard is allowed to slide freely on a sleigh with respect to the test bed, by means of three lubricated ball sliders placed vertically. The load sensor is placed vertically, underneath the experimental model, and connects with its moving end to the experimental model, with its fixed end to the test rig. The load sensor is axially aligned with the experimental model longitudinal axis to minimize thrust measurement errors (see Figure 2).
Load sensor calibration was performed prior to the experimental campaign using 10 identical 5 lbs flanges. To account for the sensor hysteresis and measurement replication, two loading and two unloading paths were used for calibration. The transfer function from mA to N is the result of a linear regression with R2 = 0.99. To ensure data accuracy, multiple calibrations were performed each time the exhaust pipe was changed to account for the change in preload introduced by the supply lines. The measured thrust values are time-averaged, as this is the actual propulsion force the thruster is able to provide, and this should be the basis for determining the specific impulse it yields. The time-averaged thrust of the PDC was determined through the dynamic force by time averaging. The data acquisition system includes a Strain Gauge Amplifier - SGA (from Micron Meters, Georgia, GA, USA) [28] connected to an acquisition board and the experimental facility computer.

2.3. Test Conditions

For the current research, a comprehensive experimental campaign was conducted, employing a full factorial design with four factors, each having four different levels. The primary objective of this campaign was to evaluate the impact of these factors on thrust levels and specific impulse. The selected factors for this study encompass the hydrogen supply pressure, oxygen supply pressure, spark plug operating frequency, and the length of the exhaust pipe. The first two factors represent the sensitivity of the mixture, the third one is to determine whether the aerodynamic system is synchronized with the ignition frequency and the last factor is to understand the impact of the geometry. The discrete levels for each of these factors (detailed in Table 1) were defined based on previous experimental investigations. The individual tests are denoted with 4-digit codes, according to Table 1 in the first row and first column. For example, test ID 0032 sets the exhaust pipe length to 200 mm, the spark plug frequency to 100 Hz, the hydrogen supply pressure to 8.5 bara and the oxidant supply pressure to 4.5 bara.
Two experimental campaigns were conducted, one with air as the oxidizer and the other with pure oxygen. Due to the extensive testing envelope, not all test cases achieved sustained pulsed detonation cycles. The following section presents only the results from the successful cases.
The time-averaged values reported herein are computed over at least 500 detonation cycles from ignition. According to our previous work [18], it has been computed that the change in the average value drops below 0.01% when increasing the number of cycles considered for the averaging above 30. Therefore, the relative change in the averaged values is not expected to impact the reported data.

2.4. Data Processing

As mentioned above, each supply line is equipped with flow meters that can measure volumetric flow rates, as well as pressure and temperature. The actual fuel pressure and temperature are measured with the sensors integrated into the mass flow meter. Importantly, the recorded fuel pressure, temperature and fuel volumetric rate for each test are synchronized to enhance data precision. The volumetric flow rate provided via the flow meter is converted to mass flow rate
M ˙ o x = ρ o x v o x
where ρ o x is the oxidizer density and v o x is the oxidizer volumetric flow rate. The oxidizer density is determined using the pressure ( p o x ) and temperature ( T o x ) measured using sensors incorporated in the mass flow meter, according to the following equation
ρ o x = p o x R o x T o x
where R o x is the gas specific constant. The same approach is extended to the fuel component, mirroring the procedure followed for the oxidizer. Once both the fuel and oxidizer mass flow rates are determined, the equivalence ratio ϕ is calculated based on the following:
ϕ = M ˙ f l / M ˙ o x ( M ˙ f l / M ˙ o x ) s t
The total specific impulse
I s p = T g ( M ˙ f l + M ˙ o x )
The fuel specific impulse
I s p = T g M ˙ f l
The total specific impulse, as defined above, is the typical figure of merit used for launchers or in-space propulsion systems where both the fuel and oxidizer are stored onboard, thus entering directly into the mass budget of the propulsion system. The fuel specific impulse is reported in the current paper too to be compared with the current airbreathing technology. Moreover, the fuel specific impulse, as defined above, is employed to directly characterize the performance of the combustor from the point of view of mixing and energy harvesting from the available chemical energy.

3. Results and Discussions

Time-averaged thrust measurements (measured parameter) and specific impulse values are presented in this paper. For each parameter, its variation with the ER is presented. The data are organized into sets of curves corresponding to constant exhaust pipe lengths, with each sub-figure representing a specific value of the oxidizer pressure. Each of the four figures for one parameter includes data collected from a single spark plug frequencies.

3.1. Hydrogen/Air Mixture

This subsection presents the results from the hydrogen/air experimental campaign, in which air is used as an oxidizer.

3.1.1. Time-Average Thrust

The time-averaged thrust variation with the ER, for different oxidizer pressures and exhaust pipe lengths, is presented in Figure 3, Figure 4, Figure 5 and Figure 6. For oxidizer pressures above 6 bar, no stable detonation regimes were found. This is due to the aerodynamic system configuration. If the oxidizer pressure is too high, fuel injection cannot sufficiently penetrate the vortex barrier formed using the parallel oxidizer injection and the alternating oscillating waves from the resonators. Hence, improper mixing for detonation results.
For ignition frequencies of 100 Hz, 150 Hz and 350 Hz, the highest thrust levels (28.71 N, 27.58 N and 27.22 N) are recorded for an exhaust pipe length of 400 mm. For the ignition frequency of 233 Hz, it seems the aerodynamic system is decoupled from the spark plug operating frequency across the entire operational envelope. Acoustic effects inside the combustor also influence thrust values as they impact detonation stability. Furthermore, the role of the oxidizer pressure and exhaust pipe lengths play different roles, which depend on the mixing quality of the supply gases.
For low oxidizer pressures and short pipes (exhaust pipe length of 200 mm and 300 mm), the higher thrust values are obtained for high spark plug frequencies, 233 Hz (Figure 5) and 350 Hz (Figure 6). Conversely, for long exhaust pipes (400 mm and 500 mm), the higher thrust values are recorded for low spark plug frequencies, 100 Hz (Figure 3) and 150 Hz (Figure 4).
For high oxidizer pressures, where less stable detonation regimes were achieved, the spark plug influence on the performance is less clear, and the low frequencies prevail only for the exhaust pipe length of 400 mm.

3.1.2. Time-Averaged Total Specific Impulse

The time-averaged total specific impulse is reported in Figure 7, Figure 8, Figure 9 and Figure 10 for all the cases that achieved stable detonation. As the specific impulse is defined based on thrust, the same operating regimes (i.e., above 6 bar oxidizer pressure) are plotted.
For ignition frequencies of 100 Hz (Figure 7) and 150 Hz (Figure 8), the highest total specific impulse levels (in the range 1000–1600 s) are recorded for an exhaust pipe length of 400 mm. For 233 Hz (Figure 9) and 350 Hz (Figure 10) ignition frequency, the 200 mm configuration yields the maximum total specific impulse around 0.6 ER with 4.5 bar oxidizer pressure. However, sharp gradients in the vicinity of the maximum lead to low total specific impulse, almost half of the maximum. For 233 Hz (Figure 9) and 350 Hz (Figure 10) spark plug frequency, the 400 mm configuration results in a smoother total specific impulse trend with ER in the range 800–1200 s.
For high oxidizer pressures (i.e., 6 bar), where less stable detonation regimes were achieved, the 400 mm configuration shows an increase in the total specific impulse with ER, for all spark-plug frequencies, except 233 Hz. Additionally, for 100 Hz (Figure 7) and 150 Hz (Figure 8), the 400 mm configuration yields a higher total specific impulse compared to the other configurations that perform below 600 s in terms of specific impulse.

3.1.3. Time-Averaged Fuel Specific Impulse

The time-averaged fuel specific impulse is reported in Figure 11, Figure 12, Figure 13 and Figure 14 for all the cases that achieved stable detonation. Overall, the fuel specific impulse figures are higher as a direct consequence of the different definitions employed.
For low oxidizer pressure (i.e., 4.5 bar), the 400 mm configuration dominates the high ER region for 100 Hz (Figure 11) and 150 Hz (Figure 12) operation, whereas the same configuration dominates the low ER region for 233 Hz (Figure 13) and 350 Hz (Figure 14) operation.
For high oxidizer pressure (i.e., 6 bar), the same 400 mm configuration performs the best in terms of the fuel specific impulse for all the operating frequencies, except 233 Hz, where the 500 mm configuration reaches higher values.

3.2. Hydrogen/Oxygen Mixture

This subsection presents the results from the hydrogen/oxygen experimental campaign, in which oxygen is used as an oxidizer.

3.2.1. Time-Averaged Thrust

The time-averaged thrust variation with the ER, for different oxygen pressures, exhaust pipe lengths and spark plug frequencies, is presented in Figure 15, Figure 16 and Figure 17. For oxidizer pressures of 4.5 bar and 9 bar, few stable detonation regimes were found. Overall, the time-averaged thrust levels for hydrogen/oxygen operation are lower compared to the ones for hydrogen/air.
From an energetic point of view, this is explained by the low ER values where stable detonation was achieved. The stable regimes for hydrogen/oxygen mixture operation are shifted to low ER values compared to hydrogen/air operation. The tests yielding sustained pulsed detonation were recorded only for ERs ranging between 0.05 and 0.25. The engine design is defined as such that both oxidizers’ operations could be achieved; however, air operations were targeted in the beginning for detonation achievement, as hydrogen/air is safer than hydrogen/oxygen.
The oxidizer switch, although keeping the same combustor configuration and high frequency DDT achievement, comes at the price of a non-optimal injection for oxygen. Hence, mixing is the main influence for downgraded performances for oxygen operation, as the number of misfires is higher. However, for this experimental campaign, there is a shift in the operation map to higher oxidant pressure values. Detonation achievement is possible for 9 bar oxidant pressure, due to the mixture having an increased proneness to detonation. Hence, there is a trade-off between optimal fuel injection and oxidizer high-frequency oscillations in the aerodynamic system (detonation achievement at high oxidizer pressures).
The theoretical trend of increasing thrust with increasing equivalence ratio, which is to be expected, is slightly visible for the hydrogen/oxygen campaign and in most cases, it is not monotonic over the entire range of ERs. This is a direct result of the higher number of misfires across the hydrogen/oxygen operational map, which impact the time-average values. For all the frequencies, the increase in oxidizer supply pressure from 6 bar to 7.5 bar results in a slight increase in thrust level for some operating points. The additional possible influence of the pipe length is little to almost none. Moreover, the 9 bar oxidizer pressure introduces penalties in thrust, as the vortex system inside the mixer operates off-design, thus leading to poor mixing.
For the 100 Hz (Figure 15) spark plug frequency operation, the 6 bar oxidizer supply pressure with a 300 mm configuration leads to a plateau in thrust close to 0.1 ER of about 6N and reduced gradients on the sides. The maximum thrust of 10N is reached for the 7.5 oxidizer supply pressure for the minimum length configuration of 200 mm at 150 Hz (Figure 16) spark plug frequency. This performance is achieved through 350 Hz operation as well (Figure 17) for 200 mm at 9 bar oxidizer supply pressure and for 400 mm at 7.5 bar oxidizer supply pressure.

3.2.2. Time-Averaged Total Specific Impulse

The time-averaged total specific impulse is reported in Figure 18, Figure 19 and Figure 20 for all the cases that achieved stable detonation. Overall, the figures for oxygen operation are almost two orders of magnitude lower than the previous results for air operation. This is a direct consequence of low thrust levels due to the off-design operation of the fuel injection plate when using oxygen as oxidizer (coupled with the mixing phenomena) and high oxidizer flow rates necessary to still achieve detonation (compared with the oxidizer flow rates for air operation).
The high levels of specific impulse above 60 s are reached for the 400 mm configuration with 150 Hz spark plug operation and 6 bar oxidizer supply pressure (Figure 19a). Keeping the same 6 bar oxidizer supply pressure, the 350 Hz spark plug operation (Figure 20) yields increased the total specific impulse for the 400 mm and 500 mm configurations compared to 100 Hz and 233 Hz.

3.2.3. Time-Averaged Fuel Specific Impulse

The time-averaged fuel specific impulse is reported in Figure 21, Figure 22 and Figure 23 for all the cases that achieved stable detonation. Overall, the order of magnitude for the oxygen operation fuel specific impulse results is the same as the one for air operation, unlike the total specific impulse, which is to be expected. The fuel mass flow rates for stable detonative regimes for both air and oxygen operation are comparable, thus the fuel specific impulse figures are much closer when switching the oxidizer, compared to the previous total specific impulse.
For all frequencies, at 6 bar oxidizer pressure, there is an overall decreasing trend of fuel specific impulse with ER, with some minor exceptions where some local increases arise. The largest fuel specific impulse for 6 bar oxidizer pressure is around 7000 s for 500 mm at 233 Hz (Figure 22) and 350 Hz (Figure 23) spark plug operation.

4. Conclusions

The present study describes that thrust, total specific impulse and fuel specific impulse resulted from the experimental campaign of our hydrogen-fueled PDC with different oxidizers and with the same design of the combustor. The choice of freezing the design was to establish the operational map of our combustor, which targets both ground-based or space-based application.
Higher time-averaged thrust levels and time-averaged specific impulse values are achieved for the hydrogen/air mixture compared to hydrogen/oxygen operation. This is due to the initial design of the PDC, which targeted air as an oxidizer. For mixture transition, minimum alteration was considered (fuel injection adapted) to establish a baseline configuration which is capable of achieving high-frequency detonation regimes.
The operating frequency of the thruster is primarily influenced by the spark plug, and it is frequently lower than expected due to misfires during the initiation of the detonation cycle. As anticipated, the design frequency of 100 Hz results in rare misfire events. This is an effect of the way the geometry of the PDC has been designed, namely the correlation between the length of the Helmholz resonators, the premixing and the detonation chamber volume and length, and the length of the exhaust pipe.
To approach the performance of a classical gas turbine engine, the PDC operating frequency must be of at least 75 Hz for a near-stoichiometric fuel/air mixture [29]. Further increasing the frequency allows for a reduction in the combustor size, reducing the weight and drag of the engine, and the PDC tested here made use of aerodynamic valves to increase the operating frequency over the above-mentioned performance threshold. The current state-of-the art maximum frequency is around 300 Hz [30,31], even though significantly higher PDC operating frequencies have been reported more recently [32,33] (350 Hz [32], and even 800 Hz [33], measured for hydrogen/oxygen mixtures).
The design frequency was selected at a conservative 100 Hz for two reasons: to allow the PDC to operate on both air and oxygen with no geometrical changes, and to evaluate the response of the PDC when driven via higher frequency spark plugs.
When operating at non-design frequencies, data indicates that using air as an oxidizer allows the PDC system to sometimes replicate a spark plug frequency of 150 Hz. However, in all other scenarios, frequencies higher than the design frequency, driven using the spark plug, are occasionally achieved, but never fully match the spark plug frequency due to misfires.
Hydrogen/oxygen performances presented in this paper have lower values, especially for thrust and total specific impulse levels. For this mixture, thrust values are directly impacted by the number of misfires.
For hydrogen/air, time-averaged thrust values tend to increase with the ER and oxidizer pressure. The optimal operation of the PDC is for a 400 mm exhaust pipe length, which gives the highest thrust levels across the considered values of the oxidizer pressure, except for the 233 Hz spark plug frequency. The same conclusion can be drawn for the total specific impulse and the fuel specific impulse. The optimum values are also obtained for the 400 mm exhaust pipe, with the same exception. This is due to the decoupling between the aerodynamic system and the ignition frequency.
For the hydrogen/oxygen mixture, the optimum values in terms of time-averaged thrust are achieved for a 200 mm exhaust pipe length. This is attributed to the higher energy release of the mixture than for air, which is affected by the heat-transfer with the exhaust pipe walls. Hence, the detonation intensity is less dissipated for shorter exhaust pipe values and thus higher values of thrust are achieved.
For both oxidizers, the performance is better through increasing the ER. The interaction between oxidizer pressure, spark-plug frequency and exhaust pipe length are different. For air, low oxidizer pressures and small exhaust pipe lengths show higher performance values at higher frequencies, while high oxidizer pressures and exhaust pipe lengths give better performances at low frequencies. For oxygen, the general trend in thrust production shows higher levels at low oxidizer pressures with smaller exhaust pipes and at lower ignition frequencies. The total specific impulse shows better values at higher oxidizer pressures and with longer exhaust pipes. Meanwhile, the highest fuel specific impulse is achieved consistently across the entire operational range with a 500 mm exhaust pipe.
Future work on our PDC will involve an in-depth analysis of the operational map at key points to refine the design space, targeting optimal performance metrics such as thrust, the number of misfires, and pressure gain. Vacuum tests are also planned to further increase the technology readiness level (TRL) beyond its current level of 4. The ongoing research aims to address scalability issues, cooling methods and sub-systems integration, enabling the PDC technology to mature sufficiently for real-world applications.
The scalability of the pulse detonation, and in general, detonation-based propulsion technology, is an issue that will require careful consideration. In principle, scaling up the herein discussed PDC should be possible, since no fundamental limitations are expected. However, advances towards practical applications of the technology require significant investments in the development of experimental test rigs capable of safely accommodating the test articles, as well as of appropriate instrumentation suited for the harsh and highly transient conditions specific to detonation. The main steps envisioned in this direction in the European Space Agency perspective have been discussed in a recent workshop and summarized in [34].

Author Contributions

Software, M.G., I.P. and A.V.C.; Writing—original draft preparation, A.V.C.; conceptualization, A.V.C., I.P. and T.C.; methodology, I.P, A.V.C. and T.C.; validation, A.V.C. and M.G.; investigation, A.V.C., M.G. and I.P.; data curation, T.C. and M.G.; visualization, I.P.; supervision, A.V.C., I.P. and T.C.; project administration, I.P.; funding acquisition, I.P. and A.V.C. All authors have read and agreed to the published version of the manuscript.

Funding

This work has been founded by the European Space Agency through the contract no. 4000131302/20/NL/MG—“Pulsed Detonation Thruster” (PDT). The experimental work has been carried out in the Testing and Experimentation Centre for Space and Security (TESS) of the Romania National Research and Development Institute for Gas Turbines—COMOTI.

Data Availability Statement

The original contributions presented in the study are included in the article, further inquiries can be directed to the corresponding author.

Acknowledgments

The authors wish to extend their thanks for valuable guidance and support to Guillermo Paniagua, of Purdue University and to Bayindir Saracoglu, of the “Von Karman” Institute for Fluid Dynamics.

Conflicts of Interest

The authors declare no conflicts of interest.

References

  1. The European Green Deal. 2019. Available online: https://commission.europa.eu/strategy-and-policy/priorities-2019-2024/european-green-deal_en (accessed on 7 May 2024).
  2. EU Negotiators Secure Agreement at COP28 to Accelerate the Global Transition Away from Fossil Fuels and Triple Renewables and Double Energy Efficiency this Decade. 13 December 2023. Available online: https://ec.europa.eu/commission/presscorner/detail/en/IP_23_6591 (accessed on 16 December 2023).
  3. Koff, B.L. Gas Turbine Technology Evolution: A Designer’s Perspective. J. Propuls. Power 2004, 20, 577–595. [Google Scholar] [CrossRef]
  4. Gulen, S.C. Pressure gain combustion advantage in land-based electric power generation. J. Glob. Power Propuls. Soc. 2017, 1, 288–302. [Google Scholar] [CrossRef]
  5. Cuciumita, C.F.; Cuciuc, T.; Porumbel, I. Evaluation of the Cycle Averaged Performances of a Pulsed Detonation Engine Based on Thermodynamic Cycle Computations. GT 2016-57310. In Proceedings of the ASME TURBO EXPO 2016: Turbomachinery Technical Conference and Exposition, GT2016, Seoul, Republic of Korea, 13–17 June 2016. [Google Scholar]
  6. Eidelman, S.; Grossmann, W.; Lottati, I. Review of Propulsion Applications and Numerical Simulations of the Pulsed Detonation Engine Concept. J. Propuls. Power 1991, 7, 857–865. [Google Scholar] [CrossRef]
  7. Helman, D.; Shreeve, R.; Eidelman, S. Detonation pulse engine. In Proceedings of the 22nd Joint Propulsion Conference, Huntsville, AL, USA, 13–15 May 1986. [Google Scholar]
  8. Kailasanath, K. Review of Propulsion Applications of Detonation Waves. AIAA J. 2000, 38, 1698–1708. [Google Scholar] [CrossRef]
  9. Wolanski, P. Detonative propulsion. Proc. Combust. Inst. 2013, 34, 125–158. [Google Scholar] [CrossRef]
  10. Buyakofu, V.; Matsuoka, K.; Matsuyama, K.; Kawasaki, A.; Watanabe, H.; Matsuo, A.; Funaki, I.; Nakata, D.; Uchiumi, M.; Habu, H.; et al. Flight Demonstration of Pulse Detonation Engine Using Sounding Rocket S-520-31 in Space. J. Spacecr. Rocket. 2023, 60, 181–189. [Google Scholar] [CrossRef]
  11. Roy, G.; Frolov, S.; Borisov, A.; Netzer, D. Pulse detonation propulsion: Challenges, current status and future perspective. Prog. Energy Combust. Sci. 2004, 30, 545–672. [Google Scholar] [CrossRef]
  12. Carter, J.D.; Lu, F.K. Experiences in Testing of a Large-Scale, Liquid-Fueled, Air-Breathing, Pulse Detonation Engine. In Proceedings of the 47th AIAA/ASME/SAE/ASEE Joint Propulsion Conference & Exhibit, San Diego, CA, USA, 31 July–3 August 2011. [Google Scholar]
  13. Wang, K.; Fan, W.; Lu, W.; Chen, F.; Zhang, Q.; Yan, C. Study on a liquid-fueled and valveless pulse detonation rocket engine without the purge process. Energy 2014, 71, 605–614. [Google Scholar] [CrossRef]
  14. Li, J.-L.; Fan, W.; Chen, W.; Wang, K.; Yan, C.-J. Propulsive performance of a liquid kerosene/oxygen pulse detonation rocket engine. Exp. Therm. Fluid Sci. 2011, 35, 265–271. [Google Scholar] [CrossRef]
  15. Baklanove, D.; Gvozdeva, L.; Scherbak, N. Pulsed detonation combustion chamber for PDE. In High-Speed Deflagration and Detonation: Fundamentals and Control; ELEX-KM Publishers: Moscow, Russia, 2001; pp. 239–250. [Google Scholar]
  16. Frolov, S.M.; Smetanyuk, V.A.; Aksenov, V.S.; Koval’, A.S. Deflagration-to-Detonation Transition in Crossed-Flow Fast Jets of Propellant Components. Dokl. Phys. Chem. 2017, 476, 153–156. [Google Scholar] [CrossRef]
  17. Matsuoka, K.; Taki, H.; Kawasaki, A.; Kasahara, J.; Watanabe, H.; Matsuo, A.; Endo, T. Semi-valveless pulse detonation cycle at a kilohertz-scale operating frequency. Combust. Flame 2019, 205, 434–440. [Google Scholar] [CrossRef]
  18. Cojocea, A.V.; Cuciuc, T.; Porumbel, I.; Gall, M.; Gherman, B.; Crunțeanu, D.E. Experimental investigations of hydrogen fuelled pulsed detonation combustor. In Proceedings of the ASME Turbo Expo 2022 Turbomachinery Technical Conference and Exposition GT2022, Rotterdam, The Netherlands, 13–17 June 2022. [Google Scholar]
  19. Shepherd, J.; Database, D. 2002. Available online: https://shepherd.caltech.edu/detn_db/html/db.html (accessed on 12 May 2024).
  20. Peraldi, O.; Knystautas, R.; Lee, J.H. Criteria for transition to detonation in tubes. In Symposium (International) on Combustion; Elsevier: Amsterdam, The Netherlands, 1988; Volume 21, pp. 1629–1637. [Google Scholar]
  21. Kasahara, J.; Hirano, M.; Matsuo, A.; Daimon, Y.; Endo, T. Thrust Measurement of a Multicycle Partially Filled Pulse Detonation Rocket Engine. J. Propuls. Power 2009, 25, 1281–1290. [Google Scholar] [CrossRef]
  22. Matsuoka, K.; Takagi, S.; Kasahara, J.; Matsuo, A.; Funaki, I. Validation of Pulse Detonation Operation in Low-Ambient-Pressure Environment. J. Propuls. Power 2018, 34, 116–124. [Google Scholar] [CrossRef]
  23. Buyakofu, V.; Matsuoka, K.; Matsuyama, K.; Kawasaki, A.; Watanabe, H.; Itouyama, N.; Goto, K.; Ishihara, K.; Noda, T.; Kasahara, J.; et al. Development of an S-Shaped Pulse Detonation Engine for a Sounding Rocket. J. Spacecr. Rocket. 2022, 59, 850–860. [Google Scholar] [CrossRef]
  24. Wang, Y.-Q.; Fan, W.; Yan, C.-J.; Qin, H.-Q.; Xie, K.-C.; Wang, W. Performance Measurements of a Kerosene-Oxygen Pulse Detonation Rocket Engine at the Frequencies of 35–40Hz. In Proceedings of the 45th AIAA/ASME/SAE/ASEE Joint Propulsion Conference & Exhibit, Denver, CO, USA, 3 August 2009. [Google Scholar]
  25. Wang, K.; Fan, W.; Lu, W.; Zhang, Q.; Chen, F.; Yan, C.; Xia, Q. Propulsive performance of a pulse detonation rocket engine without the purge process. Energy 2015, 79, 228–234. [Google Scholar] [CrossRef]
  26. Zhang, B. Enhancing detonation propulsion with jet in cross-flow: A comprehensive review. Prog. Aerosp. Sci. 2024, 101020. [Google Scholar] [CrossRef]
  27. Bogoi, A.; Cuciuc, T.; Cojocea, A.V.; Gall, M.; Porumbel, I.; Hrițcu, C.E. Experimental Pressure Gain Analysis of Pulsed Detonation Engine. Aerospace 2024, 11, 465. [Google Scholar] [CrossRef]
  28. SGA|Strain Gauge Amplifier. Available online: https://www.micronmeters.com/product/sga-strain-gauge-amplifier (accessed on 15 May 2024).
  29. Pegg, R.J.; Couch, B.D.; Hunter, L.G. Pulse detonation engine air induction system analysis. In Proceedings of the AIAA Paper 96-2918, AIAA Meeting Papers on Disc, Lake Buena Vista, FL, USA, 1–3 July 1996. [Google Scholar]
  30. Cutler, A.D. Parametric Study of High Frequency Pulse Detonation Tubes. In Proceedings of the AIAA Paper 2008-4691, Hartford, CT, USA, 21–23 July 2008. [Google Scholar]
  31. Wang, K.; Fan, W. Efforts on High Frequency PDE. J. Propuls. Power 2017, 33, 17–28. [Google Scholar] [CrossRef]
  32. Matsuoka, K.; Muto, K.; Kasahara, J.T. Development of High-Frequency Pulse Detonation Combustor Without Purging Material. J. Propuls. Power 2017, 33, 43–50. [Google Scholar] [CrossRef]
  33. Schwinn, K.; Gejji, R.; Kan, B.; Sardeshmukh, S.; Heister, S.; Slabaugh, C.D. Self-sustained, high-frequency detonation wave generation in a semi-bounded channel. Combust. Flame 2018, 193, 384–396. [Google Scholar] [CrossRef]
  34. Di Cara, D.M.; Schneider, D.; Searle, T.; Villace, V.F.; Cohen, O. (Eds.) Innovative Propulsion Cross-Cutting Initiative. In Proceedings of the ESA-TECMP-WP-2023-001844, Amsterdam, The Netherlands, 28–30 June 2023; pp. 41–48. [Google Scholar]
Figure 2. Schematic of the experimental set-up [25].
Applsci 14 05999 g002
Figure 3. Time-averaged thrust for a frequency of 100 Hz for H 2 /air.
Applsci 14 05999 g003
Figure 4. Time-averaged thrust for a frequency of 150 Hz for H 2 /air.
Applsci 14 05999 g004
Figure 5. Time-averaged thrust for a frequency of 233 Hz for H 2 /air.
Applsci 14 05999 g005
Figure 6. Time-averaged thrust for a frequency of 350 Hz for H 2 /air.
Applsci 14 05999 g006
Figure 7. Time-averaged total specific impulse for a frequency of 100 Hz for H 2 /air.
Applsci 14 05999 g007
Figure 8. Time-averaged total specific impulse for a frequency of 150 Hz for H 2 /air.
Applsci 14 05999 g008
Figure 9. Time-averaged total specific impulse for a frequency of 233 Hz for H 2 /air.
Applsci 14 05999 g009
Figure 10. Time-averaged total specific impulse for a frequency of 350 Hz for H 2 /air.
Applsci 14 05999 g010
Figure 11. Time-averaged fuel specific impulse for a frequency of 100 Hz for H 2 /air.
Applsci 14 05999 g011
Figure 12. Time-averaged fuel specific impulse for a frequency of 150 Hz for H 2 /air.
Applsci 14 05999 g012
Figure 13. Time-averaged fuel specific impulse for a frequency of 233 Hz for H 2 /air.
Applsci 14 05999 g013
Figure 14. Time-averaged fuel specific impulse for a frequency of 350 Hz for H 2 /air.
Applsci 14 05999 g014
Figure 15. Time-averaged thrust for a frequency of 100 Hz for H 2 / O 2 .
Applsci 14 05999 g015
Figure 16. Time-averaged thrust for a frequency of 150 Hz (ac) and 233 Hz (df) for H 2 / O 2 .
Applsci 14 05999 g016
Figure 17. Time-averaged thrust for a frequency of 350 Hz for H 2 / O 2 .
Applsci 14 05999 g017
Figure 18. Time-averaged total specific impulse for a frequency of 100 Hz for H 2 / O 2 .
Applsci 14 05999 g018
Figure 19. Time-averaged total specific impulse for a frequency of 150 Hz (ac) and 233 Hz (df) for H 2 / O 2 .
Applsci 14 05999 g019aApplsci 14 05999 g019b
Figure 20. Time-averaged total specific impulse for a frequency of 350 Hz for H 2 / O 2 .
Applsci 14 05999 g020
Figure 21. Time-averaged specific impulse for a frequency of 100 Hz for H 2 / O 2 .
Applsci 14 05999 g021
Figure 22. Time-averaged specific impulse for a frequency of 150 Hz (ac) and 233 Hz (df) for H 2 / O 2 .
Applsci 14 05999 g022aApplsci 14 05999 g022b
Figure 23. Time-averaged specific impulse for a frequency of 350 Hz for H 2 / O 2 .
Applsci 14 05999 g023
Table 1. Factors and levels—full factorial hydrogen/air experimental campaign.
FactorLevel 1Level 2Level 3Level 4
1Exhaust pipe length200 mm300 mm400 mm500 mm
2Spark plug frequency100 Hz150 Hz233 Hz350 Hz
3Hydrogen supply pressure5.5 bara7 bara8.5 bara10 bara
4Oxidant supply pressure9 bara7.5 bara6 bara4.5 bara
0123
Disclaimer/Publisher’s Note: The statements, opinions and data contained in all publications are solely those of the individual author(s) and contributor(s) and not of MDPI and/or the editor(s). MDPI and/or the editor(s) disclaim responsibility for any injury to people or property resulting from any ideas, methods, instructions or products referred to in the content.

