


Modernization Data Analysis and Visualization for Food Safety Research Outcomes

 , , ,
, , ,
Abstract
1. Introduction
2. Types of Data
2.1. Quantitative Data
2.1.1. Normal Distribution
2.1.2. Lognormal Distribution
2.1.3. Binomial Distribution
2.2. Qualitative Data
3. Descriptive Statistics
3.1. Range
3.2. Median
3.3. Interquartile Range
3.4. Arithmetic Mean and Geometric Mean
3.5. Variance and Standard Deviation
3.6. Standard Error of the Mean and Confidence Intervals
3.7. Issues in Microbiological Counts
3.7.1. Negative Counts
3.7.2. Zeros, Limits of Detection, and Limits of Quantification
- (1)
- The simplest way to deal with values < LOQ is by ignoring non-quantifiable observations or setting log10 to zero (0 Log). Both alternatives will bias the mean because setting observations below LOQ will decrease the mean, and if ignored, the mean will increase.
- (2)
- As mentioned before, if the microbial counts are log10-transformed, the presence of zero counts in a data set can cause an issue, as the log10 of zero will give a non-determined number. One of the options to deal with this issue is by transforming microbial counts with a log10 of the observation plus one [32]. This transformation will change all zero counts to 1, and the log10 transformation can be applied without any problem. Moreover, this correction is usually insignificant in terms of microbial counts; however, it should be considered when back-transforming the data and interpreting a biased mean.
- (3)
- Another simplistic approach consists of setting all values < LOQ to one half the limit of quantification [41]. Then the log10 transformation is applied, and estimates will be obtained. An implicit assumption for this method is that a distribution below the limit of quantification follows a uniform distribution. If the data collected follow a lognormal distribution, then this method would give acceptable estimates; however, if the lognormal assumption is nearly correct some limitations may be encountered [42].
- (4)
- (5)
- The last and most accurate method to deal with values below the LOQ takes advantage of the normal distribution to extrapolate it back from the LOQ to estimate maximum likelihood estimates of the mean and standard deviation [12,17,42]. While this method is very accurate, it is laborious and understanding of it is somewhat limited among researchers.
4. Type of Food Safety Experiments
4.1. Methodology Comparison
4.1.1. Data Visualization and Data Analysis
- (1)
- Means Comparison: when comparing two methods for enumeration of microorganisms, it is intuitive to determine whether the microbial means of both methods are equal [50,52,55]. The basic idea is quite simple: if the difference between the sample means is far enough from zero, there will be enough evidence that both methods are different. As a result, a Student’s t-test for paired samples or the non-parametric alternative Wilcoxon’s test for paired samples are the best alternatives (Figure 1A,B,D). A significant p-value will show enough evidence that both methods are different when enumerating a certain microorganism on a specific matrix. When more than two methods are to be compared, an ANOVA test followed by a pairwise comparison t-test or the non-parametric alternative Kruskal–Wallis test followed by a pairwise Wilcoxon’s test can be used for these purposes (Figure 1C). The multiple comparison test will be only performed if the null hypothesis is originally rejected.
- (2)
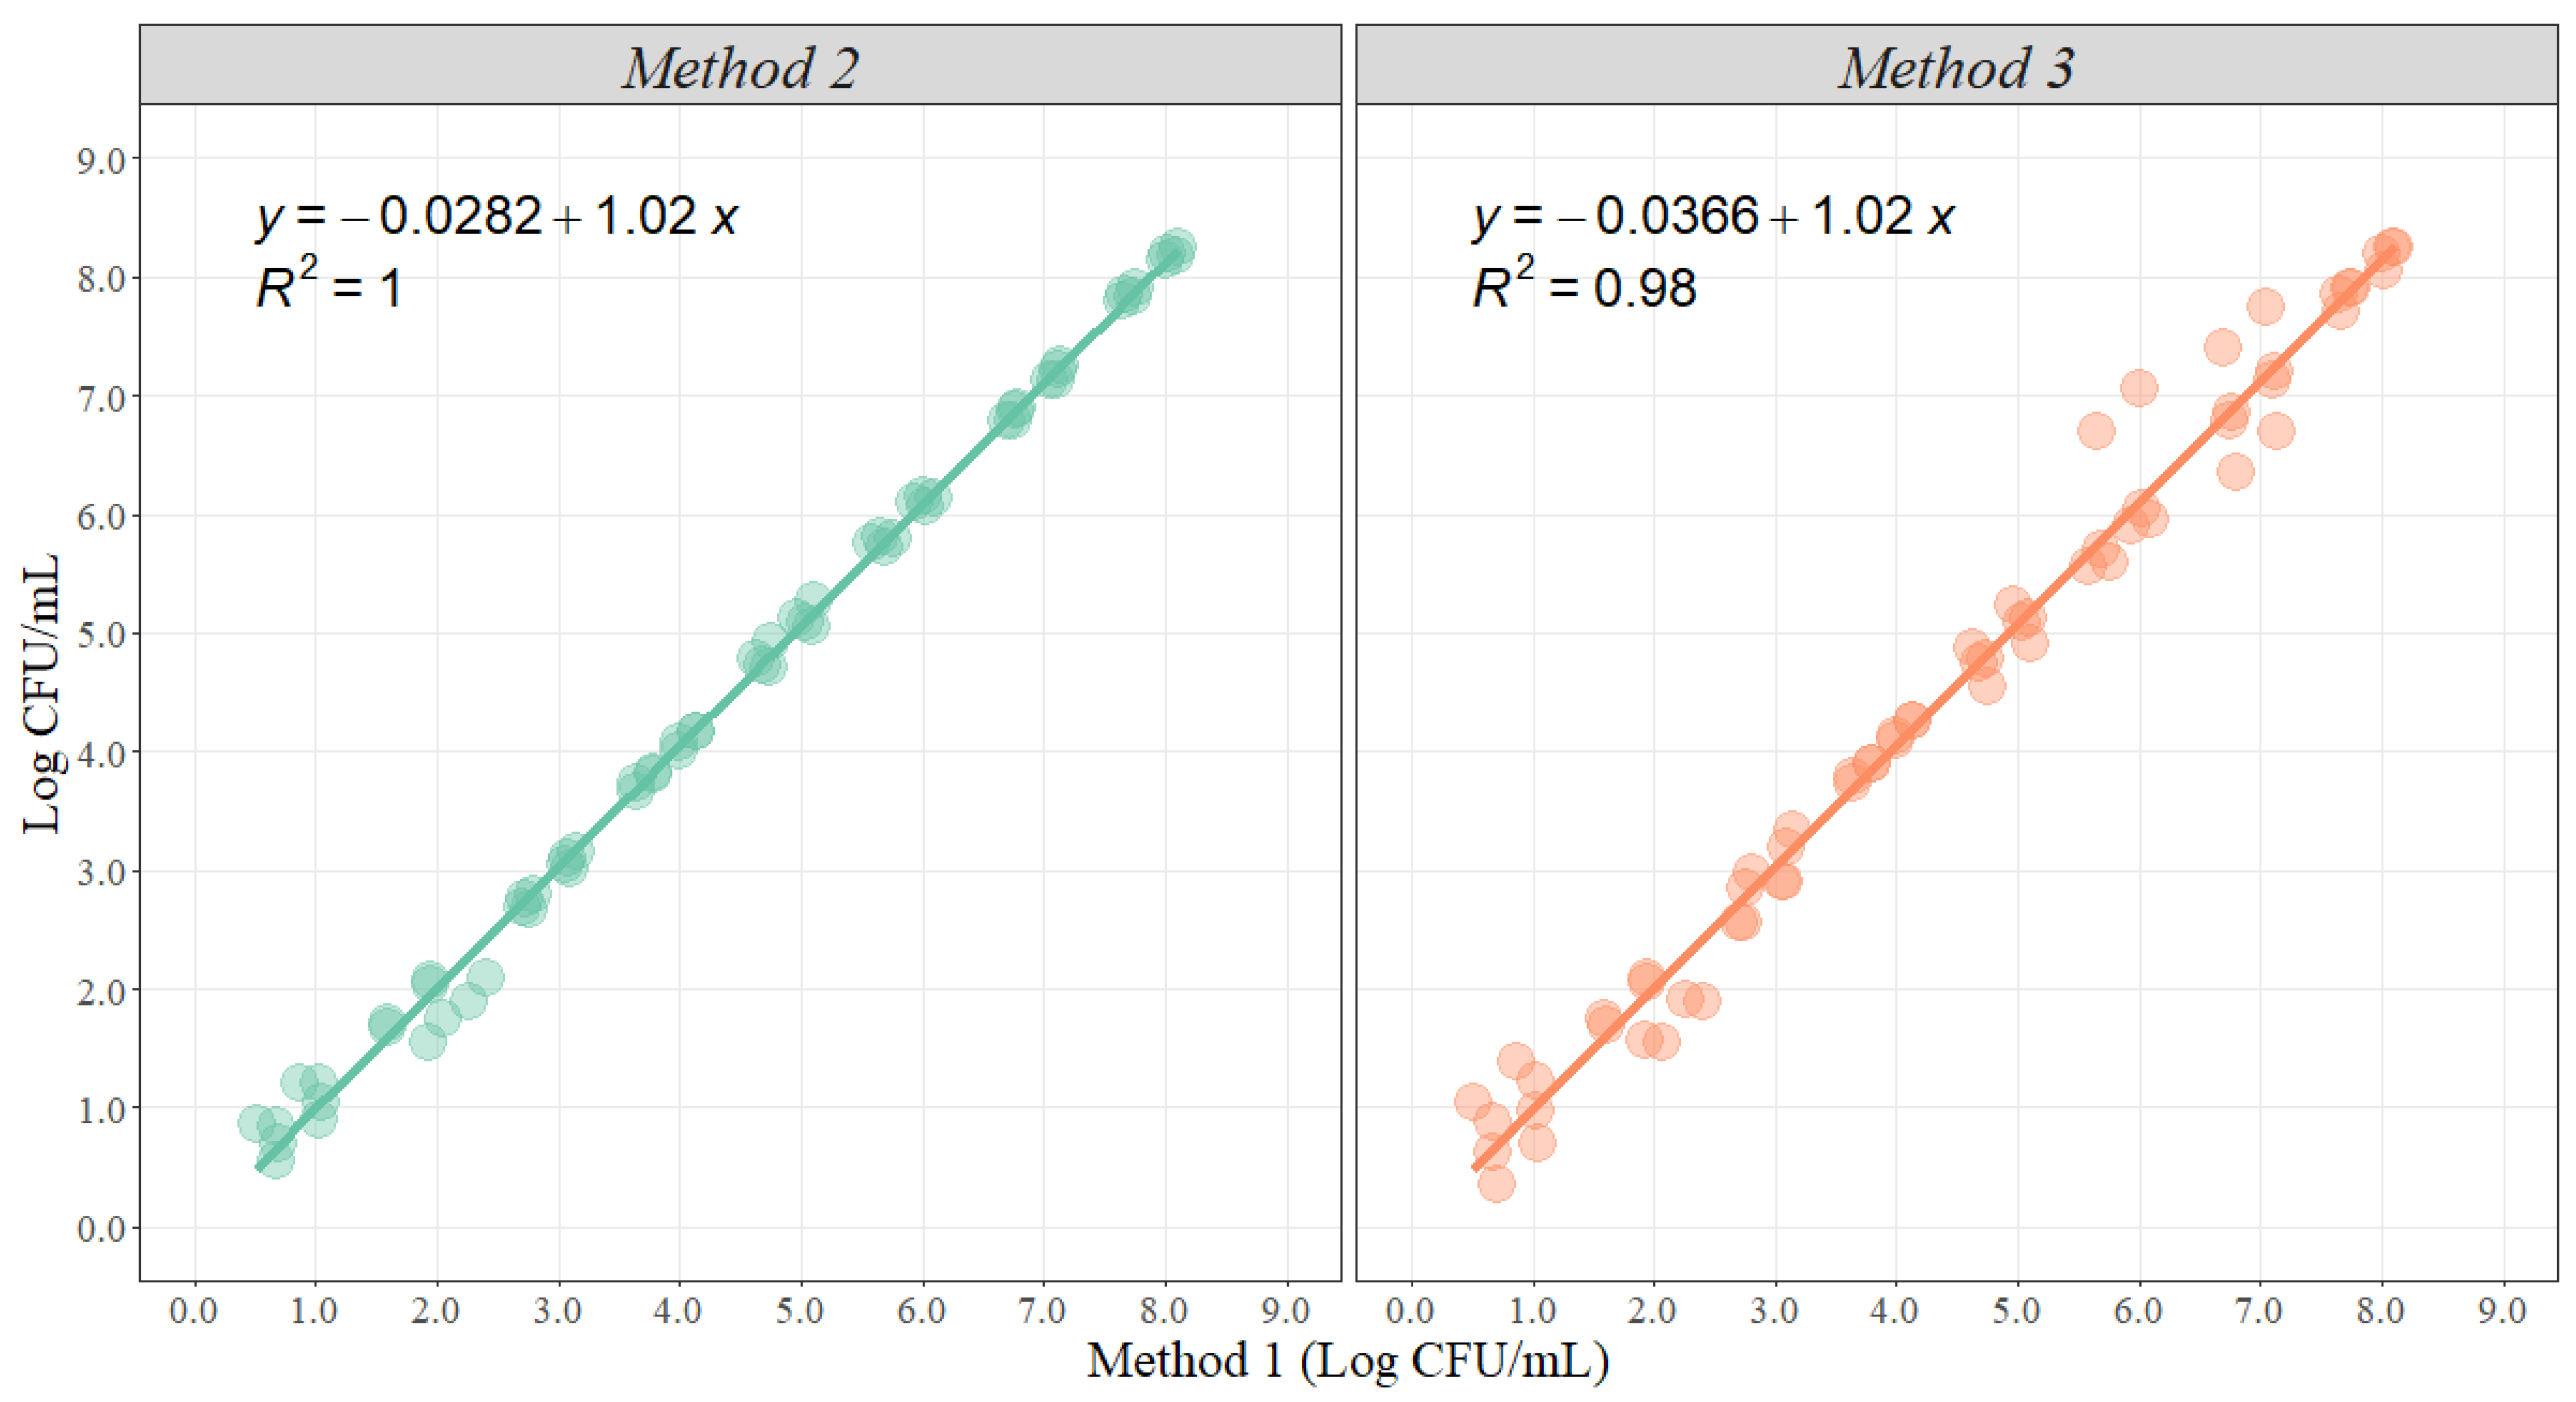
- Linear Regression: When conducting a simple linear regression for method comparison, it is essential to establish the standard method (Method 1) and the methods to be compared (Method 2 and 3). Then, the analysis will estimate two parameters that evaluate the relationship between two variables and can be used to estimate the average rate of change (Figure 2). The slope represents the estimated increase in the dependent variable (Method 2 and 3) per unit increase in the independent variable (Method 1); the greater the value of the slope, the greater the rate of change between the variables. The intercept represents the value associated with the dependent variable (Method 2 and 3) when the independent variable (Method 1) is equal to zero [45,49,51,53,54,56].
- (3)
- Proportion Comparison: the last two examples covered the comparison between two enumeration methodologies, but sometimes methods will give results that follow binomial distributions. A clear example in microbiology is the presence or non-detection of a certain microorganism. The basic idea behind this type of experiment is to compare if the proportion of samples found in each category are statistically different [57,58,61]. McNemar’s chi-square test is often the best approach when two categories are created (Table 2). A significant p-value suggests that methods are not the same at classifying a certain variable in both categories. In this case, there is enough evidence to conclude that Method 1 and 2 are the same, while Method 3 is statistically different from Method 1 and 2 (Table 2). An alternative test is the test for the difference between two proportions. This can be implemented when comparing the proportion of positive (or negative) results between methods. A significant p-value serves as evidence to conclude that the methods are different when detecting positive (or negative) results. Note that this test is based on the central limit theorem, and in order to be valid, samples from each group must be reasonably large (at least 10 positive and 10 negative results in each sample) [34]. Finally, other measures such as sensitivity, specificity, positive predictive value, negative predictive value, and accuracy can also be estimated to evaluate the performance of the new method when compared with the gold standard.
4.2. Pathogen Prevalence Studies
Data Visualization and Data Analysis
4.3. Intervention Studies
Data Visualization and Data Analysis
- (1)
- Means comparison: As described in Section 4.1.1, the same principle of means comparison is used to evaluate differences before and after the application of an intervention. If the study was designed with random samples taken before and after intervention, a Student’s t-test or non-parametric alternative Wilcoxon’s test are the best alternatives for statistical analysis (Figure 3B). However, if results are desired to be presented as reductions (difference between before and after intervention), it is important to design the study properly, with paired samples, in order to use a Student’s t-test for paired samples or a non-parametric alternative Wilcoxon’s test for paired samples, which will give more robust results for analysis. Moreover, if two interventions are compared before and after, an ANOVA test followed by a pairwise comparison t-test or non-parametric alternative Kruskal–Wallis test followed by a pairwise Wilcoxon’s test can be used for these purposes (Figure 3A).
- (2)
- Proportion comparison: When presence or non-detection should be evaluated before and after the use of a certain intervention, the methods and graphical representation described in Section 4.1.1 can be applied on this case. Briefly, McNemar’s chi-square test or a test for the difference between two proportions can be implemented. In both cases, a significant p-value serves as evidence to conclude that both methods are different at detecting positive (or negative) results.
4.4. Bio-Mapping of Processing Facilities and Process Monitoring
Data Visualization and Data Analysis
- (1)
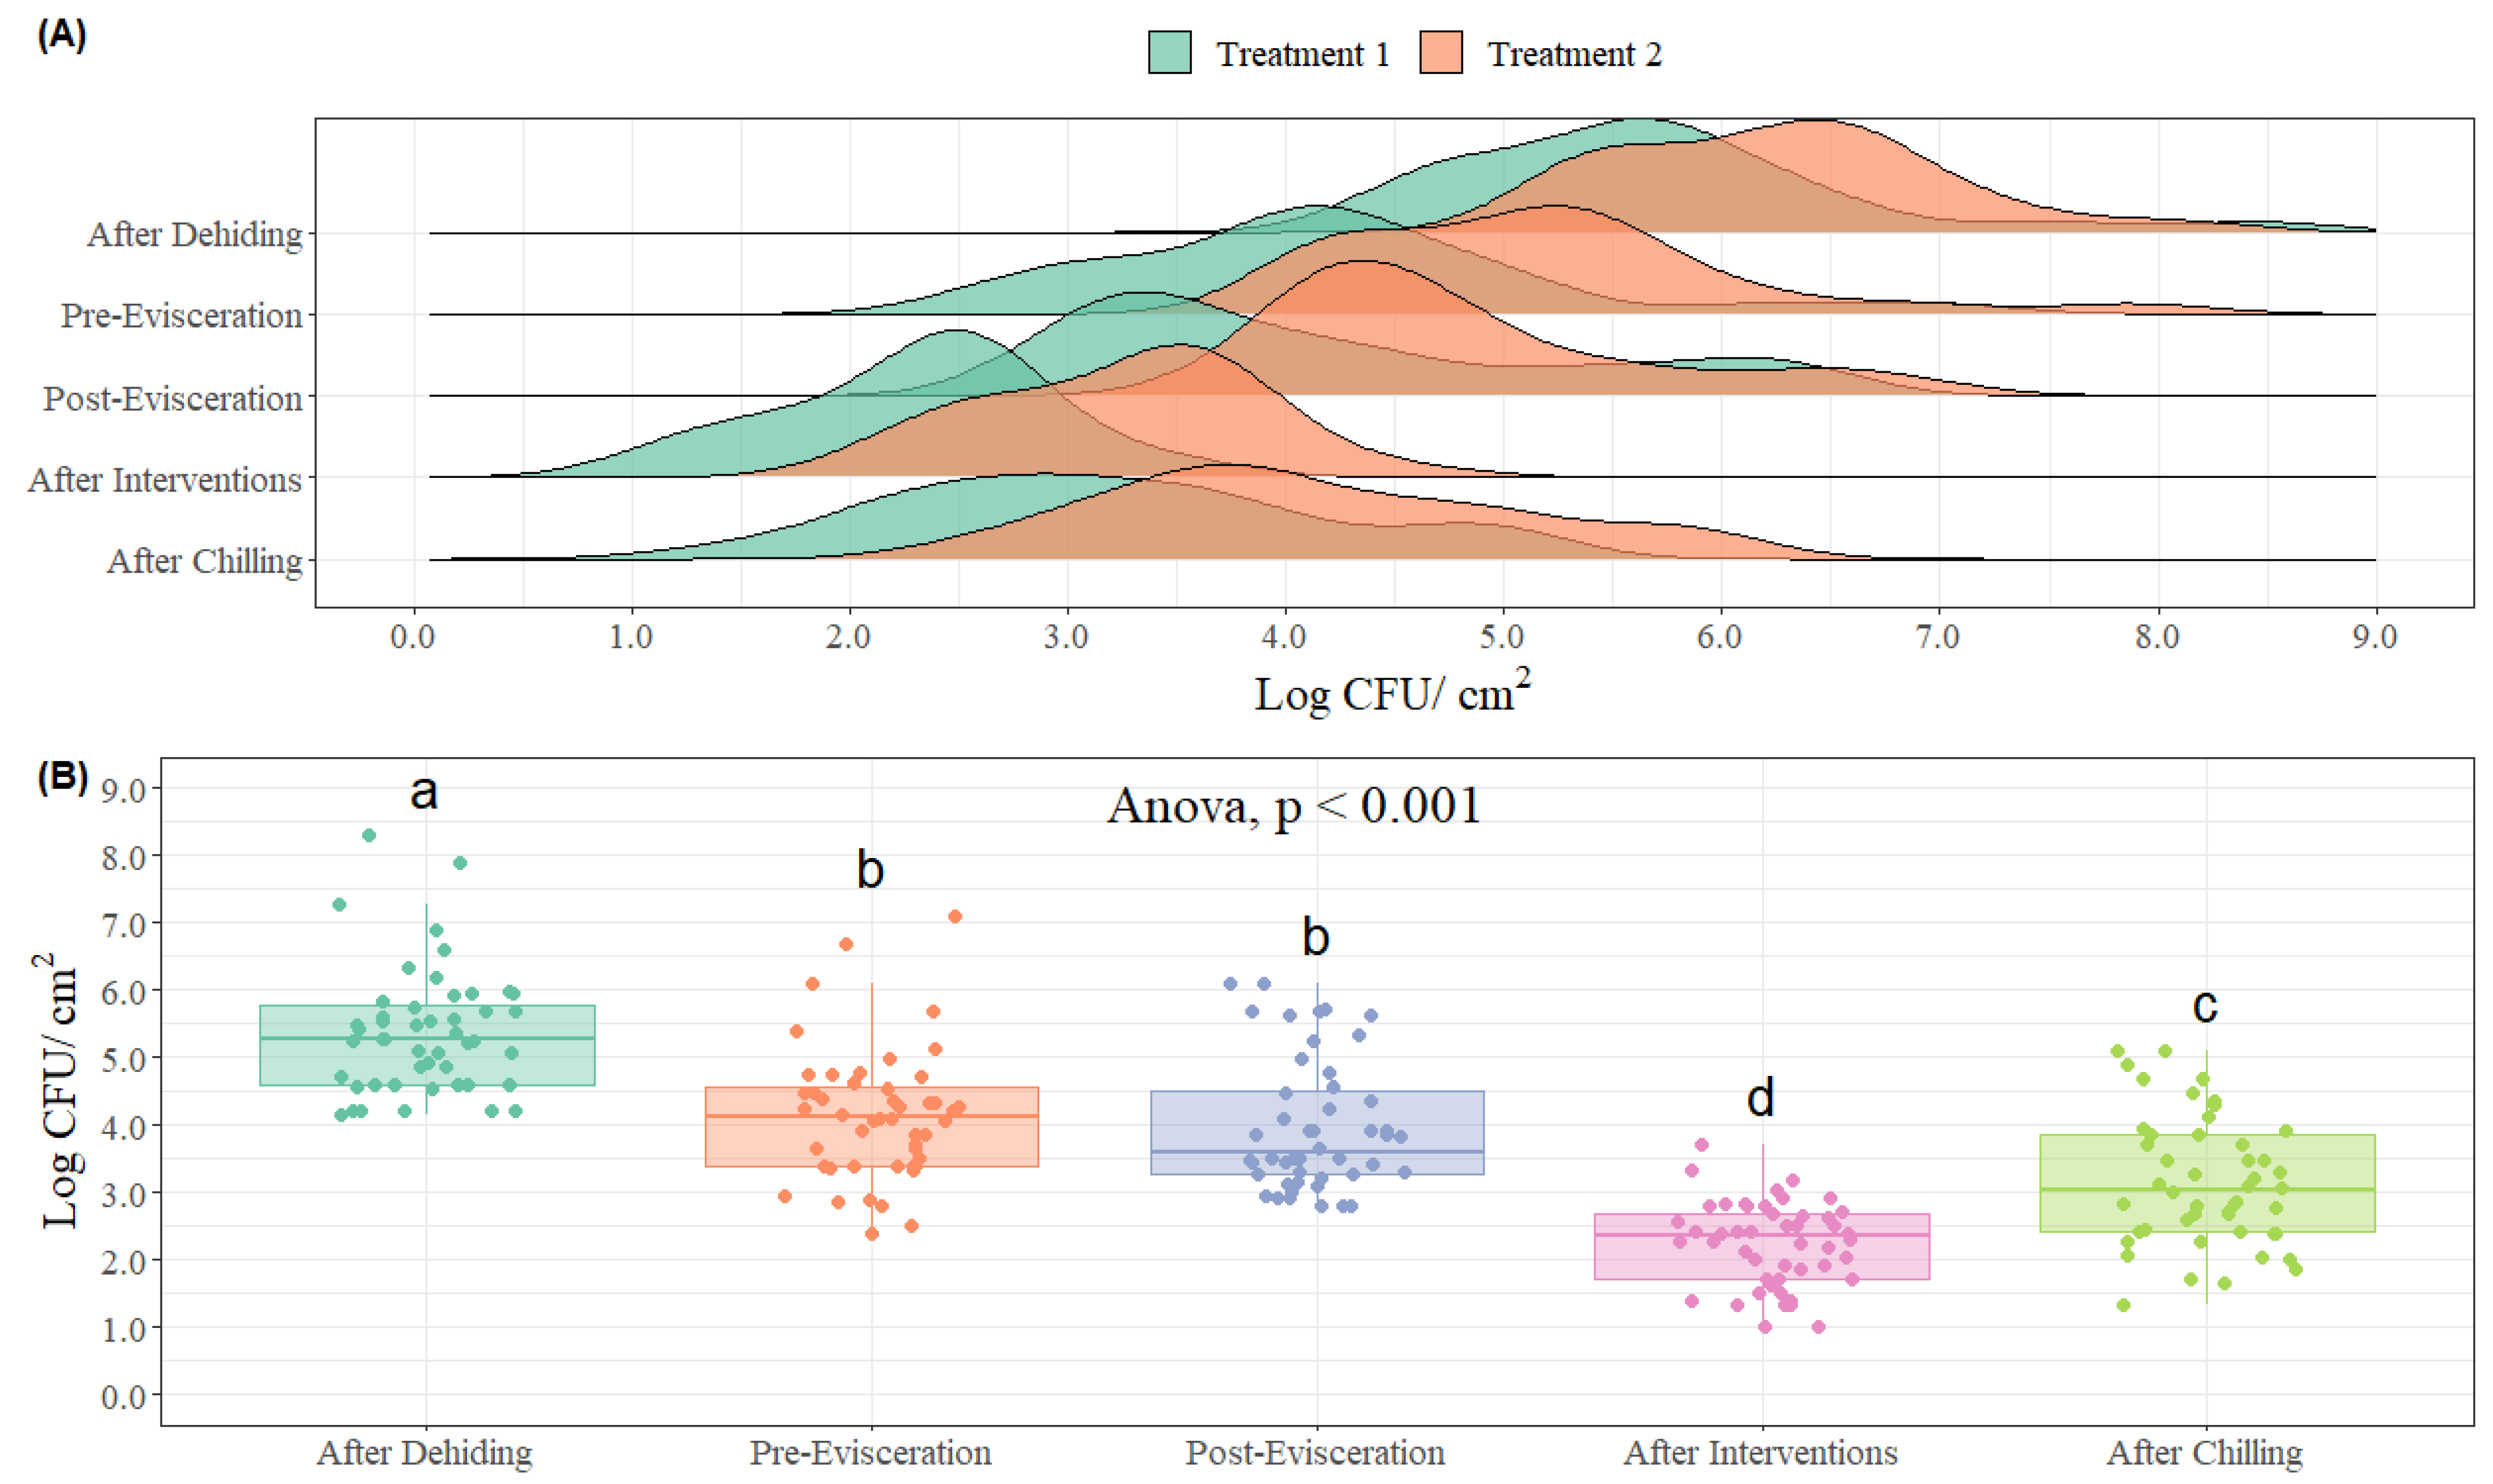
- Boxplots and Kernel Density Estimations: one way to display bio-mapping data is through the use of boxplots as they constitute a powerful graphing tool to visualize sample data and for comparisons across samples [90]. Box plots can be used with a sample size greater than 5 and deliver more information regarding the tails of the distribution. A full description of the components of a boxplot is presented in Section 4.1.1. In practice, the statistical analysis of bio-mapping data for microbial indicators in a processing facility consists of an analysis of variance, when parametric assumptions are satisfied, as displayed in Figure 4B with a bio-mapping of a beef processing facility encompassing 5 sampling locations. ANOVA is a statistical method applied to uncover the main effects of independent variables on a dependent variable [32]. The estimate of variance is calculated from the sum of squares of the differences between each mean data value and the overall mean value. A Kruskal–Wallis test is used as a non-parametric alternative to ANOVA for data analysis in the case when parametric assumptions are not met. In situations when the ANOVA or Kruskal–Wallis are found to be significant, a pairwise comparison assessment is applied, typically using a pairwise t-test for significant ANOVA or a Wilcoxon’s test for significant Kruskal–Wallis tests [37].
- (2)
- Kernel Density Estimation: A kernel density estimation is an alternative technique used for visualization of bio-mapping data, based on the estimation of probability density function (pdf). The kernel estimation yields a smooth empirical pdf using the individual locations of all sample data [91]. Consequently, using this probability density function estimate is a better option for representation of a “true” pdf of a continuous variable. This approach is presented in Figure 4A with a bio-map of a beef processing facility, including 5 sampling locations and the assessment of 2 treatments.
- (3)
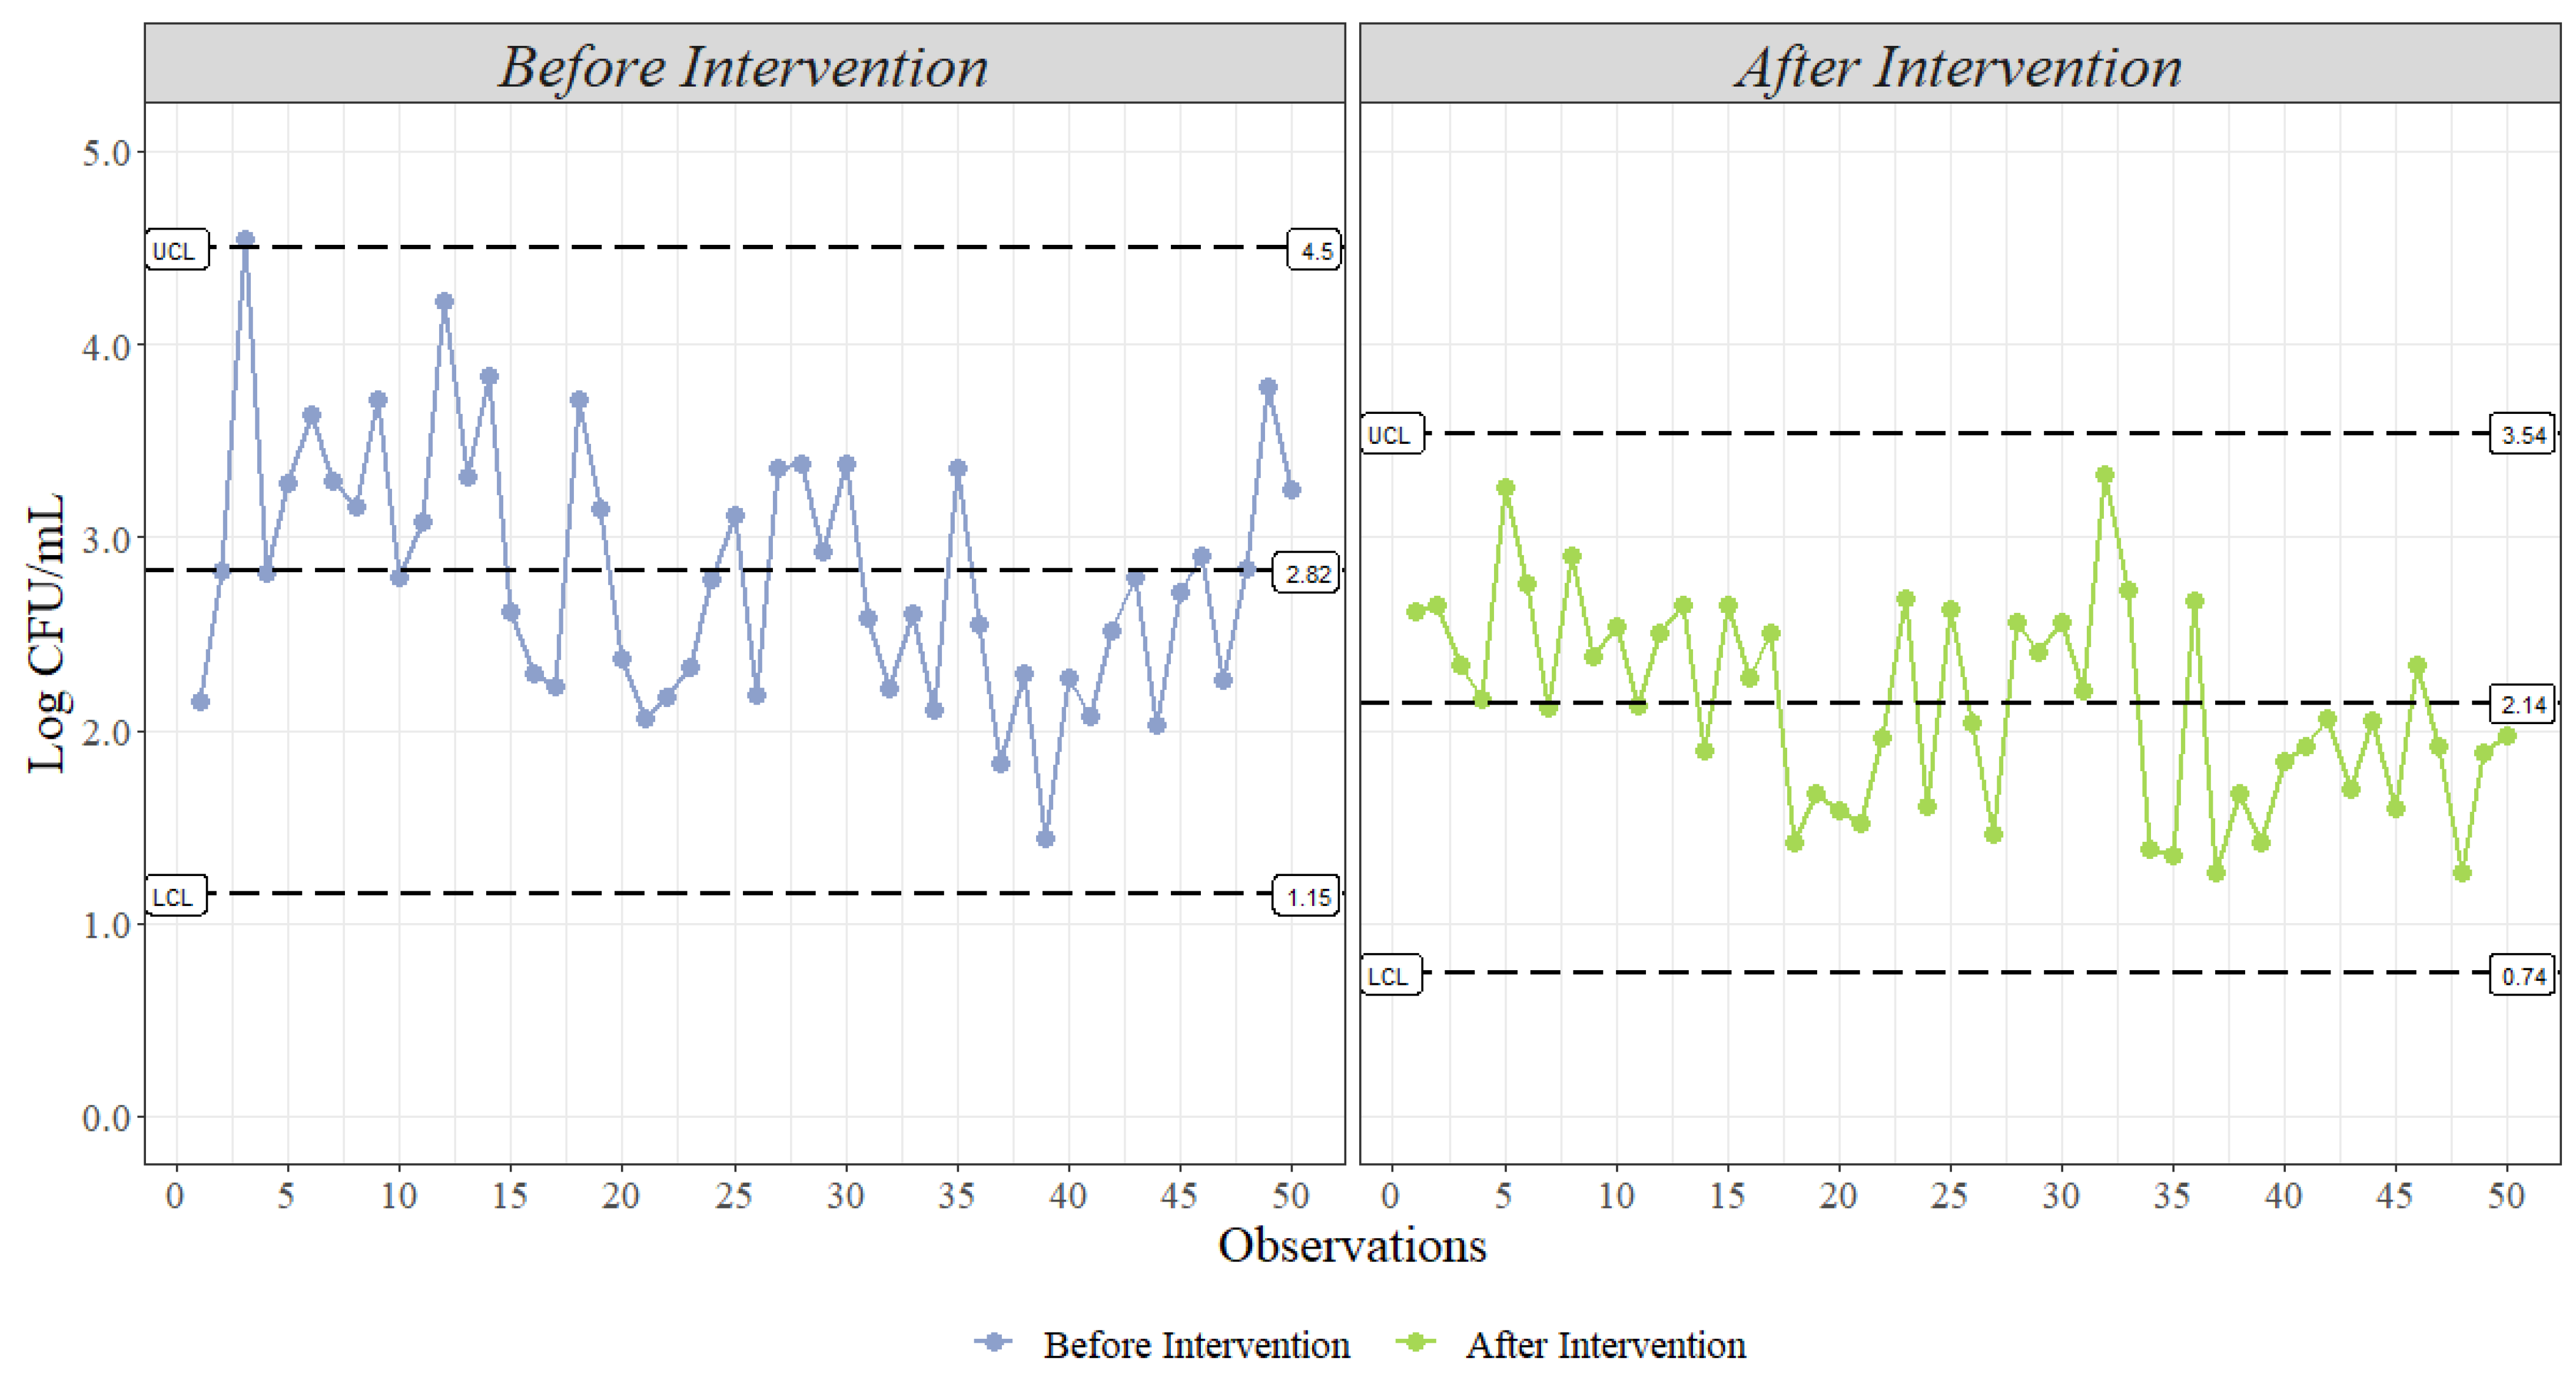
- Shewart’s Statistical Process Control: statistical process control (SPC) is an approach for continuous control of quality and safety which provides tools to monitor, analyze, and evaluate the control of a process with the goal of process efficiency optimization [32]. In terms of process optimization, SPC utilizes monitoring, analysis, and evaluation to achieve a stable process. SPC represents another way to present and visualize microbiological data as that obtained from bio-mapping. Control charts serve to indicate whether a process is in a state of control and can help determine when changes or deviations occur. Two control charts used to display bio-mapping data are the R-chart (based on the range of the results), as seen in Figure 5B, and the S-chart (based on the sample standard deviation), presented in Figure 5A. The applicability of these two types is based on their ability to monitor variations within a process [32]. As its name implies, the R-chart uses the range of a sample set to monitor both process variations. Control limits are established for range data sets by setting upper and lower control limits symmetrically about the target center line. Figure 5B applies the R-chart to a pork bio-map to compare the gambrel table location with the post-intervention location. With a sample size greater than n = 12, standard deviation or an S-chart is a better option to monitor variation [32]. When using an S-chart, s is calculated by averaging the sample standard deviations of the sample sets. Figure 5A presents the SPC of a 10-week poultry bio-map using an S-chart to establish the upper and lower control limits. This plot is very useful to compare initial and final sampling locations which provide information on the effect of interventions and to identify weeks in which process deviations occurred.
- (4)
- Statistical Process Control (XmR Chart): This type of statistical process control is commonly used to monitor industrial processes with a subgroup of size one. X is the data being measured, and mR is the mean moving range, which is calculated by the difference between consecutive data point measurements [34]. In an XmR chart, as shown in Figure 6, the center line represents the mean of the data, while the dashed lines represent the upper and lower control limits. As mentioned before, these control limits can be established using standard deviation or range; however, for this type of chart, the sequential deviation is calculated, as it better explains the random process variation, while the standard deviation is strongly influenced by systematic variation [50]. Then, after the plot is created, violation analysis can be performed under a set of four rules established by Shewart to establish if the process is under control or if it is out of control. As an example, one of the rules states that any point outside the control limits is evidence that a process is out of control [32,34]. In microbiology, observations below the lower control limit (LCL) are not considered out of control, as lower counts represent better microbial performance. However, observations above the upper control limit (UCL) are considered for violation analysis. In our case, one observation in live receiving is above the UCL, suggesting that our process is out of control.
4.5. Shelf Life Studies
Data Visualization and Data Analysis
- (1)
- The most common statistical approach to shelf life studies consists of the evaluation of the effect of a certain treatment over a certain amount of time. Since two factors are evaluated (treatment and time), a two-way ANOVA will provide information about the effect of treatment and time by themselves (main effects) in microbial counts or the interaction between both factors (treatment × time). If the interaction is significant, the statistical analysis suggests that there are significant differences between your groups (treatment) and over time, in other words, the change in the dependent variable (microbial counts) over time is different depending on group membership (treatment). Then, a pairwise comparison between the combination of treatment × time needs to be performed to find differences between treatments at specific time points (Figure 7B). However, if the interaction is not significant, the main effects should be evaluated, understanding that the change in the dependent variable over time is not different depending on group membership, and the results should be presented as they are when one-way ANOVA is performed for each of the main effects.
- (2)
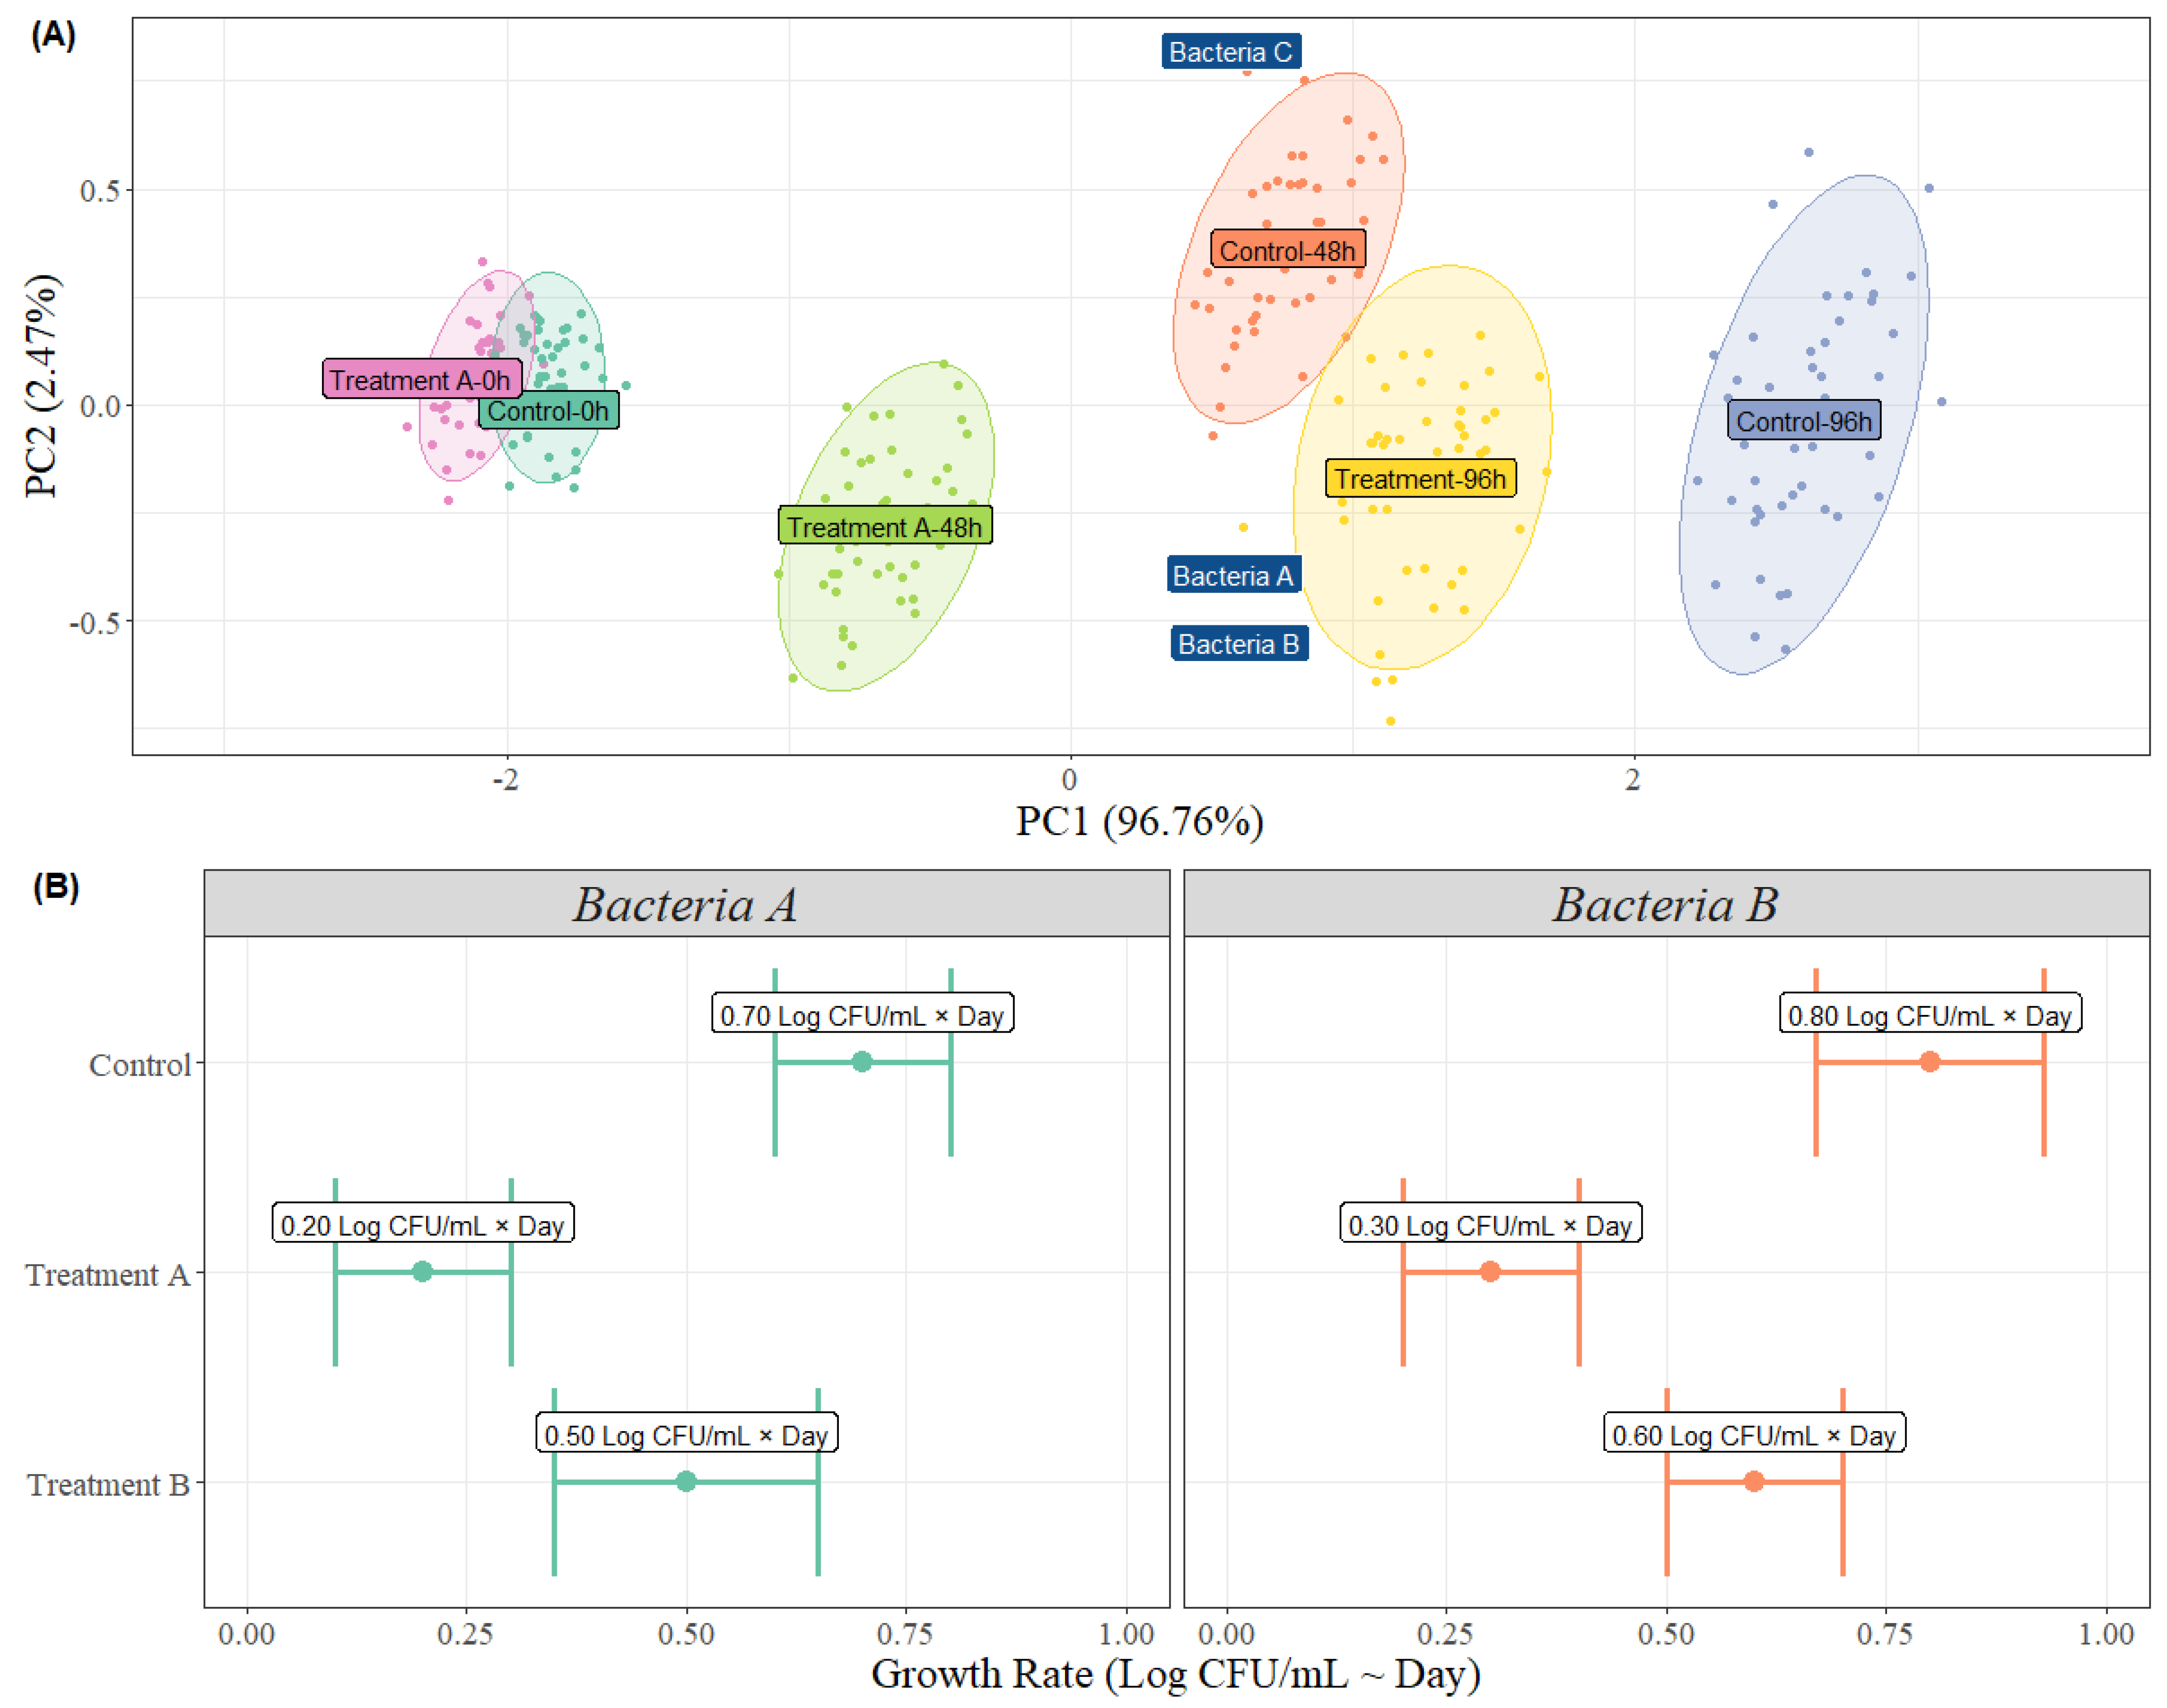
- Multivariate analysis: more complex analysis can be performed in shelf life studies, especially when multiple dependent variables should be analyzed, which is the case while conducting shelf life studies. As mentioned before, many are the factors to be measured in order to establish the shelf life of a product, which is why multivariate analysis such as principal component analysis (PCA) or linear discriminant analysis (LDA) are great tools to simplify the complexity of high-dimensional data while enabling us to observe trends and patterns. When multiple factors are evaluated, an increased error exists due to multiple test correction when evaluating each of the factors and their association with one or several outcomes. The main objective of PCA is to reduce data by projecting them onto dimensions called principal components (PCs) that will summarize the data by maximizing the correlation between data and their projection onto the PCs while trying to maximize the explained variance of the model (Figure 8A). Scale matters with PCA, as a set of variables with larger magnitude than others will overweight the PCA, resulting in variables ignored and results highly affected by these high-magnitude variables, reason why standardization is a key step before conducting PCA.
- (3)
- Multiple linear regression: when conducting shelf life studies, typically a threshold value is established as a measurement to assess if certain attribute will fail. Predicting when this threshold value will be reached will allow to determine the shelf life of a certain product by a certain factor. Multiple linear regression analysis is a more complex type of statistical analysis that uses several explanatory variables to predict the outcome of a response variable, unlike simple linear regression, in which only one independent variable is used to model the response of a dependent variable. In shelf life studies, it is normal that several factors with multiple levels are evaluated to describe their effect on the shelf life of a certain product, reason why multiple linear regression is an interesting alternative for this type of experiment. When conducting analysis of variance (ANOVA), a comparison between the means of each of the groups is evaluated with results highly linked with the levels of the factors established at the beginning of the trial. As an example, imagine that you evaluated the growth of a specific microorganism at different temperatures. The results of the analysis of variance will conclude in differences between the mean groups for each specific temperature evaluated. A more efficient conclusion would be to understand how much the growth is affected when a unit of temperature is changed. This brings up the concept of marginal effect which measures the impact that a unit of change in a variable has on the outcome variable while other variables are held constant. In simple linear regression, the slope of the model measures the marginal effect of the independent variable on the dependent variable, as only one variable is modeled. However, if multiple variables are used in the regression, the marginal effect needs to be calculated with more advanced mathematical methods.
5. Conclusions
Author Contributions
Funding
Data Availability Statement
Conflicts of Interest
References
- White, J.C.; Haven, N. USDA NIFA Workshop on Toxic Elements in Food: Identification of Critical Knowledge Gaps. 2022. Available online: https://portal.ct.gov/-/media/caes/documents/publications/press_releases/2022/october-20/nifa-c2z-workshop-full-report_toxic-elements-in-food.pdf (accessed on 16 March 2023).
- Hedberg, C.W. Foodborne illness acquired in the United States. Emerg. Infect. Dis. 2011, 17, 1338–1340. [Google Scholar] [CrossRef] [PubMed]
- Interagency Food Safety Analytics Collaboration. Foodborne Illness Source Attribution Estimates for Salmonella, Escherichia coli O157, Listeria monocytogenes, and Campylobacter using Outbreak Surveillance Data, United States; Interagency Food Safety Analytics Collaboration: Bossier City, LA, USA, 2022.
- Bintsis, T. Foodborne pathogens. AIMS Microbiol. 2017, 3, 529–563. [Google Scholar] [CrossRef] [PubMed]
- Newman, K.L.; Leon, J.S.; Rebolledo, P.A.; Scallan, E. The impact of socioeconomic status on foodborne illness in high-income countries: A systematic review. Epidemiol. Infect. 2015, 143, 2473–2485. [Google Scholar] [CrossRef] [PubMed]
- Granato, D.; de Araújo Calado, V.Ô.M.; Jarvis, B. Observations on the use of statistical methods in Food Science and Technology. Food Res. Int. 2014, 55, 137–149. [Google Scholar] [CrossRef]
- Mishra, P.; Pandey, C.M.; Singh, U.; Anshul, G.; Sahu, C.; Keshri, A. Descriptive Statistics and Normality Tests for Statistical Data. Ann. Card. Anaesth. 2019, 22, 67–72. [Google Scholar] [PubMed]
- Pampoukis, G.; Lytou, A.E.; Argyri, A.A.; Panagou, E.Z.; Nychas, G.J.E. Recent Advances and Applications of Rapid Microbial Assessment from a Food Safety Perspective. Sensors 2022, 22, 2800. [Google Scholar] [CrossRef] [PubMed]
- Bland, M. Introduction to Medical Statistics, 4th ed.; Oxford University Press: Oxford, UK, 2015. [Google Scholar]
- Kaplan, R.M.; Chambers, D.A.; Glasgow, R.E. Big data and large sample size: A cautionary note on the potential for bias. Clin. Transl. Sci. 2014, 7, 342–346. [Google Scholar] [CrossRef]
- Sundaram, K.R.; Dwivedi, S.N.; Sreenivas, V. Medical Statistics: Principles and Methods, 2nd ed.; Medknow Publications and Media Pvt. Ltd.: New Delhi, India, 2015. [Google Scholar]
- Chik, A.H.S.; Schmidt, P.J.; Emelko, M.B. Learning Something From Nothing: The Critical Importance of Rethinking. Front. Microbiol. 2018, 9, 2304. [Google Scholar] [CrossRef] [PubMed]
- Tropea, A. Microbial Contamination and Public Health: An Overview. Int. J. Environ. Res. Public Health 2022, 19, 7441. [Google Scholar] [CrossRef]
- Emelko, M.B.; Schmidt, P.J.; Reilly, P.M. Particle and microorganism enumeration data: Enabling quantitative rigor and judicious interpretation. Environ. Sci. Technol. 2010, 44, 1720–1727. [Google Scholar] [CrossRef]
- Gracias, K.S.; McKillip, J.L. A review of conventional detection and enumeration methods for pathogenic bacteria in food. Can. J. Microbiol. 2004, 50, 883–890. [Google Scholar] [CrossRef] [PubMed]
- Lund, B.; Baird-Parker, T.C.; Gould, G.W. Microbiological Safety and Quality of Food, 1st ed.; Springer Science & Business Media: Gaithersburg, MD, USA, 2000. [Google Scholar]
- Duarte, A.S.R.; Stockmarr, A.; Nauta, M.J. Fitting a distribution to microbial counts: Making sense of zeroes. Int. J. Food Microbiol. 2015, 196, 40–50. [Google Scholar] [CrossRef] [PubMed]
- Schijven, J.F.; De-Roda-Husman, A.M. Applications of Quantitative Microbial Source Tracking and Quantitative Microbial Risk assessmentMicrobial Source Tracking: Methods, Applications & Case Studies; Springer: New York, NY, USA, 2011. [Google Scholar]
- Busschaert, P.; Geeraerd, A.H.; Uyttendaele, M.; Van Impe, J.F. Hierarchical Bayesian analysis of censored microbiological contamination data for use in risk assessment and mitigation. Food Microbiol. 2011, 28, 712–719. [Google Scholar] [CrossRef] [PubMed]
- Gao, A.; Martos, P. Log transformation and the effect on estimation, implication, and interpretation of mean and measurement uncertainty in microbial enumeration. J. AOAC Int. 2019, 102, 233–238. [Google Scholar] [CrossRef] [PubMed]
- Gilchrist, J.E.; Campbell, J.E.; Donnelly, C.B.; Peeler, J.T.; Delaney, J.M. Spiral plate method for bacterial determination. Appl. Microbiol. 1973, 25, 244–252. [Google Scholar] [CrossRef] [PubMed]
- Kilsby, D.C.; Pugh, M.E. The Relevance of the Distribution of Microorganisms Within Batches of Food to the Control of Microbiological Hazards from Foods. J. Appl. Bacteriol. 1981, 51, 345–354. [Google Scholar] [CrossRef] [PubMed]
- Gherezgihier, B.A.; Mahmud, A.; Samuel, M.; Tsighe, N. Methods and Application of Statistical Analysis in Food Technology. J. Acad. Ind. Res. 2017, 6. [Google Scholar]
- Weiss, N.A. Introductory Statistics, 10th ed.; Pearson: New York, NY, USA, 2015. [Google Scholar]
- Chang, W. R Graphics Cookbook: Practical Recipes for Visualizing Data, 2nd ed.; O’Reilly Media: Sebastopol, CA, USA, 2018. [Google Scholar]
- Unwin, A. Why is Data Visualization Important? What is Important in Data Visualization? Harvard Data Sci. Rev. 2020, 1–7. [Google Scholar]
- Unwin, A. Graphical Data Analysis with R; Chapman & Hall/CRC: Boca Raton, FL, USA, 2015. [Google Scholar]
- Wilkinson, L. The Grammar of Graphics, 2nd ed.; Springer: Berlin/Heidelberg, Germany, 2005. [Google Scholar]
- Wickman, H. Elegant Graphics for Data Analysis; Springer: Berlin/Heidelberg, Germany, 2009. [Google Scholar]
- Freeman, J.V.; Walters, S.J.; Campbell, M.J. How to Display Data, 1st ed.; Blackwell Publishing: Malden, MA, USA, 2008. [Google Scholar]
- Aitken, M.; Broadhurst, B.; Hladky, S. Mathematics for Biological Scientists; Taylor & Francis Group: New York, NY, USA, 2010. [Google Scholar]
- Jarvis, B. Statistical Aspects of Sampling of Microbiological Analysis. Statistical Aspects of the Microbiological Examination of Foods, 3rd ed.; Academic Press: London, UK, 2016. [Google Scholar]
- Bliss, C.I.; Fisher, R.A. Fitting the Negative Binomial Distribution to Biological Data. Biometrics 1953, 9, 176. [Google Scholar] [CrossRef]
- Navidi, W. Statistics for Scientist and EngineersStatistics for Engineers and Scientists, 3rd ed.; McGraw-Hill: New York, NY, USA, 2011. [Google Scholar]
- McDonald, J.H. Handbook of Biological Statistics, 3rd ed.; Sparky House Publishing: Baltimore, MD, USA, 2014. [Google Scholar]
- Fagerland, M.W.; Sandvik, L.; Mowinckel, P. Parametric methods outperformed non-parametric methods in comparisons of discrete numerical variables. BMC Med. Res. Methodol. 2011, 11, 44–48. [Google Scholar] [CrossRef]
- Conover, W.J. Practical NonParametric Statistics, 3rd ed.; John Wiley & Sons Inc.: Hoboken, NJ, USA, 1999. [Google Scholar]
- Jarvis, B. Frequency distributions. In Statistical Aspects of the Microbiological Examination of Foods, 3rd ed.; Jarvis, B., Ed.; Academic Press: Cambridge, MA, USA, 2016. [Google Scholar]
- Mayya, S.S.; Monteiro, A.D.; Ganapathy, S. Types of biological variables. J. Thorac. Dis. 2017, 9, 1730–1733. [Google Scholar] [CrossRef] [PubMed]
- Hawkins, D. Biomeasurement: A Student’s Guide to Biological Statistics, 4th ed.; Oxford University Press: Oxford, UK, 2019. [Google Scholar]
- Nehls, G.J.; Akland, G.G. Procedures for Handling Aerometric Data. J. Air Pollut. Control Assoc. 1973, 23, 180–184. [Google Scholar] [CrossRef]
- Hornung, R.W.; Reed, L.D. Estimation of Average Concentration in the Presence of Nondetectable Values. Appl. Occup. Environ. Hyg. 1990, 5, 46–51. [Google Scholar] [CrossRef]
- Applegate, S.F.; Englishbey, A.K.; Stephens, T.P.; Sanchez-plata, M.X. Development and Verification of a Poultry Management Tool to Quantify Salmonella from Live to Final Product Utilizing RT-PCR. Foods 2023, 12, 419. [Google Scholar] [CrossRef] [PubMed]
- Chaney, W.E.; Englishbey, A.K.; Stephens, T.P.; Applegate, S.F.; Sanchez-Plata, M.X. Application of a Commercial Salmonella Real-Time PCR Assay for the Detection and Quantitation of Salmonella enterica in Poultry Ceca. J. Food Prot. 2022, 85, 527–533. [Google Scholar] [CrossRef] [PubMed]
- Vargas, D.A.; Betancourt-barszcz, G.K.; Blandon, S.E.; Applegate, S.F.; Brashears, M.M.; Miller, M.F.; Gragg, S.E.; Sanchez-Plata, M.X. Rapid Quantitative Method Development for Beef and Pork Lymph Nodes Using BAX® System Real Time Salmonella Assay. Foods 2023, 12, 822. [Google Scholar] [CrossRef] [PubMed]
- Bueno López, R.; Vargas, D.A.; Jimenez, R.L.; Casas, D.E.; Miller, M.F.; Brashears, M.M.; Sanchez-Plata, M.X. Quantitative Bio-Mapping of Salmonella and Indicator Organisms at Different Stages in a Commercial Pork Processing Facility. Foods 2022, 11, 2580. [Google Scholar] [CrossRef] [PubMed]
- De Villena, J.F.; Vargas, D.A.; López, R.B.; Chávez-Velado, D.R.; Casas, D.E.; Jiménez, R.L.; Sanchez-Plata, M.X. Bio-Mapping Indicators and Pathogen Loads in a Commercial Broiler Processing Facility Operating with High and Low Antimicrobial Intervention Levels. Foods 2022, 11, 775. [Google Scholar] [CrossRef]
- Applegate, S.F.; Sánchez-Plata, M.X.; Nightingale, K.K.; Thompson, L.; Stephens, T.P.; Brashears, M.M. Development, Verification, and Validation of a RT-PCR Based Methodology for Salmonella Quantification as a Tool for Integrated Food Safety Management in Poultry from Live Production to Final Product. Foods 2023, 12, 419. [Google Scholar] [CrossRef]
- Beuchat, L.R.; Copeland, F.; Curiale, M.S.; Danisavich, T.; Gangar, V.; King, B.W.; Lawlis, T.L.; Likin, R.O.; Okwusoa, J.; Smith, C.F.; et al. Comparison of the SimPlate Total Plate Count Method with Petrifilm, Redigel, and Conventional Pour-Plate Methods for Enumerating Aerobic Microorganisms in Foods. J. Food Prot. 1998, 61, 14–18. [Google Scholar] [CrossRef]
- Brown, L.N.P.; Sanchez-Plata, M.X.; Thompson, L.; Singh, S.; Echeverry, A.; Brashears, M.M. Integration of Regulatory Compliance Assessments, Microbial Bio-Mapping, and Novel Intervention Technologies for Food Safety Management in Controlled Environment Agriculture: Vertical Hydroponics Leafy Green Facility; Texas Tech University: Lubbock, TX, USA, 2022. [Google Scholar]
- Hygiena. HygienaTM MicroSnapTM vs 3MTM PetrifilmTM vs bioMérieux TEMPO® Correlation Objective. Available online: www.hygiena.com (accessed on 16 March 2023).
- Line, J.E.; Stern, N.J.; Oakley, B.B.; Seal, B.S. Comparison of an Automated Most-Probable-Number Technique with Traditional Plating Methods for Estimating Populations of Total Aerobes, Coliforms, and Escherichia coli Associated with Freshly Processed Broiler Chickens. J. Food Prot. 2011, 74, 1558–1563. [Google Scholar] [CrossRef] [PubMed]
- Meighan, P.; Chen, Y.; Brodsky, M.; Agin, J. Validation of the microsnap coliform and E. coli test system for enumeration and detection of coliforms and E. coli in a variety of foods. J. AOAC Int. 2014, 97, 453–478. [Google Scholar] [CrossRef] [PubMed]
- Meighan, P.; Smith, M.; Datta, S.; Katz, B.; Nason, F. The validation of the microsnap total for enumeration of total viable count in a variety of foods. J. AOAC Int. 2016, 99, 686–694. [Google Scholar] [CrossRef] [PubMed]
- Owen, M.; Willis, C.; Lamph, D. Evaluation of the TEMPO most probable number technique for the enumeration of Enterobacteriaceae in food and dairy products. J. Appl. Microbiol. 2010, 2004, 1810–1816. [Google Scholar] [CrossRef] [PubMed]
- Vargas, D.A.; Casas, D.E.; Chávez-Velado, D.R.; Jiménez, R.L.; Betancourt-Barszcz, G.K.; Randazzo, E.; Lynn, D.; Echeverry, A.; Brashears, M.M.; Sánchez-Plata, M.X.; et al. In-plant intervention validation of a novel ozone generation technology (Bio-safe) compared to lactic acid in variety meats. Foods 2021, 10, 2106. [Google Scholar] [CrossRef]
- Belete, T.; Crowley, E.; Bird, P.; Gensic, J.; Wallace, F.M. A Comparison of the BAX System Method to the U.S. Food and Drug Administration’s Bacteriological Analytical Manual and International Organization for Standardization Reference Methods for the Detection of Salmonella in a Variety of Soy Ingredients. J. Food Prot. 2014, 77, 1778–1783. [Google Scholar] [CrossRef] [PubMed]
- Johnson, J.L.; Brooke, C.L. Comparison of the BAX for Screening/E.coli O157: H7 Method with Conventional Methods for Detection of Extremely Low Levels of Escherichia coli O157: H7 in Ground Beef. Appl. Environ. Microbiol. 1998, 64, 4390–4395. [Google Scholar] [CrossRef] [PubMed]
- Liu, T.; Belk, K.E.; Zagmutt, F.J. Evaluation of Gene-Up and TEMPO AC for Determination of Shiga Toxin Producing Escherichia coli and Total Aerobic Microbial Populations from Microtally Sheets used to Sample Beef Carcasses and Hides; Colorado State University: Fort Collins, CO, USA, 2020. [Google Scholar]
- Manfreda, G.; De Cesare, A.; Bondioli, V.; Franchini, A. Comparison of the BAX R System with a multiplex PCR method for simultaneous detection and identification of Campylobacter jejuni and Campylobacter coli in environmental samples. Int. J. Food Microbiol. 2003, 87, 271–278. [Google Scholar] [CrossRef]
- Maria, U.; Silva, D.A.; Mu, J.; Filipini, T.A.; Ange, D.; Moliterno, L.; Santos, A.D.O.S.; Baccarin, A.; Lea, A.; Frezza, O.C.; et al. Comparison of the BAX System PCR Method to Brazil’s Official Method for the Detection of Salmonella in Food, Water, and environmental samples. J. Food Prot. 2008, 71, 2442–2447. [Google Scholar]
- Casas, D.; Brashears, M.M.; Miller, M.F.; Inestroza, B.; Bueso-ponce, M.; Huerta-leidenz, N.; Calle, A.; Paz, R.; Bueno, M.; Echeverry, A. In-Plant Validation Study of Harvest Process Controls in Two Beef Processing Plants in Honduras. J. Food Prot. 2019, 82, 677–683. [Google Scholar] [CrossRef]
- Shah, M.; Kathiiko, C.; Wada, A.; Odoyo, E.; Bundi, M.; Miringu, G.; Guyo, S. Prevalence, seasonal variation, and antibiotic resistance pattern of enteric bacterial pathogens among hospitalized diarrheic children in suburban regions of central Kenya. Trop. Med. Health. 2016, 44, 39. [Google Scholar] [CrossRef]
- Casas, D.E.; Vargas, D.A.; Randazzo, E.; Lynn, D.; Echeverry, A.; Brashears, M.M.; Sanchez-Plata, M.X.; Miller, M.F. In-Plant Validation of Novel on-Site Ozone Generation Technology (Bio-Safe) Compared to Lactic Acid Beef Carcasses and Trim Using Natural Microbiota and Salmonella and E. coli O157:H7 Surrogate Enumeration. Foods 2021, 10, 1002. [Google Scholar] [CrossRef] [PubMed]
- Fernandez, M.; Garcia, A.; Vargas, D.A.; Calle, A. Dynamics of Microbial Shedding in Market Pigs during Fasting and the Influence of Alginate Hydrogel Bead Supplementation during Transportation. Microbiol. Res. 2021, 12, 888–898. [Google Scholar] [CrossRef]
- Forgey, S.J.; Englishbey, A.K.; Casas, D.E.; Jackson, S.P.; Miller, M.F.; Echeverry, A.; Brashears, M.M. Presence of Presumptive Shiga Toxin—Producing Escherichia coli and Salmonella on Sheep during Harvest in Honduras. J. Food Prot. 2020, 83, 2008–2013. [Google Scholar] [CrossRef]
- Mcauley, C.M.; Mcmillan, K.; Moore, S.C.; Fegan, N.; Fox, E.M. Prevalence and characterization of foodborne pathogens from Australian dairy farm environments. J. Dairy Sci. 2014, 97, 7402–7412. [Google Scholar] [CrossRef] [PubMed]
- Rortana, C.; Nguyen-viet, H.; Tum, S.; Unger, F.; Boqvist, S.; Dang-xuan, S.; Koam, S.; Grace, D.; Osbjer, K.; Heng, T.; et al. Prevalence of Salmonella spp. and Staphylococcus aureus in Chicken Meat and Pork from Cambodian Markets. Pathogens 2021, 10, 556. [Google Scholar] [CrossRef]
- Pelt, A.E.; Quiñonez, V.B.; Lofgren, H.L.; Bartz, F.E.; Newman, K.L.; Leon, J.S. Low Prevalence of Human Pathogens on Fresh Produce on Farms and in Packing Facilities: A Systematic Review. Front. Public Health 2018, 6, 40. [Google Scholar] [CrossRef]
- Smith, B.A.; Meadows, S.; Meyers, R.; Parmley, E.J.; Fazil, A. Seasonality and zoonotic foodborne pathogens in Canada: Relationships between climate and Campylobacter, E.coli and Salmonella in meat products. Epidemiol Infect. 2019, 147, e190. [Google Scholar] [CrossRef]
- Loretz, M.; Stephan, R.; Zweifel, C. Antibacterial activity of decontamination treatments for pig carcasses. Food Control. 2011, 22, 1121–1125. [Google Scholar] [CrossRef]
- Scheinberg, J.A.; Svoboda, A.L.; Cutter, C.N. High-pressure processing and boiling water treatments for reducing Listeria monocytogenes, Escherichia coli O157: H7, Salmonella spp., and Staphylococcus aureus during beef jerky processing. Food Control. 2014, 39, 105–110. [Google Scholar] [CrossRef]
- Dixon, E.; Rabanser, I.; Dzieciol, M.; Zwirzitz, B.; Wagner, M.; Mann, E.; Stessl, B.; Wetzels, S.U. Reduction potential of steam vacuum and high-pressure water treatment on microbes during beef meat processing. Food Control. 2019, 106, 106728. [Google Scholar] [CrossRef]
- Nielsen, B.; Colle, M.J.; Ünlü, G. Meat safety and quality: A biological approach. Int. J. Food Sci. Technol. 2021, 56, 39–51. [Google Scholar] [CrossRef]
- Wheeler, T.L.; Kalchayanand, N.; Bosilevac, J.M. Pre- and post-harvest interventions to reduce pathogen contamination in the U.S. beef industry. Meat Sci. 2014, 98, 372–382. [Google Scholar] [CrossRef] [PubMed]
- Balta, I.; Butucel, E.; Stef, L.; Pet, I.; Gradisteanu-Pircalabioru, G.; Chifiriuc, C.; Gundogdu, O.; Mccleery, D.; Corcionivoschi, N. Anti-Campylobacter Probiotics: Latest Mechanistic Insights. Foodborne Pathog. Dis. 2022, 19, 693–703. [Google Scholar] [CrossRef] [PubMed]
- Brashears, M.M.; Chaves, B.D. The diversity of beef safety: A global reason to strengthen our current systems. Meat Sci. 2017, 132, 59–71. [Google Scholar] [CrossRef] [PubMed]
- Zdolec, N.; Kotsiri, A.; Houf, K.; Alvarez-Ordóñez, A.; Blagojevic, B.; Karabasil, N.; Salines, M.; Antic, D. Systematic Review and Meta-Analysis of the Efficacy of Interventions Applied during Primary Processing to Reduce Microbial Contamination on Pig Carcasses. Foods 2022, 11, 2110. [Google Scholar] [CrossRef]
- Muriana, P.M.; Eager, J.; Wellings, B.; Morgan, B.; Nelson, J.; Kushwaha, K. Evaluation of antimicrobial interventions against E. Coli O157:H7 on the Surface of Raw Beef to Reduce Bacterial Translocation during Blade Tenderization. Foods 2019, 8, 80. [Google Scholar] [CrossRef] [PubMed]
- Vargas, D.A.; Miller, M.F.; Woerner, D.R.; Echeverry, A. Microbial growth study on pork loins as influenced by the application of different antimicrobials. Foods 2021, 10, 968. [Google Scholar] [CrossRef]
- Wideman, N.; Bailey, M.; Bilgili, S.F.; Thippareddi, H.; Wang, L.; Bratcher, C.; Sanchez-Plata, M.; Singh, M. Evaluating best practices for Campylobacter and Salmonella reduction in poultry processing plants. Poult. Sci. 2016, 95, 306–315. [Google Scholar] [CrossRef]
- Benli, H.; Sanchez-Plata, M.X.; Ilhak, O.I.; De González, M.T.N.; Keeton, J.T. Evaluation of antimicrobial activities of sequential spray applications of decontamination treatments on chicken carcasses. Asian-Australas. J. Anim. Sci. 2015, 28, 405–410. [Google Scholar] [CrossRef]
- Singh, M.; Thippareddi, H. Biomapping: An Effective Tool for Pathogen Control during Poultry Processing. 2020. Available online: https://extension.uga.edu/publications/detail.html?number=C1200&title=biomapping-an-effective-tool-for-pathogen-control-during-poultry-processing (accessed on 16 March 2023).
- Dutta, V. The Importance of Leveraging Biomapping in Salmonella Control. 2022. Available online: https://www.foodqualityandsafety.com/article/the-importance-of-leveraging-biomapping-in-salmonella-control/ (accessed on 16 March 2023).
- Biasino, W.; De Zutter, L.; Mattheus, W.; Bertrand, S.; Uyttendaele, M.; Van Damme, I. Correlation between slaughter practices and the distribution of Salmonella and hygiene indicator bacteria on pig carcasses during slaughter. Food Microbiol. 2018, 70, 192–199. [Google Scholar] [CrossRef] [PubMed]
- O’Connor, A.M.; Wang, B.; Denagamage, T.; McKean, J. Process Mapping the Prevalence of Salmonella Contamination on Pork Carcass from Slaughter to Chilling: A Systematic Review Approach. Foodborne Pathog. Dis. 2012, 9, 386–395. [Google Scholar] [CrossRef] [PubMed]
- Vargas, D.A.; De Villena, J.F.; Larios, V.; Bueno, R.; Ch, D.R.; Casas, D.E.; Jim, R.L.; Blandon, S.E.; Sanchez-plata, M.X. Data-Mining Poultry Processing Bio-Mapping Counts of Management Decision Making. Foods 2023, 12, 898. [Google Scholar] [CrossRef] [PubMed]
- Casas, D.E.; Manishimwe, R.; Forgey, S.J.; Hanlon, K.E.; Miller, M.F.; Brashears, M.M.; Sanchez-Plata, M.X. Biomapping of Microbial Indicators on Beef Subprimals Subjected to Spray or Dry Chilling over Prolonged Refrigerated Storage. Foods 2021, 10, 1403. [Google Scholar] [CrossRef] [PubMed]
- Vargas, D.A.; Rodríguez, K.M.; Betancourt-Barszcz, G.K.; Ajcet-Reyes, M.I.; Dogan, O.B.; Randazzo, E.; Sánchez-Plata, M.X.; Brashears, M.M.; Miller, M.F. Bio-Mapping of Microbial Indicators to Establish Statistical Process Control Parameters in a Commercial Beef Processing Facility. Foods 2022, 11, 1133. [Google Scholar] [CrossRef] [PubMed]
- Krzywinski, M.; Altman, N. Visualizing samples with box plots. Nat. Methods 2014, 11, 119–120. [Google Scholar] [CrossRef] [PubMed]
- Węglarczyk, S. Kernel density estimation and its application. ITM Web Conf. 2018, 23, 00037. [Google Scholar] [CrossRef]
- Papadochristopoulos, A.; Kerry, J.P.; Fegan, N.; Burgess, C.M.; Duffy, G. Natural anti-microbials for enhanced microbial safety and shelf-life of processed packaged meat. Foods 2021, 10, 1598. [Google Scholar] [CrossRef] [PubMed]
- Nicoli, M.C. Shelf Life Assessment of Food; CRC Press: Bacon Raton, FL, USA, 2012. [Google Scholar]
- Santos, D.; Monteiro, M.J.; Voss, H.P.; Komora, N.; Teixeira, P.; Pintado, M. The most important attributes of beef sensory quality and production variables that can affect it: A review. Livest. Sci. 2021, 250, 104573. [Google Scholar] [CrossRef]
- United States Department of Agriculture. Food Waste FAQs. 2023. Available online: https://www.usda.gov/foodwaste/faqs (accessed on 16 March 2023).
- Vargas, D.A.; Blandon, S.E.; Sarasty, O.; Osorio-Doblado, A.M.; Miller, M.F.; Echeverry, A. Shelf-Life Evaluation of Pork Loins as Influenced by the Application of Different Antimicrobial Interventions. Foods 2022, 11, 3464. [Google Scholar] [CrossRef]
- Steele, K.S.; Weber, M.J.; Boyle, E.A.E.; Hunt, M.C.; Lobaton-Sulabo, A.S.; Cundith, C.; Hiebert, Y.H.; Abrolat, K.A.; Attey, J.M.; Clark, S.D.; et al. Shelf life of fresh meat products under LED or fluorescent lighting. Meat Sci. 2016, 117, 75–84. [Google Scholar] [CrossRef]
- Allen, C.D.; Fletcher, D.L.; Northcutt, J.K.; Russell, S.M. The Relationship of Broiler Breast Color to Meat Quality and Shelf-Life. Poult. Sci. 1998, 77, 361–366. [Google Scholar] [CrossRef] [PubMed]
- Xu, M.M.; Kaur, M.; Pillidge, C.J.; Torley, P.J. Australian consumers’ attitudes to packaged fresh meat products with added microbial bioprotective cultures for shelf-life extension. Meat Sci. 2023, 198, 109095. [Google Scholar] [CrossRef] [PubMed]
- Guo, Y.; Huang, J.; Sun, X.; Lu, Q.; Huang, M.; Zhou, G. Effect of normal and modified atmosphere packaging on shelf life of roast chicken meat. J. Food Saf. 2018, 38, e12493. [Google Scholar] [CrossRef]
- Bolton, D.J.; Meredith, H.; Walsh, D.; McDowell, D.A. The effect of chemical treatments in laboratory and broiler plant studies on the microbial status and shelf-life of poultry. Food Control. 2013, 36, 230–237. [Google Scholar] [CrossRef]
- Institute of Food Science and Technology. Shelf-Life of Foods: Guidelines for Its Determination and Prediction Institute of Food Science and Technology, 1st ed.; Institute of Food Science and Technology: London, UK, 1993. [Google Scholar]
- Ponce, J.; Brooks, J.C.; Legako, J.F. Chemical Characterization and Sensory Relationships of Beef M. longissimus lumborum and M. gluteus medius Steaks After Retail Display in Various Packaging Environments. Meat Muscle Biol. 2020, 44, 10481. [Google Scholar] [CrossRef]


| Method | Coefficient | Estimate | Standard Error | p-Value | 95% Confidence Intervals | |
|---|---|---|---|---|---|---|
| Lower (2.5%) | Upper (97.5%) | |||||
| Method 2 | Intercept | −0.028 | 0.035 | 0.426 | −0.099 | 0.042 |
| Slope | 1.018 | 0.007 | <0.001 | 1.004 | 1.032 | |
| Method 3 | Intercept | −0.037 | 0.081 | 0.653 | 0.085 | 0.837 |
| Slope | 1.023 | 0.016 | <0.001 | 0.991 | 1.056 | |
| Detection Methods | Detection Methods | ||
|---|---|---|---|
| Method 1 | Method 2 | Method 3 | |
| Method 1 | - | 0.305 | 0.005 |
| Method 2 | 0.305 | - | 0.002 |
| Method 3 | 0.005 | 0.002 | - |
| Season | Salmonella Presence | Row Total | |
|---|---|---|---|
| Presence | Non-Detected | ||
| Rainy a | 112 | 458 | 570 |
| Dry b | 55 | 530 | 585 |
| Column Total | 167 | 988 | 1155 |
Disclaimer/Publisher’s Note: The statements, opinions and data contained in all publications are solely those of the individual author(s) and contributor(s) and not of MDPI and/or the editor(s). MDPI and/or the editor(s) disclaim responsibility for any injury to people or property resulting from any ideas, methods, instructions or products referred to in the content. |
© 2024 by the authors. Licensee MDPI, Basel, Switzerland. This article is an open access article distributed under the terms and conditions of the Creative Commons Attribution (CC BY) license (https://creativecommons.org/licenses/by/4.0/).
Share and Cite
Vargas, D.A.; Bueno López, R.; Casas, D.E.; Osorio-Doblado, A.M.; Rodríguez, K.M.; Vargas, N.; Gragg, S.E.; Brashears, M.M.; Miller, M.F.; Sanchez-Plata, M.X. Modernization Data Analysis and Visualization for Food Safety Research Outcomes. Appl. Sci. 2024, 14, 5259. https://doi.org/10.3390/app14125259
Vargas DA, Bueno López R, Casas DE, Osorio-Doblado AM, Rodríguez KM, Vargas N, Gragg SE, Brashears MM, Miller MF, Sanchez-Plata MX. Modernization Data Analysis and Visualization for Food Safety Research Outcomes. Applied Sciences. 2024; 14(12):5259. https://doi.org/10.3390/app14125259
Chicago/Turabian StyleVargas, David A., Rossy Bueno López, Diego E. Casas, Andrea M. Osorio-Doblado, Karla M. Rodríguez, Nathaly Vargas, Sara E. Gragg, Mindy M. Brashears, Markus F. Miller, and Marcos X. Sanchez-Plata. 2024. "Modernization Data Analysis and Visualization for Food Safety Research Outcomes" Applied Sciences 14, no. 12: 5259. https://doi.org/10.3390/app14125259
APA StyleVargas, D. A., Bueno López, R., Casas, D. E., Osorio-Doblado, A. M., Rodríguez, K. M., Vargas, N., Gragg, S. E., Brashears, M. M., Miller, M. F., & Sanchez-Plata, M. X. (2024). Modernization Data Analysis and Visualization for Food Safety Research Outcomes. Applied Sciences, 14(12), 5259. https://doi.org/10.3390/app14125259