


Abstract
Global supply chain shocks and interruptions underscore the importance of supply chain nervousness (SCN). A clear understanding of nervousness in the event of a crisis allows an organization to make a good plan to deal with interruptions and future shocks. This study aims to develop a model for assessing nervousness parameters in the supply chains (SCs) by incorporating the fuzzy-FMEA theory and gray correlation approach to rank the SCN factors. The integrated model used in this study can improve the accuracy of outcomes when uncertainty exists in the SCN data. The results show that the most important nervousness factors are SC planning, visibility, stability, decision support systems, and SC flexibility. The developed SCN approach allows understanding and prioritizing SCN factors with more realistic and effective assessment. Findings offer beneficial insights for SCN prevention, and suggestions are made to identify nervousness mitigations. The outcomes of this research can be used by researchers and SC specialists to develop decision support systems.
1. Introduction
Supply chain nervousness (SCN) refers to the potential for events that negatively impact SC decisions, efficiency, and performance. Mitigating and eliminating nervousness will continue to be a major challenge in achieving long-term SC excellence. In today’s business environment, factors such as instability, uncertainty, complexity, and vagueness are significant sources of nervousness. Nervousness can arise from every activity or decision made within or along the SC. The SC’s stability is heavily dependent on nervousness management through applying proper actions and strategies.
The COVID-19 pandemic has altered business practices for the coming years, and continued development is essential for future crisis preparedness. Decision inputs, solutions, and evaluation tools are all required for continuous improvement. Making decisions necessitates revisiting global SC strategy, understanding the demand effect specific to the company, and enlisting the help of SC professionals. To preserve the stability of SCs, it is necessary to improve decision-making skills, take on analytical capabilities, as well as comprehend costs, restrictions, and business capabilities.
With SCN, making decisions is a complicated process that plays a significant role in promoting a sustainable SC. In this research, SCN is evaluated using an integrated fuzzy-FMEA–gray correlation technique. SCs confront threats such as natural disasters and government inconsistency. As a result, failure mode and effects analysis (FMEA) is used to assess SCN. In addition, a case study of a SC business demonstrates the efficacy and applicability of the proposed approach. Businesses and manufacturing industries can benefit from the current method. The proposed approach not only increases performance but also reduces the amount of nervousness imposed on long-term viability.
Existing research on SCN focuses more on two areas: MRP nervousness and the nervousness associated with schedule and planning systems in production planning; this research is often considered from a single dimension, like costs, planning processes, prediction errors, inventory management, or strategies. This, however, does not provide enough information to make proper decisions in this complex environment. The number of research papers focusing on SCN in recent years is small. Consequently, research articles published with the keywords “nervousness” and “SC” “MRP”, “demand”, “planning”, “and scheduling” are explored. Table 1 displays the key literature articles that meet the search criteria.
Table 1.
Sample of SCN-related work.
To fulfill the needs of researchers and SC managers, this paper provides the basis for assessing several types of nervousness through an integrated framework addressing potential interruptions of logistics and SC systems. There are three novelties in this paper. First, SC-related nervousness elements are identified from the perspective of the entire SC. This includes multiple aspects such as interruptions, faults, and errors because of risks, uncertainties, vulnerabilities, and SC disruptions. Second, this study examines and considers more nervousness parameters. This will help better understand and model the SCN. Third, an integrated method is developed to effectively address the several types of uncertainty that exist in the SCN assessment. A joint fuzzy-FMEA–gray correlation method is used to incorporate an effective approach to nervousness assessment.
2. Literature Review
SCs relate to many risks that can affect their profitability. The high-level risks include political nervousness, disasters, and pandemics like COVID-19 [34]. Companies are striving to cope with risks, deal with unforeseen disruptions, and increase performance in an increasingly uncertain commercial environment. Operational performance of SCs can be improved through SC integration, risk management, and information processing [35]. To deal with various risk levels, advanced strategies for sustainable risk management are essential, especially for large companies [36]. Depending on SC risk factors, aspects of integration, flexibility, and coordination can improve resilience [37].
Previous research studies used different methodologies to study SC risks; a method was introduced to manage SC risks and uncertainties by combining simulation and optimization methods to assist decision-makers find the best risk reduction strategies [38]; other researchers have analyzed the relationship between uncertainty in a company’s business environment, vulnerability to SC risks, and conditions that can mitigate such risks [39]. Organizations with high environmental uncertainty are at increased risk in terms of supply disruptions [39].
Nervousness decreases the efficiency, stability, and resilience of SC performance with potential increases in cost and unstable relationships with suppliers and customers [8]. As partners recurrently change the scheduling and size of replenishments, replenishment decisions are modified based on stochastic requirements leading to system nervousness [7]. MRP nervousness refers to the extreme fluctuations sometimes seen in future order forecasts given to suppliers [1]. Recurrent variations in production schedules, known as “nervousness”, can be very confusing, especially when implementing MRP systems. This also leads to accelerated, postponed, or canceled orders, thus affecting both the internal system and the operation of the supplier, further impacting the SC’s performance in terms of operating costs, quality control, addressing SC partners, operational flexibility, and competitiveness in the global market [4].
As globalization progresses, SC systems that require powerful planning systems are becoming more complex. The plan should consider the whole SC. This might cause nervousness and customer dissatisfaction due to multiple uncertainties in the entire SC. External causes of SC planning system nervousness and instability have been previously discussed. Internal nervousness in planning complex networks within SCs results from interactions among the planning system’s subcomponents [2]. Nervousness in the planning process increases fluctuations in supply network and demand [3]. For instance, scheduling nervousness is a major issue for manufacturers [4]. Although changing production schedules is common in order to fulfill customer demands and maintain a certain level of service, it causes nervousness and costs to rise [6].
Even though there is little research on nervousness throughout SCs, some researchers have studied SCNs from different perspectives. For example, researchers explored SCN in the MENA region using the Delphi–analytic hierarchy process (AHP) [8]. The global SCN (GSCN) sources, impact, measurements, and solutions were investigated. A framework was proposed to discuss SCN and solutions [9]. Another study developed a nervous scale that geometrically weighs future prediction errors over time; they found that short-term prediction errors have higher weights than remote prediction errors [1]. The inner nervousness of demand fulfillment was investigated [2]. The results highlight the importance of maintaining transparency regarding the internal interactions between SC networks to reduce instability. The effects of batch size, buffer stock, backorder, production capacity, and variations in the initial order in a two-echelon SC system were considered when analyzing SCNs [6]. Two kinds of nervousness—facility-based and crowd-based—were studied [7]. Nervousness cost was calculated using the inventory–management–strategy, considering static, dynamic, and static–dynamic uncertainties.
Supply and demand uncertainties are mainly due to SC interruptions. SC interruptions from unexpected events caused great economic losses. Any increase in the probability of interruption will increase business interruption and, hence, the value of insurance [40]. An interruption is a failure or change in all or part of the SC over a specific period when wholesaler and warehouse products are not enough to meet demand and are not able to deliver the product to the store at a certain time. It is essential to utilize a strategy for resilience measures for SC operations in the interrupted environment with a quantitative indicator for assessing SC resilience [41]. In the event of a long-term supply interruption, SC resilience is reduced, and the greater the demand shock, the longer the supply interruption. There are potential causes of supply interruptions, such as changes in geopolitics around the world and natural disasters. The risk of interruption is directly affected by the supply of raw constituents [42].
An interruption experienced by a node’s location can move to another node in the SC. To improve enterprise performance, proper coordination between various layers and cross-chains is recommended to deal with various nodes’ interruptions [43]. The risk of distribution in closed SC is discussed from material flow and other perspectives [44,45]. If the demand in the market is uncertain, the manufacturer’s interruption of downstream supply is a disaster for the enterprise. Using fuzzy programming to model SC interruptions, the option of selecting from multiple manufacturing centers can effectively decrease SC costs and sustain business continuity [45].
Failure mode and effects analysis (FMEA) is a structured prophylactic and multipurpose analytical method that can be used in a variety of industries, in which a team of outsourced personnel can experience potential errors, defects, and problems within a system. Then, the relative impacts are analyzed and prioritized to decide what action to take to eliminate these faults [46,47]. To evaluate the risk level in the maritime SC, a superior model is proposed based on fuzzy Bayesian networks and FMEA [48]. Risks associated with green SCs are also assessed through a fuzzy-FMEA approach [49]. On the other hand, FMEA is used to identify, analyze, and assess product deletion risk in the SC and propose its impact on managing risk in dynamic industry scenarios. FMEA is utilized to identify, analyze, and assess product deletion risk in the SC and suggest its impact on managing risks in dynamic business scenarios [50]. The MOORA-FMEA-based model is proposed for selecting sustainable suppliers with insights into volume discounts, disasters, and governmental changes [51]. FMEA and fuzzy-VIKOR are used to explore risks in the food grain SC and suggest risk mitigation classifications to support decision-making [52]. The FMEA technique is employed to effectively analyze the security of gas station SC systems [53]. A comparative study of risk management strategies was conducted by incorporating FMEA with the hybrid AHP-PROMETHEE procedure to assess suppliers in an SC risk-based environment [54]. Firms can mitigate SC risks through proper utilization of FMEA in supplier selection [55]. Moreover, the integrated multi-criteria analysis–Saaty method joined with FMEA is proposed to identify and evaluate the related logistics chain constraints [56].
The gray theory involves using known and unknown information. A gray theory is suitable for assessing SC risks as it can correctly and effectively define and monitor performance and the laws of evolution [57]. The weighting technique and gray theory are effective methods for SC risk assessment [41]. By combining the fuzzy theory and gray theory, it is possible to calculate the degree of correlation of each vulnerability index and improve the target of SC vulnerability [58].
The fuzzy arithmetic operation approach provides an acceptable fuzzy spread for analyzing fuzzy interconnection. Using this method, decision-makers usually want to accurately estimate uncertain influencing aspects in uncertain environments [59]. The fuzzy-AHP method is proposed to determine the local and global weights to evaluate alternatives [60]. The fuzzy-AFDEMATEL model is constructed to deal with potential fuzziness that exists in sustainable SC management (SCM) systems [61]. A fuzzy-based model is offered for SC design and network resilience evaluation and analysis [59]. An integrated model composed of fuzzy-DEMATEL and ANP is proposed to prioritize food SC performance measures [62].
Given the cost and quality of SC, the crisis requires rapid decision-making in complex and vague environments [63]. Companies should improve the decision-making process and assist SC managers in choosing solutions depending on their significance and effect on business. SCs need to continue to use technology to withstand future risks and interruptions [64], consider the SC vulnerable and vulnerability drivers [65], and secure supply in crises like the COVID-19 pandemic situation [66].
To fill the gap in previous studies, this research first explores the SCN parameters and then proposes the integrated fuzzy-FMEA–gray correlation approach to rank the SCN-related factors based on their impact and priorities. This can be attained by the inclusion of important SC system nervousness parameters. The suggested nervousness assessment methodology consistently processes diverse types of information from multiple sources, whether it is quantitative or qualitative, to address nervousness input uncertainties. It can offer accurate results while maintaining a certain level of easiness and acceptable operation simplicity.
3. Research Methodology
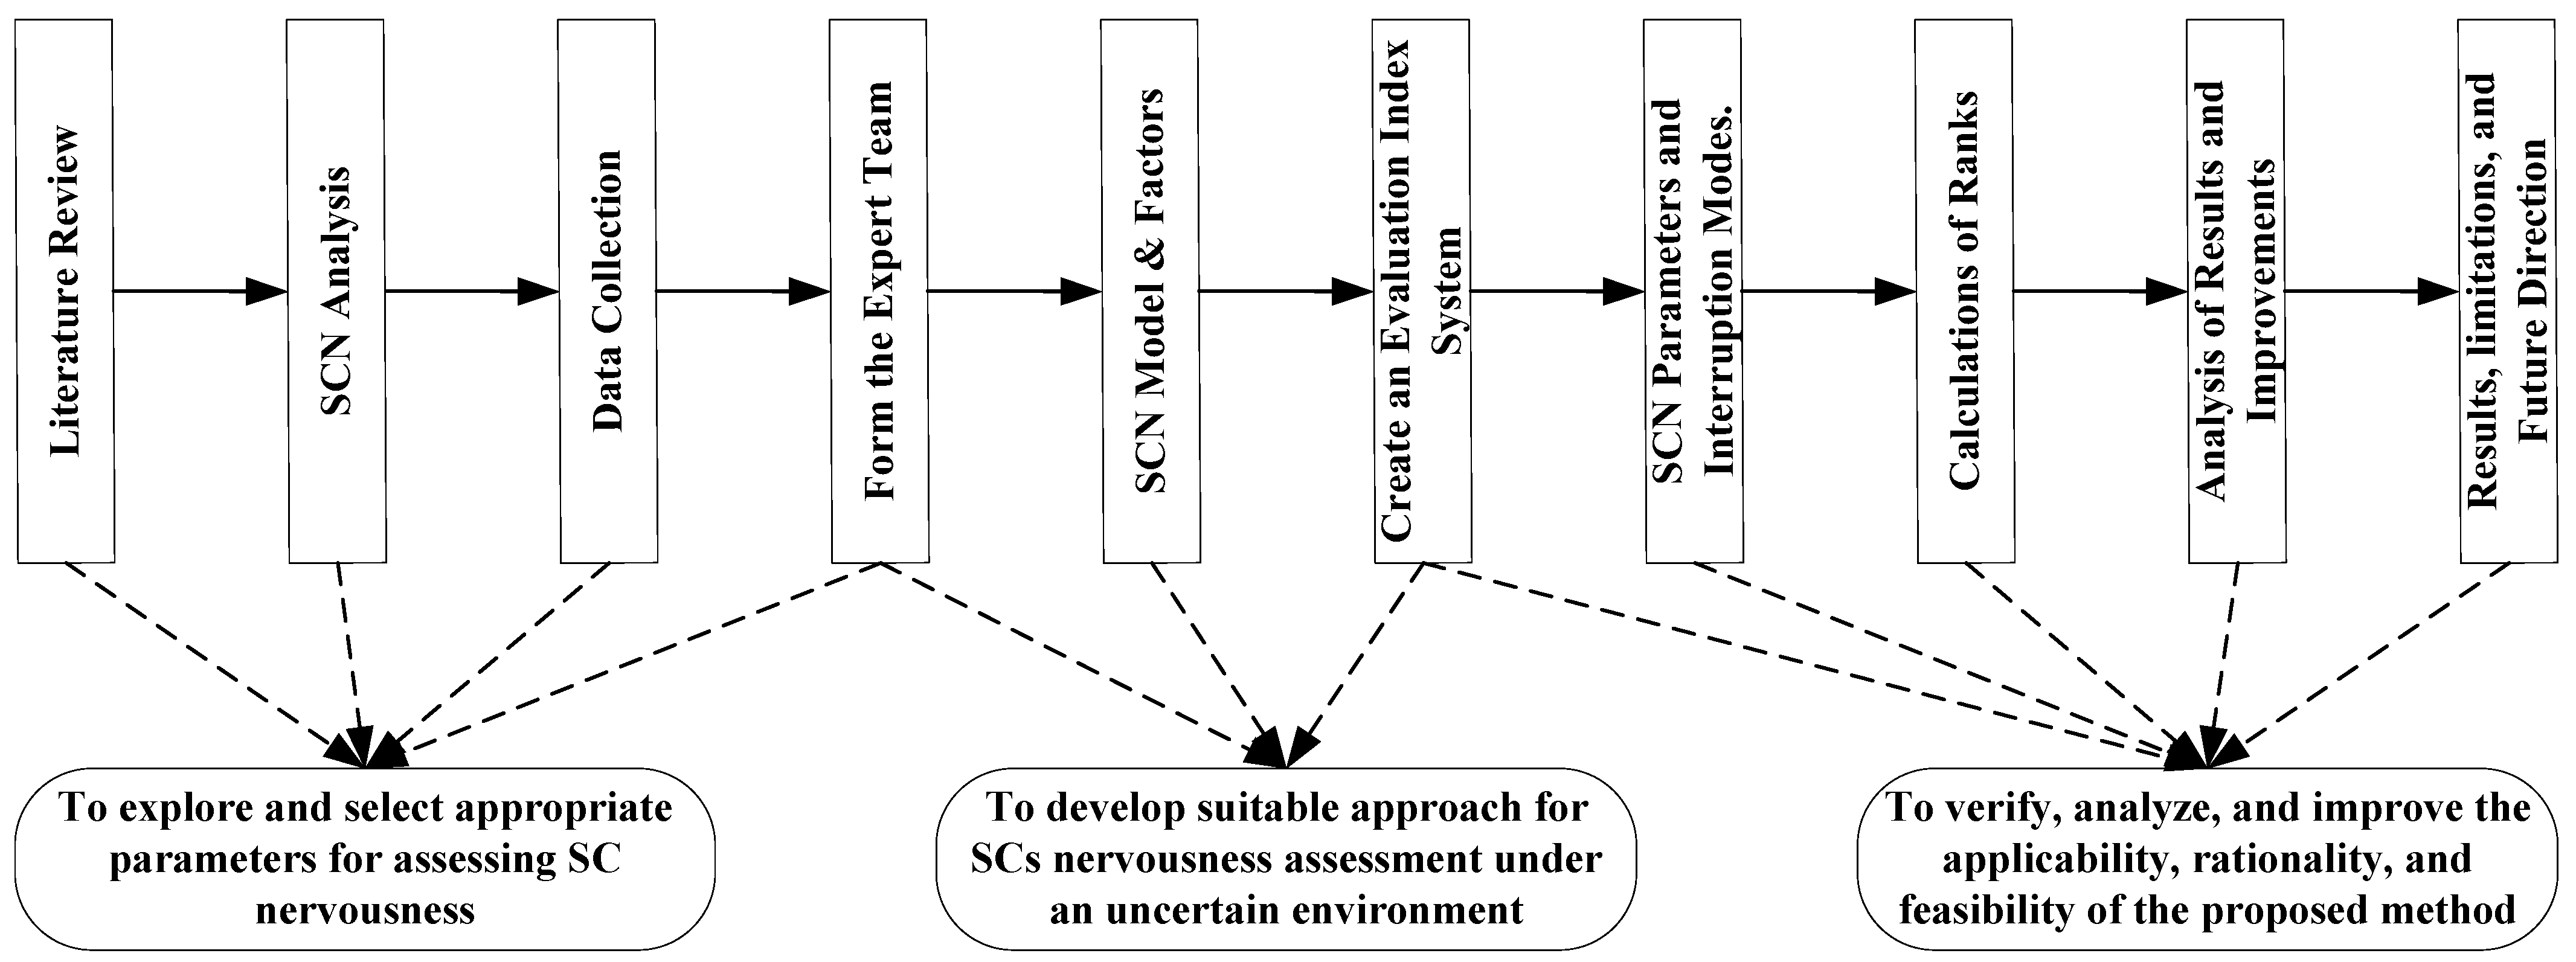
Multiple elements affect SCN and these elements can be interrelated. Therefore, there is a need for a systematic methodology to evaluate nervousness given the inherent complexities. The FMEA method is a widely used technique in industries because of its effectiveness in the assessments of safety and reliability. FMEA, the gray correlative approach, as well as fuzzy theory, can be integrated to assess, prioritize, and rank SCN parameters [58]. The proposed method has ten main components as shown in Figure 1.
Figure 1.
SCN methodology and major steps.
Interruption modes and risk priority numbers (RPNs) are determined using FMEA to identify nervousness priority. Such priority values are derived through expert judgments, which may be prone to biases, resulting in an inaccuracy in the SCN assessment process. Fuzzy logic is integrated into traditional FMEA in this study to solve the problem of assigning risk (nervousness) priority numbers.
3.1. Assessment of SCN
SCN is affected by threats like the COVID-19 pandemic, trade war, terrorism activities, partners’ bankruptcy, and suppliers’ capability. The COVID-19 pandemic reveals the nervousness of global SCs. Efficiency is the main driver of SCs with little focus on nervousness understanding and mitigations. SC is studied and analyzed in terms of errors and failures using the reviewed literature and collected surveys. This is to identify interruptions, errors, and faults that could lead to nervousness in the SC. A total of eleven experts with experience in SC participated in SCN assessment. They identify SCN’s main strategies (main factors) as follows: planning, visibility, stability, decision support systems (DSS), and flexibility. Table 2 shows the three layers of decomposition and the SCN evaluation index.
Table 2.
Valuation index and interruption of mean analysis.
3.2. SCN Model
The integrated fuzzy-FMEA–gray correlation approach is used to rank the SCN factors based on their impacts and priorities. The proposed integrated FMEA model described in [58,67] is applied in this study to analyze the nervousness modes estimation as follows:
Step 1: Forming a rating index system. Based on Table 2, the following sets are defined:
Step 2: Defining the evaluation sets as shown in Table 3. The evaluation is based on seven semantic items: extremely unlikely (EU), very unlikely (VU), unlikely (UL), neutral (NE), likely (LK), very likely (VL), and extremely likely (EL). The experts give fuzzy scores for the semantic elements. Then, each interruption failure mode is given a semantic value for each measure of severity (Se), occurrence (Oc), and detection (De).
Table 3.
The corresponding denotation of semantic elements.
Let be the set of the semantic elements and be the triangular fuzzy evaluation of the semantic value given by expert . Then, represent the weighted fuzzy evaluations on semantic value . can be obtained by means of the following equations:
where is a weight given to reflect the importance of evaluation made by expert .
The following formula [68] is used for the defuzzification process to obtain the clear number or the crisp value of semantic element :
where and are numbers identified based on the triangular fuzzy values , , and , such that and indicate how large is relative to and , respectively.
Step 3: Forming the FMEA and level of nervousness. The weights of the elements of levels I, II, and III (interruption modes), denoted by , , , respectively, are calculated as the average values, such that we have the following:
where , , and are the weights given by expert , on elements of sets , , and , respectively.
The above weights are used to calculate the RPN’s coefficient of each interruption failure mode, , as follows:
Then the RPN number of each failure mode, , can be represented as a weighted RPN, as follows:
where , , and are the average crisp values of Se, Oc, and De, respectively, given for failure mode . Se, Oc, and De for each failure mode is assessed by each expert using one of the semantic elements. Then, the average of all assessments, i.e., the average crisp values, are used to calculate the values of , , and .
Step 4: Calculating the gray correlations and ranking. Define and as the comparison and reference matrices, respectively. In matrix, the evaluations of Se, Oc, and De are listed with the corresponding interruption failure mode. These evaluations are benchmarked to the corresponding ratings in the reference matrix . Usually, the elements of should be either the best or the worst ratings, i.e., UL or EL. In this study, EL is used as the benchmark.
Let be the difference matrix, such that
where and denote the number of rows and columns, respectively, in the matrix . Therefore is equal to the number of interruption failure modes, and represent the columns of Se, Oc, and De, respectively. The gray correlation coefficients correspond to matrix are calculated using the following equation:
where , , and are the gray correlation coefficients of Se, Oc, and De of failure mode , respectively. is and usually equals to 0.5.
Considering the influences of Se, Oc, De, the degree of correlation of each failure mode,, is calculated using the following equation [69]:
where , and , , and are the importance weights of , , and of failure mode , respectively.
The last step is to rank the interruption failure modes based on their correlation grades. The degree of correlation (or correlation grade) of each interruption mode, , can be calculated as follows:
Also, elements of levels I and II in Table 2 can be ranked based on their correlation grades as follows:
where and are the correlation grades that correspond to each element in sets and , respectively.
4. Illustrative Application of the SCN Model
Recently, organizations have started to pay greater attention to the nervousness of the SC because of the impact of disruptions and crises like COVID-19. As a result of the complication in the SCs, an integrated FMEA approach is used to evaluate the SCN. Due to the difficulties of obtaining accurate elements, the semantic variables are utilized to score the interruption modes. The FMEA evaluation team, called the expert team, consists of eleven multifunctional evaluation members, and is mainly asked for scoring and evaluation. The expert team comprises industry, academic, and SC specialists, who are aware of SC disruptions, interruptions, fears, and risks. The expert team should score the weights of each factor between 0 and 1. The total weights of the elements in a process must equal one. For instance, the sum of weights of P, V, S, D, and F must equal one; the total weights of V1, V2, and V3 must also equal one, as should the sum of the weights of V1I1 and V1I2. Furthermore, the total weights of related severity, occurrence, and detection for each level III element must equal one.
Each expert can select one of the seven semantic levels, EU, VU, UL, NE, LK, VL, and EL for the three items Se, Oc, and De. Due to the diverse experiences and different backgrounds of the experts, their importance and skills are also dissimilar. For these reasons, an important weight is given as follows to each expert: 0.15, 0.14, 0.11, 0.097, 0.089, 0.086, 0.078, 0.077, 0.066, 0.059, and 0.048. To check the effectiveness of the construction index and the scoring results, the experts’ team is asked to re-evaluate and approve the scoring results after summarizing their results.
To establish a rating index system, a thorough initial evaluation with a total of 30 factors from the third layer and 15 factors from the second layer are selected. The expert team receives questionnaires to determine the most important variables. After that, the experts summarize a series of nervousness rating index systems for SCs. The index system is then presented to the same team for model validation. The final most suitable index system for the SCN is shown in Table 2.
Then, the fuzzy evaluation set is established to obtain clear numbers of the corresponding fuzzy semantic elements. The experts’ team evaluates the fuzzy decision of each interruption type. Table 4 lists the expert ratings based on triangular fuzzy numbers (TFNs).
Table 4.
TFN expert scores for semantic evaluation.
Using Equation (1) and the values given in Table 4, the weighted crisp values can be computed from fuzzy semantics, as shown in Table 5.
Table 5.
Crisp values of the semantic items.
Next, the FEMA and the weighting tables are prepared. Furthermore, the FEMA classifications and weights for all SCN levels are listed. A sample of calculations of Se evaluations for interruption failure modes of factor P is illustrated in Table 6, whereas Table 7 displays the weights of the SCN model’s elements.
Table 6.
Experts’ Se scoring for failure modes of factor P.
Table 7.
Sets of weights of SCN’s model.
In Table 8, the crisp values of Se, Oc, and De of each failure mode are listed. These values are used for constructing the comparison matrix in order to calculate the gray correlation coefficients of each failure mode, . Based on the calculated values of and the values of , ranking the level I, II, and III factors are determined based on the computed gray correlation grades , , and , as displayed in Table 9.
Table 8.
Comparison matrix elements.
Table 9.
Nervousness element ranking based on the FMEA–gray correlation approach.
Discussion
As shown in Table 9, the ranks of the five main elements are SC planning, visibility, stability, DSSs, and SC flexibility. The nervousness of SC is mainly reflected in three aspects: SC’s future planning, stability of the sources and destinations, and the availability of the right DSS. The risk of planning is the highest; therefore, SC managers should pay great attention to supply, demand, and risk planning. Planning is the main strategy that helps mitigate the impact of SCN. The most important interruptions in demand include low satisfaction and oversupply of inventories, while the main interruptions to the supply are increased disruption and government intervention, but the basic nervousness factors for interruptions are increased vulnerability and the occurrence of security issues. The second source element rank is SC visibility. Cooperation with SC partners, integration at all levels, and communication with employees within the chain are considered to be the most important visibility strategies that can undermine SCN. The most important interruptions in cooperation include reduced transparency and increased competitiveness of partners. However, the main sources of turmoil in SC integration are the lack of consistent decision-making, trust, and motivation. Instead, the lack of information exchange and low employee trust are the basic causes of communication interruptions.
SC stability, as it is ranked third, is one of the key policies to mitigate SCN through appropriate disaster recovery policies, plans, systems, and government support, as well as stable roles and regulations. Major policy interruptions include a lack of product and process prioritization and design changes. While the main disruptions in SC disaster recovery are supply and demand discrepancies and long recovery times, regulatory compliance issues and government policy changes are the most important causes of unstable aspects and disruptors of regulations. The fourth rank goes to the SC’s DSS. One of the key strategies for dealing with SCN is the use of DSSs, especially with the development of technology and information systems. The success of DSS depends on technical-expertise capabilities and availability, powerful tools that fit the company’s SC system, and the use of technology in the company. The main disruption to professional capability stems from the lack of different skills and specialized skills. However, the main slipup in powerful SC tools stems from the selection of the right tools and criteria, process mapping, and flow issues. Technology constraints, implementations, digital transformations, and SC transformations, on the other hand, are the most important sources of technology interruptions. SC flexibility, which represents the SC’s ability to adapt to changes, ranks fifth. Situational awareness, SC resilience, and innovation are considered to be key strategies for increasing SC flexibility and thereby reducing nervousness. The main interruptions to awareness include a lack of tendency to situational awareness and a lack of understandable and sustainable awareness. Alternatively, the main disruptions to SC resilience include a lack of resilience, recovery, redundant systems and plans, and unexpected changes, especially external changes. In comparison, the most important factors contributing to the disruption of innovation include responding slowly to innovation, digital transformation, and the adoption of major changes.
COVID-19 has severely disrupted SCs around the world. GSC managers need to maintain business operations, meet urgent requirements, and mitigate supplier challenges in the face of significant disruption. Initial efforts focus on managing supply interruptions and readjusting SCs to account for supply network constraints. Now, more focus should be directed toward securing supply bases and building resilience for the future. This approach helps in dealing with the SCN as well as in building a stronger, more resilient, and flexible company that is ready to succeed when the economy grows again. The GSC needs to make the planning process more important, requiring accurate strategic planning and effective GSCN mitigation systems.
5. Conclusions
During pandemic events, a clear understanding of SCNs can help organizations create the right plans to deal with interruptions and future disruptions. New technologies enable SC decision-makers to establish tools to explore potential risks and provide corrective action plans. Organizations that consider SCN will have better opportunities to identify the impacts of disruptions and risky events on their SCs, providing an opportunity to evaluate and respond to threatening circumstances.
The complexity of GSC systems and the uncertainty of different types of nervousness necessitate the need to create flexible and effective ways to assess SCNs. In this research, an integrated fuzzy-FMEA–gray correlation approach is applied to model and rank the SCN’s factors. The results reveal that planning followed by visibility, stability, DSSs, and SC flexibility should be the primary focus when considering the SCN. The outcomes show contributions to identifying factors that can be used to understand and prioritize SCN elements. The findings can be utilized by researchers, SC specialists, and practitioners for the development of DSSs. Also, the results may be utilized to construct a nervousness mitigation strategy for better SC resilience.
There are several shortcomings in this work as well. First, the main informants come from different businesses. The experts from different industries may have different perspectives, which could affect the obtained results. Second, this study is based on the experts’ assessment and qualities without considering their risk attitudes. Third, thirty interruption modes are considered in this study. However, further failure modes can be studied. Although the selected case is demonstrative, information from other worldwide SC businesses located in other locations will assist in increasing the generality of the results. The applied approach can be extended to other industries in the future to prove its feasibility in a broader context. Additional research can focus on assessing nervousness solution plans.
Author Contributions
Conceptualization, G.M.M. and A.A.M.; Methodology, A.A.M., S.F.O. and M.Z.M.; Validation, G.M.M., A.A.M. and M.Z.M.; Investigation, G.M.M., S.F.O. and M.Z.M.; Writing—original draft, A.A.M., S.F.O. and M.Z.M.; Writing—review & editing, G.M.M.; Visualization, S.F.O. and M.Z.M. All authors have read and agreed to the published version of the manuscript.
Funding
This research received no external funding.
Data Availability Statement
The original contributions presented in the study are included in the article, further inquiries can be directed to the corresponding author.
Conflicts of Interest
The authors declare no conflicts of interest.
References
- Li, Q.; Disney, S.M. Revisiting Rescheduling: MRP Nervousness and the Bullwhip Effect. Int. J. Prod. Res. 2016, 55, 1992–2012. [Google Scholar] [CrossRef] [Scilit]
- Mousavi, B.A.; Azzouz, R.; Heavey, C.; Ehm, H. MRP analysis of the nervousness within semiconductors supply chain planning: Insight from a case study. In Proceedings of the Winter Simulation Conference (WSC), National Harbor, MD, USA, 8–11 December 2019; pp. 2396–2407. [Google Scholar]
- Kaipia, R.; Korhonen, H.; Hartiala, H. Planning nervousness in a demand supply network: An empirical study. Int. J. Logist. Manag. 2006, 17, 95–113. [Google Scholar] [CrossRef] [Scilit]
- Law KM, Y.; Gunasekaran, A. A comparative study of schedule nervousness among high-tech manufacturers across the straits. Int. J. Prod. Res. 2010, 48, 6015–6036. [Google Scholar] [CrossRef] [Scilit]
- Maryanto, M.; Zendrato, R.; Wicaksana, B. Reduction of Supply Chain Nervousness with Vendor Managed Inventory Approach. Tekinfo|Sci. J. Ind. Inf. Eng. 2012, 1, 1–11. [Google Scholar]
- Wangsa, I.D.; Iskandar, B. Pengembangan Model Consignment Stock pada Sistem Rantai Pasok Dua Eselon dengan Permintaan Berfluktuasi dan Perubahan Order Awal. J. Tek. Ind. 2013, 15, 1–12. [Google Scholar] [CrossRef] [Scilit]
- Tunc, H.; Kilic, O.A.; Tarim, S.A.; Eksioglu, B. A simple approach for assessing the cost of system nervousness. Int. J. Prod. Econ. 2013, 141, 619–625. [Google Scholar] [CrossRef] [Scilit]
- Magableh, G.M.; Mistarihi, M.Z. Causes and Effects of Supply Chain Nervousness: Mena case study. Acta Logist. 2022, 9, 223–235. [Google Scholar] [CrossRef] [Scilit]
- Magableh, G.M.; Mistarihi, M.Z. Global Supply Chain Nervousness (GSCN). Sustainability 2023, 15, 12115. [Google Scholar] [CrossRef] [Scilit]
- Kropp, D.H.; Carlson, R.C. Lot-Sizing Algorithm for Reducing Nervousness in MRP Systems. Manag. Sci. 1984, 30, 240–244. [Google Scholar] [CrossRef] [Scilit]
- Ho, C.J.; Ireland, T.C. Correlating MRP system nervousness with forecast errors. Int. J. Prod. Res. 1998, 36, 2285–2299. [Google Scholar] [CrossRef] [Scilit]
- Kropp, D.H.; College, D.; Carlson, R.C.; Jucker, J.V. Concepts, Theories, and Techniques Heuristic Lot-Sizing Approaches for Dealing with MRP System Nervousness. Decis. Sci. 1983, 14, 156–169. [Google Scholar] [CrossRef] [Scilit]
- Ho, C.J. Evaluating the impact of operating environments on MRP system nervousness. Int. J. Prod. Res. 1989, 27, 1115–1135. [Google Scholar] [CrossRef] [Scilit]
- Blackburn, J.D.; Kropp, D.H.; Millen, R.A. MRP System Nervousness: Causes and Cures. Eng. Costs Prod. Econ. 1985, 9, 141–146. [Google Scholar] [CrossRef] [Scilit]
- Blackburn, J.D.; Kropp, D.H.; Millen, R.A. Comparison of Strategies to Dampen Nervousness in MRP Systems. Manag. Sci. 1986, 32, 413–429. [Google Scholar] [CrossRef] [Scilit]
- Ho, C.J. Evaluating dampening effects of alternative lot-sizing rules to reduce MRP system nervousness. Int. J. Prod. Res. 2002, 40, 2633–2652. [Google Scholar] [CrossRef] [Scilit]
- Ho, C.J.; Carter, P.L. An investigation of alternative dampening procedures to cope with MRP system nervousness. Int. J. Prod. Res. 1996, 34, 137–156. [Google Scholar] [CrossRef] [Scilit]
- Ho, C.J.; Ho SJ, K. Evaluating the effectiveness of using lot-sizing rules to cope with MRP system nervousness. Prod. Plan. Control 1999, 10, 150–161. [Google Scholar] [CrossRef] [Scilit]
- Ho, C.J.; Ireland, T.C. A diagnostic analysis of the impact of forecast errors on production planning via MRP system nervousness. Prod. Plan. Control 1993, 4, 311–322. [Google Scholar] [CrossRef] [Scilit]
- Ho, C.-J.; Narasimhan, R.; Melnyk, S.A.; Carter, P.L. Research Framework for Investigating the Effectiveness of Dampening Procedures to Cope with MRP System Nervousness. Int. J. Oper. Prod. Manag. 1992, 12, 30–43. [Google Scholar] [CrossRef] [Scilit]
- Braun, M.W.; Schwartz, J.D. A control theoretic evaluation of schedule nervousness suppression techniques for master production scheduling. In Decision Policies for Production Networks; Springer: London, UK, 2012; pp. 143–171. [Google Scholar]
- Ave, G.D.; Alici, M.; Harjunkoski, I.; Engell, S. An Explicit Online Resource-Task Network Scheduling Formulation to Avoid Scheduling Nervousness. In Computer Aided Chemical Engineering; Elsevier B.V.: Amsterdam, The Netherlands, 2019; Volume 46, pp. 61–66. [Google Scholar] [CrossRef] [Scilit]
- Hasachoo, N.; Masuchun, R. Reducing Schedule Nervousness in Production and Operations Under Non-Stationary Stochastic Demand: The Case of an Airline Catering Company. In Proceedings of the IEEM2016: 2016 International Conference on Industrial Engineering and Engineering Management, Bali, Indonesia, 4–7 December 2016; pp. 941–946. [Google Scholar]
- Pujawan, I.N. Schedule nervousness in a manufacturing system: A case study. Prod. Plan. Control 2004, 15, 515–524. [Google Scholar] [CrossRef] [Scilit]
- Kadipasaoglu, S.N.; Sridharan, V. Alternative approaches for reducing schedule instability in multistage manufacturing under demand uncertainty. J. Oper. Manag. 1995, 13, 193–211. [Google Scholar] [CrossRef] [Scilit]
- Inderfurth, K. Nervousness in inventory control: Analytical results. OR Spektrum 1994, 16, 113–123. [Google Scholar] [CrossRef] [Scilit]
- Atadeniz, S.N.; Sridharan, S.V. Effectiveness of nervousness reduction policies when capacity is constrained. Int. J. Prod. Res. 2020, 58, 4121–4137. [Google Scholar] [CrossRef] [Scilit]
- Herrera, C.; Thomas, A. Simulation of less master production schedule nervousness model Simulation of less master production schedule nervousness model Simulation of Less Master Production Schedule Nervousness Model. IFAC Proc. 2009, 42, 1585–1590. [Google Scholar] [CrossRef] [Scilit]
- Roberta Minifie, J.; Davis, R.A. Interaction effects on MRP nervousness. Int. J. Prod. Res. 1990, 28, 173–183. [Google Scholar] [CrossRef] [Scilit]
- Carlson, R.C.; Jucker, J.V.; Kropp, D.H. Less Nervous MRP Systems: A Dynamic Economic Lot-Sizing Approach. Manag. Sci. 1979, 25, 754–761. [Google Scholar] [CrossRef] [Scilit]
- Koca, E.; Yaman, H.; Aktürk, M.S. Stochastic lot sizing problem with nervousness considerations. Comput. Oper. Res. 2018, 94, 23–37. [Google Scholar] [CrossRef] [Scilit]
- Mistarihi, M.; Magableh, G. Unveiling Supply Chain Nervousness: A Strategic Framework for Disruption Management under Fuzzy Environment. Sustainability 2023, 15, 11179. [Google Scholar] [CrossRef] [Scilit]
- Mistarihi, M.; Magableh, G. Supply Chain Nervousness Optimization using Fuzzy-ELECTRE Technique. In Proceedings of the International Conference On Mechanical, Industrial and Production Engineering—(ICMIPE-23), Davanagere, India, 30 April 2023. [Google Scholar]
- Shanker, S.; Sharma, H.; Barve, A. Assessment of risks associated with third-party logistics in restaurant supply chain. Benchmarking 2021, 28, 2432–2464. [Google Scholar] [CrossRef] [Scilit]
- Munir, M.; Jajja, M.S.S.; Chatha, K.A.; Farooq, S. Supply chain risk management and operational performance: The enabling role of supply chain integration. Int. J. Prod. Econ. 2020, 227, 107667. [Google Scholar] [CrossRef] [Scilit]
- Abdel-Basset, M.; Mohamed, R. A novel plithogenic TOPSIS-CRITIC model for sustainable supply chain risk management. J. Clean. Prod. 2020, 247, 119586. [Google Scholar] [CrossRef] [Scilit]
- Brusset, X.; Teller, C. Supply Chain Capabilities, Risks, and Resilience. Int. J. Prod. Econ. 2016, 184, 59–68. [Google Scholar] [CrossRef] [Scilit]
- Aqlan, F.; Lam, S.S. Supply chain optimization under risk and uncertainty: A case study for high-end server manufacturing. Comput. Ind. Eng. 2016, 93, 78–87. [Google Scholar] [CrossRef] [Scilit]
- Sreedevi, R.; Saranga, H. Uncertainty and supply chain risk: The moderating role of supply chain flexibility in risk mitigation. Int. J. Prod. Econ. 2017, 193, 332–342. [Google Scholar] [CrossRef] [Scilit]
- Yu, R.; Wu, Z.; Qu, S. Optimal Strategy of Supply Chain considering Interruption Insurance. Complexity 2021, 2021, 1–11. [Google Scholar] [CrossRef] [Scilit]
- Linqiao, Y.; Xuedong, L.; Fumin, D.; Zhaoxia, G. Risk Assessment of Supply Chain Based on Combination Weighting Method and Grey Theory. In Proceedings of the 2015 IEEE IEEM, Singapore, 6–9 December 2015; pp. 895–899. [Google Scholar]
- Shao, L.; Jin, S. Resilience assessment of the lithium supply chain in China under impact of new energy vehicles and supply interruption. J. Clean. Prod. 2020, 252, 119624. [Google Scholar] [CrossRef] [Scilit]
- Zhang, Q.; Fan, W.; Lu, J.; Wu, S.; Wang, X. Research on dynamic analysis and mitigation strategies of supply chains under different disruption risks. Sustainability 2021, 13, 2462. [Google Scholar] [CrossRef] [Scilit]
- Duan, W.; Ma, H.; Xu, D.S. Analysis of the impact of covid-19 on the coupling of the material flow and capital flow in a closed-loop supply chain. Adv. Prod. Eng. Manag. 2021, 16, 5–22. [Google Scholar] [CrossRef] [Scilit]
- Guo, H.; Wang, S.; Zhang, Y. Supply interruption supply chain network model with uncertain demand: An application of chance-constrained programming with fuzzy parameters. Discret. Dyn. Nat. Soc. 2021, 2021, 6686992. [Google Scholar] [CrossRef] [Scilit]
- Dudek-Burlikowska, M. Monitoring of the production processing in a metallurgical company using FMEA method. Arch. Metall. Mater. 2017, 62, 2089–2094. [Google Scholar] [CrossRef] [Scilit]
- Fattahi, R.; Khalilzadeh, M. Risk evaluation using a novel hybrid method based on FMEA, extended MULTIMOORA, and AHP methods under fuzzy environment. Saf. Sci. 2018, 102, 290–300. [Google Scholar] [CrossRef] [Scilit]
- Wan, C.; Yan, X.; Zhang, D.; Qu, Z.; Yang, Z. An advanced fuzzy Bayesian-based FMEA approach for assessing maritime supply chain risks. Transportation Research Part E: Logistics and Transportation Review LJMU Research Online An advanced fuzzy Bayesian-based FMEA approach for assessing maritime supply chain risks. Transp. Res. Part E-Logist. Transp. Rev. 2019, 125, 222–240. [Google Scholar] [CrossRef] [Scilit]
- Mangla, S.K.; Luthra, S.; Jakhar, S. Benchmarking the risk assessment in green supply chain using fuzzy approach to FMEA: Insights from an Indian case study. Benchmarking 2018, 25, 2660–2687. [Google Scholar] [CrossRef] [Scilit]
- Zhu, Q.; Golrizgashti, S.; Sarkis, J. Product deletion and supply chain repercussions: Risk management using FMEA. Benchmarking 2021, 28, 409–437. [Google Scholar] [CrossRef] [Scilit]
- Arabsheybani, A.; Paydar, M.M.; Safaei, A.S. An integrated fuzzy MOORA method and FMEA technique for sustainable supplier selection considering quantity discounts and supplier’s risk. J. Clean. Prod. 2018, 190, 577–591. [Google Scholar] [CrossRef] [Scilit]
- Rathore, R.; Thakkar, J.J.; Jha, J.K. Evaluation of risks in foodgrains supply chain using failure mode effect analysis and fuzzy VIKOR. Int. J. Qual. Reliab. Manag. 2021, 38, 551–580. [Google Scholar] [CrossRef] [Scilit]
- Liu, Y.; Kong, Z.; Zhang, Q. Failure modes and effects analysis (FMEA) for the security of the supply chain system of the gas station in China. Ecotoxicol. Environ. Saf. 2018, 164, 325–330. [Google Scholar] [CrossRef] [Scilit] [PubMed]
- Altubaishe, B.; Clarke, J.; McWilliams, C.; Desai, S. Comparative Analysis of Risk Management Strategies for Additive Manufacturing Supply Chains. Am. J. Appl. Sci. 2019, 16, 273–282. [Google Scholar] [CrossRef] [Scilit]
- Curkovic, S.; Scannell, T.V.; Wagner, B.J.; Scannell, T.; Wagner, B. Using FMEA for Supply Chain Risk Management. Modern Manag. Sci. Eng. 2013, 1, 251–265. [Google Scholar]
- Kudláč, Š.; Štefancová, V.; Majerčák, J. Using the Saaty Method and the FMEA Method for Evaluation of Constraints in Logistics Chain. Procedia Eng. 2017, 187, 749–755. [Google Scholar] [CrossRef] [Scilit]
- Bogataj, D.; Bogataj, M. Measuring the supply chain risk and vulnerability in frequency space. Int. J. Prod. Econ. 2007, 108, 291–301. [Google Scholar] [CrossRef] [Scilit]
- Liu, J.; Liu, F.; Zhou, H.; Kong, Y. An Integrated Method of Supply Chains Vulnerability Assessment. Sci. Program. 2016, 2016, 2819238. [Google Scholar] [CrossRef] [Scilit]
- Ivanov, D.; Pavlov, A.; Dolgui, A.; Sokolov, B. Hybrid fuzzy-probabilistic approach to supply chain resilience assessment Hybrid fuzzy-probabilistic ap-proach to supply chain resilience assessment Hybrid fuzzy-probabilistic approach to supply chain resilience assessment. IEEE Trans. Eng. Manag. 2018, 65, 303–315. [Google Scholar] [CrossRef] [Scilit]
- Patidar, A.; Sharma, M.; Agrawal, R. Prioritizing drivers to creating traceability in the food supply chain. Procedia CIRP 2021, 98, 690–695. [Google Scholar] [CrossRef] [Scilit]
- Lin, K.P.; Tseng, M.L.; Pai, P.F. Sustainable supply chain management using approximate fuzzy DEMATEL method. Resour. Conserv. Recycl. 2018, 128, 134–142. [Google Scholar] [CrossRef] [Scilit]
- Sufiyan, M.; Haleem, A.; Khan, S.; Khan, M.I. Evaluating food supply chain performance using hybrid fuzzy MCDM technique. Sustain. Prod. Consum. 2019, 20, 40–57. [Google Scholar] [CrossRef] [Scilit]
- Magableh, G.M. Supply Chains and the COVID-19 Pandemic: A Comprehensive Framework. Eur. Manag. Rev. 2021, 18, 363–382. [Google Scholar] [CrossRef] [Scilit]
- Magableh, G.M.; Mistarihi, M.Z. Applications of MCDM approach (ANP-TOPSIS) to evaluate supply chain solutions in the context of COVID-19. Heliyon 2022, 8, e09062. [Google Scholar] [CrossRef] [Scilit] [PubMed]
- Yin, S.; Bai, L.; Zhang, R. Prevention schemes for future fresh agricultural products (FAPs) supply chain: Mathematical model and experience of guaranteeing the supply of FAPs during the COVID-19 pandemic. J. Sci. Food Agric. 2021, 101, 6368–6383. [Google Scholar] [CrossRef] [Scilit]
- Lahmar, A.; Galasso, F.; Chabchoub, H.; Lamothe, J. Conceptual Framework of Supply Chain Vulnerability. In Proceedings of the 6th International Conference on Information Systems, Logistics and Supply Chain, Bordeaux, France, 1–4 June 2016. [Google Scholar]
- Wang, H.; Zhang, Y.M.; Yang, Z. A risk evaluation method to prioritize failure modes based on failure data and a combination of fuzzy sets theory and grey theory. Eng. Appl. Artif. Intell. 2019, 82, 216–225. [Google Scholar] [CrossRef] [Scilit]
- Xiao, Y.; Li, H. Improvement on Judgement Matrix Based on Triangle Fuzzy Number. Fuzzy Syst. Math. 2003, 2, 011. [Google Scholar]
- Liu, L.; Liu, H.; Lin, Q. An improved FMEA using fuzzy evidential reasoning approach and grey theory. Fuzzy Syst. Math. 2011, 2, 72–80. [Google Scholar]

Disclaimer/Publisher’s Note: The statements, opinions and data contained in all publications are solely those of the individual author(s) and contributor(s) and not of MDPI and/or the editor(s). MDPI and/or the editor(s) disclaim responsibility for any injury to people or property resulting from any ideas, methods, instructions or products referred to in the content. |
© 2024 by the authors. Licensee MDPI, Basel, Switzerland. This article is an open access article distributed under the terms and conditions of the Creative Commons Attribution (CC BY) license (https://creativecommons.org/licenses/by/4.0/).