
Study on the Meso-Failure Mechanism of Granite under Real-Time High Temperature by Numerical Simulation

Abstract
1. Introduction
2. Materials and Methods
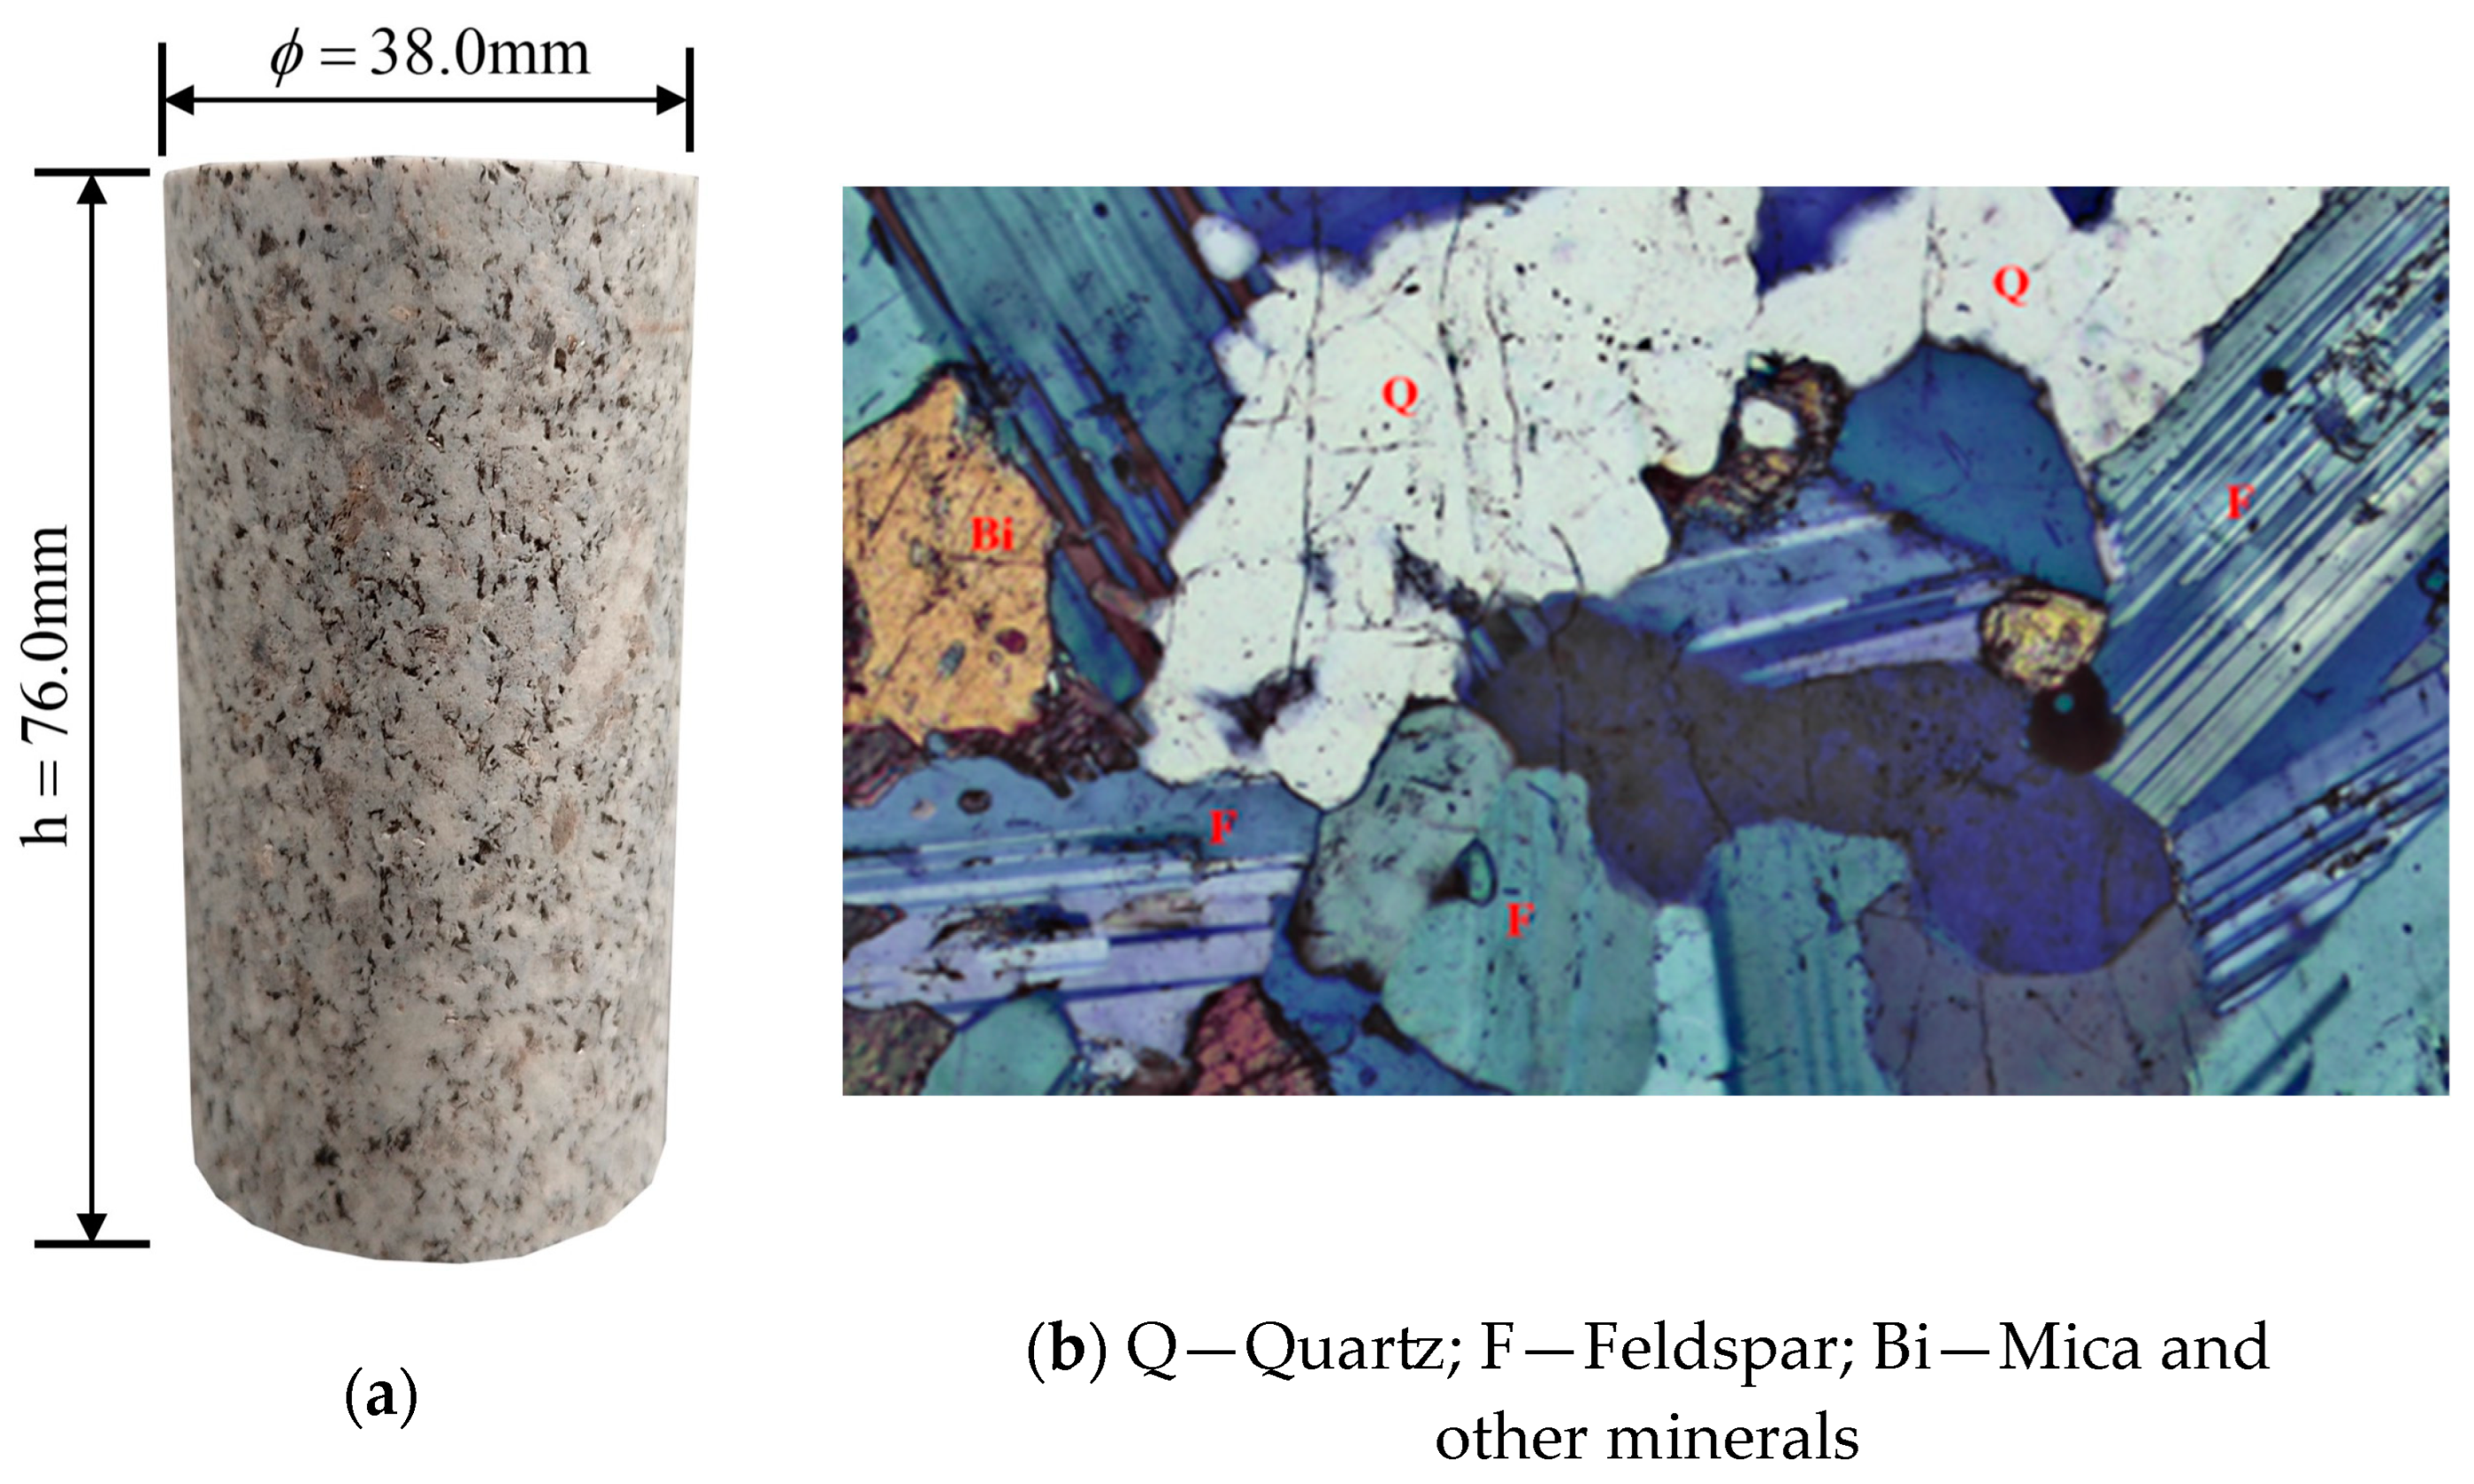
2.1. Materials
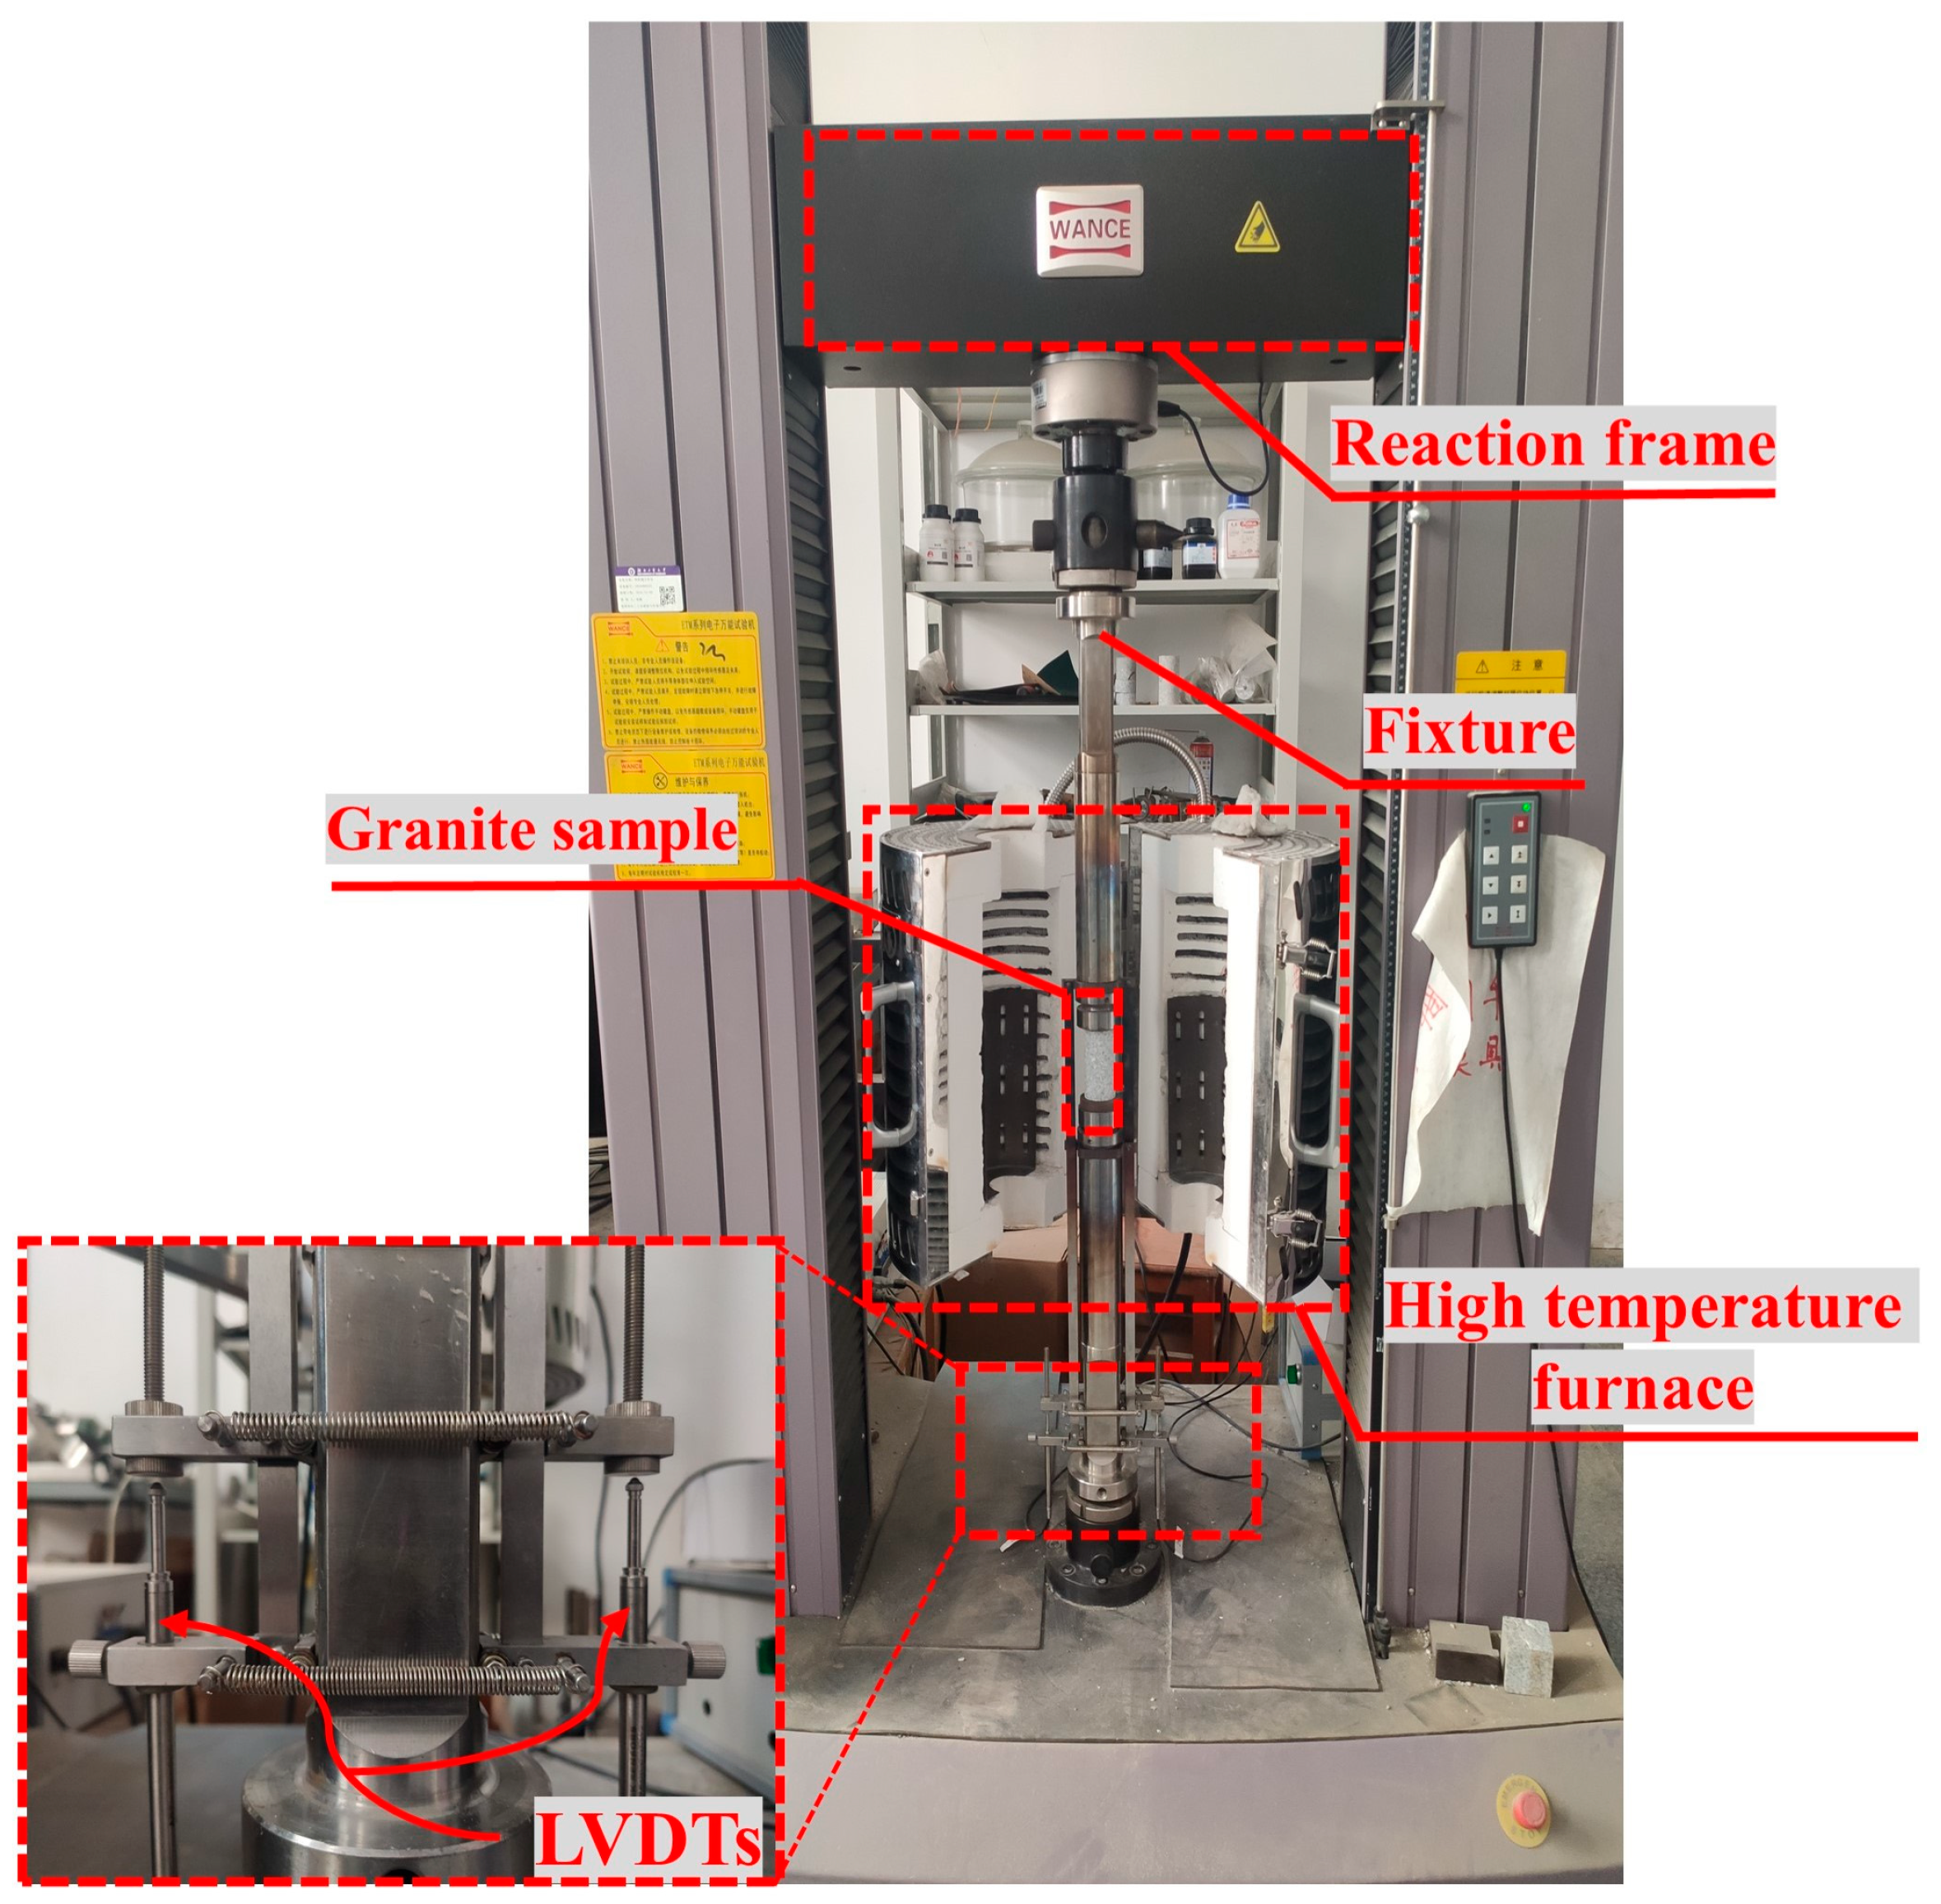
2.2. Methods
3. Modeling
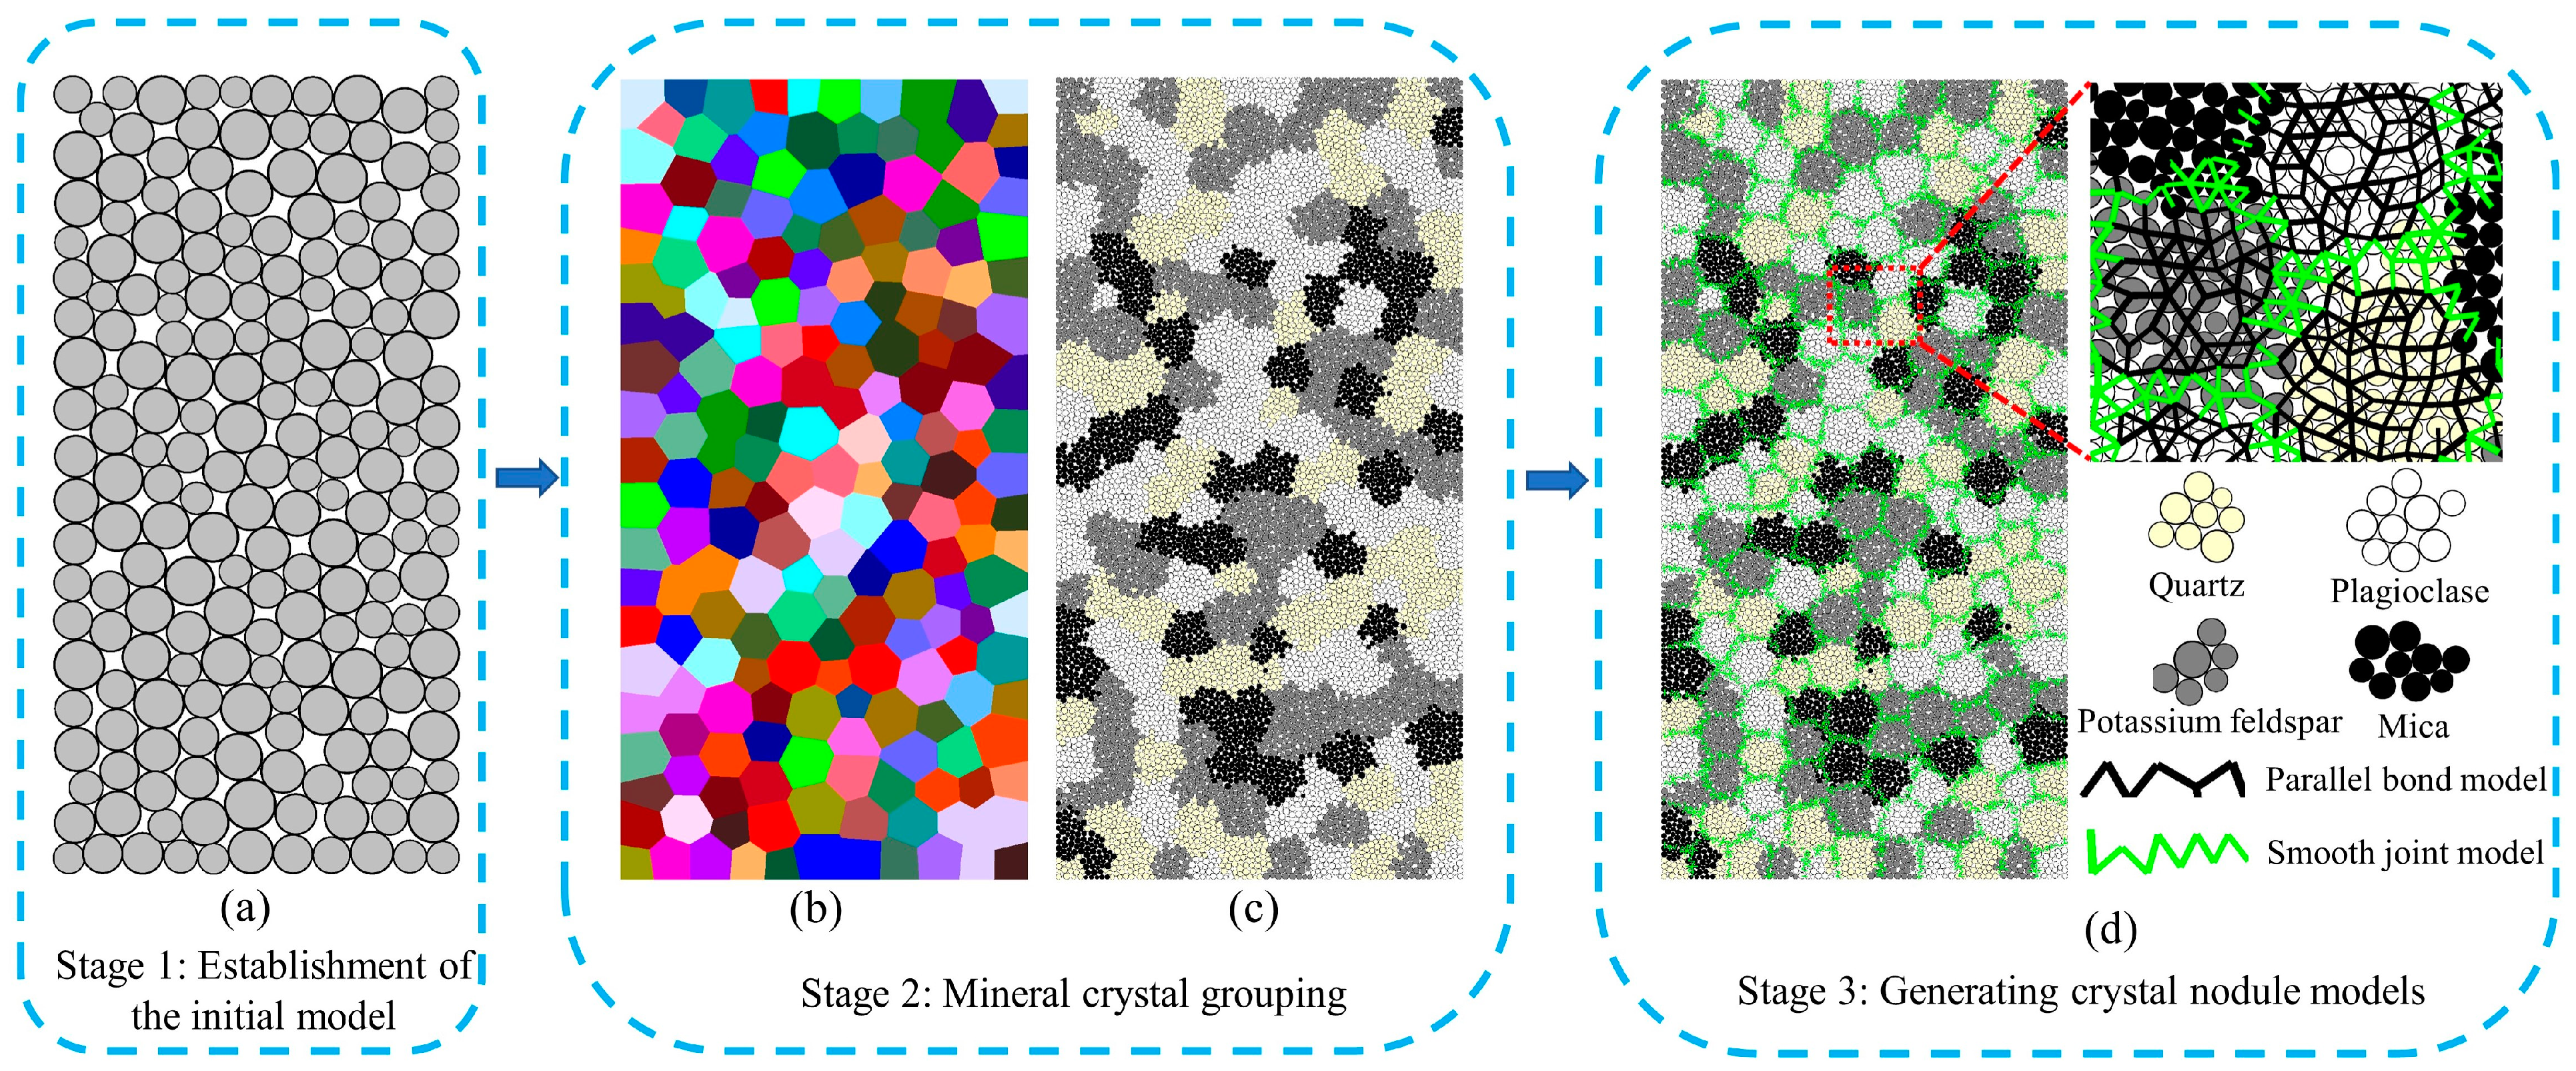
3.1. Generation Procedure of GBM
- Establishment of initial model: Based on the actual dimensions of the granite samples, an initial model of granular flow with a diameter of 38 mm and a height of 76 mm is established. Particles are randomly generated within the boundary, with radii ranging from 1.5 mm to 2.4 mm. Each particle represents an individual mineral (Figure 3a).
- Grouping of mineral crystals: The “block” unit set is constructed using the particles from the initial model (Figure 3b). Based on the results of polarized light microscopy observation (Figure 3b) and XRD analysis, the main mineral components and their respective proportions in granite are determined. The “block” unit set is grouped accordingly. The grouped “block” unit set is then transformed into a “geometry” unit set, and particle filling is performed (Figure 3c).
- Assignment of contact models: The contact model between particles inside the crystals is replaced with a parallel-bond model (PBM), and the corresponding microscopic parameters are assigned. The contact between different crystals is replaced with a smooth-joint model (SJM), and smooth-joint parameters are assigned (Figure 3d).
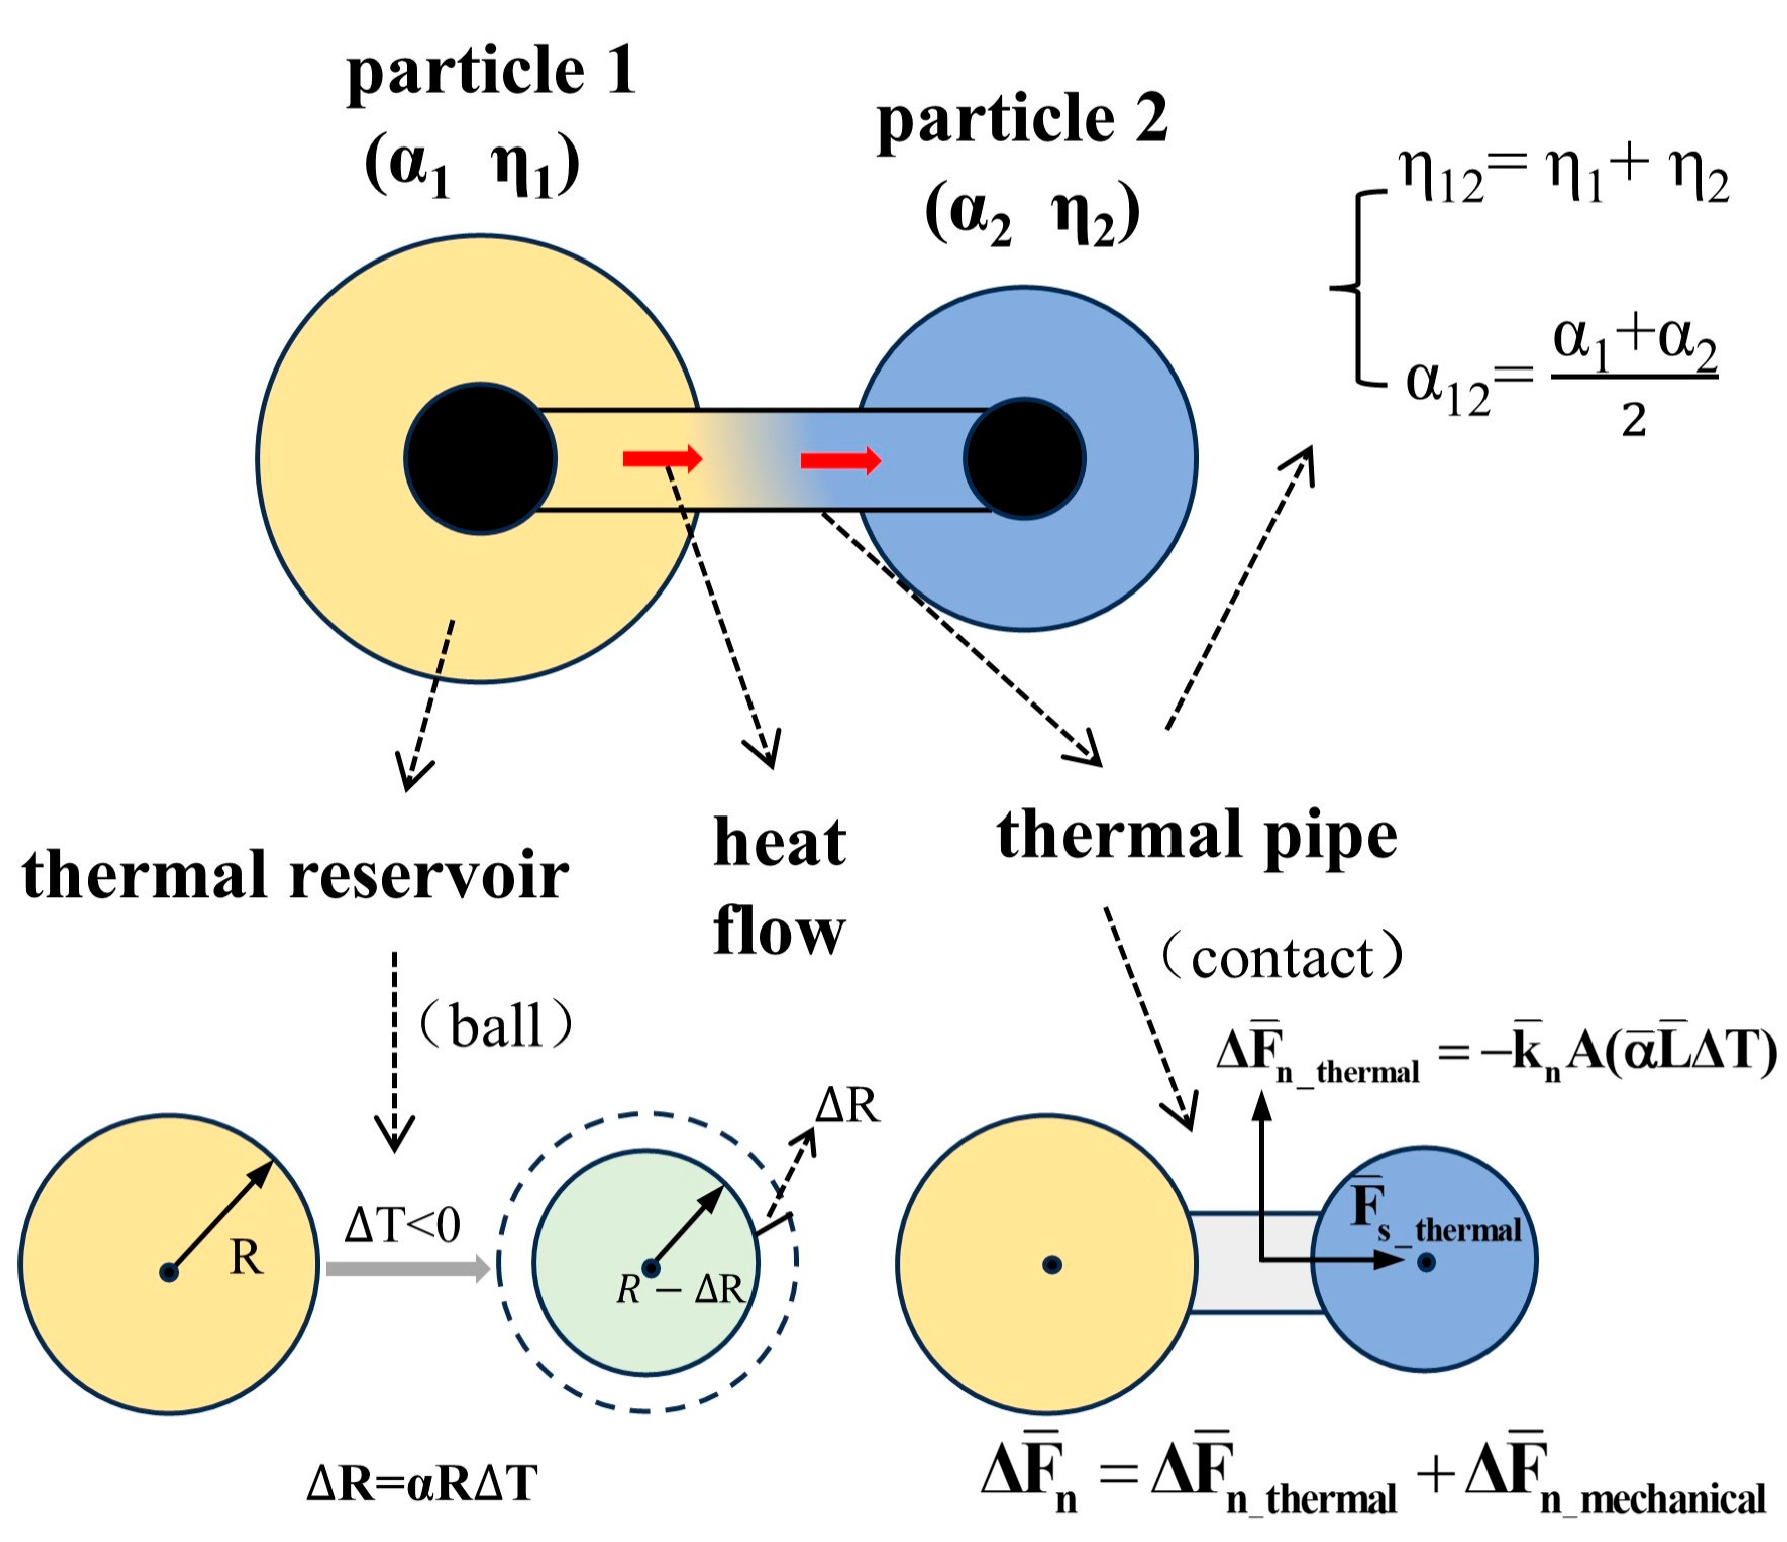
3.2. Heating and Loading Process
3.3. Model Calibration and Validation
3.3.1. Model Calibration
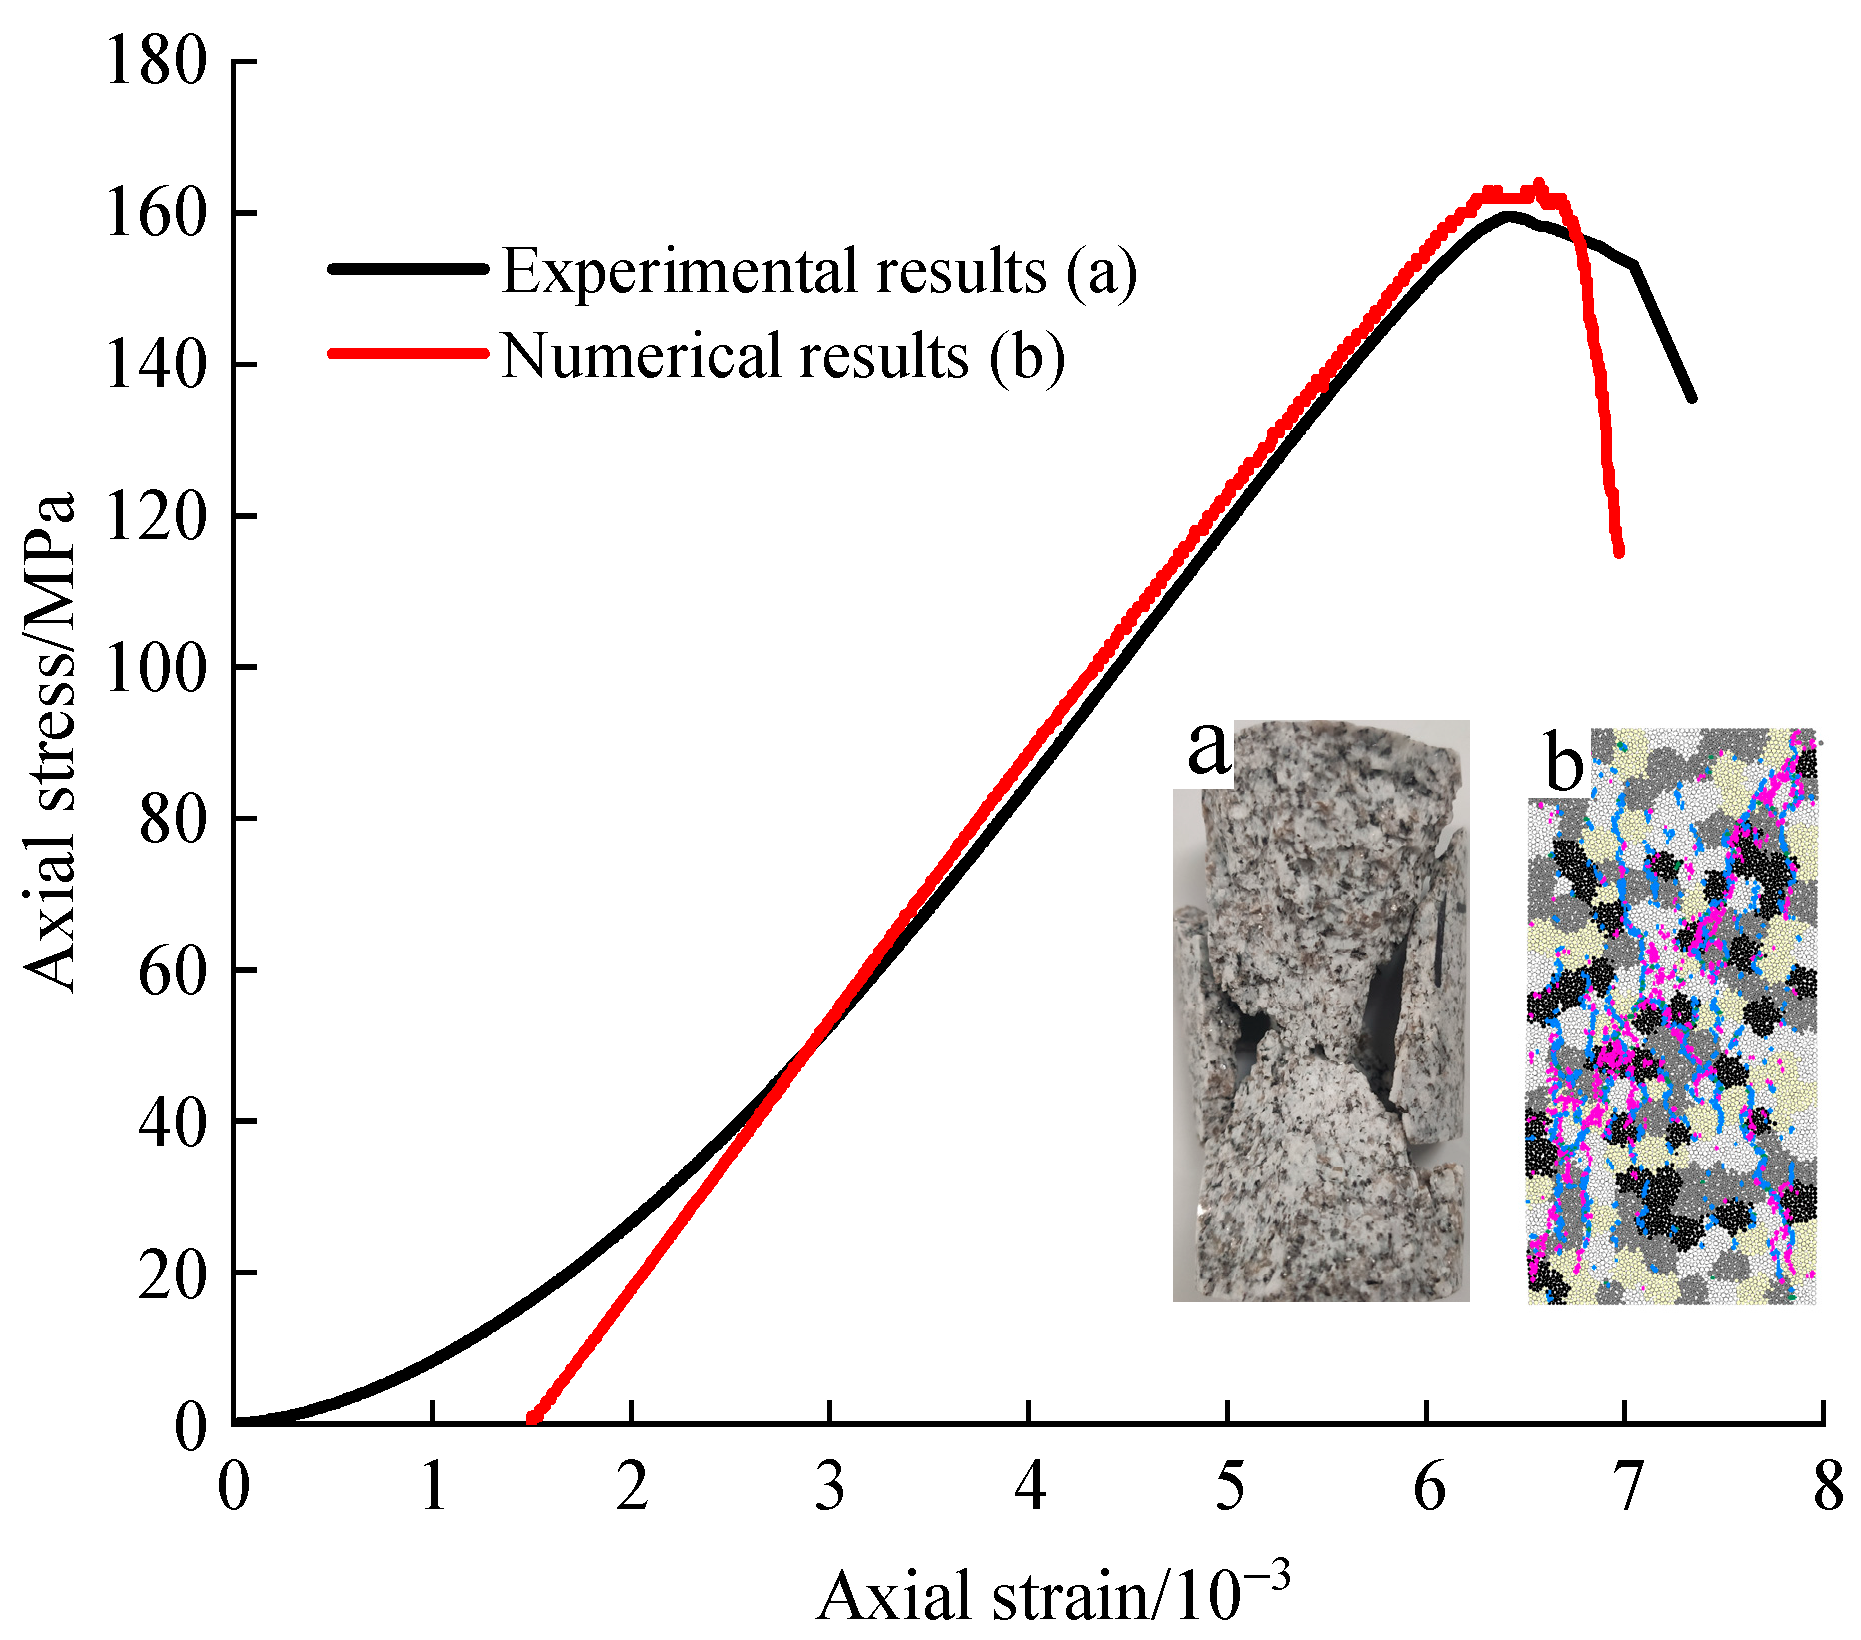
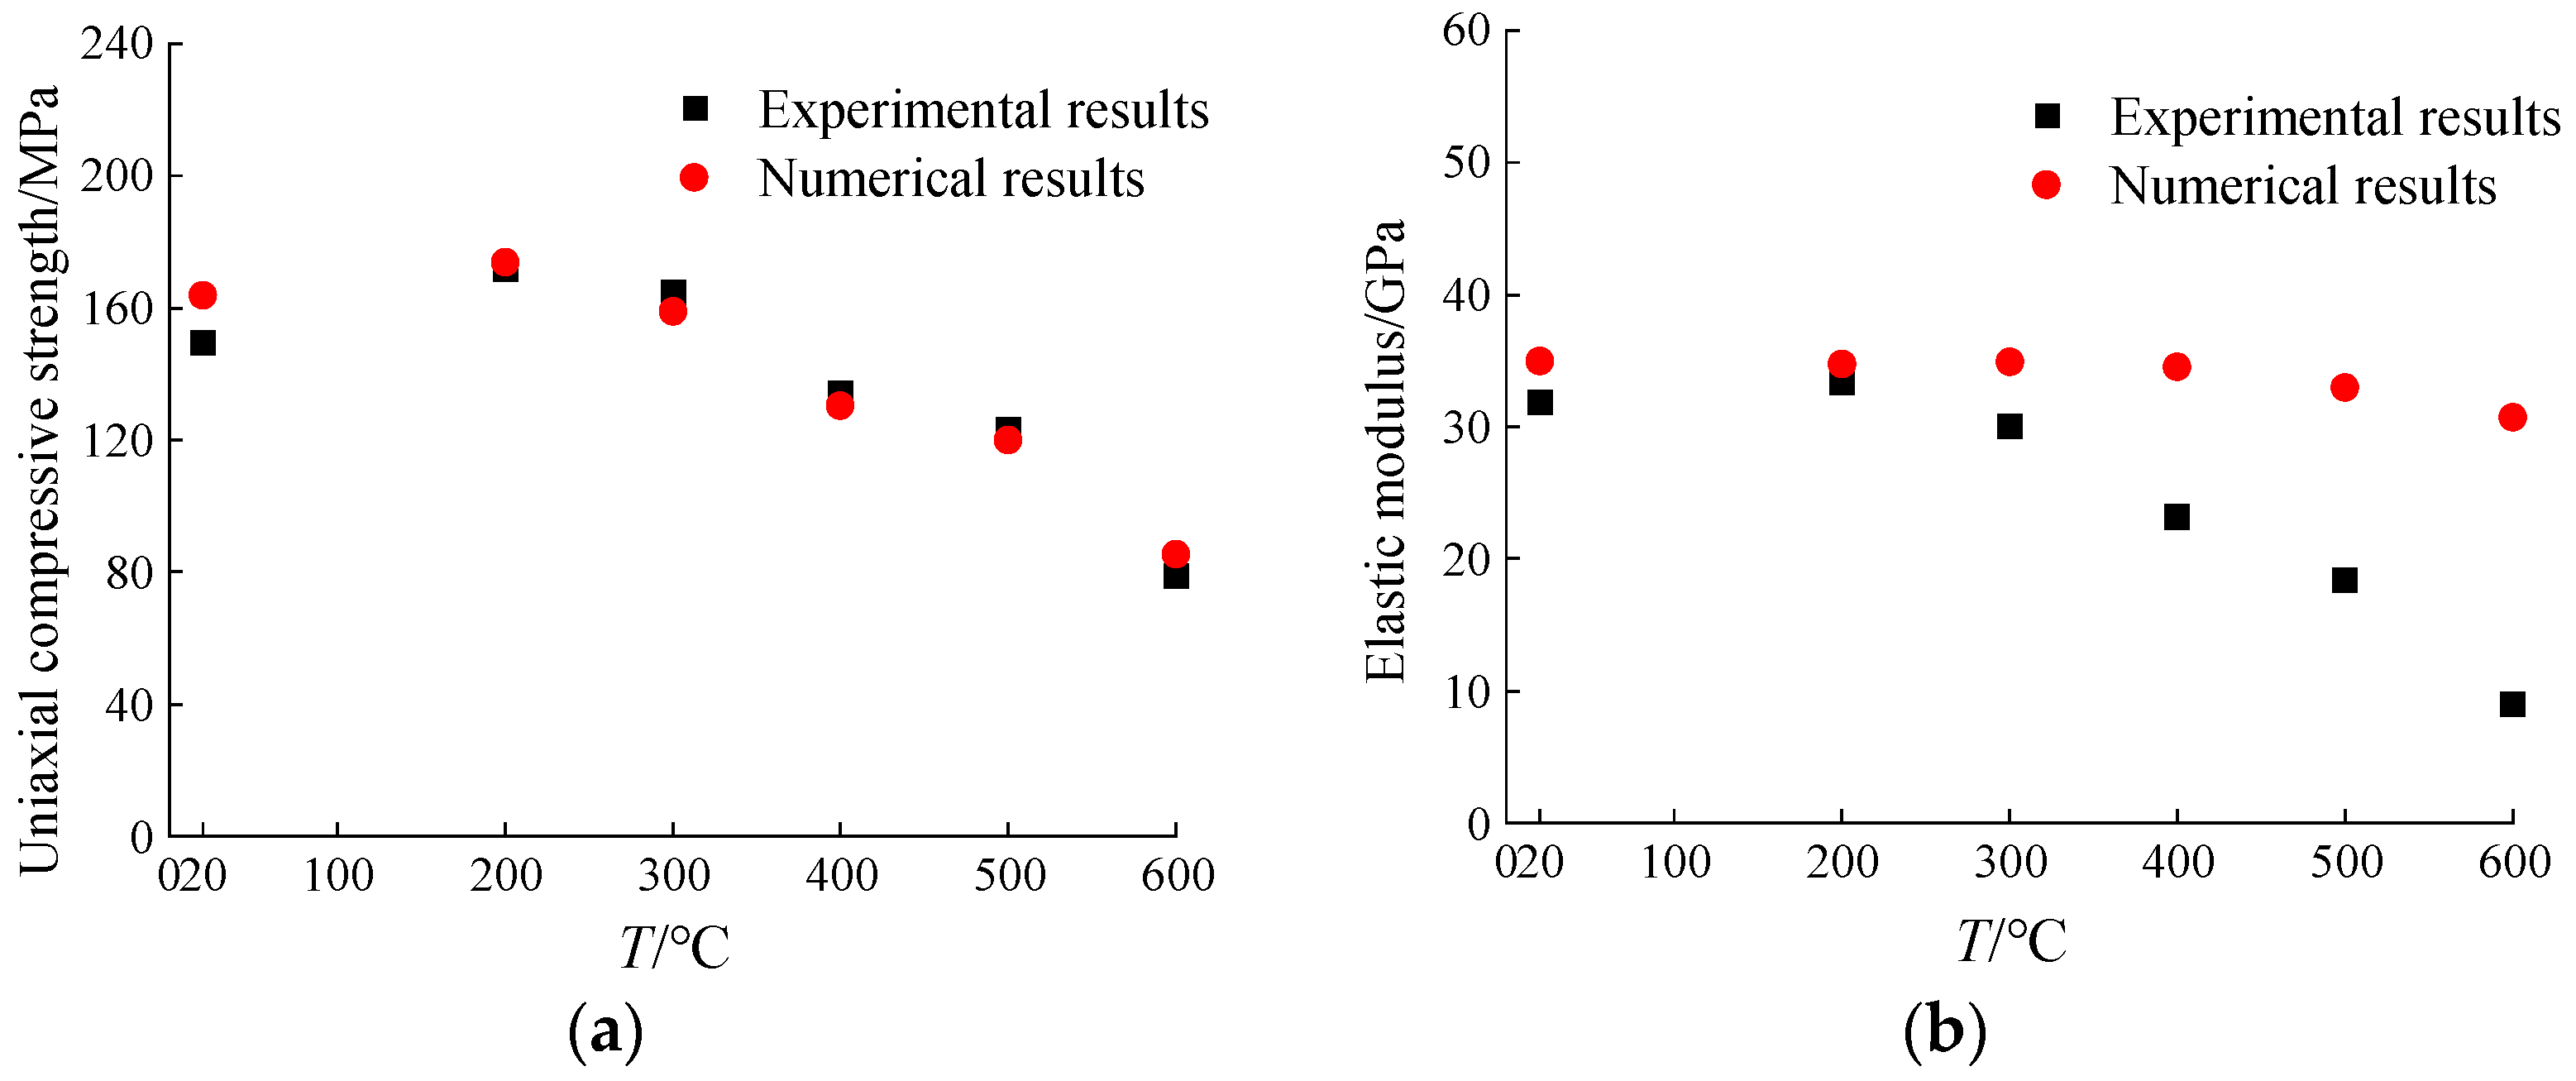
3.3.2. Model Validation
4. Results
4.1. Stress–Strain and Crack Propagation
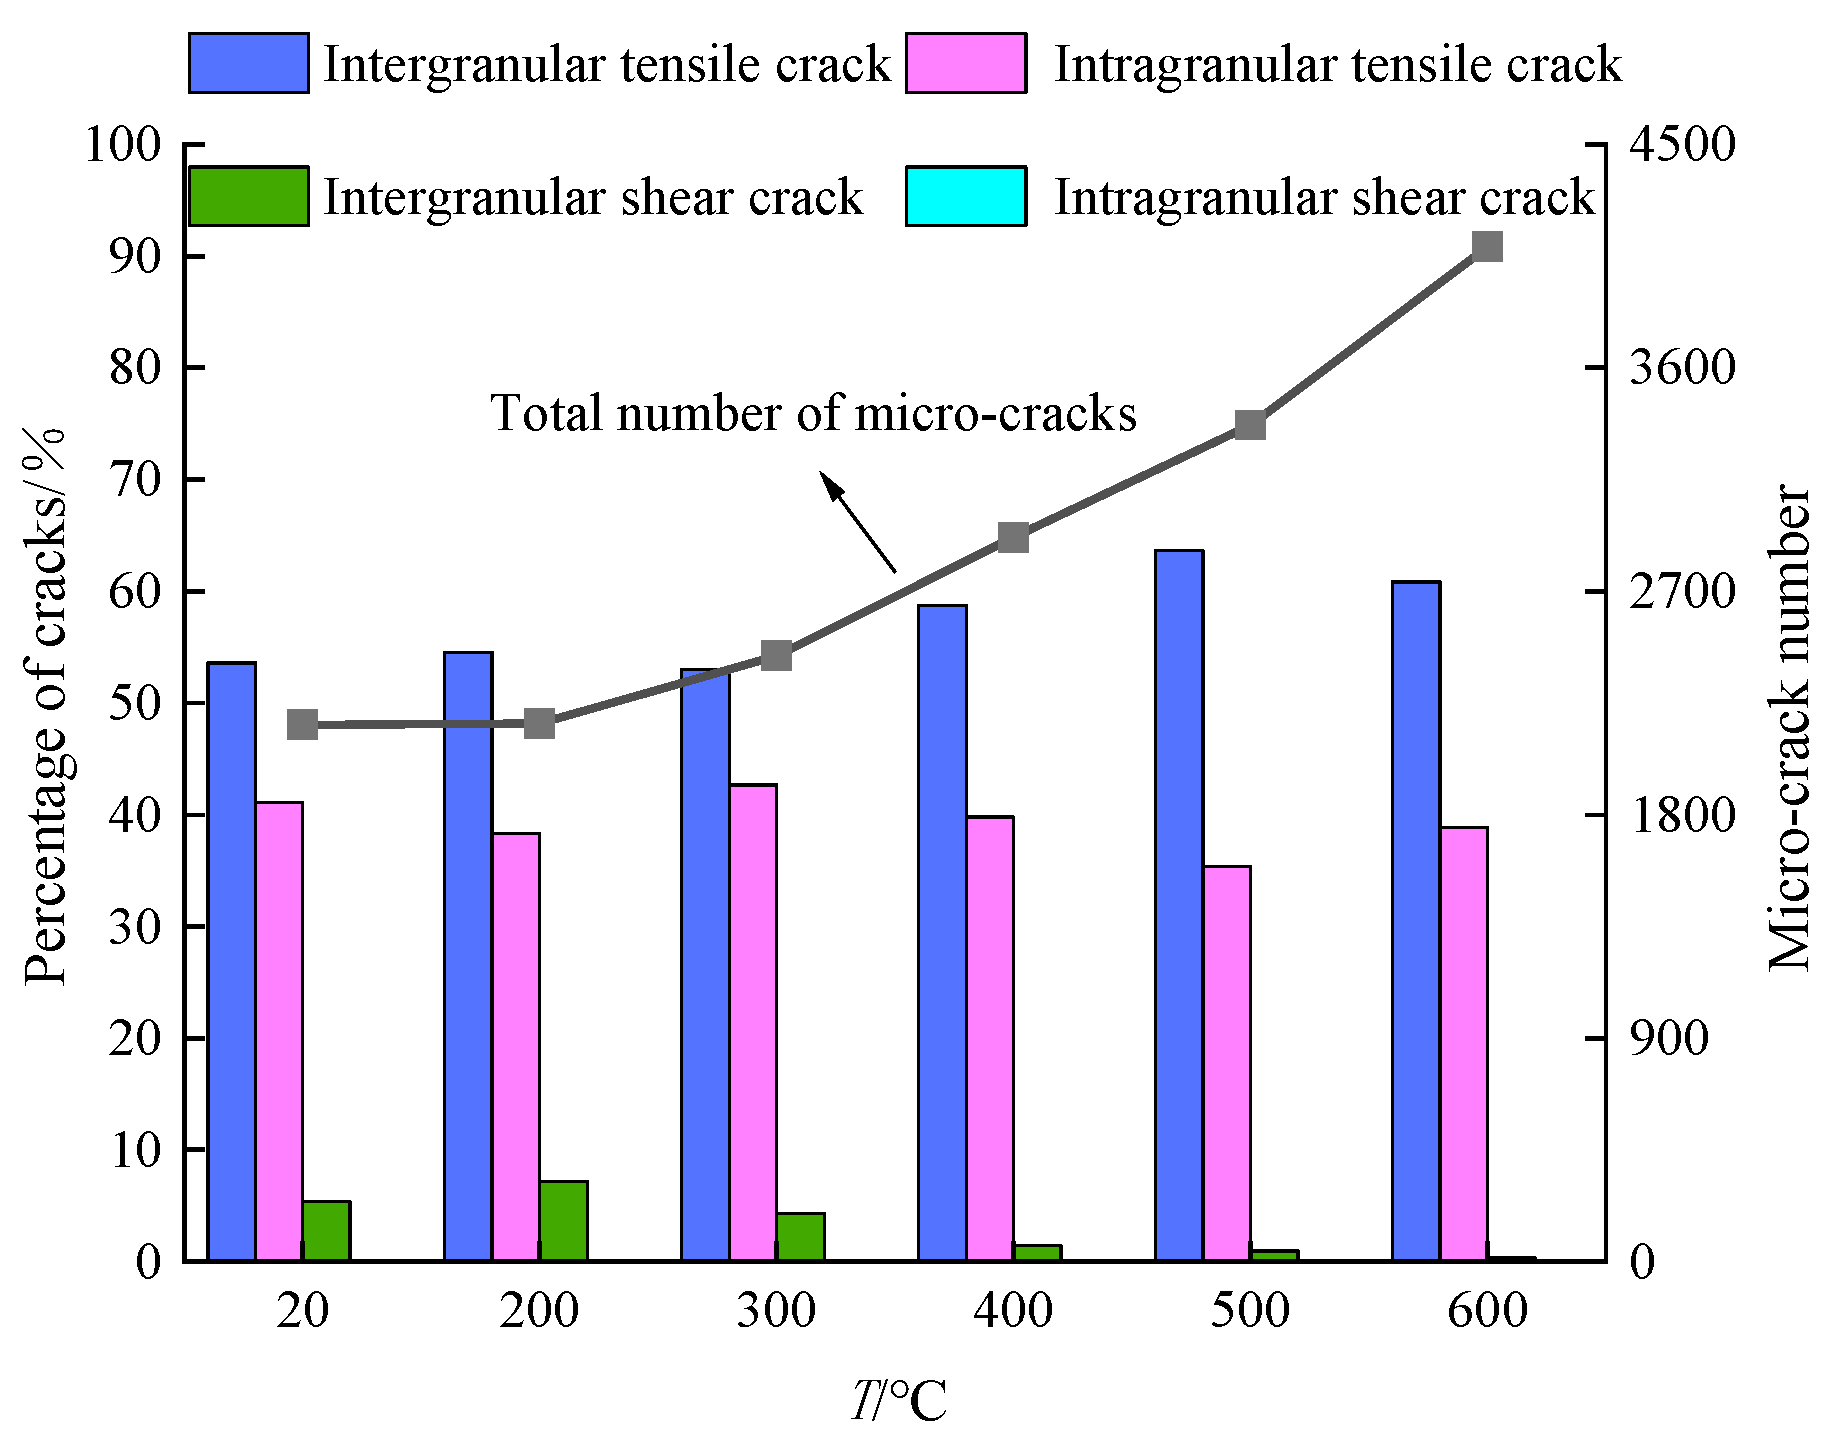
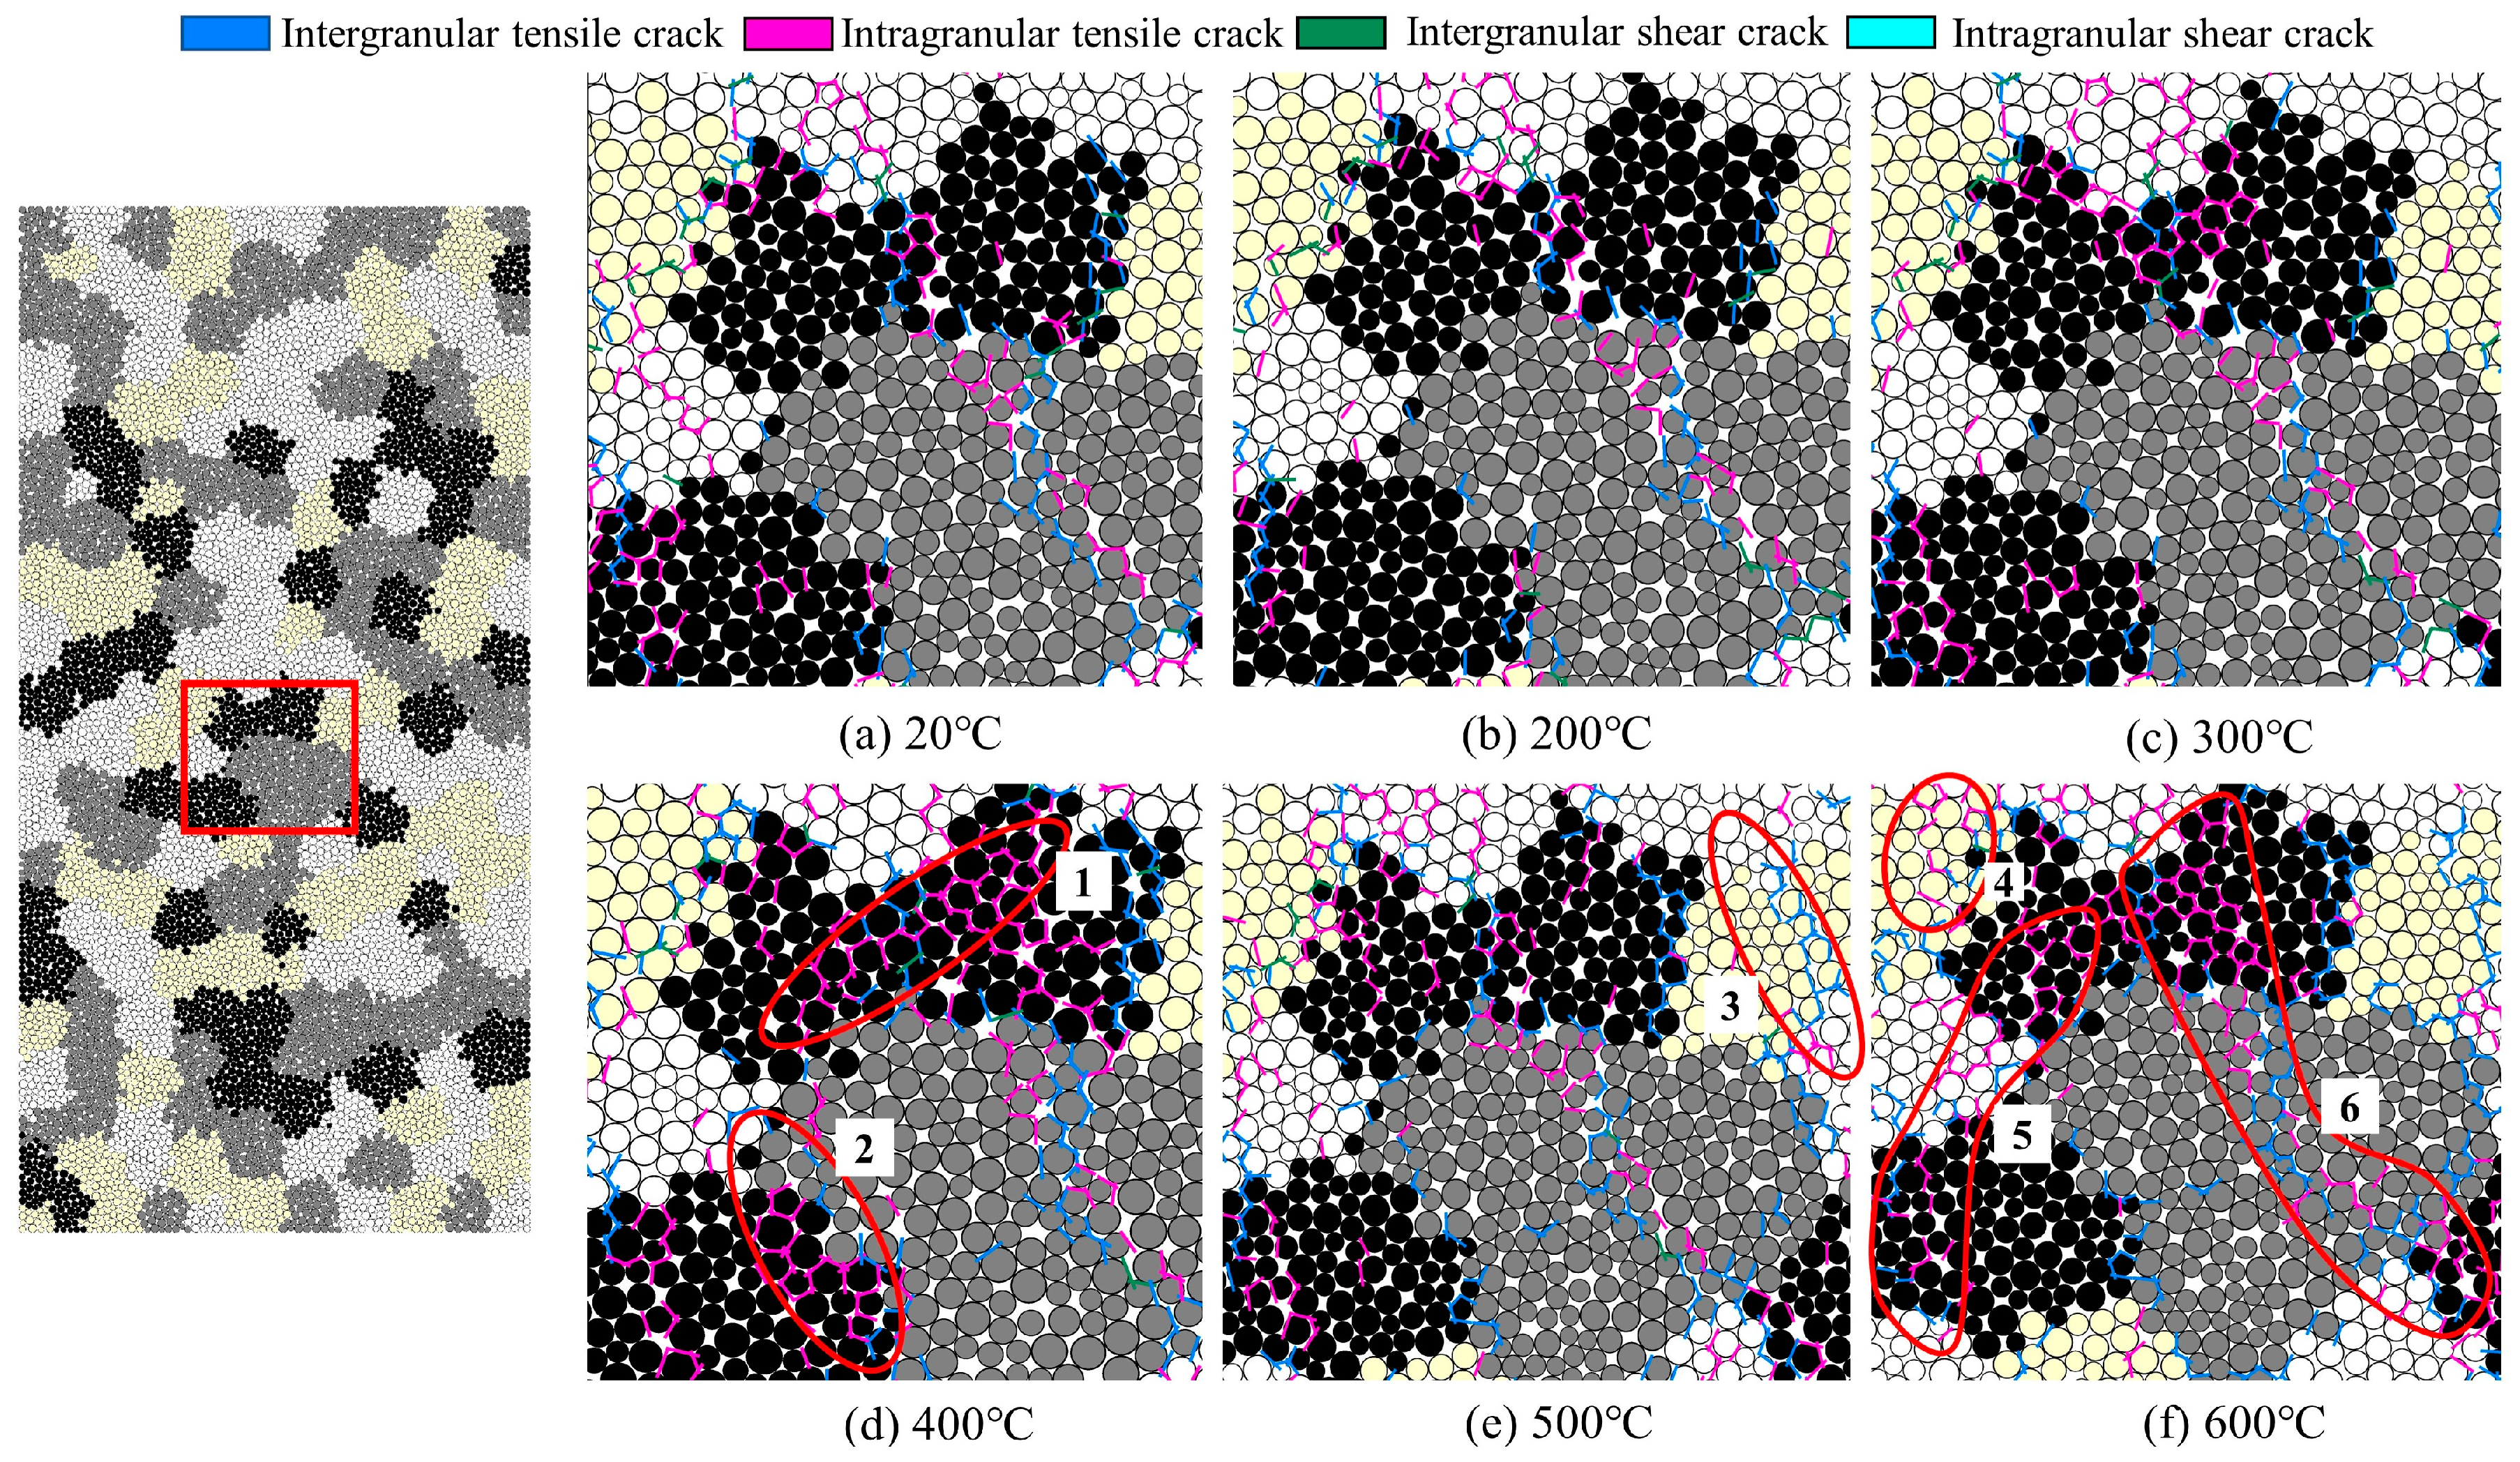
4.2. Microcrack Evolution
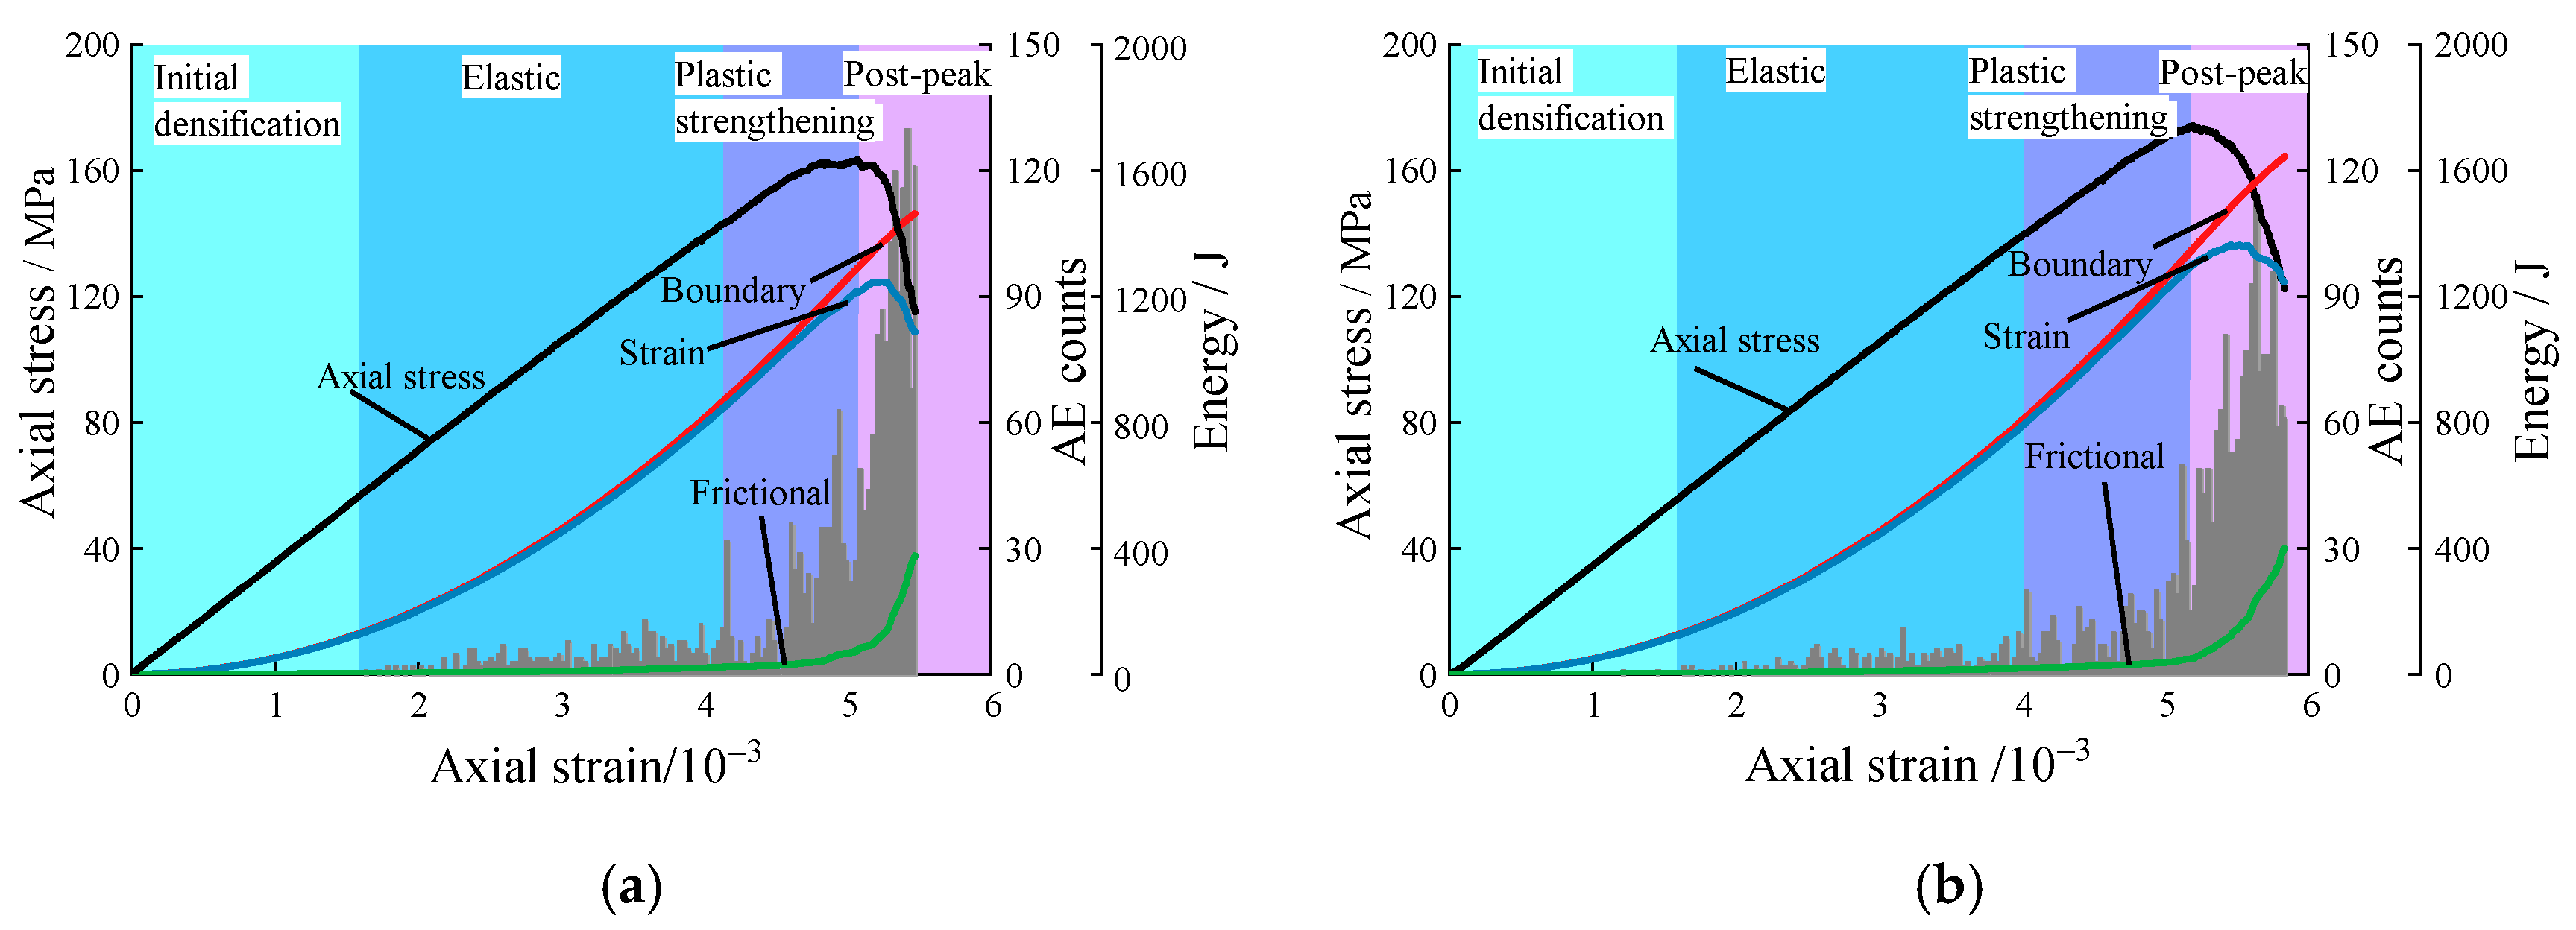
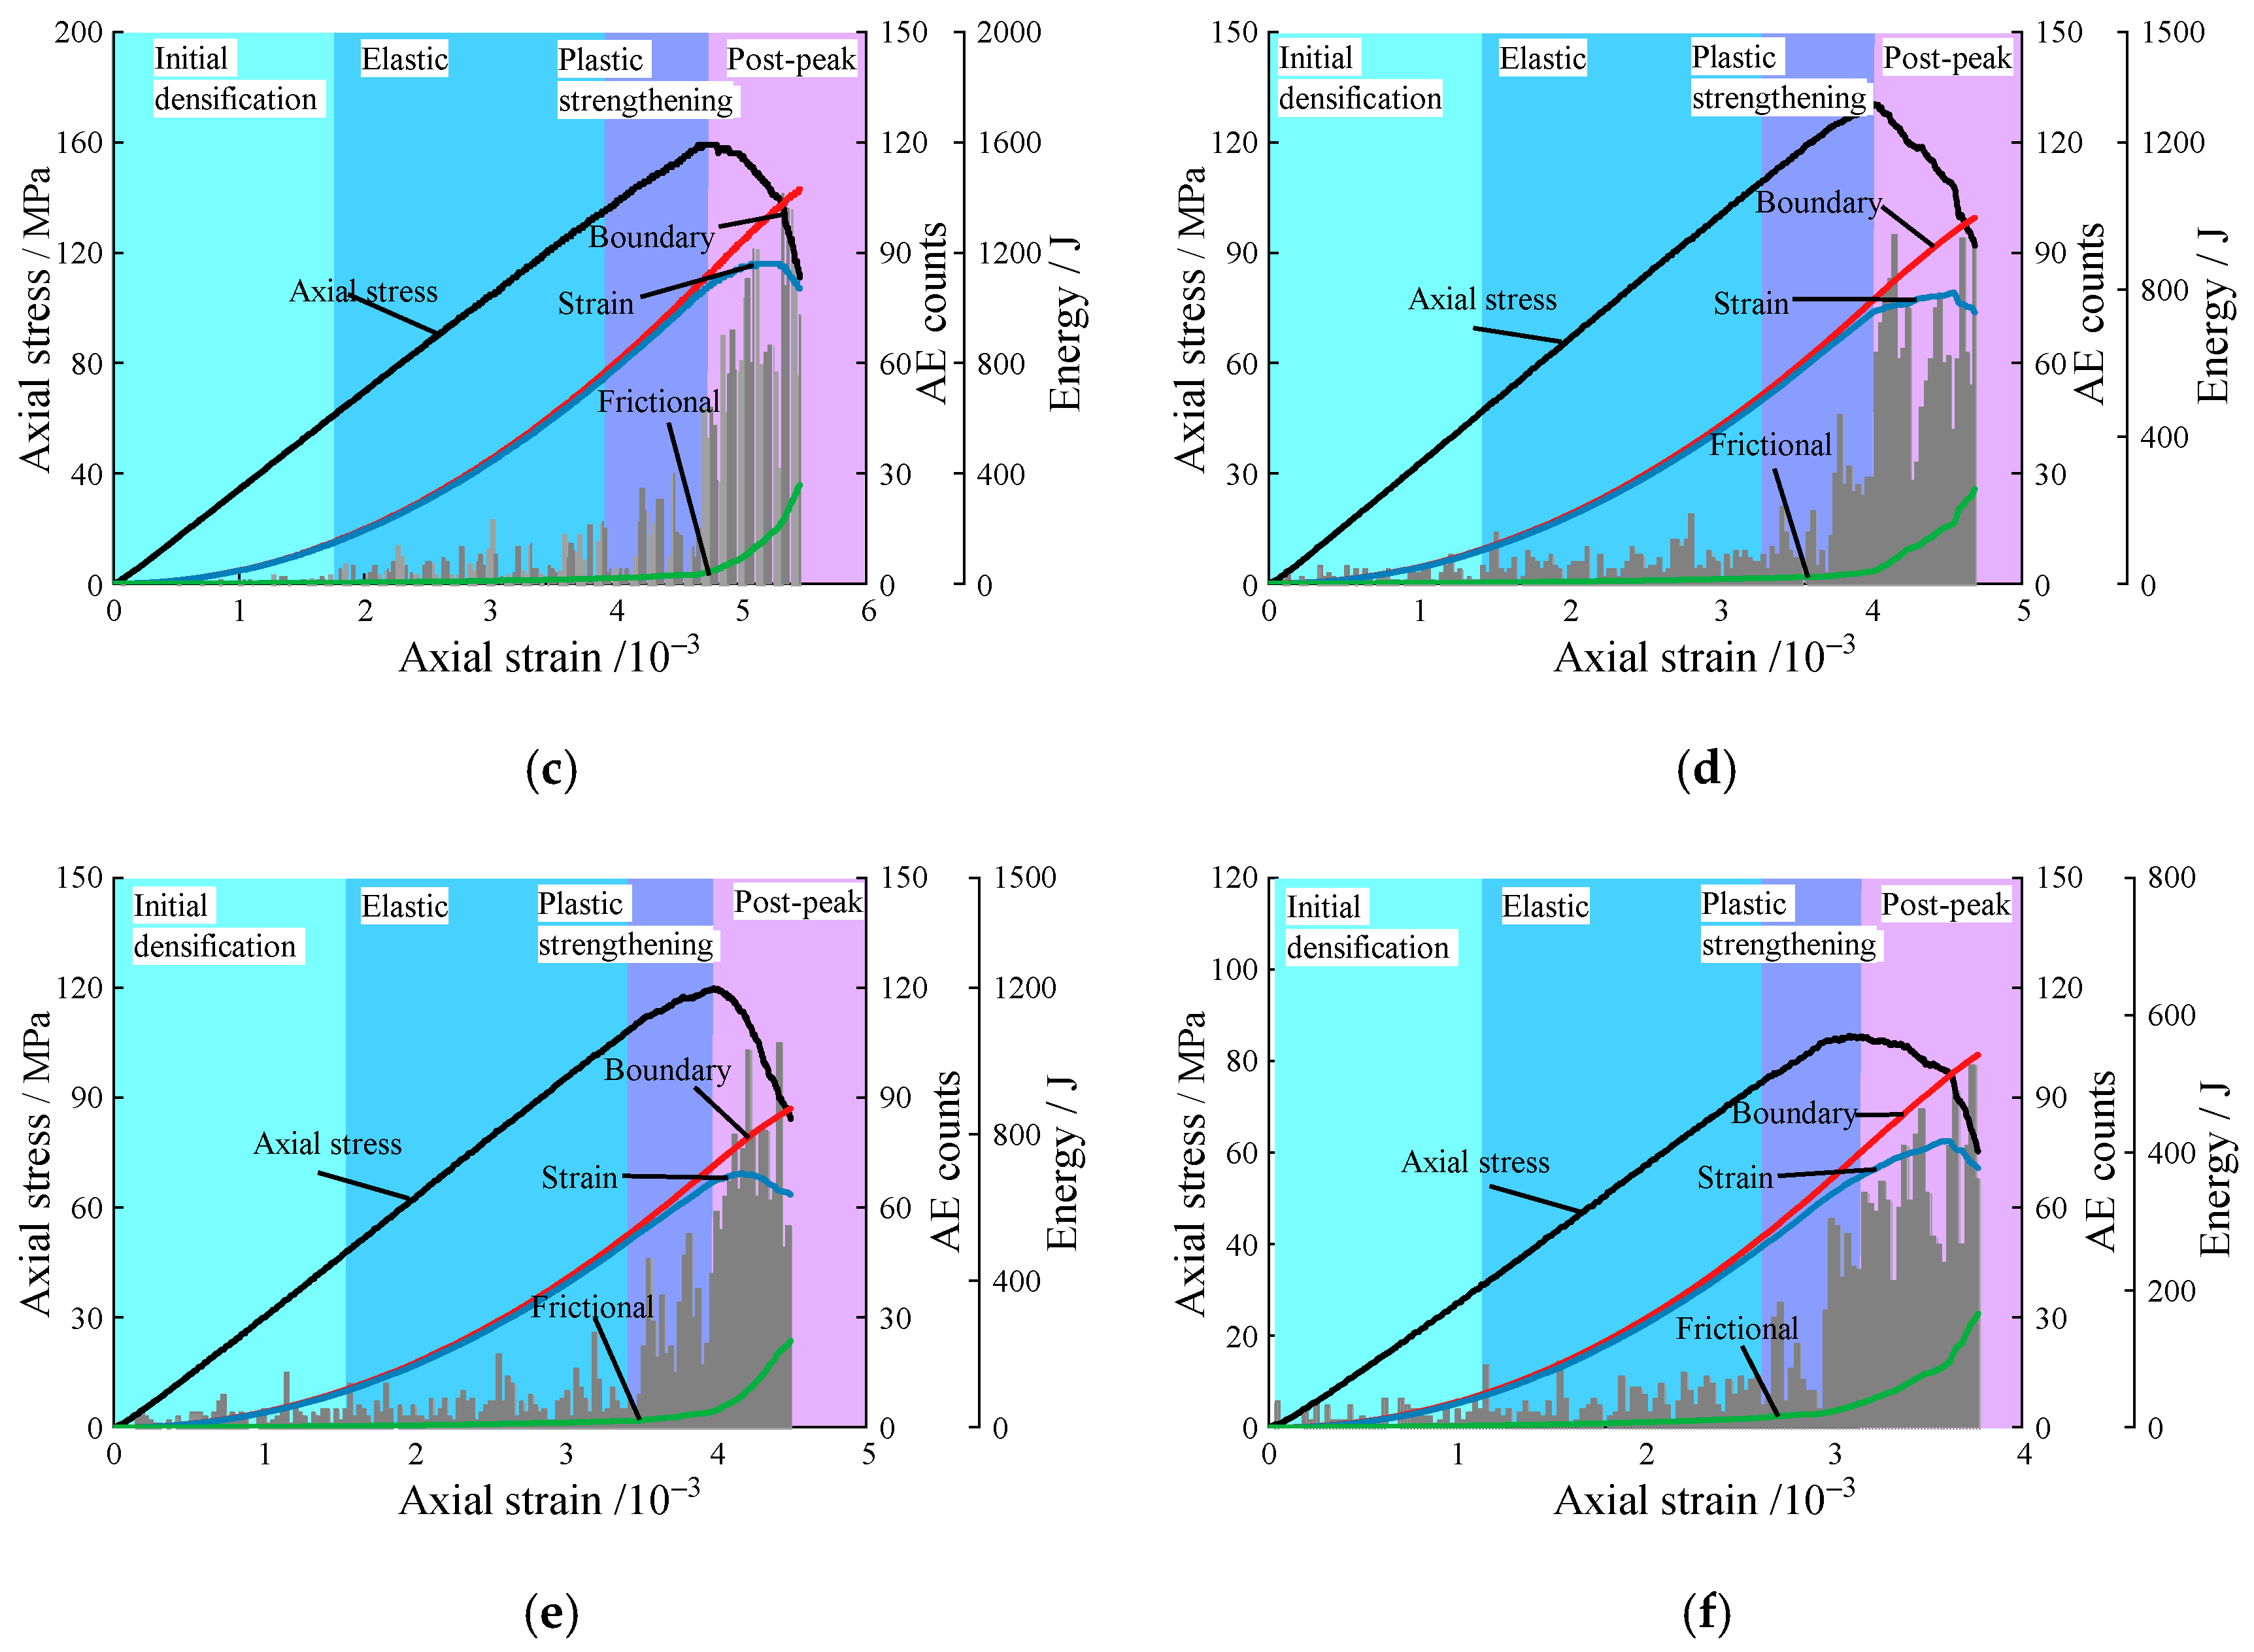
4.3. Acoustic Emission and Energy
5. Conclusions
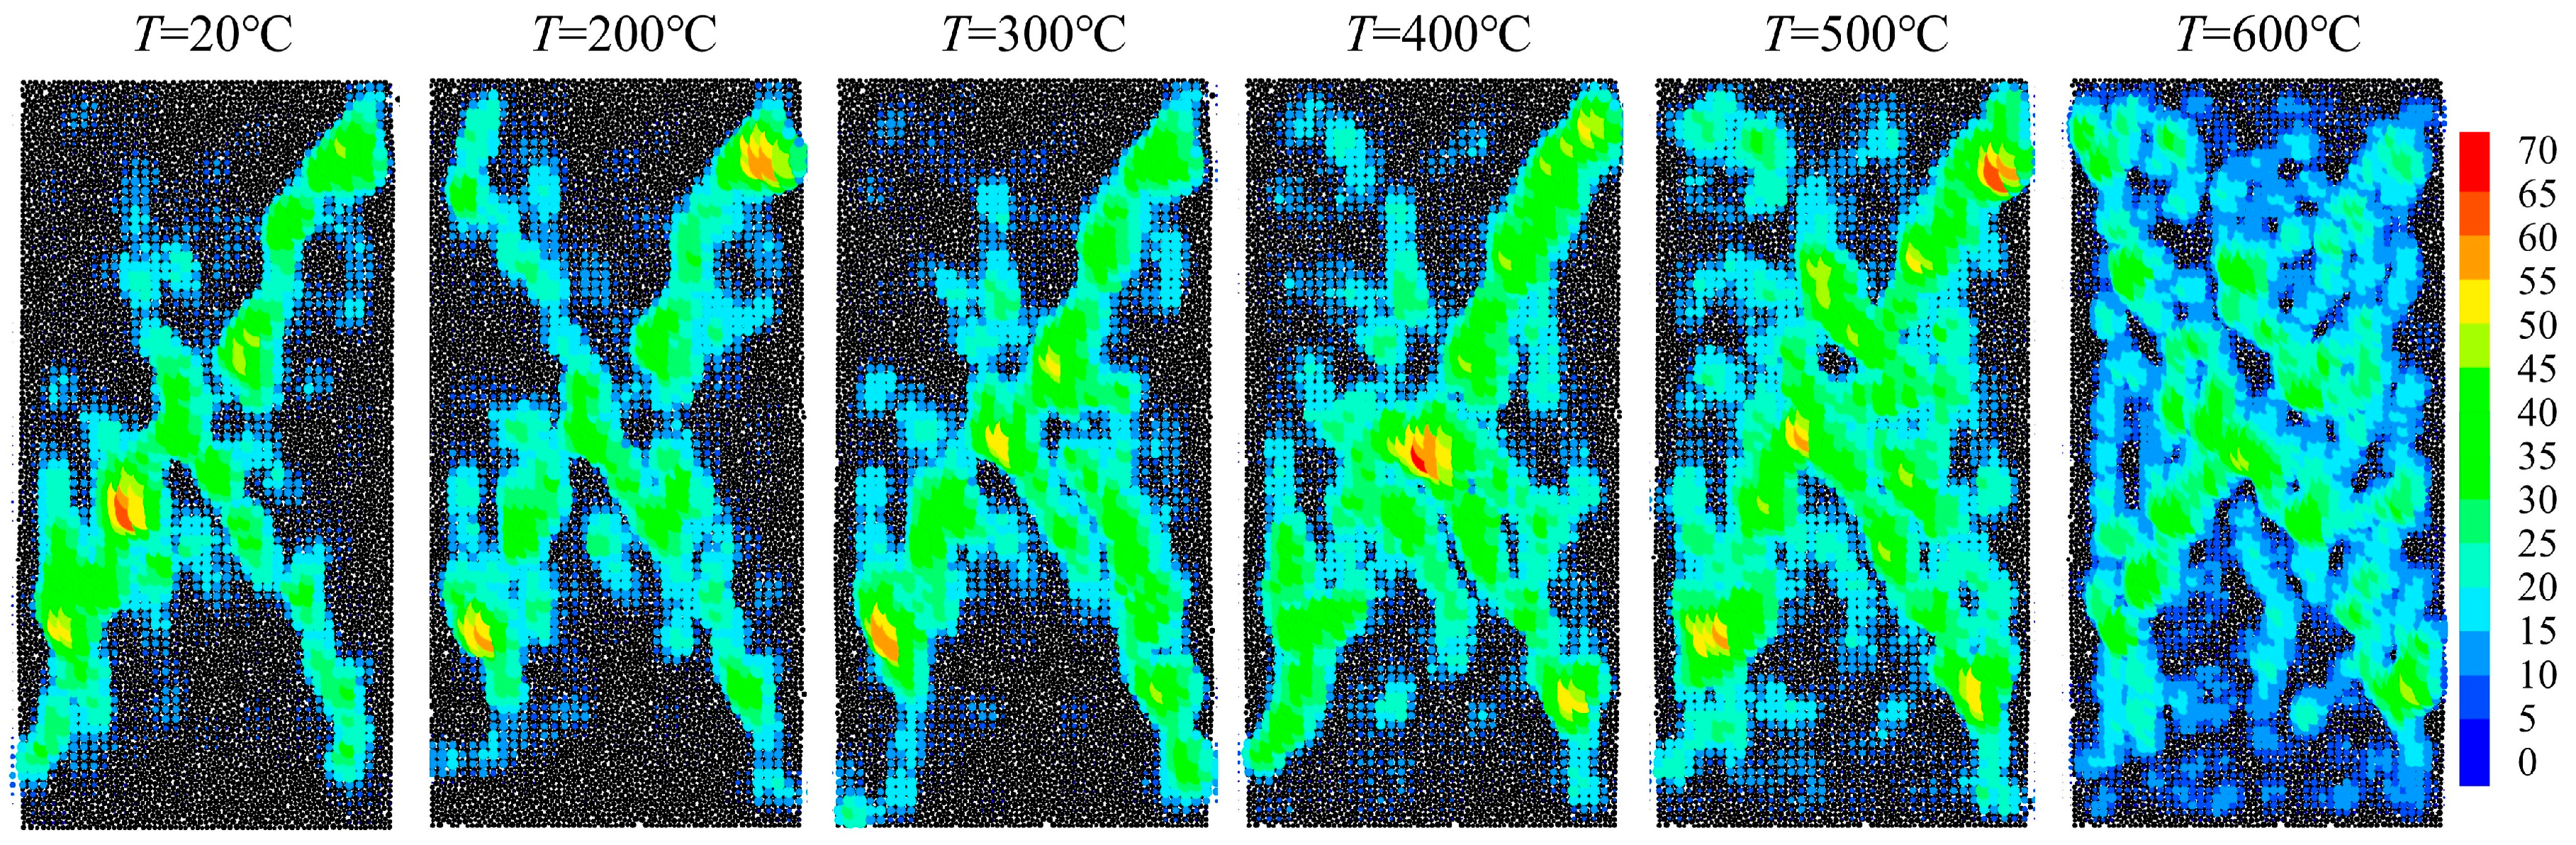
- During uniaxial loading, intergranular tensile cracks in granite initiate first and dominate throughout the entire process, with shear cracks appearing after the peak strength point and being minimal in number. As the temperature increases, the total number of microcracks gradually increases, becoming significant after 400 °C, and reaching the maximum development rate at 600 °C.
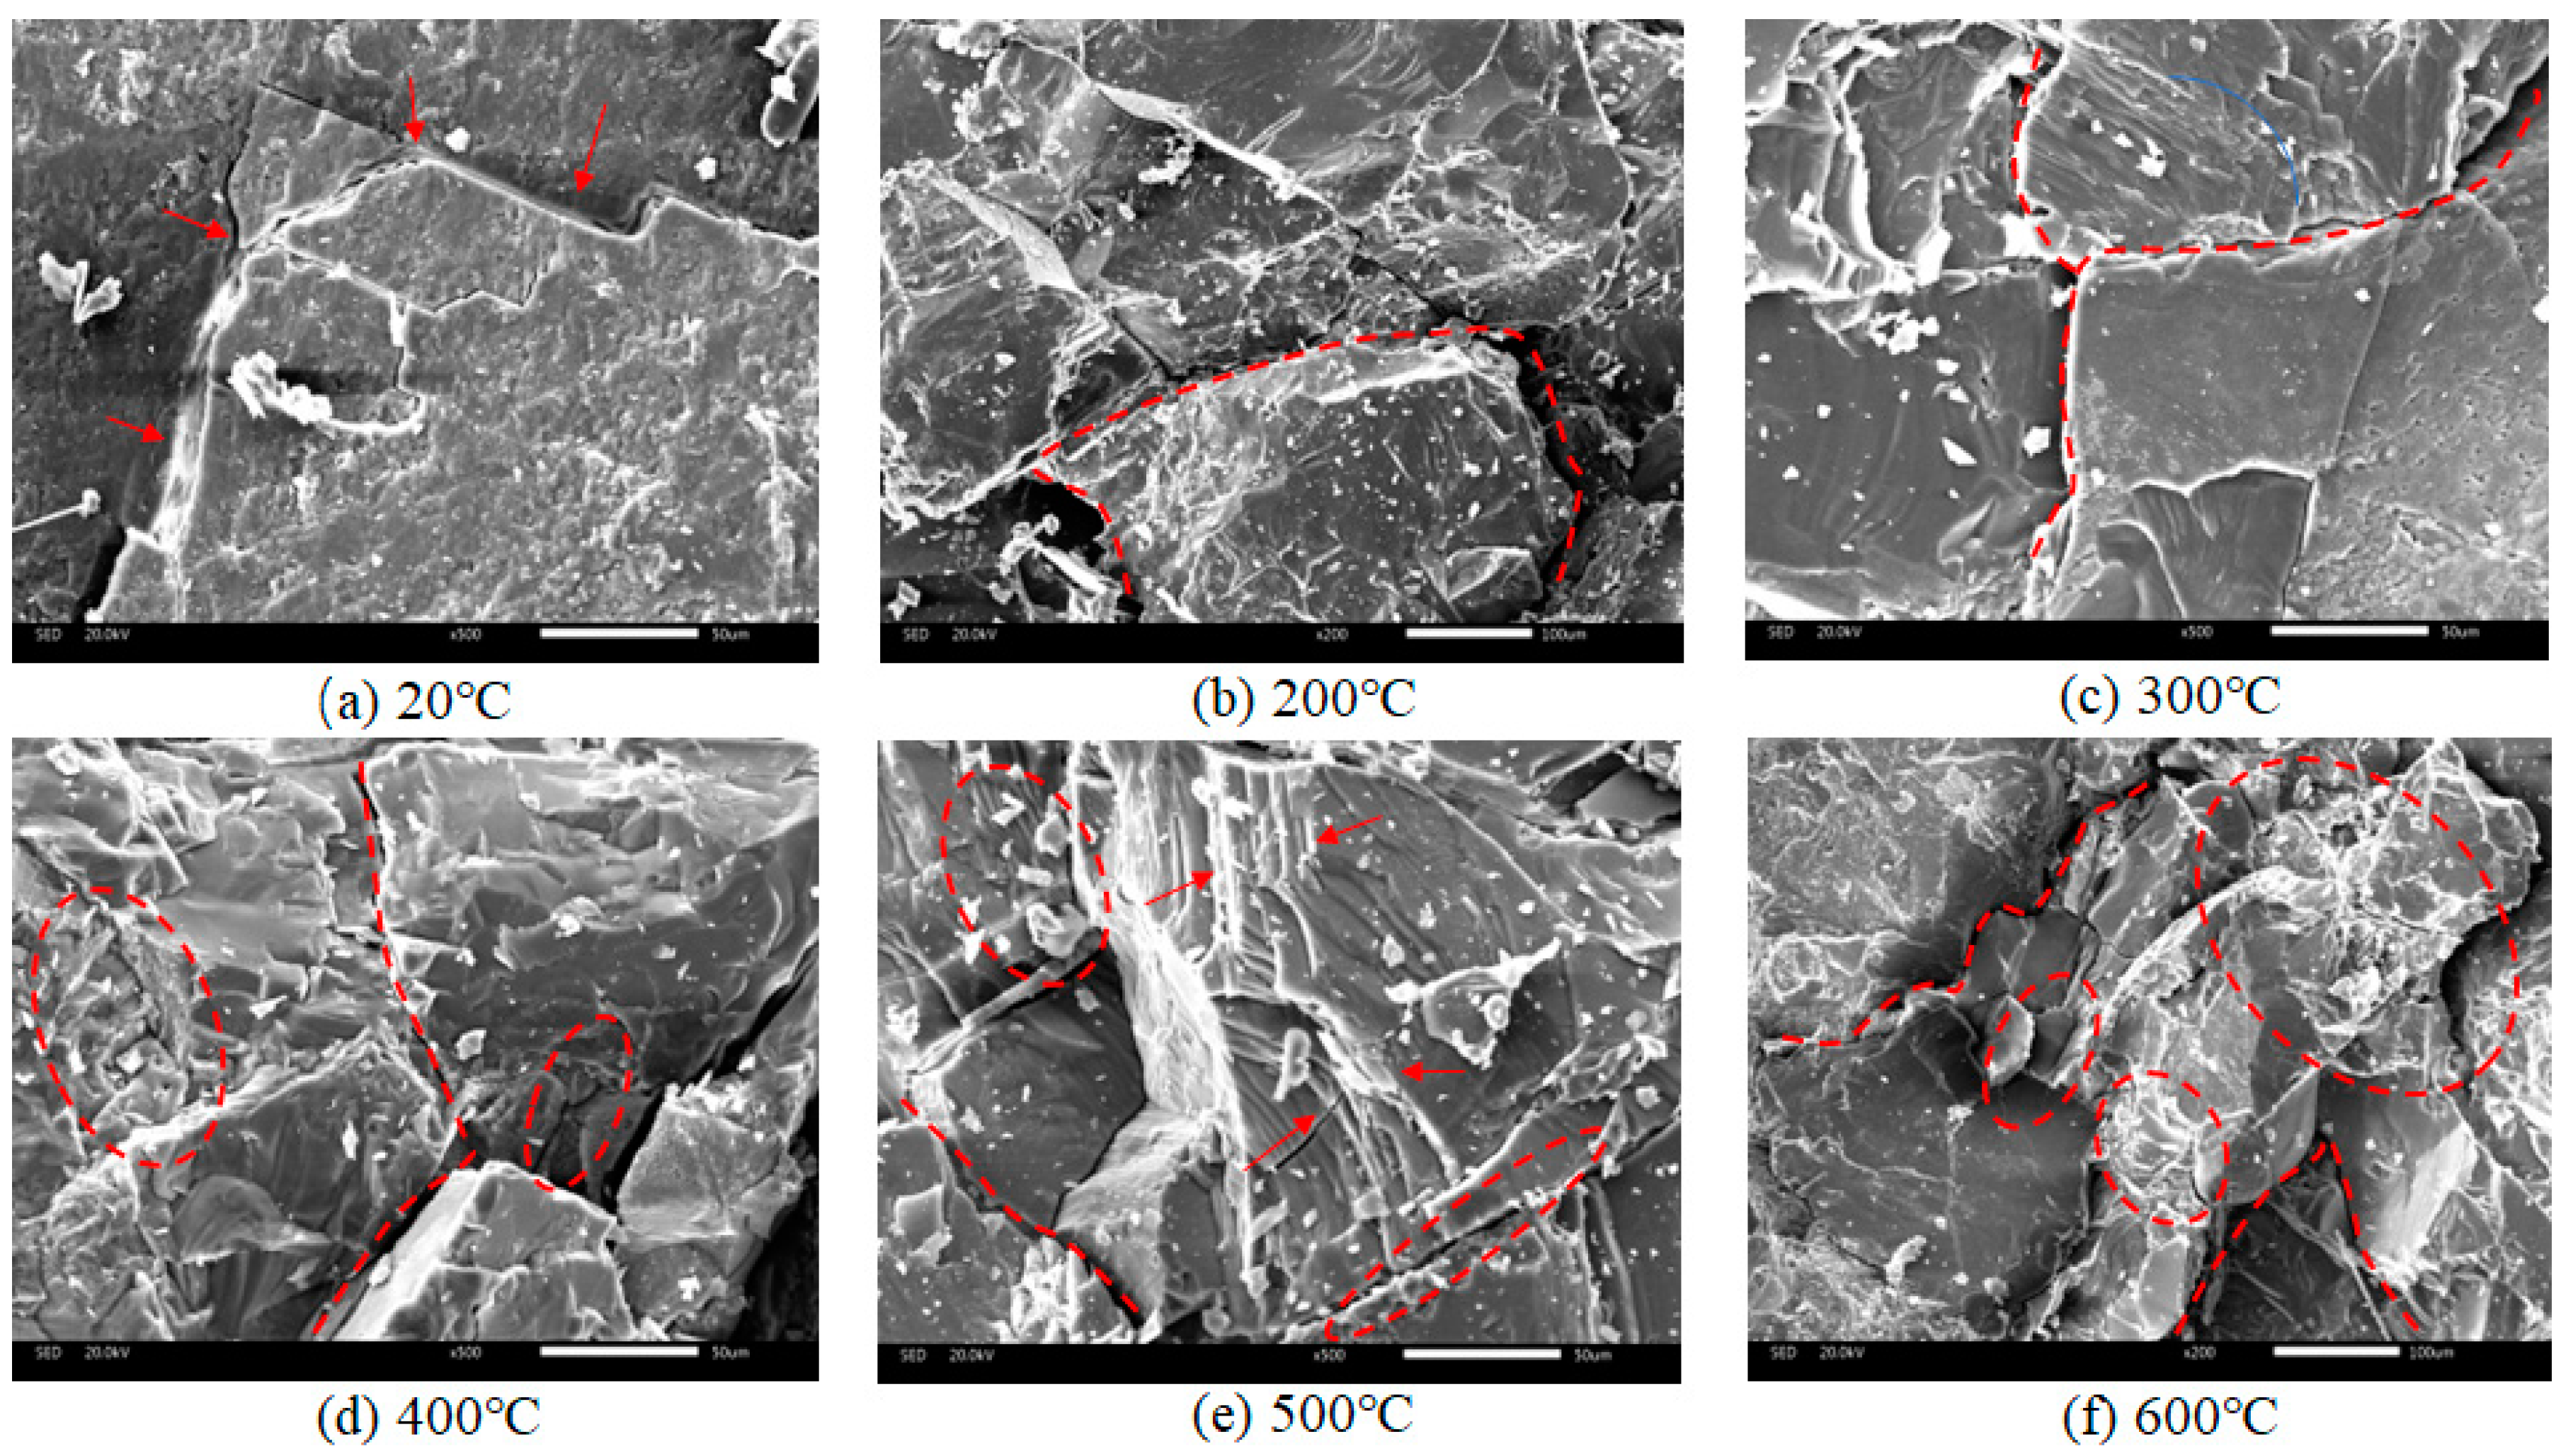
- Combining SEM (scanning electron microscopy) results, the distribution of microcracks in granite at different temperatures reveals that the damage under uniaxial compression is mainly controlled by mica and feldspar. As the temperature rises, the internal crack distribution in granite becomes more uniform, with edge cracks rapidly developing to connect with the main crack to form a fracture network, indicating a transition to ductile failure characteristics.
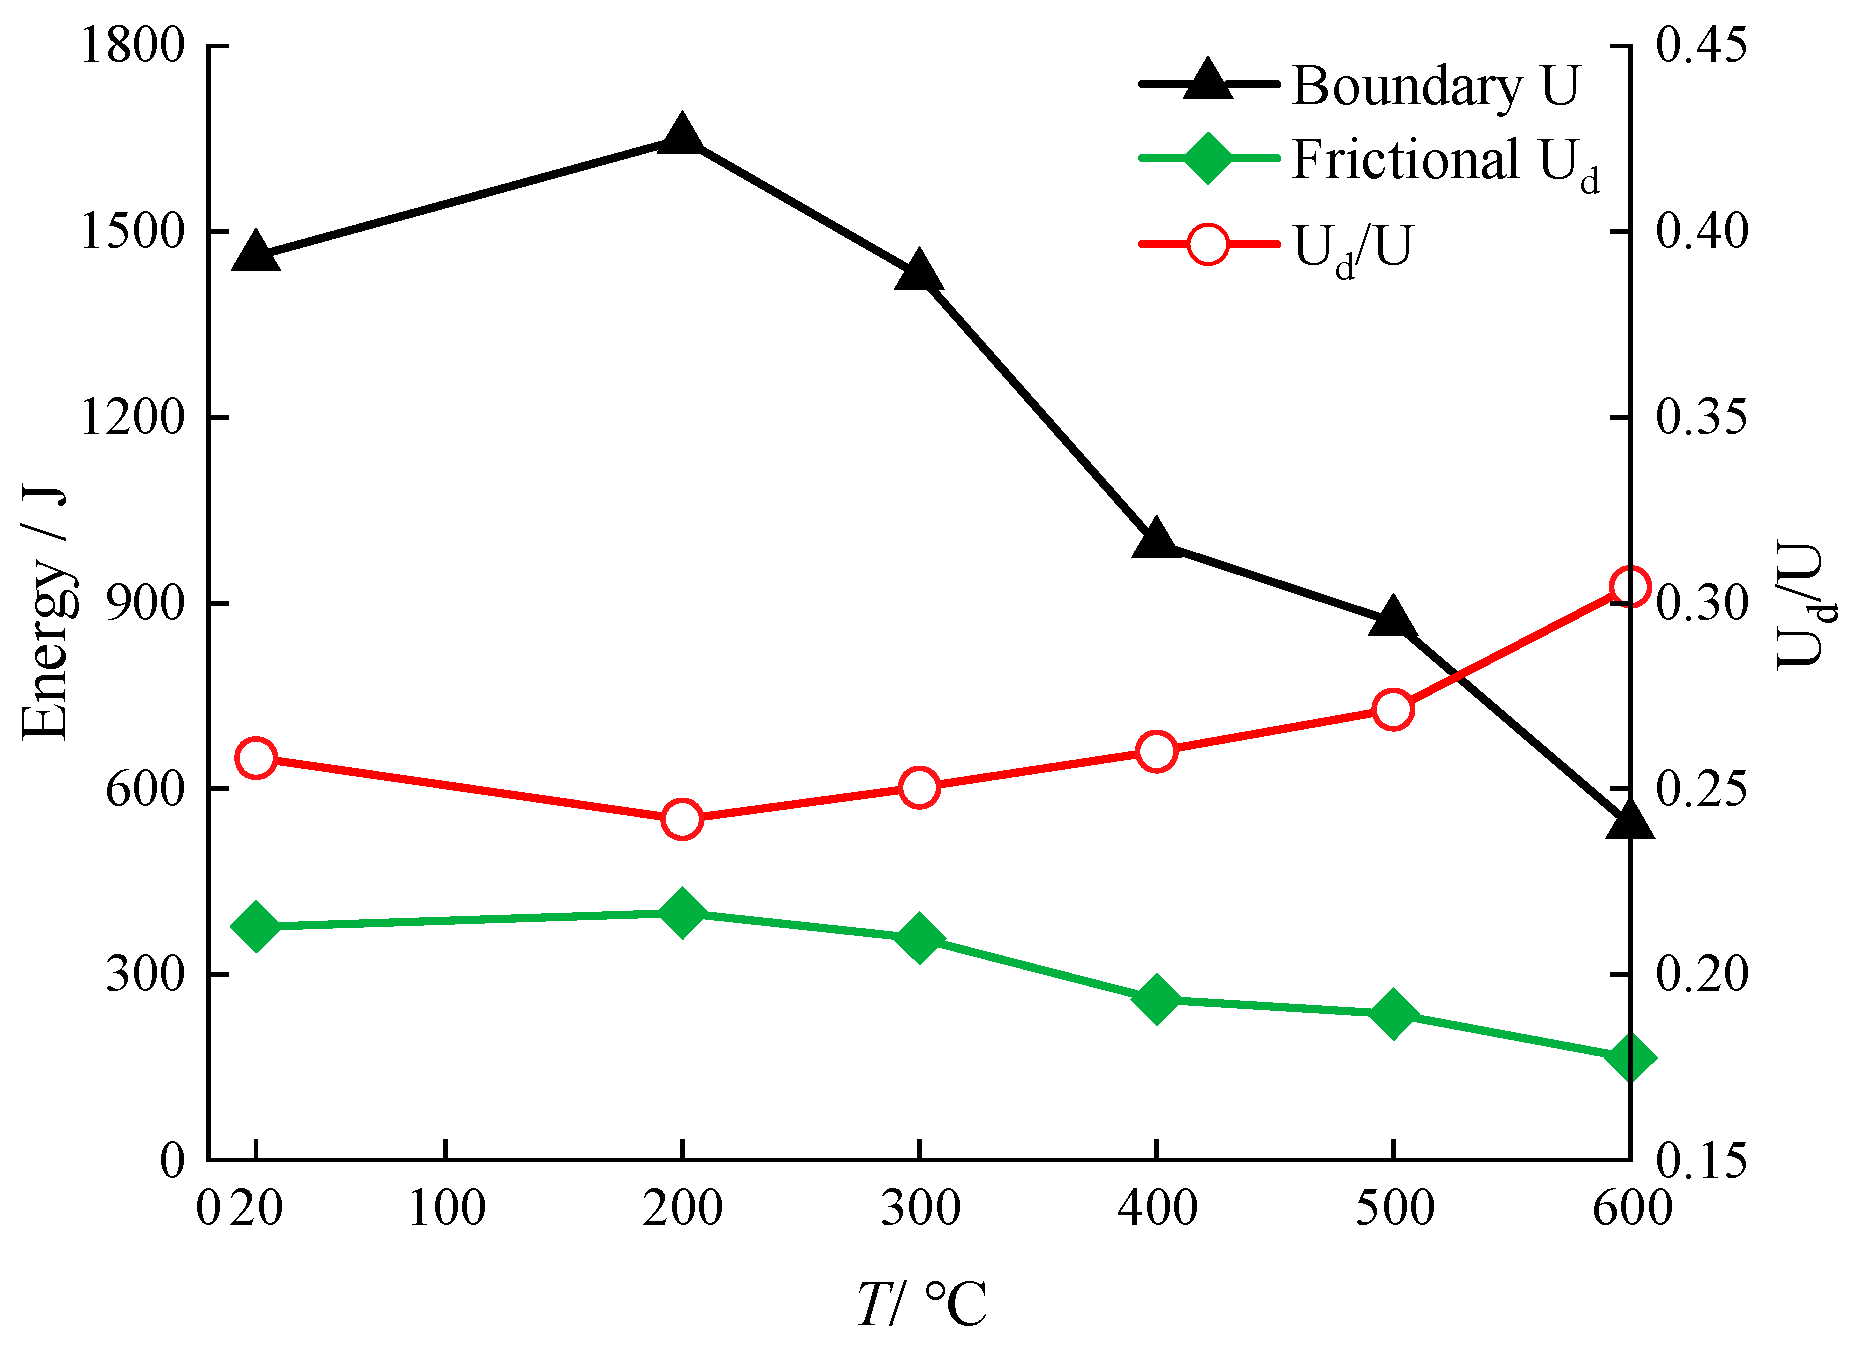
- With increasing temperature, acoustic emission events begin to occur during the initial compression stage, and their distribution becomes wider near the peak strength region with a decrease in amplitude. Multiple peaks in acoustic emission events gradually appear in the post-peak stage. Concurrently, both dissipated energy and boundary energy gradually decrease, and the energy consumption ratio increases, indicating more severe thermal damage to the granite.
Author Contributions
Funding
Institutional Review Board Statement
Informed Consent Statement
Data Availability Statement
Conflicts of Interest
References
- Martin, G.M.; Iribarren, D.; Dufour, J. On the environmental suitability of high- and low-enthalpy geothermal systems. Geothermics 2015, 53, 27–37. [Google Scholar] [CrossRef]
- Breede, K.; Dzebisashvili, K.; Liu, X.L.; Falcone, G. A systematic review of enhanced (or engineered) geothermal systems: Past, present and future. Geotherm. Energy 2013, 1, 4. [Google Scholar] [CrossRef]
- Zhang, W.; Wang, D.; Wang, Z.L.; Guo, T.K.; Wang, C.G.; He, J.Y.; Zhang, L.; Zheng, P.; Qu, Z.Q. Study on permeability evolution and damage mechanism along the EGS fracture in heat mining stage under thermal stress/cracking. Geotherm. Energy 2023, 11, 31. [Google Scholar] [CrossRef]
- Scott, S.; Yapparova, A.; Weis, P.; Houde, M. Hydrological constraints on the potential of enhanced geothermal systems in the ductile crust. Geotherm. Energy 2024, 12, 10. [Google Scholar] [CrossRef]
- Bahrami, B.; Ayatollahi, M.R.; Mirzaei, A.M.; Yahya, M.Y. Support type influence on rock fracture toughness measurement using semi-circular bending specimen. Rock Mech. Rock Eng. 2020, 53, 2175–2183. [Google Scholar] [CrossRef]
- Kelkar, S.; Woldegabriel, G.; Rehfeldt, K. Lessons learned from the pioneering hot dry rock project at Fenton Hill, USA. Geothermics 2016, 63, 5–14. [Google Scholar] [CrossRef]
- Lei, D.; Zhang, P.; He, J.T.; Bai, P.X.; Zhu, F.P. Fatigue life prediction method of concrete based on energy dissipation. Constr. Build. Mater. 2017, 145, 419–425. [Google Scholar] [CrossRef]
- Zhang, W.Q.; Sun, Q.; Hao, S.Q.; Geng, J.S.; Lv, C. Experimental study on the variation of physical and mechanical proper-ties of rock after high temperature treatment. Appl. Therm. Eng. 2016, 98, 1297–1304. [Google Scholar] [CrossRef]
- Li, B.; Ju, F.; Xiao, M.; Ning, P. Mechanical stability of granite as thermal energy storage material: An experimental investigation. Eng. Fract. Mech. 2019, 211, 61–69. [Google Scholar] [CrossRef]
- Chen, Y.; Ni, J.; Shao, W.; Azzam, R. Experimental study on the influence of temperature on the mechanical proper-ties of granite under uni-axial compression and fatigue loading. Int. J. Rock Mech. Min. 2012, 56, 62–66. [Google Scholar] [CrossRef]
- Liu, S.; Xu, J.Y. An experimental study on the physico-mechanical properties of two post-high-temperature rocks. Eng. Geol. 2015, 185, 63–70. [Google Scholar] [CrossRef]
- Zuo, J.P.; Xie, H.P.; Dai, F.; Ju, Y. Three-point bending test investigation of the fracture behavior of siltstone after ther-mal treatment. Int. J. Rock Mech. Min. 2014, 70, 133–143. [Google Scholar] [CrossRef]
- Li, C.; Hu, Y.Q.; Meng, T.; Zhang, C.W.; Gao, R.; Jin, P.H.; Hu, Y.F. Mode-I fracture toughness and mechanisms of Salt-Rock gypsum interlayers under real-time high-temperature conditions. Eng. Fract. Mech. 2020, 240, 107357. [Google Scholar] [CrossRef]
- Nasseri, M.H.B.; Schubnel, A.; Young, R.P. Coupled evolutions of fracture toughness and elastic wave velocities at high crack density in thermally treated Westerly granite. Int. J. Rock Mech. Min. 2007, 44, 601–616. [Google Scholar] [CrossRef]
- Li, B.Q.; Gonçalves, D.S.B.; Einstein, H. Laboratory hydraulic fracturing of granite: Acoustic emission observations and interpretation. Eng. Fract. Mech. 2019, 209, 200–220. [Google Scholar] [CrossRef]
- David, C.; Menéndez, B.; Darot, M. Influence of stress-induced and thermal cracking on physical properties and microstructure of La Peyratte granite. Int. J. Rock Mech. Min. 1999, 36, 433–448. [Google Scholar] [CrossRef]
- Zhang, Y.F.; Zhang, F.; Yang, K.; Cai, Z.Y. Effects of real-time high temperature and loading rate on deformation and strength behavior of granite. Geofluids 2022, 2022, 9426378. [Google Scholar] [CrossRef]
- Guo, L.L.; Zhang, Y.B.; Zhang, Y.J.; Yu, Z.W.; Zhang, J.N. Experimental investigation of granite properties under different temperatures and pressures and numerical analysis of damage effect in enhanced geothermal system. Renew. Energy 2018, 126, 107–125. [Google Scholar] [CrossRef]
- Yang, S.Q.; Xu, P.; Li, Y.B.; Huang, Y.H. Experimental investigation on triaxial mechanical and permeability behavior of sandstone after exposure to different high temperature treatments. Geothermics 2017, 69, 93–109. [Google Scholar] [CrossRef]
- Shahani, N.M.; Kamran, M.; Zheng, X.G.; Liu, C.C.; Guo, X.W. Application of gradient boosting machine learning algorithms to predict uniaxial compressive strength of soft sedimentary rocks at Thar Coalfield. Adv. Civ. Eng. 2021, 2021, 2565488. [Google Scholar] [CrossRef]
- Kamran, M.; Kidega, R.; Ondiaka, N.; Maina, D.; Jonah, K. Decision based uncertainty model to predict rockburst in underground engineering structures using gradient boosting algorithms. Geomech. Eng. 2022, 30, 259–272. [Google Scholar] [CrossRef]
- Kamran, M.; Jiskani, I.M.; Wang, Z.M.; Zhou, W. Decision intelligence-driven predictive modelling of air quality index in surface mining. Eng. Appl. Artif. Intel. 2024, 133, 108399. [Google Scholar] [CrossRef]
- Wu, S.C.; Xu, X.L. A study of three intrinsic problems of the classic discrete element method using Flat-Joint model. Rock Mech. Rock Eng. 2016, 49, 1813–1830. [Google Scholar] [CrossRef]
- Schöpfer, M.P.J.; Abe, S.; Childs, C.; Walsh, J.J. The impact of porosity and crack density on the elasticity, strength and friction of cohesive granular materials: Insights from DEM modelling. Int. J. Rock Mech. Min. 2009, 46, 250–261. [Google Scholar] [CrossRef]
- Deisman, N.; Mas, I.D.; Pierce, M. PFC2D Smooth joint contact model numerical experiments. In Proceedings of the GeoEdmonton 2008: The 61th Canadian Geotechnical Conference and the 9th Joint CGS/IAH-CNC Groundwater Conference, Edmonton, AB, Canada, 21–24 September 2008. [Google Scholar]
- Cho, N.; Martin, C.D.; Sego, D.C. A clumped particle model for rock. Int. J. Rock Mech. Min. 2007, 44, 997–1010. [Google Scholar] [CrossRef]
- Potyondy, D.O. A grain-based model for rock: Approaching the true microstructure. In Proceedings of the Rock Mechanics in the Nordic Countries, Kongsberg, Norway, 9–12 June 2010; pp. 225–234. [Google Scholar]
- Tian, W.L.; Yang, S.Q.; Huang, Y.H. Macro and micro mechanics behavior of granite after heat treatment by cluster model in particle flow code. Acta Mech. Sin. 2018, 34, 175–186. [Google Scholar] [CrossRef]
- Tian, W.L.; Yang, S.Q.; Huang, Y.H.; Hu, B. Mechanical behavior of granite with different grain sizes after high-temperature treatment by particle flow simulation. Rock Mech. Rock Eng. 2020, 53, 1791–1807. [Google Scholar] [CrossRef]
- Zhang, Y.H.; Wong, L.N.Y.; Chan, K.K. An extended grain-based model accounting for microstructures in rock deformation. J. Geophys. Res. Solid Earth 2019, 124, 125–148. [Google Scholar] [CrossRef]
- Yang, Z.; Tao, M.; Ranjith, P.G.; Zhuang, D.D.; Memon, M.B.; Luo, H. Multiscale damage and thermal-stress evolution characteristics of rocks with thermal storage potential under thermal shocks. J. Energy Storage 2024, 83, 110631. [Google Scholar] [CrossRef]
- Luo, S.Y.; Dou, B.; Tian, H.; Chen, J.; Xiao, P.; Zhang, S. Comparative experimental study on physical and mechanical properties of granite after natural cooling and under real-time high temperature. Earth Sci. Front. 2020, 27, 178–184. [Google Scholar] [CrossRef]
- Yin, T.B.; Shu, R.H.; Li, X.B.; Wang, P.; Liu, X.L. Comparison of mechanical properties in high temperature and thermal treatment granite. Trans. Nonferrous Met. Soc. China 2016, 26, 1926–1937. [Google Scholar] [CrossRef]
- Zhang, Z.Z.; Gao, F.; Xu, X.L. Experimental study of temperature effect of mechanical properties of granite. Rock Soil Mech. 2011, 32, 2346–2352. [Google Scholar] [CrossRef]
- Guo, P.Y.; Zhang, P.; Bu, M.H.; Wang, J.M.; Zheng, X.; He, M.C. Microcracking behavior and damage mechanism of granite subjected to high temperature based on CT-GBM numerical simulation. Comput. Geotech. 2023, 159, 105385. [Google Scholar] [CrossRef]
- Zhao, Z.H. Thermal influence on mechanical properties of granite: A microcracking perspective. Rock Mech. Rock Eng. 2016, 49, 747–762. [Google Scholar] [CrossRef]
- Zhou, Y.; Gao, Y.T.; Wu, S.C.; Yan, Q.; Sun, H. An equivalent crystal model for mesoscopic behaviour of rock. Chin. J. Rock Mech. Eng. 2015, 34, 511–519. [Google Scholar] [CrossRef]
- Chen, P.Y. Loading rate effect analysis on rock particle flow model under uniaxial compression. Chin. J. Undergr. Space Eng. 2018, 14, 635–642. [Google Scholar]
- Liu, P.; Liu, J.X.; Liu, Y.T. Particle flow simulation of crack extension in granite. Sichuan Build. Sci. 2016, 42, 100–103. [Google Scholar] [CrossRef]
- Wu, Z.J.; Li, M.Y.; Li, W. Thermal-stress-aperture coupled model for analyzing the thermal failure of fractured rock mass. Int. J. Geomech. 2020, 20, 04020176. [Google Scholar] [CrossRef]
- Kranz, R.L. Crack-crack and crack-pore interactions in stressed granite. Int. J. Rock Mech. Min. Sci. Geomech. Abstr. 1979, 16, 37–47. [Google Scholar] [CrossRef]
- Liu, H.; Zhang, K.; Shao, S.S.; Ranjith, P.G. Numerical investigation on the mechanical properties of Australian Strathbogie granite under different temperatures using Discrete Element Method. Rock Mech. Rock Eng. 2019, 52, 3719–3735. [Google Scholar] [CrossRef]
- Yang, S.Q.; Ranjith, P.G.; Jing, H.W.; Tian, W.L.; Ju, Y. An experimental investigation on thermal damage and failure mechanical behavior of granite after exposure to different high temperature treatments. Geothermics 2017, 65, 180–197. [Google Scholar] [CrossRef]
- Gao, F.Q.; Kang, H.P.; Wu, Y.Z. Experimental and numerical study on the effect of calcite on the mechanical behaviour of coal. Int. J. Coal Geol. 2016, 158, 119–128. [Google Scholar] [CrossRef]
- Rutter, E.H.; Brodie, K.H. Mechanistic interactions between deformation and metamorphism. Geol. J. 1995, 30, 227–240. [Google Scholar] [CrossRef]
- Yang, K.; Zhang, F.; Meng, F.Z.; Hu, D.W.; Tan, X.F. Effect of real-time high temperature and loading rate on mode I fracture toughness of granite. Geotherm. Energy 2022, 10, 14. [Google Scholar] [CrossRef]
- Xu, X.L.; Kang, Z.X.; Ji, M.; Ge, W.X.; Chen, J. Research of microcosmic mechanism of brittle-plastic transition for granite under high temperature. Procedia Earth Planet. Sci. 2009, 1, 432–437. [Google Scholar] [CrossRef]
- Su, H.; Dang, C.H.; Li, Y.J. Study of numerical simulation of acoustic emission in rock of inhomogeneity. Rock Soil Mech. 2011, 32, 1886–1890. [Google Scholar] [CrossRef]
- Xu, X.L.; Gao, F.; Zhou, Q.; Chen, J. Energy analysis of rock deformation and failure process after high temperature. J. Wuhan Univ. Technol. 2011, 33, 104–107, 124. [Google Scholar] [CrossRef]


| T/(°C) | σs/(MPa) | εs/(10−3) | E/(GPa) |
|---|---|---|---|
| 25 °C | 149.42 | 6.53 | 31.87 |
| 200 °C | 171.64 | 6.67 | 33.39 |
| 300 °C | 164.89 | 7.12 | 30.07 |
| 400 °C | 134.09 | 7.91 | 23.20 |
| 500 °C | 123.01 | 9.05 | 18.42 |
| 600 °C | 78.81 | 11.63 | 8.98 |
| Parameter Name | Value | |
|---|---|---|
| Specific heat capacity/(J kg−1 K−1) | 1015 | |
| Thermal conductivity/(W m−1 K−1) | 3.5 | |
| Thermal expansion coefficient/(K−1) | quartz | 24.3 × 10⁻⁶ |
| plagioclase | 8.7 × 10⁻⁶ | |
| potassium feldspar | 14.1 × 10⁻⁶ | |
| mica | 3.0 × 10⁻⁶ | |
| Particles and Parallel Bonds | Quartz | Plagioclase | Potassium Feldspar | Mica |
|---|---|---|---|---|
| Density/(kg∙m−3) | 2650 | 2630 | 2560 | 3050 |
| Particle–particle contact modulus/(GPa) | 40 | 32 | 32 | 25 |
| Pb modulus/(GPa) | 40 | 32 | 32 | 25 |
| Contact normal to shear stiffness ratio | 1.5 | 1.5 | 1.5 | 1.5 |
| Particle friction coefficient | 0.5 | 0.5 | 0.5 | 0.5 |
| Pb tensile strength/(MPa) | 172 ± 60 | 148 ± 60 | 160 ± 60 | 130 ± 60 |
| Pb cohesion strength/(MPa) | 344 ± 120 | 296 ± 120 | 320 ± 120 | 260 ± 120 |
| Pb friction angle/(°) | 15 | 15 | 15 | 15 |
| Smooth-Joint Bonds | Grain Boundaries |
|---|---|
| Normal stiffness/(GPa∙m−3) | 31 × 103 |
| Shear stiffness/(GPa∙m−3) | 27 × 103 |
| Sj friction angle | 0.5 |
| Sj tensile strength/(MPa) | 29 ± 7 |
| Sj cohesion strength/(MPa) | 105 |
| Sj friction angle/(°) | 25 |
Disclaimer/Publisher’s Note: The statements, opinions and data contained in all publications are solely those of the individual author(s) and contributor(s) and not of MDPI and/or the editor(s). MDPI and/or the editor(s) disclaim responsibility for any injury to people or property resulting from any ideas, methods, instructions or products referred to in the content. |
© 2024 by the authors. Licensee MDPI, Basel, Switzerland. This article is an open access article distributed under the terms and conditions of the Creative Commons Attribution (CC BY) license (https://creativecommons.org/licenses/by/4.0/).
Share and Cite
Li, K.; Zhang, F. Study on the Meso-Failure Mechanism of Granite under Real-Time High Temperature by Numerical Simulation. Appl. Sci. 2024, 14, 4575. https://doi.org/10.3390/app14114575
Li K, Zhang F. Study on the Meso-Failure Mechanism of Granite under Real-Time High Temperature by Numerical Simulation. Applied Sciences. 2024; 14(11):4575. https://doi.org/10.3390/app14114575
Chicago/Turabian StyleLi, Kangwen, and Fan Zhang. 2024. "Study on the Meso-Failure Mechanism of Granite under Real-Time High Temperature by Numerical Simulation" Applied Sciences 14, no. 11: 4575. https://doi.org/10.3390/app14114575
APA StyleLi, K., & Zhang, F. (2024). Study on the Meso-Failure Mechanism of Granite under Real-Time High Temperature by Numerical Simulation. Applied Sciences, 14(11), 4575. https://doi.org/10.3390/app14114575