Article

Automatic Optimization System for Heat Source Layout of Multi-Chip Components Based on Multi-Software Integration

1
Changchun Institute of Optics, Fine Mechanics and Physics, Chinese Academy of Sciences, Changchun 130031, China
2
University of Chinese Academy of Sciences, Beijing 100049, China
*
Author to whom correspondence should be addressed.
Appl. Sci. 2024, 14(11), 4577; https://doi.org/10.3390/app14114577
Submission received: 1 April 2024 / Revised: 1 May 2024 / Accepted: 11 May 2024 / Published: 27 May 2024
(This article belongs to the Section Applied Thermal Engineering)

Abstract

:
This paper presents an automatic optimization system for the heat source layout of multi-chip modules, referred to as IOS. The system aims to optimize the heat source layout of multi-chip modules through the integration of multiple software tools. The IOS utilizes an optimization algorithm, WINDOW DOS, and other methods to achieve this goal. Initially, two optimization strategies are introduced which are utilized in conjunction with the Non-dominated Sorting Genetic Algorithm-II(NSGA-II). Subsequently, a simplified thermal model of the multi-chip module is applied to the IOS. The automatic optimization module is then used to optimize the heat source layout. In the end, we simulated and analyzed the application results. The simulation analysis reveals that when the temperature extreme value index is optimized, the PCB board’s transient temperature range falls within [343.14 K, 344.09 K]. Similarly, when the temperature homogeneity index is optimized, the PCB board’s transient temperature range falls within [343.39 K, 344.21 K]. Comparing these results with the experience layout, the temperature difference is reduced by 76.36% and 79.60%, respectively. The optimization results demonstrate that the IOS has a significant impact, offering remarkable optimization effects, low cost, high efficiency, and a more uniform temperature distribution. These findings indicate that the IOS holds promising potential for applications and provides value in optimizing the heat source layout of multi-chip modules.

1. Introduction

Against the backdrop of the increasing demand for intelligence in high-tech fields such as the military, aerospace, computer, communication, and automotive industries, the Multi-chip Module (MCM) has been favored as a new technology that breaks through the inherent bottlenecks of traditional packaging due to its high performance, miniaturization, and high reliability [1,2,3,4]. However, due to the continuous increase in power consumption within integrated circuits, the heat issue in MCM is becoming increasingly prominent. According to relevant research reports, nearly 60% of electronic component failures are due to temperature anomalies, with the failure rate doubling for every 10 °C increase in chip junction temperature [5,6]. Therefore, thermal management of chips is crucial. This paper focuses on Heat Source Layout Optimization (HSLO) in MCM, treating chip layout as the heat source layout. It explores how to place all chips on the substrate to ensure uniform heating without compromising equipment performance and design requirements. This research has important practical significance and application prospects, providing new ideas and solutions for the thermal management of MCM [7]. Currently, scholars have proposed various research methods for the optimization of heat source layout in MCM. For example, Ning Y et al. proposed a method using a particle swarm algorithm to optimize the established layout mathematical model [8], Yang J et al. introduced a novel, improved thermal directional placement algorithm [9], and Lopez-Villegas J M et al. proposed a systemic approach to enhance the quality factor of RF-integrated inductors [10]. These methods typically start with approximating a simulation using simple models, followed by the optimization of the layout of MCM, but lack simulation comparisons. Chen X et al. proposed a method that establishes a surrogate model of MCM and combines the HSLO optimization algorithm for layout optimization [11]. Sun J et al. introduced a heat source layout reverse design method based on the deep learning show, attend, and read model [12]. Qian C et al. presented a layout design method based on adaptive neural networks [13]. These methods have improved accuracy and assurance, but training costs continue to rise with increasing accuracy requirements. Cuco A P C et al. proposed a multi-software integration method combining CAD with optimization algorithms [14]. Chang Y K applied the system engineering design tool to conceptual designs for small satellites [15]. Z Li et al. addressed the effective payload packaging design problem in satellite modules by proposing a hybrid multi-institution optimization method [16]. These methods utilize physical models established by simulation software which are closer to actual engineering applications and avoid the expensive costs associated with high training. This paper adopts the physical model approach. However, it is necessary to validate the optimization results through simulation and, as the model complexity and iteration times increase, the costs in terms of human labor and time also increase. Xiong and colleagues applied a system framework in spacecraft thermal design that significantly reduced human and time costs [17]. Therefore, this article adopts the conceptual framework of this system to redesign an automated system for thermal source layout optimization. This system aims to enhance optimization efficiency while ensuring the quality of the optimization results.
This paper utilized a multi-software integration optimization method to address the heat source layout optimization problem in MCM. Firstly, a simplified thermal physics model was established, and the NSGA-II algorithm was applied for optimization. Subsequently, the optimization results were compared and validated against empirical layouts using the WINDOWS DOS command line to automate the entire optimization and validation process. Through simulation analysis, the results showed that the automatic optimization system developed in this study could effectively reduce temperature differences in heat source layouts while ensuring high precision, thereby improving the temperature uniformity of the heat source layout. Additionally, this system reduced human labor costs, avoided human errors, and was easy to operate. These characteristics make this study valuable and significant in the field of heat source layout optimization.

2. Automatic Optimization System Framework

Since the DOS command is an important tool for linking the macro file generation module, simulation module, data processing module, and automatic optimization module in the automatic optimization system, this section will focus on introducing the process and function of the DOS command used in the automatic optimization system. Additionally, the section will also introduce the NSGA-II algorithm used in the automatic optimization module to achieve optimization functionality.

2.1. Multi-Software Integration Framework Based on DOS Command

The framework was designed to avoid the manual, repetitive collection of data samples, thus reducing the labor costs involved. Simultaneously, it aimed to accommodate essential software tools such as MATLAB, Python, and NX/SST. Within this framework, MATLAB incorporates the multi-objective optimization algorithm NSGA-II to iteratively update the design parameters of the MCM component heat source layouts. Python is primarily responsible for centralizing the processing of various results from MATLAB, NX/SST, and the DOS command line, among others. NX/SST focuses on conducting thermal analysis simulations of MCM component models, providing data for multi-objective optimization and result validation. These software components are interconnected through batch scripts written in Go language for the DOS command line. The DOS command line also drives and terminates the calculations and data flow of each software. The overall automated framework process is depicted in Figure 1, encompassing file operations, MATLAB, Python, NX/SST, and other major DOS command line modules.
(1) DOS command 1 is a preparatory task responsible for deleting the existing MODEL.MACRO file. This file is a macro program file developed for the NX/SST software. It records the changes made to the model, and modifying variables in this file allows for adjustments to the model parameters. Deleting the existing MACRO file is done to prevent conflicts with subsequently generated MACRO files.
(2) DOS command 2 opens the MATLAB program and executes the PARACHANGE.M file. This file is responsible for optimizing the thermal layout of MCM components. Upon completion of the DOS command 2, a new PARACHANGE.M file, based on the information from the new generation of populations, replaces the original file in the MACRO file.
(3) DOS command 3 is used to delete the existing simulation results RESULT.XLXS file. This file stores model result data related to NX/SST software execution of MODEL.MACRO. Deleting the existing XLXS file help avoid conflicts with the new XLXS file generated by the DOS command 4.
(4) DOS command 4 opens NX/SST to execute the new MODEL.MACRO file outputted by the DOS command 2 and outputs the RESULT.XLXS file.
(5) DOS command 5 deletes the existing population fitness FITNESS.TXT file. This file stores data about population fitness values (generated by the DOS command 6). Deleting the existing FITNESS file also prevents conflicts with the FITNESS file outputted in the next round.
(6) DOS command 6 opens the Python program and executes the DATAPOSTPROCESS.PY file. This file reads the RESULT.XLXS file generated by the DOS command 3, processes the data within it, calculates the population’s fitness values, and generates the FITNESS.TXT file.
After detailing each DOS command line and understanding how each software is invoked, it is also necessary to introduce the specific content of the optimization module, which is also part of the optimization design in this paper.

2.2. Automatic Optimization Module Based on NSGA-II Algorithm

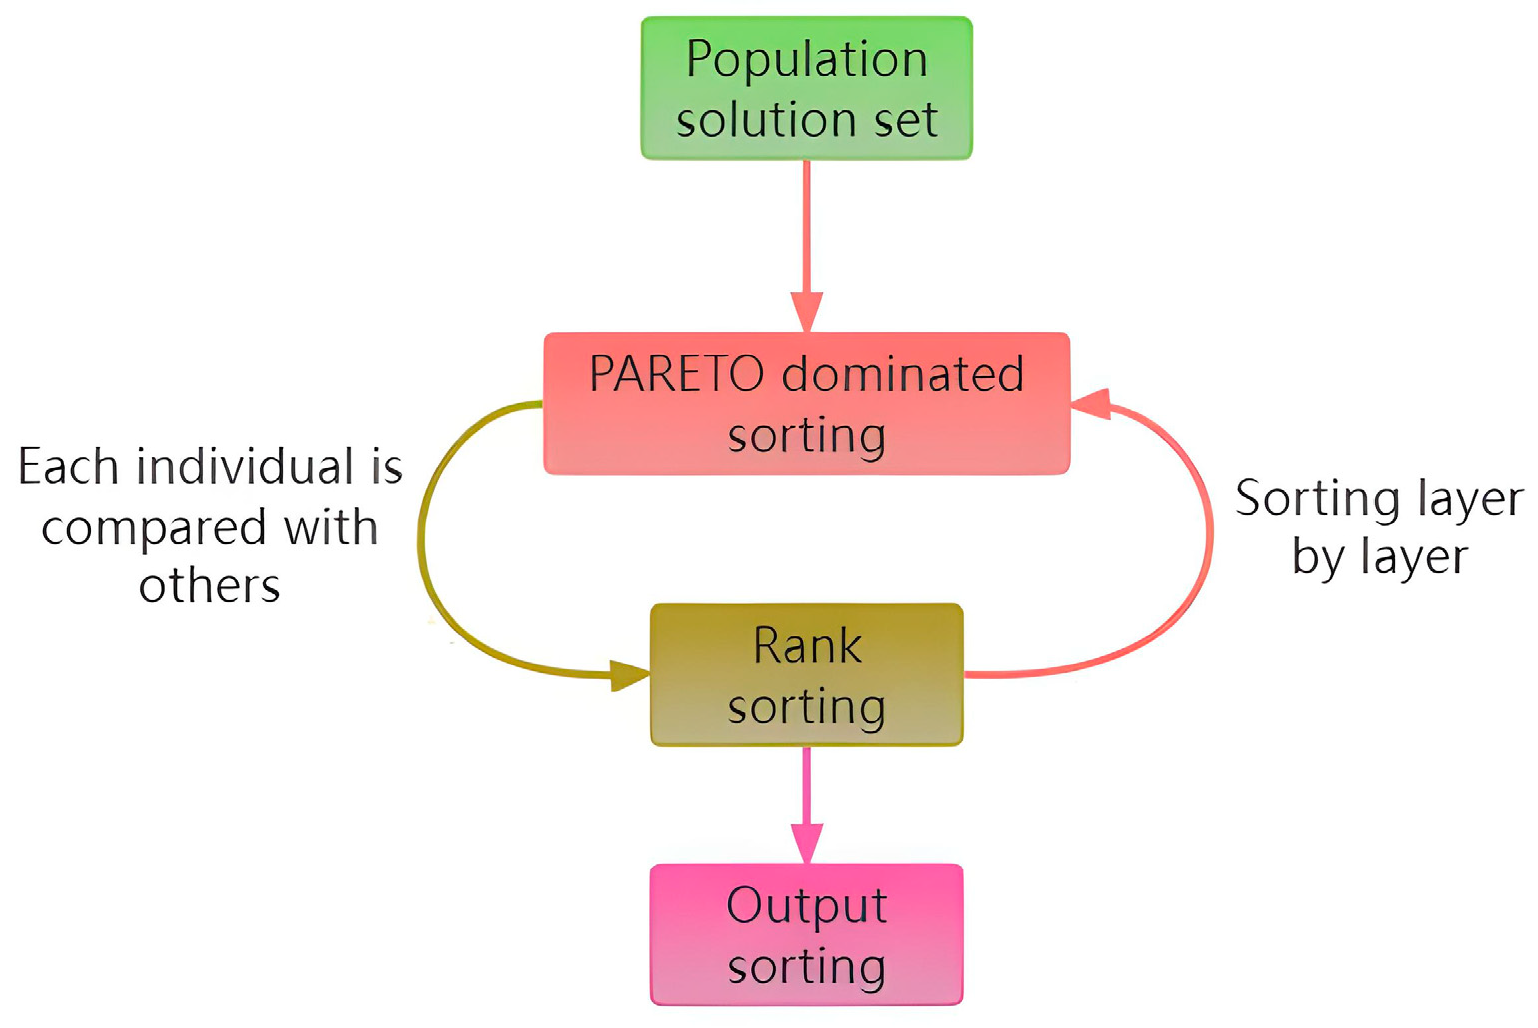
2.2.1. Fast Non-Dominated Sorting

The fast non-dominated sorting strategy is an optimization strategy chosen in this study to address the heat source layout optimization problem. This strategy was initially proposed by Deb K et al. to reduce the complexity of multi-objective evolutionary algorithms [18]. Due to its significant low computational cost and stable convergence, this study applied this strategy to the NSGA-II optimization algorithm, and the algorithm process is illustrated in Figure 2:
(1) Population solution set: find population solution set by the MCM thermal model, and use it as input for the next step.
(2) PARETO-dominated sorting: first, determine the non-domination rank n (n = 0, 1, 2, …) and compare each individual with every other individual to find the PARETO front [19]. The group of individuals with the non-domination rank n will be used as input for the next step.
(3) Rank sorting: put the input solution into the solution set at domination rank n, then update the domination rank to n + 1 and the remaining individuals not in the n rank solution set in the input for the previous step, forming a loop with the previous step until there are no more remaining individuals.
(4) Output sorting: output all domination ranks.
Fast non-dominated sorting is a strategy that quickly filters out the PARETO optimal population of this generation. However, relying solely on this strategy can lead to results getting stuck in local optimum. To achieve global optimum, another strategy will be introduced below.

2.2.2. Elitist Preservation Strategy

In the above non-dominated sorting process, a series of optimal solutions are often obtained. Choosing only one optimal solution can easily lead to loss in the next round of iterative updates, causing to be trapped in a local optimum. To address this drawback, an elite preservation strategy needs to be added. This strategy directly combines the parent population and the offspring population to form a new population, thereby preserving, to some extent, the genes of a series of optimal solutions.
The population update is carried out according to the following principles: to merge the parent population C i and the offspring population D i into a new population R i , a new parent population C i + 1 is generated by the group i. According to the order of PARETO levels from high to low, the entire hierarchical population is placed into the parent population C i + 1 until, at a certain level, each individual in that level cannot be included in the parent population C i + 1 . Following the order of crowding distance from high to low, individuals are successively placed into the parent population C i + 1 until the parent population C i + 1 is full.
For a given population of size n at generation time t, P t = a 1 t , a 2 t , , a n t , it is generally described as:
f m a x ( t ) = m a x | f ( a 1 ( t ) ) , f ( a 2 ( t ) ) , , f ( a n ( t ) ) | f m a x ( t + 1 ) = m a x | f ( a 1 ( t + 1 ) , f ( a 2 ( t + 1 ) , , f ( a n ( t + 1 ) ) | i f   f m a x ( t ) > f m a x ( t + 1 )   t h e n r e p l i c a t e   | d k ( t ) | = { a k ( t ) | f ( a k ( t ) ) > f m a x ( t + 1 ) , a k ( t ) P ( t ) } k = 1 ,   o r   k = 1,2 , , K r e p l a c e   r a n d o m l y   { a j ( t + 1 ) P ( t )   w i t h   { d k ( t ) } } j = 1 ,   o r   j = 1,2 , , K o r   r e p l a c e   t h e   w o r s t   o n e s   o f   { a j ( t + 1 ) P ( t )   w i t h   { d k ( t ) } } e n d   i f
The two strategies mentioned above greatly enhance the optimization module. To further elaborate on the specific structure of the optimization module, the following sections will combine the two optimization strategies with the roles of each software to explain the specific technical processes in more detail.

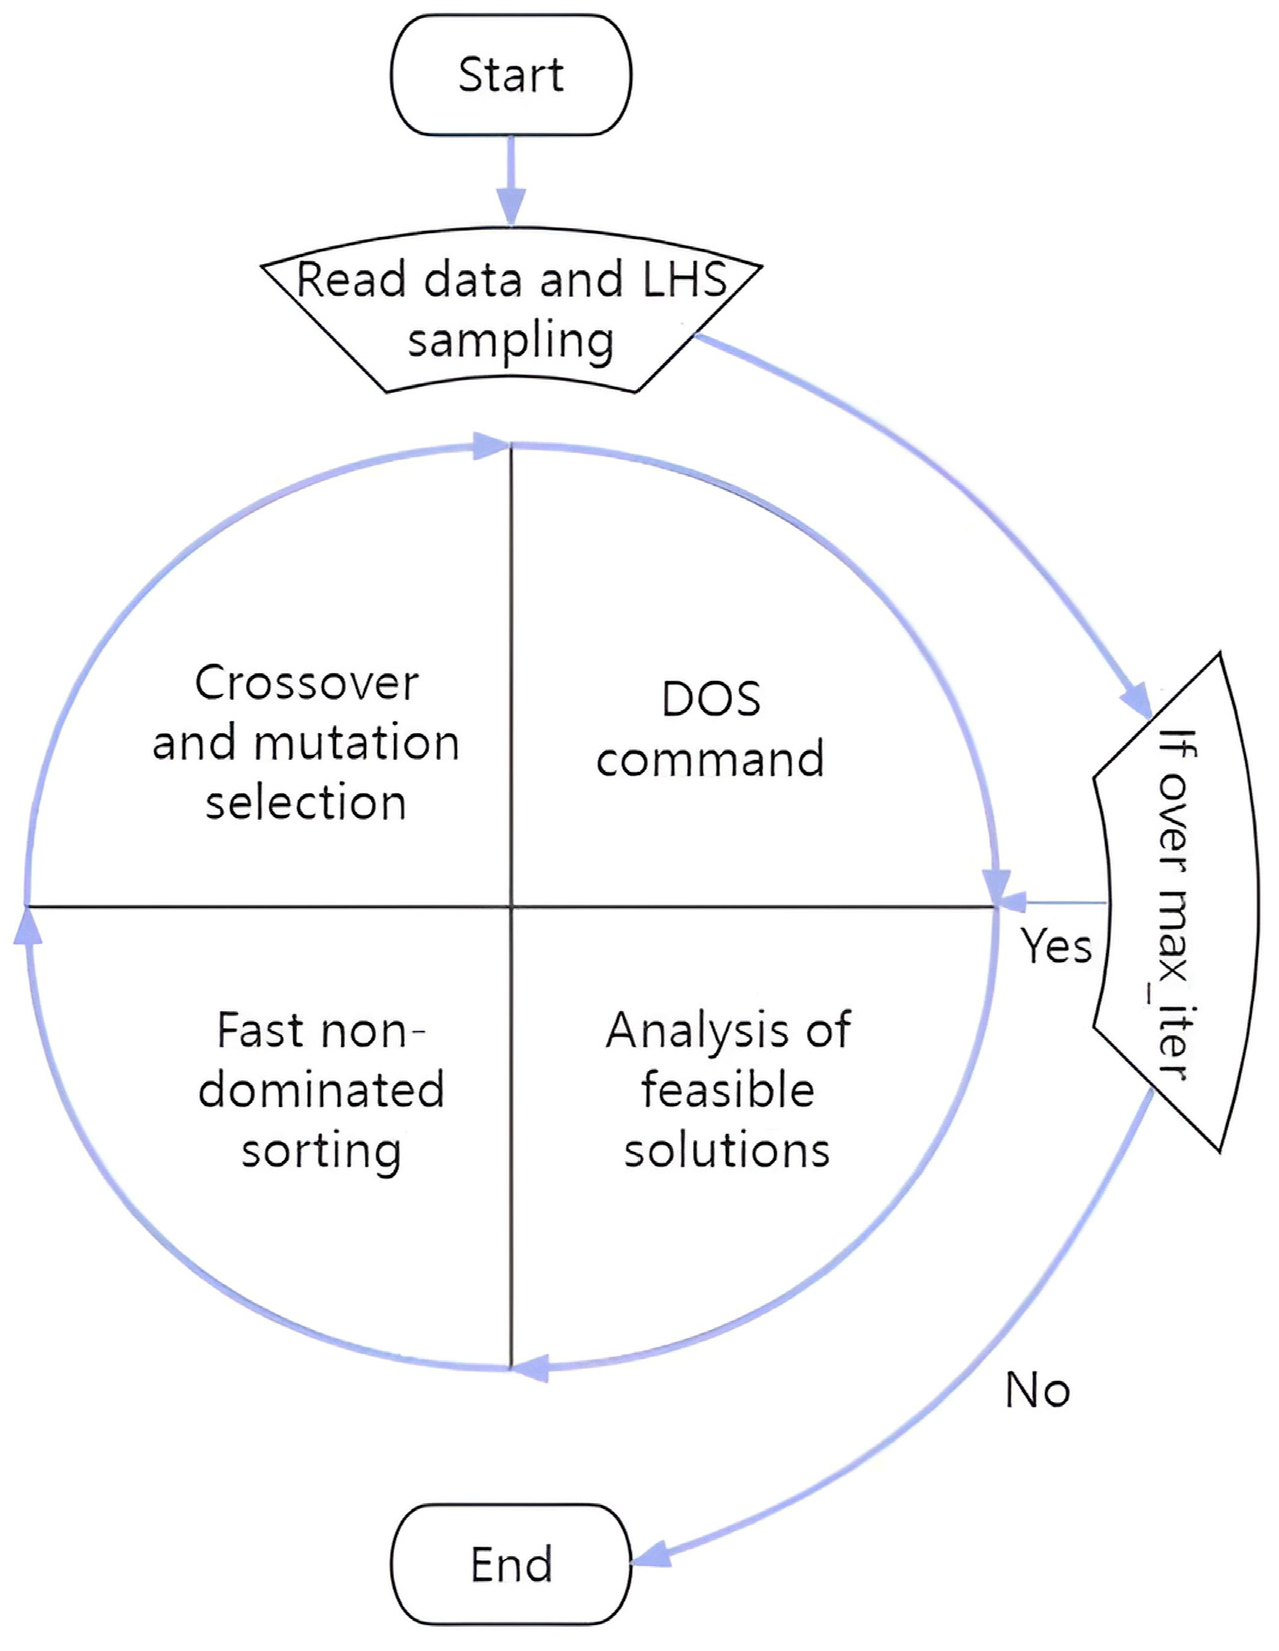
2.2.3. Build Automatic Optimization Module

In the automatic optimization module, the first step is to determine the design variables, constraints, and optimization metrics of the problem to be optimized. The Latin hypercube sampling method is used to uniformly sample the design space and generate the initial population required for the NSGA-II algorithm. Then, based on the constraints, individuals that do not meet practical or allowed criteria are eliminated. Next, the DOS automation framework is called to pass the modified population information to a MATLAB program, generate executable files, and execute the NX/SST program. Finally, using Python, post-processing operations are performed on the generated result data to calculate the fitness value of each individual. All individuals are classified through fast non-dominated sorting, and genetic operations are performed to generate a new population. Through iterative loops, it is ensured that the overall quality of the population is not lower than the previous generation. Ultimately, based on a compromise strategy, an appropriate population is retained. The steps of the entire algorithm process are shown in Figure 3.
This section describes how the DOS commands link various pieces of software together and provides a detailed introduction to the strategies employed in the optimization module and the roles of each software. The aim is to present the specific technical processes of the entire automatic system. The following section will also elucidate the specific applications of the automatic system.

3. Application of Automatic Optimization System

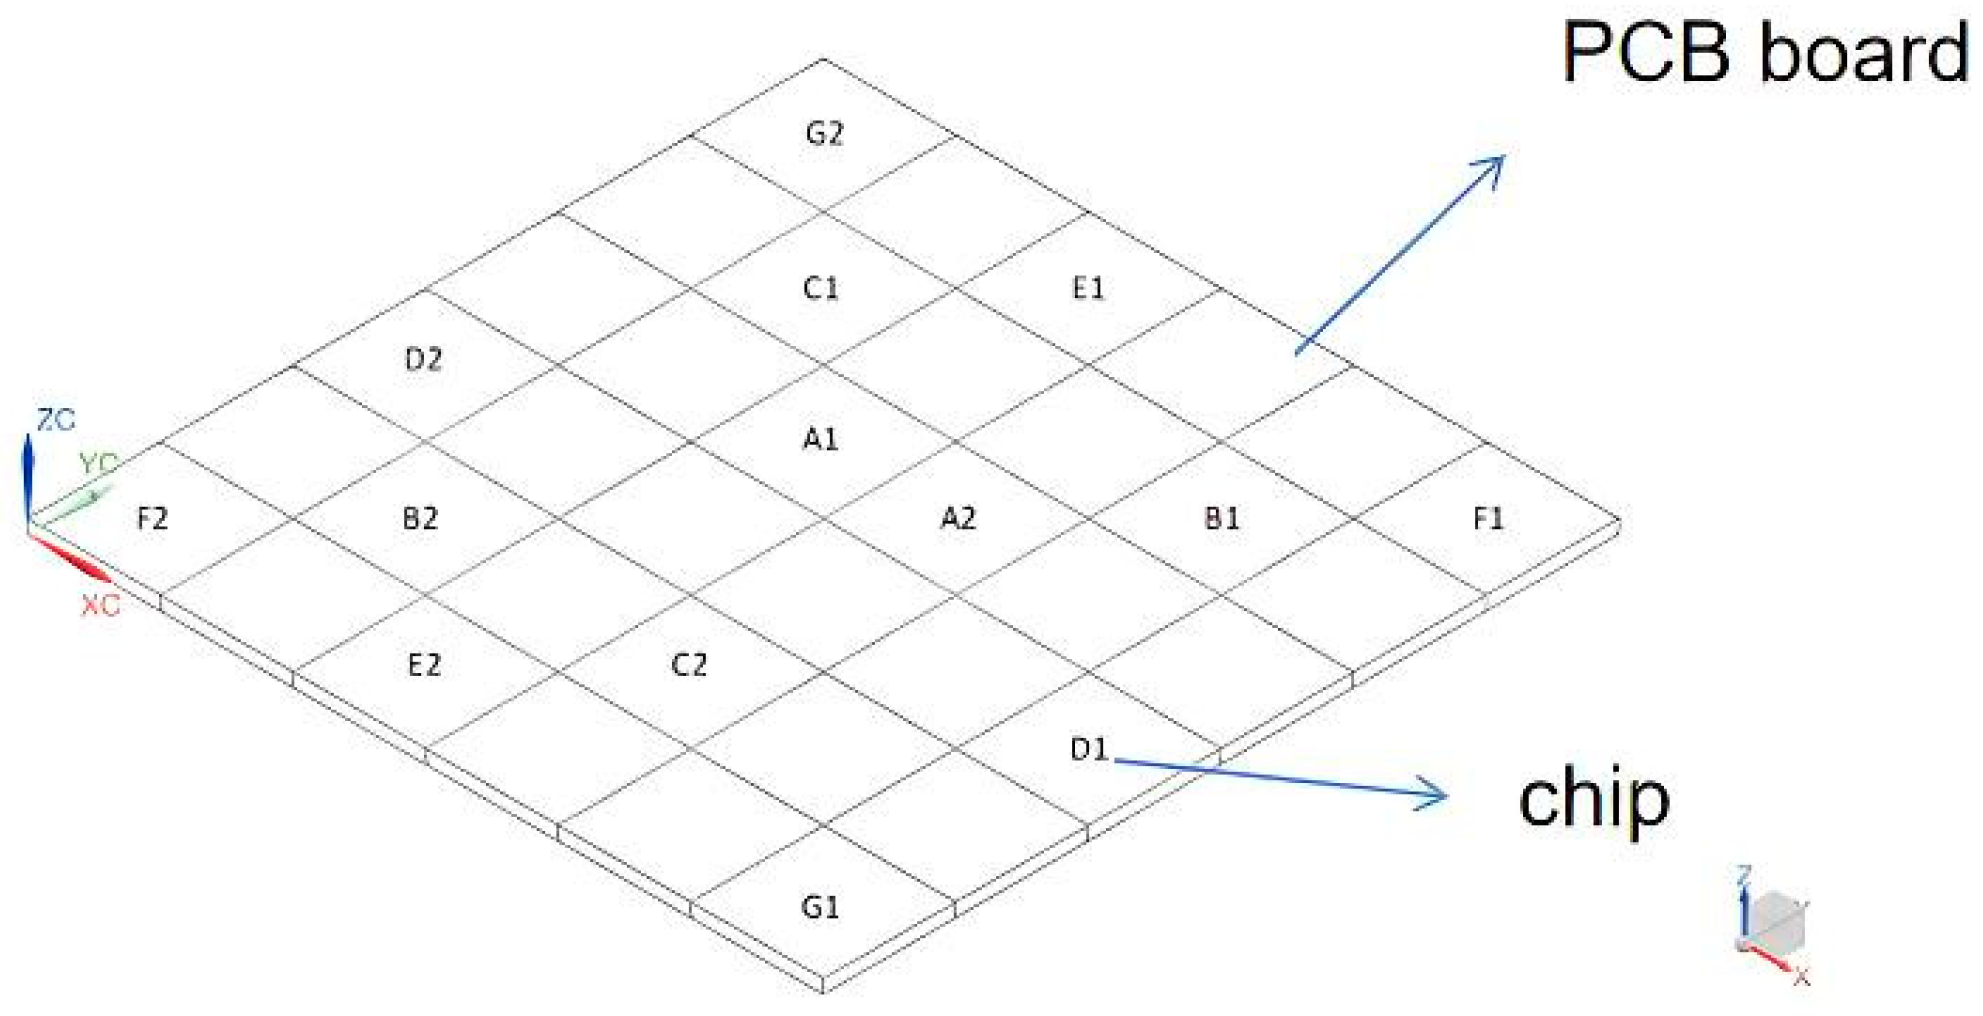
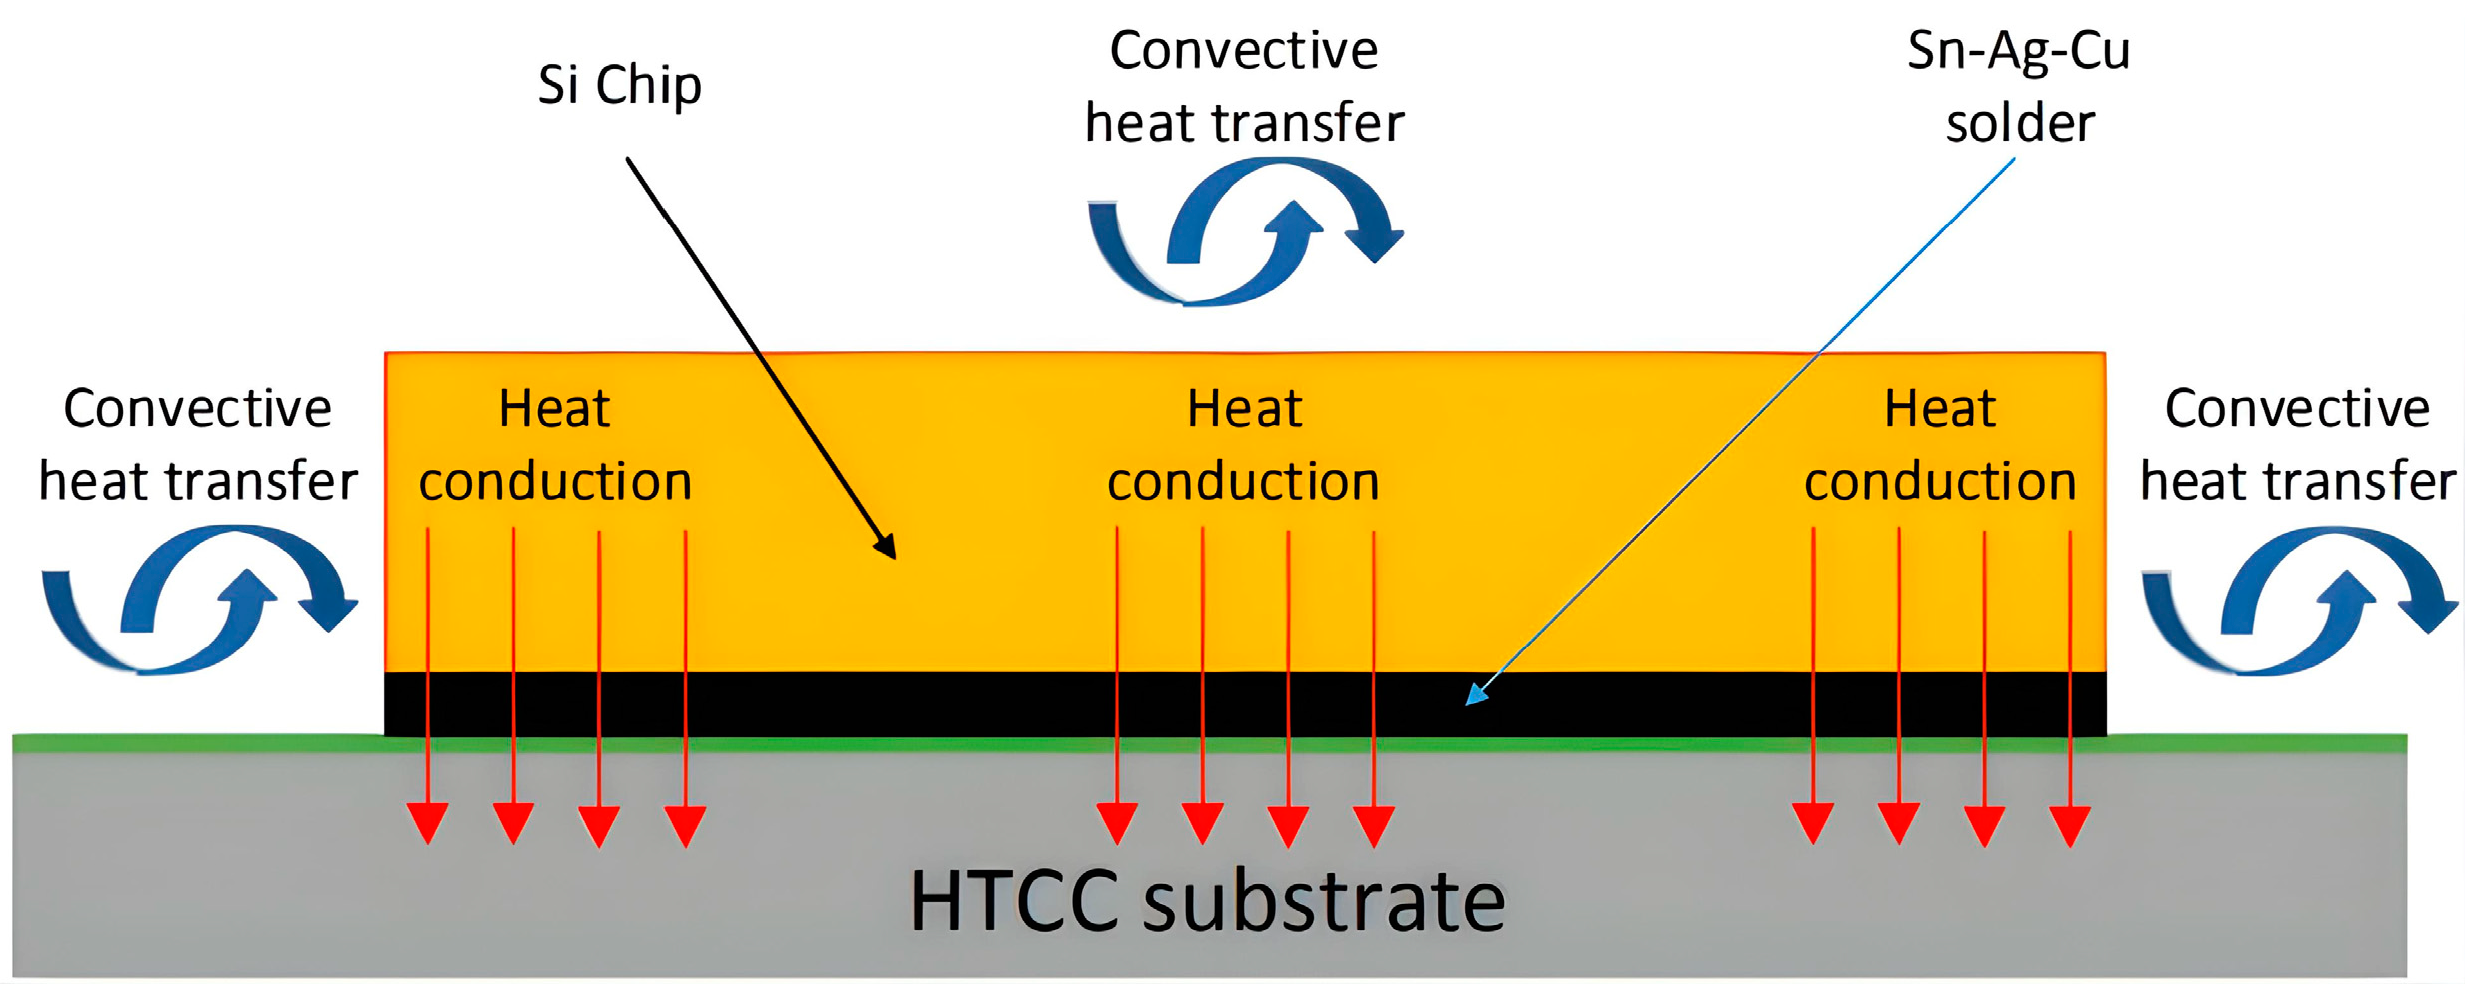
3.1. MCM Thermal Model

To verify the IOS, this paper takes the example of a multi-chip integrated circuit for space telescopes. Focused on the thermal management of the power electronic system heat source layout optimization problem, a simplified thermal model of a multi-chip PCB substrate was established for simulation verification. The model consists of the substrate and 14 chips, forming an MCM model as shown in Figure 4, where the thermal effects of each heat source are simplified as thermal loads acting on the corresponding unit substrate network.
The High-Temperature Co-fired Ceramic (HTCC) substrate is made by co-firing ceramic sheets with conductive pastes such as W, MO, and Mn at high temperatures. It has higher thermal conductivity (compared to ordinary PCB board), high heat resistance, high insulation, high strength, and a well-matched coefficient of thermal expansion, making it the optimal choice for the substrate of MCM components. Therefore, this paper uses it as the substrate for MCM components. Details of the relevant parameters are listed in Table 1, Table 2 and Table 3. Additionally, the structure of a single chip and a schematic diagram illustrating heat transfer as shown in Figure 5.
This part primarily introduces the specific structure of the MCM (Multi-Chip Module) along with various materials, dimensions, power consumption, and process parameters. It also provides a detailed environment description of the specific application employed by the automatic system.

3.2. Build MCM Optimization Equation

Before the automatic optimization framework for the MCM thermal layout, it is necessary to first construct the optimization equations for the MCM model, which involves determining the variable space, constraints, and objective function of the MCM model.
The MCM physical model mainly consists of 14 heat sources and a PCB board divided into specified dimensions. The problem can be abstracted as distributing 14 variable points in 36 grids in a reasonable manner to simultaneously minimize the local maximum temperature of the PCB board and maximize the temperature uniformity of the entire PCB board. Therefore, the MCM optimization equations are formulated as shown in Equations (1)–(4).
Variance:
x i i = 1,2 , 3 , , 14
Fitness:
m i n F 1 ( x i ) = m a x T n
m i n F 2 ( x i ) = m a x T n m i n T n n = 1,2 , 3 , , 36
S.T.
1 < x i < 36 , x Z i j , x i x j , i , j = 1,2 , 3 , , 14
In this context, x is the variable of the MCM model, T n is the temperature value of the number n grid. The variance refers to the variables of the MCM model, with a total of 14 variables, and each variable has the number of 1 36 sample space. The fitness function aims to minimize the maximum temperature of the grid while maximizing the temperature uniformity of the grid. S.T. represents the constraints, indicating that any two variables cannot have the same value, further specifying that chips cannot be placed in units 1 and 36. This constraint is applied to simulate real-world engineering limitations related to installation or processing factors.
This part utilizes specific constraints to describe the limitations of chip placement within the MCM which are also constraints added by the optimization module in the automatic system.

3.3. Sample Input Space Based on Latin Hypercube Sampling

When the automatic optimization framework starts the execution, the first step is to initialize the sample population for the NSGA-II algorithm. In this study, Latin Hypercube Sampling (LHS) was used to hierarchically and uniformly sample the variable space, as shown in Figure 6. Compared to Monte Carlo sampling and random sampling, LHS results in a more uniform sampling of the entire variable space. This aids algorithms in covering all corners of the sample space during the iterative search process, avoiding local optima and facilitating the discovery of the global optimum. Through LHS, it is ensured that the optimization algorithm has better global search capabilities, increasing the likelihood of finding the optimal solution.
This section introduces the sampling method chosen by the automatic system in its application. The selection of Latin Hypercube Sampling (LHS) allows the initial population of the optimization to consider sample points across the entire global space. This is done to maximize the likelihood of obtaining a globally optimal optimization result.

3.4. Build Automatic Optimization System Framework

After completing the preliminary work, including physical model modeling, building optimization equations, and recording macro files, the following steps are carried out according to the automatic optimization system framework:
(1) Initialize the population using the LHS method and pass the chromosome information of each individual containing the position encoding information of 14 heat sources to the NSGA-II algorithm.
(2) Decode the chromosome information of individuals using NSGA-II, call the MATLAB program through the DOS commands to pass the distribution parameters of 14 heat source positions, and output a new MACRO file.
(3) Open NX/SST to execute the macro file with the new heat source information, automate the change of the heat source positions on the PCB board in the physical model. Wait and continuously monitor if the NX/SST simulation is completed.
(4) After the simulation is finished, output temperature values of 100 PCB grid data points. Call a Python program to read the temperature file and process the data, calculate the maximum value of 36 temperature values and the reciprocal of the Mean Squared Error (MSE) as the fitness value in the fitness function.
(5) Transmit the calculated results back to the optimization algorithm as the fitness value of the individual. After all individuals in the population have obtained fitness values, NSGA-II performs fast non-dominated sorting on the population.
(6) Through operations such as crossover, mutation, and selection among parent populations, a new generation subpopulation is generated. Perform fast non-dominated sorting on the combined set of parent and offspring populations and select the top 40 high-fitness individuals as the new generation population.
(7) Repeat the above iterative calculations until the fittest individual in the population is selected. The chromosome encoding information represents the distribution of the optimized 14 heat sources on the PCB board.
The data flow of files, data, parameters, etc., in each step is shown in Figure 7, and the hyperparameter settings of the NSGA-II algorithm are detailed in Table 4.
This section provides a detailed description of the relevant parameters and installation restrictions of the MCM, along with the specific technical processes employed by the automatic system in its application. It particularly focuses on the detailed structure and technical processes of the optimization module within the automatic system.

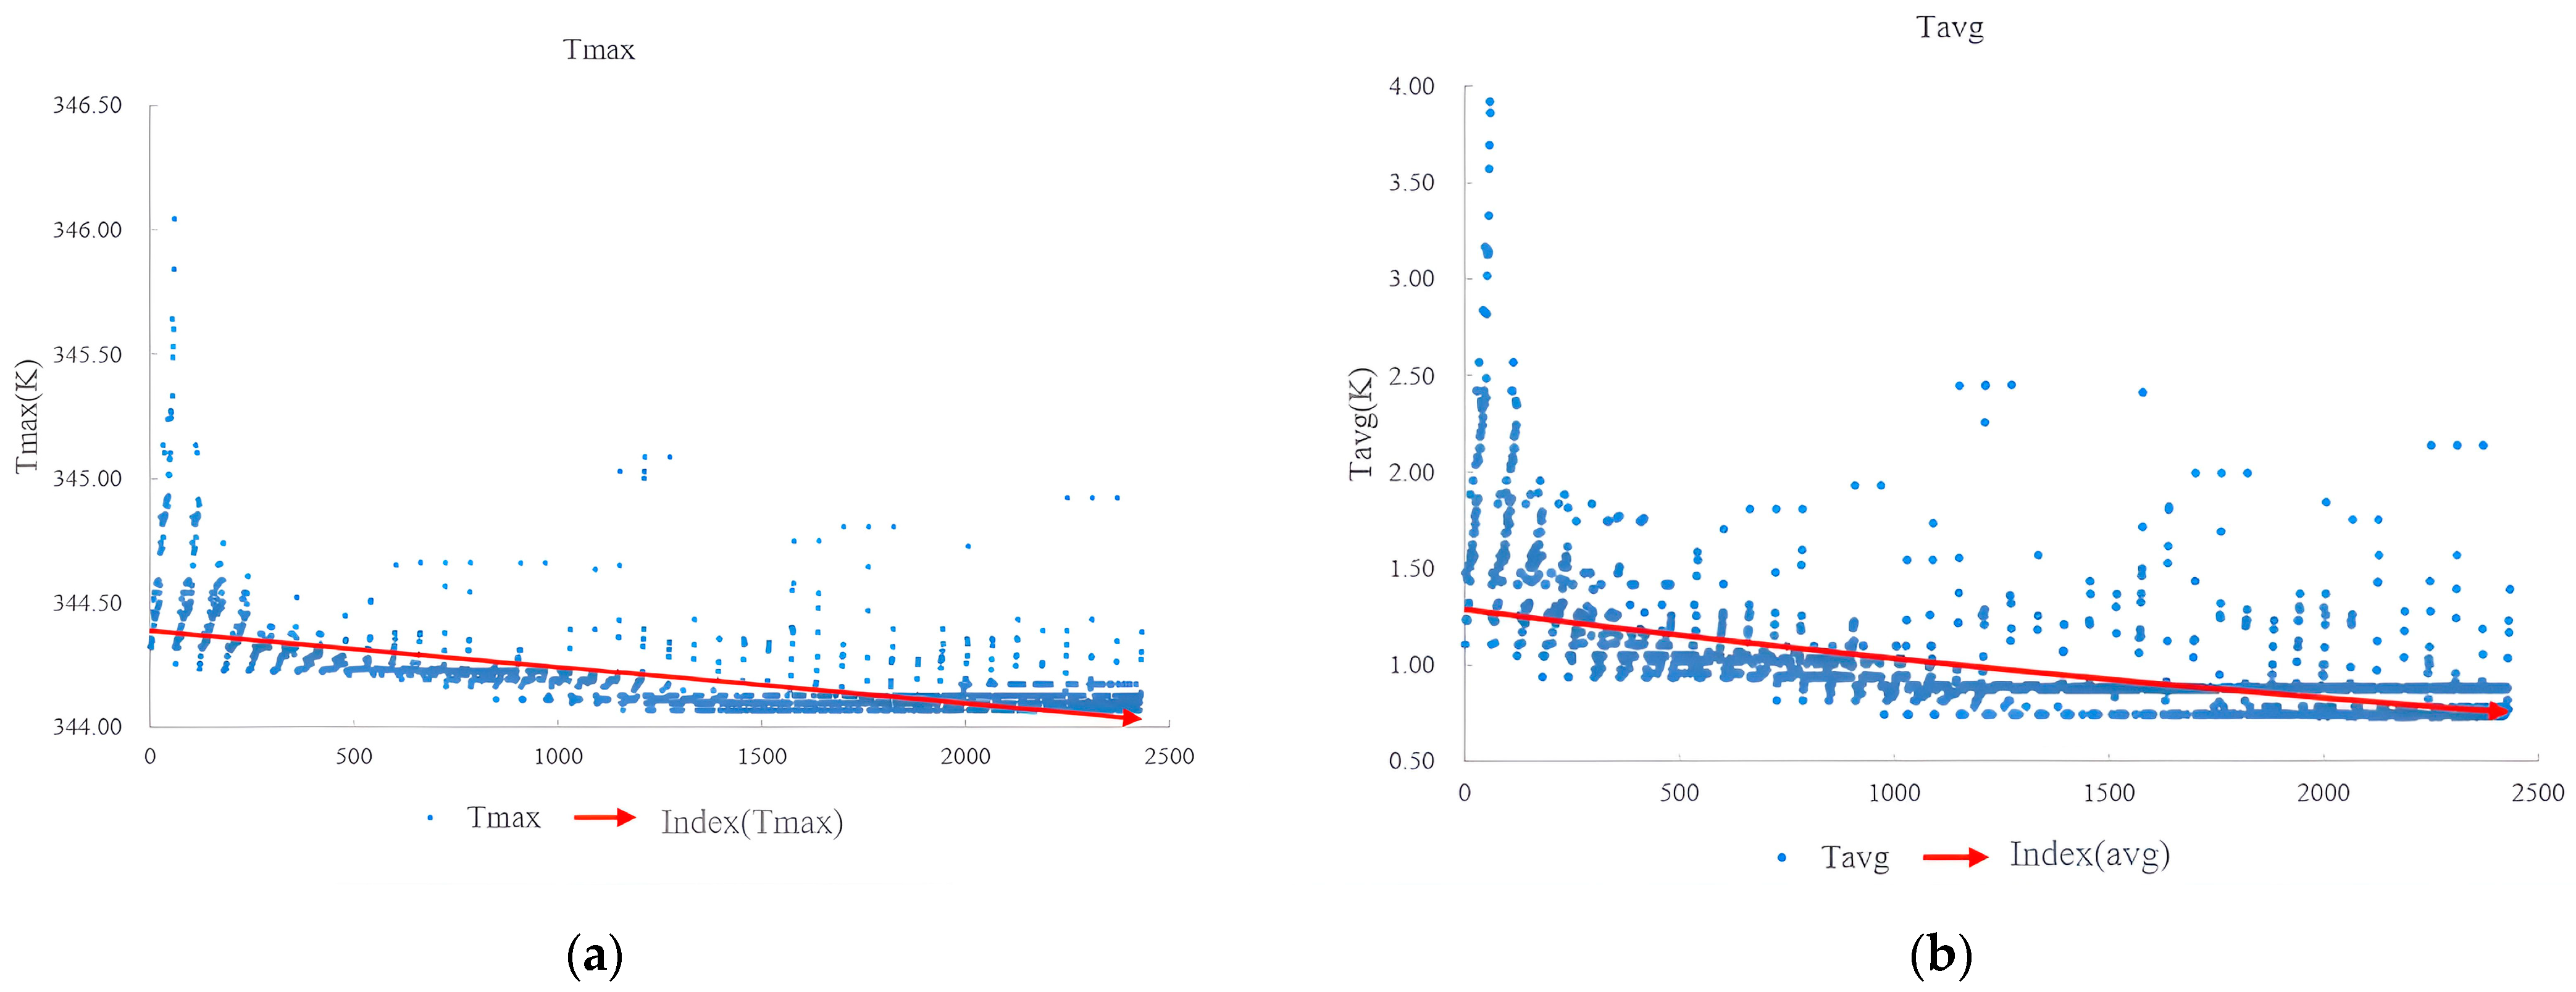
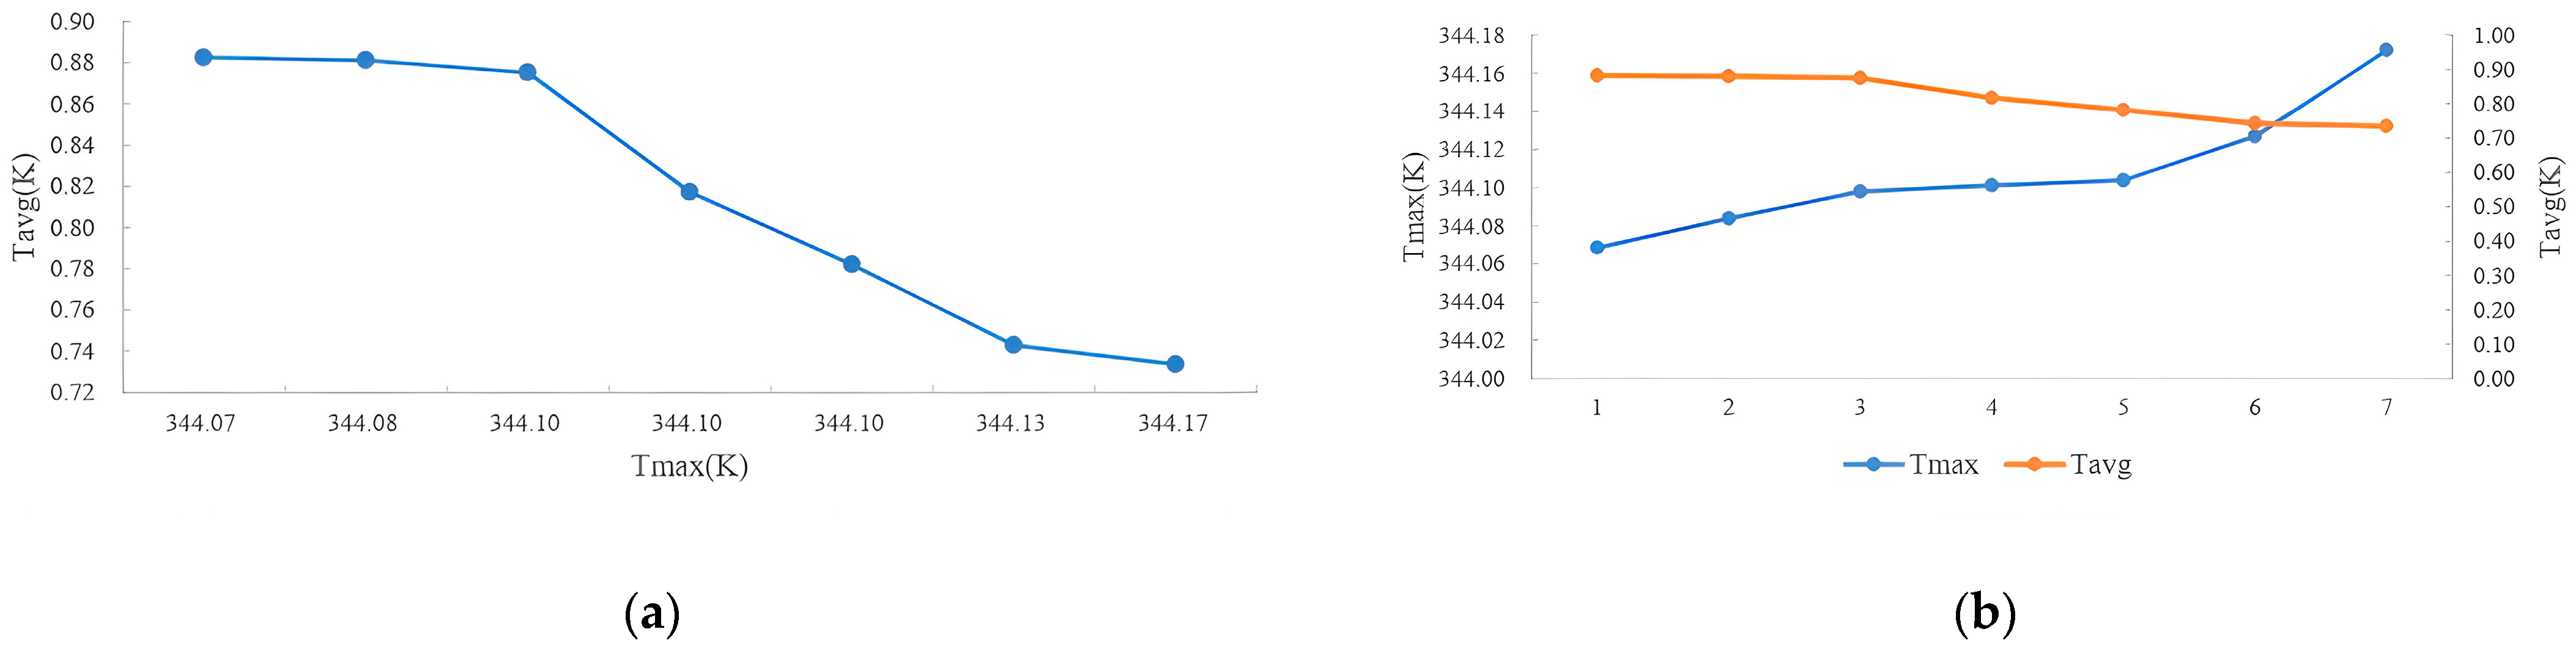
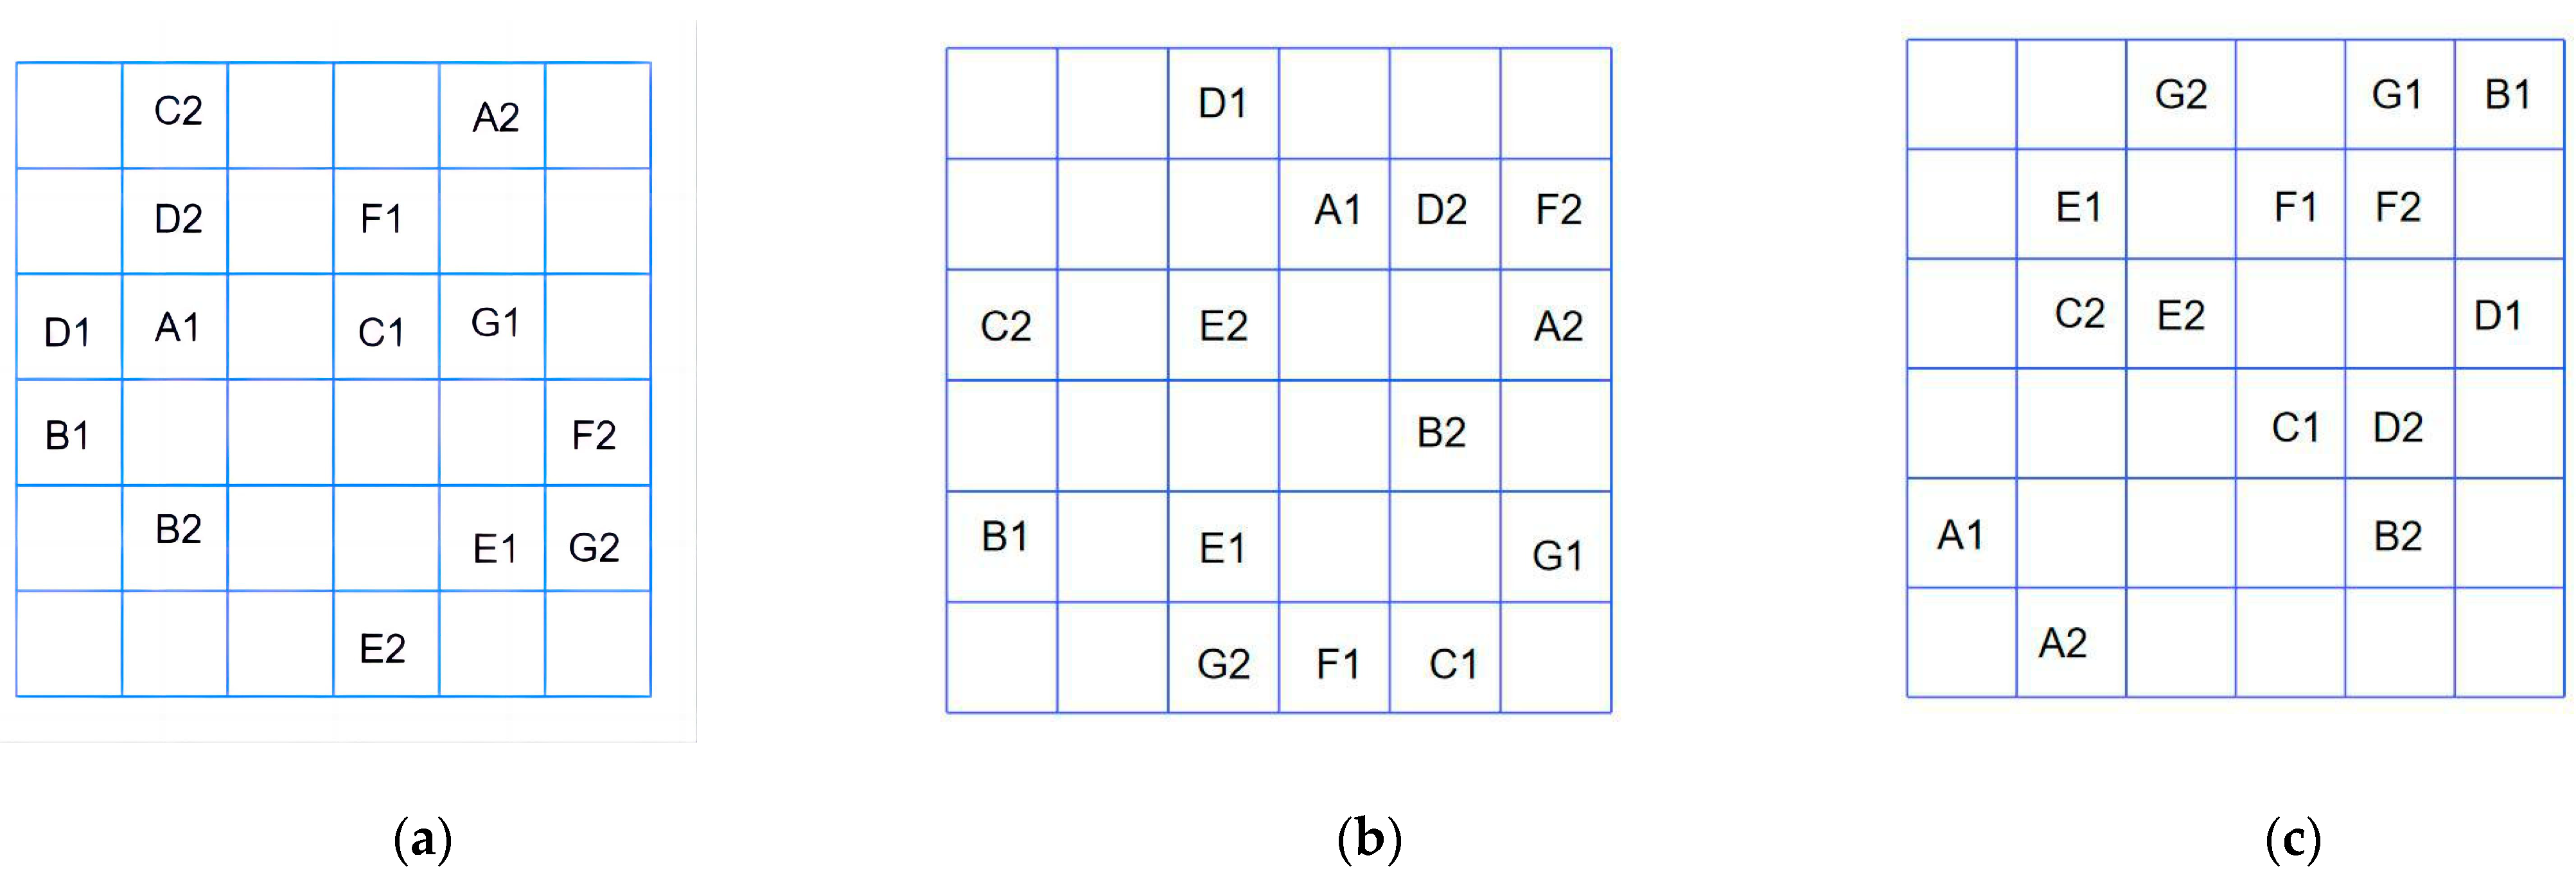
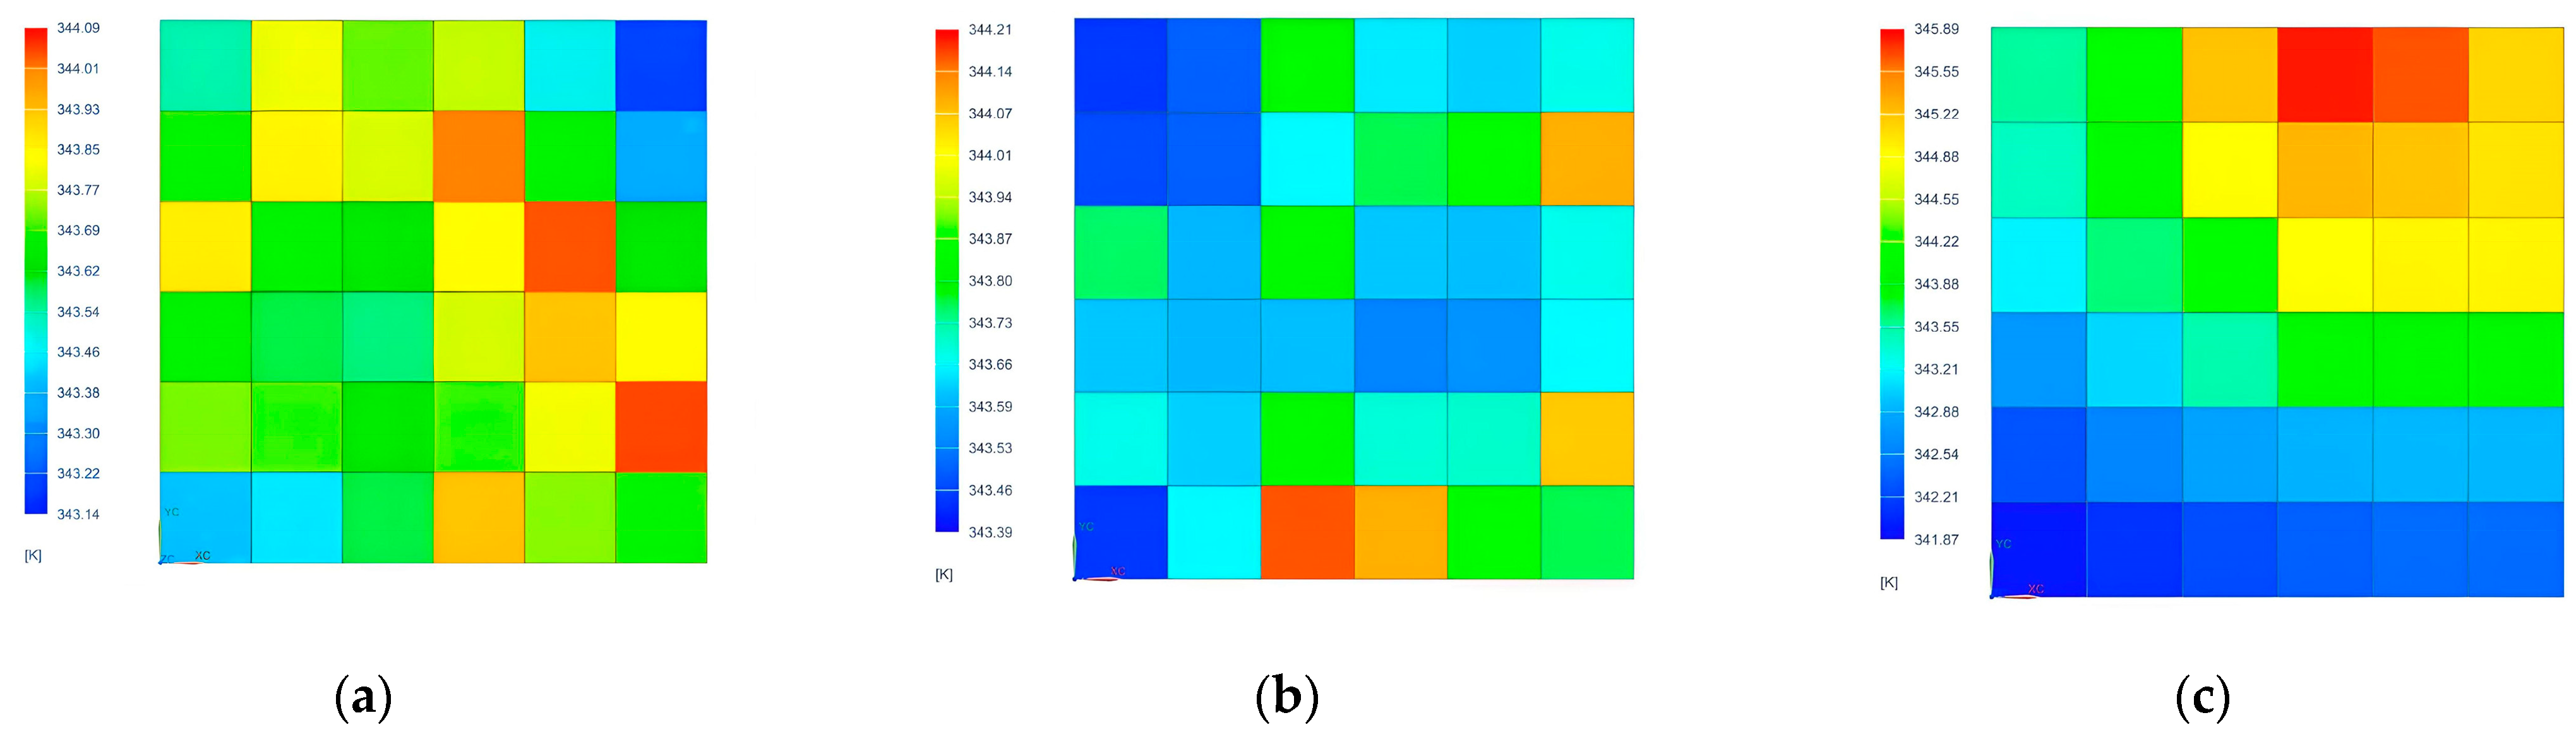
4. Simulation Result

At this stage, we have set the temperature range for the thermal source layout design at [335 K, 350 K]. Simulation results indicate that the temperature range falls within [341.87 K, 345.89 K], meeting the design requirements. However, to further optimize the layout effectiveness, we will use the established automated optimization system to refine the experiential layout.
After 40 rounds of iteration, the results of applying the automatic optimization system framework to MCM are presented based on the PCB board temperature extreme index and temperature uniformity index, as shown in Figure 8. Figure 8a displays the indices of all individuals in the 40 rounds of iteration and their exponential trend fitting, while the Figure 8b displays the same information. The exponential fitting results are shown in Formulas (2) and (3). The following results can be obtained: the temperature range of all solution sets is within [344.06 K, 346.05 K], and the temperature uniformity index is within [0.73 K, 3.93 K]. As the iterations progress, the fitness values of both indices show a continuous convergence trend, with the optimal temperature index reaching 344.06 K and the optimal uniformity index reaching 0.73 K.
T m a x : y = 344.39 e 4 E 07 x R 2 = 0.3318
T a v g : y = 1.2878 e 2 E 04 x R 2 = 0.3276
The solution to the MCM layout problem is a bi-objective optimization process, where the two indices are not independent but coupled, leading to a Pareto problem. In the IOF system, the 40 individuals generate a total of 2400 solution sets after 40 rounds of iteration. By correcting the solution sets with the constraint (8) and removing solutions that do not meet the constraints of the two indices, the Pareto front of MCM and the bi-objective Pareto feasible solutions are plotted, as shown in Figure 9a,b. The Pareto front consists of seven selected optimal solution sets that meet the engineering application constraints, with the temperature index within [344.06 K, 344.17 K], and the uniformity index within [0.73 K, 0.88 K].
The correctness of the optimization system’s automatic writing of variables and its optimization results were verified by solving the transient temperature field using NS/SST with the optimal solution for the indicators. The comparison was made with the layout based on the empirical rule of placing high-power heat sources in edge positions. Three MCM layouts and the transient temperature cloud maps are shown in Figure 10 and Figure 11. It can be observed from the figures that, when the indicators are optimal, the range of the PCB transient temperature field is [343.14 K, 344.09 K], with a temperature difference of 0.95 K. When the indicators are optimal, the range of the PCB transient temperature field is [343.39 K, 344.21 K], with a temperature difference of 0.82 K. In the case of an empirical layout, the range of the PCB transient temperature field is [341.87 K, 345.89 K], with a temperature difference of 4.02 K.
Compared to the empirical layout, the temperature difference for the indicators decreased by 76.36% and the temperature difference for the indicators decreased by 79.60%. It can be seen that the system has a significant effect on improving the uniformity of the substrate temperature. Additionally, it is worth noting that we can observe a certain difference between the temperatures of the PCB substrate obtained by the simulation software when the indicators are optimal and when the Pareto optimal solutions are considered. This is because the temperature cloud maps obtained by the simulation software are transient, representing the temperature distribution at a specific moment, while the temperature indicators in the Pareto solution set are the average values of the PCB substrate temperature after it has stabilized. Therefore, there are slight differences between the two results, but this does not affect the consistency of the optimization results.

5. Conclusions

This study addresses the thermal management problem of the power electronic system HSLO for a multi-chip integrated circuit in a space telescope and proposes an automatic optimization system based on multi-software integration. This system not only has the capability to optimize the heat source layout, but also achieves a highly automated optimization process. Compared to traditional empirical layouts, IOS has significantly improved temperature extremes and temperature uniformity. Specifically, the temperature difference decreased by 76.36% and the temperature uniformity increased by 79.60%. These results indicate that IOS effectively enhances the temperature distribution uniformity of the multi-chip PCB substrate, improves the temperature field, and provides a solid foundation for subsequent thermal design.
In addition, for some related tasks that need optimization during the design simulation phase, they often resort to mechanical repetition of simulations to verify the feasibility of theories. In such conditions, MSIIOS can achieve higher efficiency, especially when using this method in the traditional thermal design phase of space telescopes, it can greatly increase efficiency, and reduce labor costs. For different requirements, MSIIOS can make corresponding adjustments, such as replacing optimization algorithms with fitting algorithms, sampling algorithms, etc.
In the end, the system can reduce labor costs and increase efficiency. However, the adjustment costs depend on the application scenario. Using multiple software solutions together may cause problems when the scenario changes. Indeed, this is an area that requires improvement in future research efforts.

Author Contributions

X.H.: conceptualization, methodology, supervision, writing—original draft, writing—review & editing, formal analysis, data curation. J.H.: conceptualization, formal analysis, writing—original draft, writing—review & editing. Y.G.: conceptualization, formal analysis, writing—review & editing. L.G.: funding acquisition, investigation, project administration, resources, supervision, writing-review & editing. K.H. writing—review & editing, supervision. J.Z.: conceptualization. All authors have read and agreed to the published version of the manuscript.

Funding

This research was funded by the Youth Innovation Promotion Association, Chinese Academy of Sciences, (No. 2015173) and the National Natural Science Foundation of China, (61605203).

Institutional Review Board Statement

Not applicable.

Informed Consent Statement

Not applicable.

Data Availability Statement

The raw data supporting the conclusions of this article will be made available by the authors on request.

Conflicts of Interest

The authors declare no conflicts of interest.

References

  1. Fukunaga, S.; Funaki, T. Thermal Decouple Design of Multichip SiC Power Module With Thermal Anisotropic Graphite. IEEE Trans. Compon. Packag. Manuf. Technol. 2021, 11, 778–784. [Google Scholar] [CrossRef]
  2. Meng, X.; Wang, G.; Cao, H.; Gao, S.; Cheng, J. Temperature estimation of high temperature data acquisition multichip module for oil field apparatus. In Proceedings of the 2016 15th IEEE Intersociety Conference on Thermal and Thermomechanical Phenomena in Electronic Systems (ITherm), Las Vegas, NV, USA, 31 May–3 June 2016; IEEE: Piscataway, NJ, USA, 2016; pp. 218–222. [Google Scholar]
  3. Al Razi, I.; Huitink, D.R.; Peng, Y. Power Synth-Guided Reliability Optimization of Multi-Chip Power Module. In Proceedings of the 2021 IEEE Applied Power Electronics Conference and Exposition (APEC), Phoenix, AZ, USA, 14–17 June 2021; IEEE: Piscataway, NJ, USA, 2021; pp. 1516–1523. [Google Scholar]
  4. Emon, A.I.; Carlton, H.; Harris, J.; Krone, A.; Mirza, A.; Hassan, M.; Yuan, Z.; Huitink, D.; Luo, F. Design and Optimization of 650V/60A Double-Sided Cooled Multichip GaN Module. In Proceedings of the 2021 IEEE Applied Power Electronics Conference and Exposition (APEC), Phoenix, AZ, USA, 14–17 June 2021; IEEE: Piscataway, NJ, USA, 2021; pp. 2313–2317. [Google Scholar]
  5. Fabis, P.M.; Shum, D.; Windischmann, H. Thermal modeling of diamond-based power electronics packaging. In Proceedings of the Fifteenth Annual IEEE Semiconductor Thermal Measurement and Management Symposium (Cat. No. 99CH36306), San Diego, CA, USA, 9–11 March 1999; IEEE: Piscataway, NJ, USA, 1999; pp. 98–104. [Google Scholar]
  6. Li, H.; Liao, X.; Li, Y.; Liu, S.; Hu, Y.; Zeng, Z.; Ran, L. Improved thermal couple impedance model and thermal analysis of multi-chip paralleled IGBT module. In Proceedings of the 2015 IEEE Energy Conversion Congress and Exposition (ECCE), Montreal, QC, Canada, 20–24 September 2015; IEEE: Piscataway, NJ, USA, 2015; pp. 3748–3753. [Google Scholar]
  7. Chen, K.; Xing, J.; Wang, S.; Song, M. Heat source layout optimization in two-dimensional heat conduction using simulated annealing method. Int. J. Heat Mass Transf. 2017, 108, 210–219. [Google Scholar] [CrossRef]
  8. Ning, Y.; Jie, Y.; Ye, T. Thermal Chips Layout Method in MCM Based on an Improved Particle Swarm Algorithm. In Proceedings of the 2019 Chinese Control And Decision Conference (CCDC), Nanchang, China, 3–5 June 2019; IEEE: Piscataway, NJ, USA, 2019; pp. 537–541. [Google Scholar]
  9. Yang, J.; Ye, N.; Shen, H.; Ye, D.; Zheng, W.; Di, J. A Novel Optimization Algorithm for Thermal Design of MCMs. In Proceedings of the 2020 Chinese Control And Decision Conference (CCDC), Hefei, China, 22–24 August 2020; IEEE: Piscataway, NJ, USA, 2020; pp. 1567–1570. [Google Scholar]
  10. Lopez-Villegas, J.M.; Samitier, J.; Cané, C.; Losantos, P.; Bausells, J. Improvement of the quality factor of RF integrated inductors by layout optimization. IEEE Trans. Microw. Theory Tech. 2000, 48, 76–83. [Google Scholar] [CrossRef]
  11. Chen, X.; Chen, X.; Zhou, W.; Zhang, J.; Yao, W. The heat source layout optimization using deep learning surrogate modeling. Struct. Multidiscip. Optim. 2020, 62, 3127–3148. [Google Scholar] [CrossRef]
  12. Sun, J.; Zhang, J.; Zhang, X.; Zhou, W. A deep learning-based method for heat source layout inverse design. IEEE Access 2020, 8, 140038–140053. [Google Scholar] [CrossRef]
  13. Qian, C.; Tan, R.K.; Ye, W. An adaptive artificial neural network-based generative design method for layout designs. Int. J. Heat Mass Transf. 2022, 184, 122313. [Google Scholar] [CrossRef]
  14. Cuco, A.P.C. Development of a Multi Objective Methodology for Layout Optimization of Equipment in Artificial Satellites. Master’s Thesis, National Institute for Space Research (INPE), Sao Jose dos Campos, Brazilo, 2011. [Google Scholar]
  15. Chang, Y.K.; Hwang, K.L.; Kang, S.J. SEDT (System Engineering Design Tool) development and its application to small satellite conceptual design. Acta Astronaut. 2007, 61, 676–690. [Google Scholar] [CrossRef]
  16. Li, Z.; Zeng, Y.; Wang, Y.; Wang, L.; Song, B. A hybrid multi-mechanism optimization approach for the payload packing design of a satellite module. Appl. Soft Comput. 2016, 45, 11–26. [Google Scholar] [CrossRef]
  17. Xiong, Y.; Guo, L.; Yang, Y.; Wang, H. Intelligent sensitivity analysis framework based on machine learning for spacecraft thermal design. Aerosp. Sci. Technol. 2021, 118, 106927. [Google Scholar] [CrossRef]
  18. Deb, K.; Agrawal, S.; Pratap, A.; Meyarivan, T. A Fast Elitist Non-dominated Sorting Genetic Algorithm for Multi-objective Optimization: NSGA-II. In Proceedings of the International Conference on Parallel Problem Solving from Nature, Leiden, The Netherlands, 5–9 September 2000; Springer: Berlin/Heidelberg, Germany, 2000. [Google Scholar]
  19. Van Veldhuizen, D.A.; Lamont, G.B. Evolutionary computation and convergence to a pareto front. In Proceedings of the Late Breaking Papers at the Genetic Programming 1998 Conference, Madison, WI, USA, 22–25 July 1998; pp. 221–228. [Google Scholar]
Figure 1. The automation framework of DOS command integration multi-software.
Applsci 14 04577 g001
Figure 2. Fast non-dominated sorting flow chart.
Applsci 14 04577 g002
Figure 3. Automatic optimization module.
Applsci 14 04577 g003
Figure 4. MCM model.
Applsci 14 04577 g004
Figure 5. Diagram illustrating the structure of a single chip.
Applsci 14 04577 g005
Figure 6. Comparison of sampling results.
Applsci 14 04577 g006
Figure 7. Data flow linking different pieces of software.
Applsci 14 04577 g007
Figure 8. Optimization result: (a) optimization index T m a x iteration diagram; (b) optimization index T a v g iteration diagram.
Applsci 14 04577 g008
Figure 9. PCB optimization result: (a) the Pareto frontier feasible solution; (b) the bi-objective Pareto feasible solution.
Applsci 14 04577 g009
Figure 10. Three MCM layouts of a PCB board: (a) T m a x index is optimal; (b) T a v g index is optimal; (c) empirical layout.
Applsci 14 04577 g010
Figure 11. The temperature cloud diagram of PCB board: (a) T m a x index is optimal; (b) T a v g index is optimal; (c) empirical layout.
Applsci 14 04577 g011
Table 1. MCM geometric parameter.
ModuleUnit [mm]
Substrate 120 × 120 × 2
Element 20 × 20 × 2
Table 2. MCM thermal parameters.
ModuleMaterial Thickness   [ μ m ] λ [ W m · K ) 1 ] c J k g · ρ g c m 3
Substrate A l 2 O 3 2000188403.5
Sintered W2017313019.25
Gold-boardd0.531713019.3
Chip 1 ~ 14 Silicon3001397032.32
Bonded materialSn-Ag-Cu5078767.4
AirAir-0.02710061.205
Table 3. Equivalent power consumption of 14 chips.
ChipPower [W]ChipPower [W]
A1, A20.1E1, E20.5
B1, B20.2F1, F20.6
C1, C20.3G1, G20.7
D1, D20.4--
Table 4. NSGA-II correlated hyper parameters.
OptionValue
Population size40
Number of generations40
Crossover probability0.9
Crossover distribution index10.0
Mutation distribution index20.0
Max fail runs5
Failed run penalty value1.0 E30
Failed run objective value1.0 E30
Initialization modeLHS
Disclaimer/Publisher’s Note: The statements, opinions and data contained in all publications are solely those of the individual author(s) and contributor(s) and not of MDPI and/or the editor(s). MDPI and/or the editor(s) disclaim responsibility for any injury to people or property resulting from any ideas, methods, instructions or products referred to in the content.

