Abstract
This study unveils an advanced methodology for characterizing various types of cow’s milk based on their optical properties, aiming to establish a straightforward yet comprehensive method. This study uses fundamental principles such as Snell’s Law and Fresnel coefficients to determine and demonstrate critical angles for total internal reflection and reflectance at p polarization. Notably, milk composition, particularly fat content, significantly and remarkably influences its refractive index, with higher fat content leading to elevated values. Additionally, the extinction coefficient, derived through the Beer–Lambert law, provides valuable and essential information regarding light absorption and scattering within the milk samples. The significance of this research relies upon its ability to comprehensively analyze various optical properties of milk, including critical angles, reflectance, and extinction coefficients. By doing so, it offers an exhaustive and detailed understanding of how milk responds to light across different wavelengths and angles of incidence. Moreover, the technique effectively distinguishes milk types based on their fat content and particle characteristics. This novel characterization technique holds promise for various applications within the dairy industry, such as milk quality control, classification, and adulteration detection, which is crucial for maintaining consumer trust and safety.
1. Introduction
The exploration of the optical properties of a medium is deeply rooted in the meticulous analysis of its refractive index, a fundamental parameter that indicates the extent to which the speed of light is delayed upon passing through the medium [1,2,3,4,5,6,7,8,9,10]. This significant parameter is a cornerstone in understanding how light interacts with and traverses through various mediums. To facilitate precise measurements, it is necessary to consider a configuration based on internal reflection, which is strategically utilized to determine the critical angle associated with total internal reflection accurately. The internal reflection configuration occurs when the refractive index of the first medium is greater than that of the second propagation medium. Within this setup, it is firmly established that the angle at which light reflects is equal to the angle at which it is incident, a phenomenon commonly referred to as specular reflection [11].
Optical, easily applicable techniques bear considerable significance, offering the community accessible methods applicable across diverse areas and industries. That is why the experiment presented in this manuscript relies on applying Snell’s law and Fresnel coefficients. Snell’s law is a relationship that describes how light refracts as it passes through a flat interface. Fresnel coefficients represent the proportion of incident light reflected and transmitted at the interface between two media with different refractive indices or interfaces [4,12].
It is important to mention that the most fundamental concept in this work is optical reflectance, defined by the square magnitude of Fresnel coefficients, which is meticulously examined for both s and p polarizations [13,14]. Polarization s refers to isolating a single component of the electric field perpendicular to the plane of incidence. In contrast, the p polarization occurs when the electric field is parallel to the plane of incidence [1,2].
As already mentioned, the total internal reflection plays a crucial role in the experiment, representing a fundamental optical phenomenon wherein all incident light is reflected beyond a specific angle of incidence known as the critical angle [1,2,3,4,5,6,7,8,15].
In the pursuit of obtaining comprehensive optical parameters for complex samples, it becomes imperative to explore and integrate various theoretical frameworks that elucidate the intricate interactions between light and the sample under investigation, as exemplified in the case of different types of cow’s milk [1,2,3,13,14]. Among these theoretical models, the effective medium theory (E.M.T.) stands out, offering a conceptual framework to describe complex samples such as particles immersed in a homogeneous medium, assigning them an effective refractive index. By amalgamating the E.M.T. with Fresnel coefficients, researchers are equipped with a simplified yet powerful technique to characterize a diverse array of samples with relative ease [3,16]. Another optical phenomenon that merits attention, albeit less common, is extinction, which encapsulates the absorption or scattering of light within the sample. This intricate behavior is aptly modeled using the extinction coefficient derived from the venerable Beer–Lambert law. It is imperative to underscore that the sample’s refractive index is inherently complex and wavelength-dependent, as elucidated by extensive research [4,17,18,19,20,21].
In summary, this research endeavors to comprehensively explore and illustrate various optical properties of the sample under scrutiny, ranging from determining critical angles to studying extinction phenomena. Meticulous experimentation and analysis provide a thorough understanding of the sample’s response to light across a spectrum of conditions and angles of incidence. Moreover, it gives precious insights into the unique characteristics of milk and its constituent particles, offering a significant contribution to the broader scientific discourse on optical characterization techniques.
2. Materials and Methods
2.1. Experimental Setup
Figure 1 depicts the experimental setup employed in our study. It features a white light source whose intensity is regulated by the source light system. The white light beam is directed into a polarizer, where the angle is set at either 0° or 90°, determining the polarization as either s or p.
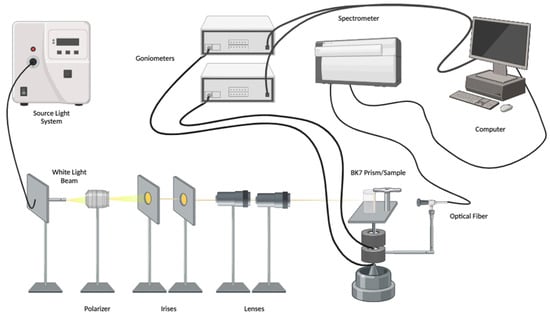
Figure 1.
Experimental setup.
After passing through the polarizer, the beam traverses the irises, which filter the light to permit a minimal amount. Subsequently, the light passes across the lenses, which focus the beam onto the flat face of the BK7 prism with optimal central alignment.
The beam encounters the prism mounted on the top goniometer. Upon reflection, the light enters the spectrometer, affixed to the bottom goniometer. The spectrometer transmits the reflected light’s information via optical fiber, yielding results on the computer. The measurements involve obtaining spectrum values for each angle of incidence.
The experimental setup’s main components are listed in Table 1.

Table 1.
Optical components of the experimental setup.
The experimental setup operates through a control routine programmed in LabVIEW 2023. The Thorlabs Kinesis system is required to control the goniometers using compatible .NET DLL commands. This system allows simultaneous control over the position, speed, and direction of movement for each goniometer while providing real-time position feedback.
A subroutine using Thorlabs LabVIEW drivers has been implemented for spectrometer data acquisition. This subroutine sends a trigger signal only when the goniometers reach specific angular position steps, which are user-specified. Once the angular sweep is complete, we obtain an intensity data matrix correlated with angular position and wavelength.
2.2. Methodology
Once the experimental setup is prepared, the following methodology is pursued:
1. The polarizer is adjusted to 90° to select p-polarization. The polarization is significant because the technique offers two types of linear polarization, and the choice of this can be substantial. In this manuscript, p-polarization was chosen.
2. Data acquisition is essential because the system will rotate to change the angle of incidence on the sample; for this reason, it is necessary to consider some data in the program that performs the measurements.
- Initial angle: 20°
- Final angle: 75°
- Angular pitch: 0.1 degree. The angular step in which the motors move.
- Integration parameter: 0.003. It is the amount by which the spectrometer averages each measurement, that is, every 0.1 degree.
- Multiplier: 2. This parameter regulates the motor of the goniometer associated with the spectrometer, ensuring it moves at twice the speed when dealing with specular reflection compared to the goniometer bearing the sample.
3. A measurement of reference is necessary; this calibration curve is considered without the sample to obtain the light spectrum values for each angle of incidence for a prism-air interface. This measurement will be carried out whenever a sample has been used to observe that our system continues to be well calibrated and that the cleaning of the prism, due to the sample, was adequate.
4. The post-processing of the data obtained from each measurement is analyzed to obtain the reflectance curve as a function of the angle of incidence and wavelength.
5. All data are completed at this point, and different reflectance curves can be analyzed. One of them is calculated as a function of the angle of incidence at a fixed wavelength or vice versa. The purpose of this is to compare measurements with theory in a simpler way; for example, theoretical graphs of an interface prism-air can be generated using Fresnel’s composite reflectance formula for p-polarization [4], or if a complex sample is carried out, Equation (1) can be used.
To compare with the experiment, Equation (1) should be considered as the optical reflectance [4], which is defined in Equation (2).
where is the refractive index of the incidence medium, which, in our case, will be the BK7-prism, is the refractive index of the transmitted medium, and is the angle of incidence. is the Fresnel’s coefficient of the first interface, prism-sample, and , for the second interface, glass-air, and is the thickness of the sample, which was measured using the formula , where is the measured volume of the sample, and is the area of the coverslip. The Fresnel coefficient for p-polarization [4] is
With , as the z-components of the wave vector given by
where the subindex l change depends on which interface is working on, and is the wavenumber in vacuum defined as , being the wavelength.
6. All instruments must be calibrated, and this is no exception. The calibration process follows the next steps. A numerical derivative of the optical reflectance, see Figure 2a, should be developed to obtain the critical angle, which means there is an abrupt change in slope before total internal reflection comes, as depicted in Figure 2b.
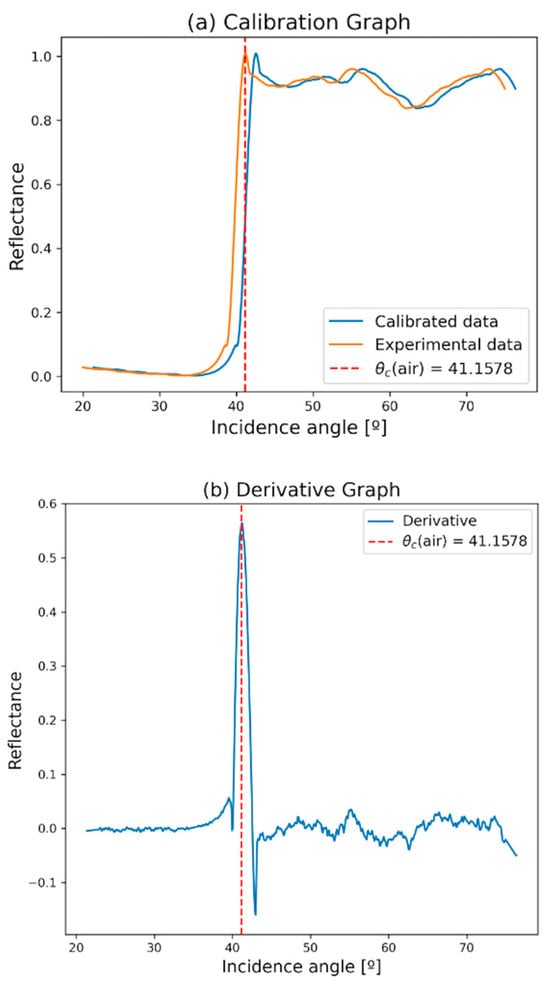
Figure 2.
(a) Reflectance at p polarization, as a function of incidence angle, is plotted from 20 to 70 degrees for an interface prism-air. The orange curve represents the original results without calibrations. Meanwhile, the blue curve represents the calibrated curve of the experiment; (b) Reflectance derivative as a function of incidence angle, where the highest pick of the derivative corresponds to the critical angle.
7. Calibrations consist of the theoretical critical angle subtracted from the experimental critical angle. This is added to the angular scale obtained in step (5). Thus, the data are calibrated and ready for sample measurements. This calibration is applied to all experimental results. Critical angles, theoretical and experimental, are compared using Snell’s law, shown in Equation (5):
8. Using Snell’s law, Equation (5), the real part of the sample’s refractive index is determined, where the refractive index is
The sample’s composition will be theoretically considered an effective medium. An effective medium is a simplified representation of a material composed of, in this case, spherical particles and a homogeneous liquid, which has the same optical properties as those of the original material. The effective medium theory used in this work is the one proposed by van de Hulst Equation (7), defined by
where is the refractive index of the medium in which the particles are located, in this case, water; is the volume filling fraction, i.e., the number of particles in the total volume of the sample; is the scattering matrix element [21] of the light in the direction of incidence; and is called the size parameter, given by Equation (8), with a particle radius ,
where is the wavenumber in vacuum defined as , being the wavelength.
9. The goniometers are reset to 0 degrees for ease of sample placement. Ten microliters of the sample are taken with a micropipette and placed in the center of a coverslip. As mentioned above, this measurement is needed to infer the thickness of the sample. The coverslip with the sample is positioned on the flat face of the prism, as shown in Figure 3.
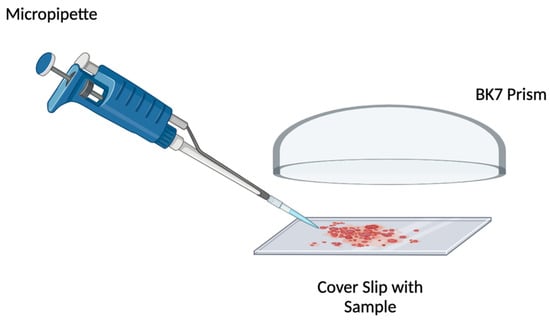
Figure 3.
Sample arrangement.
10. Steps (2) and (3) are repeated to obtain the light spectrum values for each angle of incidence at the prism–sample and prism–air interfaces.
11. Steps (5), (6), and (7) are repeated, but now, two critical angles will be identified because of the two different interfaces: prism–air and prism–sample. The region in the reflectance curve between these two critical angles is called the extinction zone, where the light is absorbed or scattered. The focus is on the second change in slope corresponding to the critical angle of the prism–sample interface to infer the real part of the sample’s refractive index mentioned in the next step.
12. The experimental reflectance is compared against a theoretical curve obtained by Fresnel’s composed reflectance expression mentioned earlier, see Equation (2). By varying parameters, such as the particle size and volume fraction [22,23]. Also, the imaginary part of the sample’s refractive index is obtained.
13. Once the imaginary part of the refractive index is obtained, the extinction coefficient is calculated by applying Beer–Lambert’s law Equation (9).
Considering all these points described above, the optical reflectance measurements will be obtained, and the sample will be optically characterized.
3. Results and Discussion
All the reflectance data acquired before the calibration, see Figure 2a, are illustrated in Figure 4, showcasing the uncalibrated reflectance density map of the various cow’s milk types. Figure 4 is important because it shows the potential of the optical technique. This visual representation offers insights into the reflectance characteristics across different angles of incidence and wavelengths. This manuscript, as shown in Figure 5, focuses on a wavelength of 525 nm. The chosen wavelength was arbitrary when analyzing the optical characteristics at said wavelength, but the experiment allowed us to obtain the same optical parameters at other wavelengths. The discernible abrupt decline in reflectance between the 60- and 65-degree angles of incidence is particularly notable, indicating a significant change in light interaction with the milk samples within this angular range. The optimal wavelength for the reflectance plots employed in this research was determined by scrutinizing these density maps.
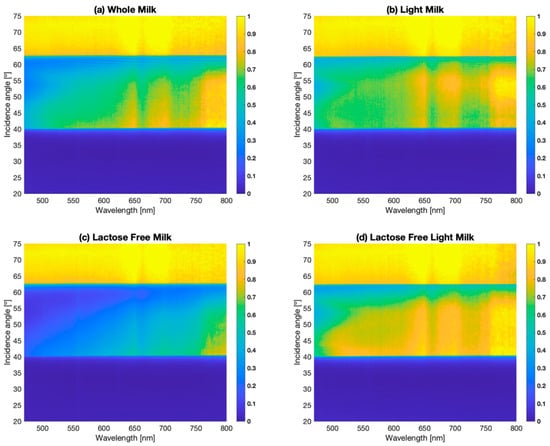
Figure 4.
Reflectance density map as a function of angle of incidence (20° to 75°) and wavelength for the different types of milk (475 nm to 800 nm). (a) Reflectance density map for whole milk; (b) reflectance density map for light milk; (c) reflectance density map for lactose-free milk; (d) reflectance density map for lactose-free light milk.
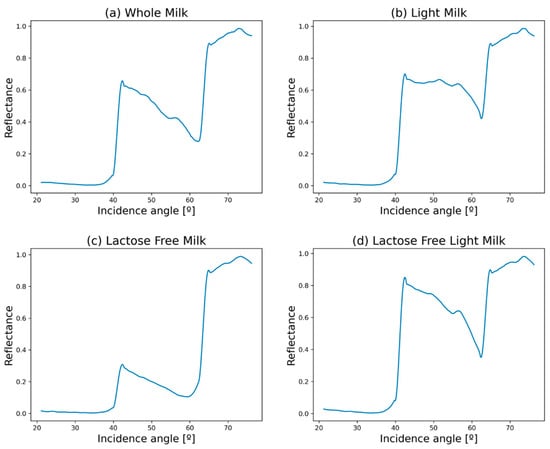
Figure 5.
Impact of fat content and lactose presence on light reflectance in milk samples. These graphs are at a fixed wavelength of 525 nm as a function of the angle of incidence, ranging from 20 to 70 degrees. (a) Reflectance curve for whole milk; (b) Reflectance curve for light milk; (c) Reflectance curve for lactose-free milk; (d) Reflectance curve for lactose-free light milk.
Figure 5 illustrates the various reflectance plots featuring calibrated angular scales for the different types of milk. Within this figure, the most crucial aspect is the presence of two critical angles and the area encompassed between them. It holds significance as it denotes the region where the sample’s extinction is evaluated. While the reflectance derivative plots for each milk type are not presented here for the sake of simplicity, it is essential to highlight that such analysis was conducted to determine the real part of each refractive index using Snell’s law Equation (5). This comprehensive approach allows for a deeper understanding of the optical properties of the milk samples and facilitates the extraction of crucial parameters essential for further analysis and interpretation, such as the real part of the refractive index for both interfaces.
After acquiring the real part of the refractive index, the theoretical and experimental reflectance versus angle of incidence graphs are generated and presented in Figure 6. These graphs serve as a crucial step in the analysis process, allowing for a comparison between theoretical predictions and empirical observations. By incorporating parameters such as the radius of particle and volume fraction, derived from van de Hulst’s effective medium theory Equation (7), into the analysis, a comprehensive understanding of the optical behavior of the milk samples is achieved. This integration of theoretical models with experimental data enhances the accuracy and reliability of the analysis, enabling researchers to extract meaningful insights into the underlying mechanisms regulating light interaction with the milk samples. Thus, Figure 6 serves as a pivotal visualization tool, facilitating the interpretation and understanding of the behavior of different samples. It is necessary to mention that Figure 6 is not a fitting curve; it is just the simulation and the experiments that match better between both curves.
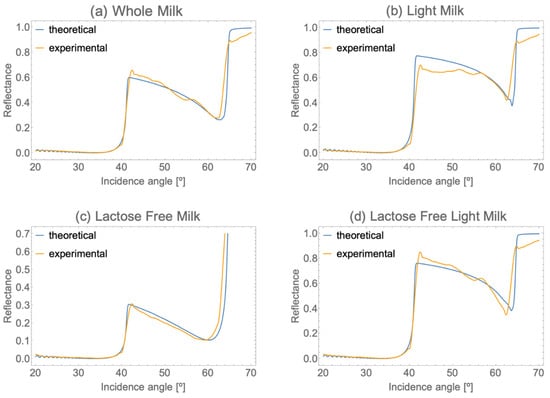
Figure 6.
Theoretical and experimental comparison of the milk’s reflectance curves as a function of angle of incidence (20° to 70°) and fixed at a wavelength of 525 nm. (a) Theoretical and experimental comparison for whole milk’s reflectance curves; (b) Theoretical and experimental comparison for light milk’s reflectance curves; (c) Theoretical and experimental comparison for lactose-free milk’s reflectance curves; (d) Theoretical and experimental comparison of lactose-free light milk’s reflectance curves.
Having discerned the real and imaginary components of the refractive index for every milk variant, we employ Beer–Lambert’s law, as outlined in Equation (9), to derive the extinction coefficient. The culmination of our experimental findings is meticulously documented in Table 2.

Table 2.
Change in extinction of different milks based on particle radius and volume fraction.
Table 2 provides a comprehensive overview of crucial optical parameters characterizing various types of cow’s milk. The table outlines each milk type’s refractive index, detailing the real and imaginary parts that play pivotal roles in determining how light interacts with the milk samples. Additionally, Table 2 presents information on particle radius and volume fraction, shedding light on the physical characteristics of the milk samples. Of particular significance is the extinction coefficient, derived using Beer–Lambert’s law, which quantifies the extent to which light is absorbed and scattered by the milk samples.
Moreover, in conjunction with the data in Table 2, Figure 7 visually represents the nutritional disparities among the various types of cow’s milk. Together, these findings offer a holistic understanding of the composition and properties of different milk types, elucidating the factors that influence their optical and nutritional characteristics. This technique shows how easy it is to analyze samples and characterize them from an optical point of view, thus allowing us to evaluate the composition and characteristics that could change in the sample due to different possible damages or modifications suffered by the sample. This technique only considers one type of particle; in most cases, it is the particle that most affects the measurement due to its radius. It is believed that it could be an additional valuable technique for analyzing turbid suspensions in different areas, such as pharmaceuticals and food.
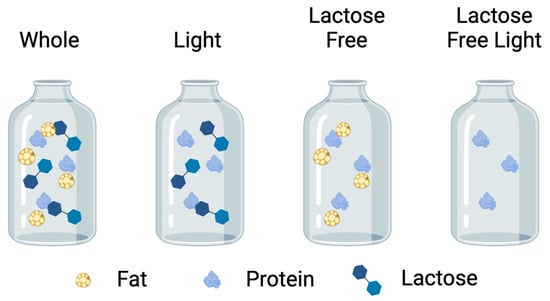
Figure 7.
Composition of the different types of milk.
4. Conclusions
In conclusion, milk is primarily composed of water, proteins, fats, and lactose, with variations in different types of milk mainly attributable to differences in fat content and processing methods. Milk with higher fat content tends to exhibit a higher refractive index due to larger fat globules, which effectively bend light. Conversely, skim milk or lactose-free milk, with reduced fat content, tends to have lower refractive indices, resembling water more closely.
Furthermore, our study successfully discerned variations in particle size and volume fraction among different types of cow’s milk. This highlights the efficacy of the optical characterization technique in accurately classifying and differentiating between diverse cow’s milk types based on their distinct and unique compositions.
In addition, our research contributes a novel and cutting-edge methodology to the scientific community for characterizing different types of liquid samples. In this instance, we shed light on the refractive index of cow’s milk for the first time, as far as the authors know, providing valuable insights that could enhance industrial processes for milk storage. Finally, this technique holds promise for analyzing the optical properties of complex samples beyond milk, offering a versatile tool for various applications across various industries.
Author Contributions
Conceived and designed the experiment: G.M.-L.; Investigation: L.H.-A.; Software: G.M.-L. and L.H.-A.; Formal analysis: G.M.-L. and L.H.-A.; Writing—original draft: L.H.-A.; Manuscript revision and editing: G.M.-L.; Automation of experimental setup: R.C.-T. All authors have read and agreed to the published version of the manuscript.
Funding
This research received no external funding.
Data Availability Statement
The data presented in this study are available upon request from the corresponding author.
Acknowledgments
L.H.-A., R.C.-T. and G.M.-L. would like to acknowledge the División de Investigación y Posgrado of Universidad Iberoamericana for the financial support in the 16th Call proposals in 2021. Also, the authors would like to thank the employees of Starbucks (Mexico City, Arcos Bosques) for providing us with the different types of cow’s milk.
Conflicts of Interest
The authors declare no conflicts of interest.
References
- Hecht, E. Óptica, 3rd ed.; Addison Wesley: Reading, MA, USA, 1998. [Google Scholar]
- Born, M.; Wolf, E. Principles of Optics, 7th ed.; Cambridge University Press: Cambridge, UK, 1999; p. 106. [Google Scholar]
- Morales Luna, G.; García-Valenzuela, A. Viability and fundamental limits of critical-angle refractometry of turbid colloids. Meas. Sci. Technol. 2017, 28, 125203. [Google Scholar] [CrossRef]
- Morales Luna, G.; García-Valenzuela, A.; Barrera, R.G. Optical Coherent Reflection from a Confined Colloidal Film: Modeling and Experiment. J. Phys. Chem. 2018, 122, 8570–8581. [Google Scholar] [CrossRef] [PubMed]
- Jarvis, P.R.; Meeten, G.H. Critical-angle measurement of refractive index of absorbing materials: An experimental study. J. Phys. E Sci. Instrum. 1986, 19, 296–298. [Google Scholar] [CrossRef]
- Meeten, G.H.; North, A.N. Refractive index measurement of turbid colloidal fluids by transmission near the critical angle. Meas. Sci. Technol. 1991, 2, 441–447. [Google Scholar] [CrossRef]
- Meeten, G.H.; North, A.N. Refractive index measurement of absorbing and turbid fluids by reflection near the critical angle. Meas. Sci. Technol. 1995, 6, 214–221. [Google Scholar] [CrossRef]
- Contreras-Tello, H.; García-Valenzuela, A. Refractive index measurement of turbid media by transmission of backscattered light near the critical angle. Appl. Opt. 2014, 53, 4768–4778. [Google Scholar] [CrossRef] [PubMed]
- Mohammadi, M. Colloidal refractometry: Meaning and measurement of refractive index for dispersions; the science that time forgot. Adv. Colloid Interface Sci. 1995, 62, 17–29. [Google Scholar] [CrossRef]
- Calhoun, W.R.; Maeta, H.; Combs, A.; Bali, L.M.; Bali, S. Measurement of the refractive index of highly turbid media. Opt. Lett. 2010, 35, 1224–1226. [Google Scholar] [CrossRef] [PubMed]
- García-Valenzuela, A.; Barrera, R.G.; Sánchez-Pérez, C.; Reyes-Coronado, A.; Méndez, E.R. Coherent Reflection Flights from turbid suspension of particles in an internal-reflection configuration: Theory versus experiment. Opt. Express 2005, 13, 6723–6737. [Google Scholar] [CrossRef] [PubMed]
- Gutiérrez-Reyes, E.; García-Valenzuela, A.; Barrera, R.G. Extension of Fresnel’s formulas for turbid colloidal suspensions: A rigorous treatment. J. Phys. Chem. B 2014, 118, 6015–6031. [Google Scholar] [CrossRef] [PubMed]
- Philips-Invernizzi, B.; Dupont, D.; Claude, C. Bibliographical review for reflectance of diffusing media. Opt. Eng. 2001, 40, 1082–1092. [Google Scholar] [CrossRef]
- Morales-Luna, G.; Contreras-Tello, H.; García-Valenzuela, A.; Barrera, R.G. Experimental test of reflectivity formulas for turbid colloids: Beyond the Fresnel reflection amplitudes. J. Phys. Chem. B 2016, 120, 583–595. [Google Scholar] [CrossRef] [PubMed]
- Rotstein, R.; Berges, A.; Mitragotri, S.; Morse, D.E.; Moskovits, M. Angle-dependent light scattering by highly uniform colloidal rod-shaped microparticles: Experiment and simulation. J. Polym. Sci. Polym. Phys. Ed. 2016, 54, 1889–1895. [Google Scholar] [CrossRef]
- Morales-Luna, M.; Morales-Luna, G. Effective medium theory and its limitations for the description of MoO3 films doped with nanoparticles. J. Phys. Condens. Matter 2023, 35, 065001. [Google Scholar] [CrossRef] [PubMed]
- Shah, S.; Memon, S.; Shah, A.A.; Abbasi, S. Extinction Coefficient for fog attenuation via non-linear medium. Sindh Univ. Res. J. Sci. Ser. 2016, 48, 675–678. [Google Scholar]
- van de Hulst, H.C. Light Scattering by Small Particles; Dover Publications, Inc.: Mineola, NY, USA, 1957. [Google Scholar]
- Foldy, L.L. The Multiple Scattering of Waves. I. General Theory of Isotropic Scattering by Randomly Distributed Scatterers. Phys. Rev. 1945, 67, 107–119. [Google Scholar] [CrossRef]
- Lax, M. Multiple Scattering of Waves. Rev. Mod. Phys. 1951, 23, 287–310. [Google Scholar] [CrossRef]
- Bohren, C.F.; Huffman, D.R. Absorption and Scattering of Light by Small Particles; Wiley-Interscience Paperback Series; John Wiley & Sons: Hoboken, NJ, USA, 1983. [Google Scholar]
- Hale, G.M.; Querry, M.R. Optical Constants of Water in the 200-nm to 200-μm Wavelength Region. Appl. Opt. 1973, 12, 555–563. [Google Scholar] [CrossRef] [PubMed]
- Alexander, G.B.; Iler, R.K. Colloidal silica-determination of particle sizes. J. Phys. Chem. 1953, 57, 932–934. [Google Scholar] [CrossRef]
Disclaimer/Publisher’s Note: The statements, opinions and data contained in all publications are solely those of the individual author(s) and contributor(s) and not of MDPI and/or the editor(s). MDPI and/or the editor(s) disclaim responsibility for any injury to people or property resulting from any ideas, methods, instructions or products referred to in the content. |
© 2024 by the authors. Licensee MDPI, Basel, Switzerland. This article is an open access article distributed under the terms and conditions of the Creative Commons Attribution (CC BY) license (https://creativecommons.org/licenses/by/4.0/).