1. Introduction
Recent advancements in various content offerings have led to a growing demand for immersive and enjoyable experiences. Owing to this demand, content in virtual reality (VR) environments is gaining attention. In a VR environment, the content offers viewers a high level of immersion and interest. However, a drawback is the occurrence of VR sickness, which makes prolonged viewing difficult. Similar to traditional motion sickness, VR sickness arises from different causes according to the sensory conflict and postural instability theories [
1,
2]. The sensory conflict theory attributes motion sickness to a perceptual conflict caused by a mismatch in experiences between the vestibular and sensory organs. The postural instability theory defines that motion sickness is triggered by an unstable posture. Research on VR sickness is focused on understanding its state based on the aforementioned theories, with particular emphasis on actively advancing methods to measure and confirm VR sickness.
The methods for measuring VR sickness and confirming its status typically fall into two categories: subjective and objective. Methods utilizing subjective data often measure VR sickness experiences using tools such as the simulation sickness questionnaire (SSQ), motion sickness susceptibility questionnaire (MSSQ), and VR sickness questionnaire (VRSQ) [
3,
4,
5]. The SSQ is the most commonly used tool for measuring VR sickness [
3]. Before and after viewing the content, participants are surveyed to assess their condition, allowing for the identification of changes in their VR sickness. The MSSQ [
4] is primarily used to assess the participants’ experiences of motion sickness, focusing on identifying their preexisting vulnerabilities. The VRSQ [
5] proposed by Kim is an advanced survey derived from the SSQ. Similar to the SSQ, the VRSQ also assesses changes in VR sickness through surveys but is specifically tailored to VR environments, unlike the traditional SSQ.
Methods utilizing subjective data (surveys) such as these allow for a relatively straightforward determination of VR sickness occurrence. However, they face the challenge of individual variability in assessing the severity of motion sickness, as personal thresholds fluctuate moment-by-moment, making them difficult to use as criteria for comparison. Therefore, methods that utilize objective data have been proposed.
These methods often involve measuring the VR sickness using physiological data, which mainly include pupil dilation, electroencephalography (EEG), and electrocardiography (ECG). Park [
6] suggested that VR sickness induced by viewing content through a head-mounted display (HMD) is closely related to visual information processing, and, thus, speculated a correlation with the pupil state. Consequently, using infrared cameras, this study confirmed that following VR sickness experiences, the average and standard deviation of pupil diameter increased, and irregular pupil rhythm patterns characterized by a decrease in the proportion of pupil rhythm consistency emerged. Chen [
7] confirmed that when the resolution of the VR content decreased during viewing, the participants’ pupil diameter significantly increased. In addition, Lim [
8] observed significant differences in delta, theta, and alpha waves in the frontal and central regions of the brain before and after a VR experience. Other studies [
9,
10] have similarly confirmed a quantitative correlation between VR sickness and delta and theta waves, which are the predominantly used brainwave areas during the experience. Park [
11] utilized ECG data to validate the correlation between key features of heart rate data (e.g., SDNN and pNN50) and SSQ scores) to classify sickness based on these findings.
Notably, biosignals are directly associated with VR sickness and can be used as measurement indicators. However, because of the varying processing methods for each biosignal, it is challenging to establish standardized metrics for VR sickness (e.g., biodata-based scores and quantification). Furthermore, the recurrence period density entropy (RPDE) [
12] refers to a metric that characterizes the extent to which a time series repeats the same sequence. Therefore, it measures the entropy of the regularity of data with periodicity, which increases when the periodicity is irregular or collapses and decreases when the periodicity is constant.
Mamun [
13] achieved a high level of Parkinson’s disease classification accuracy using the RPDE and other parameters based on speech characteristics as inputs for machine learning. Nguyen [
14] confirmed brain motor issues by presenting simple exercises using a wearable system and measuring the RPDE for cycles of the presented exercises. Thus, RPDE is utilized as an indicator for assessing health status by measuring the entropy of biological system cycles. In general, irregularities in the periodicity of biological signals indicate a state of stress that is expected to be associated with an increase in RPDE.
Therefore, this study proposes a method for evaluating sickness based on the periodicity of biological signals. The proposed method involves extracting cycles from biological signals and utilizing the RPDE of the extracted cycles to determine VR sickness. In this study, we validated the feasibility of the proposed method using the most representative periodic signal, ECG data of the heart.
2. Materials and Methods
2.1. Proposed VR Sickness Evaluation Method
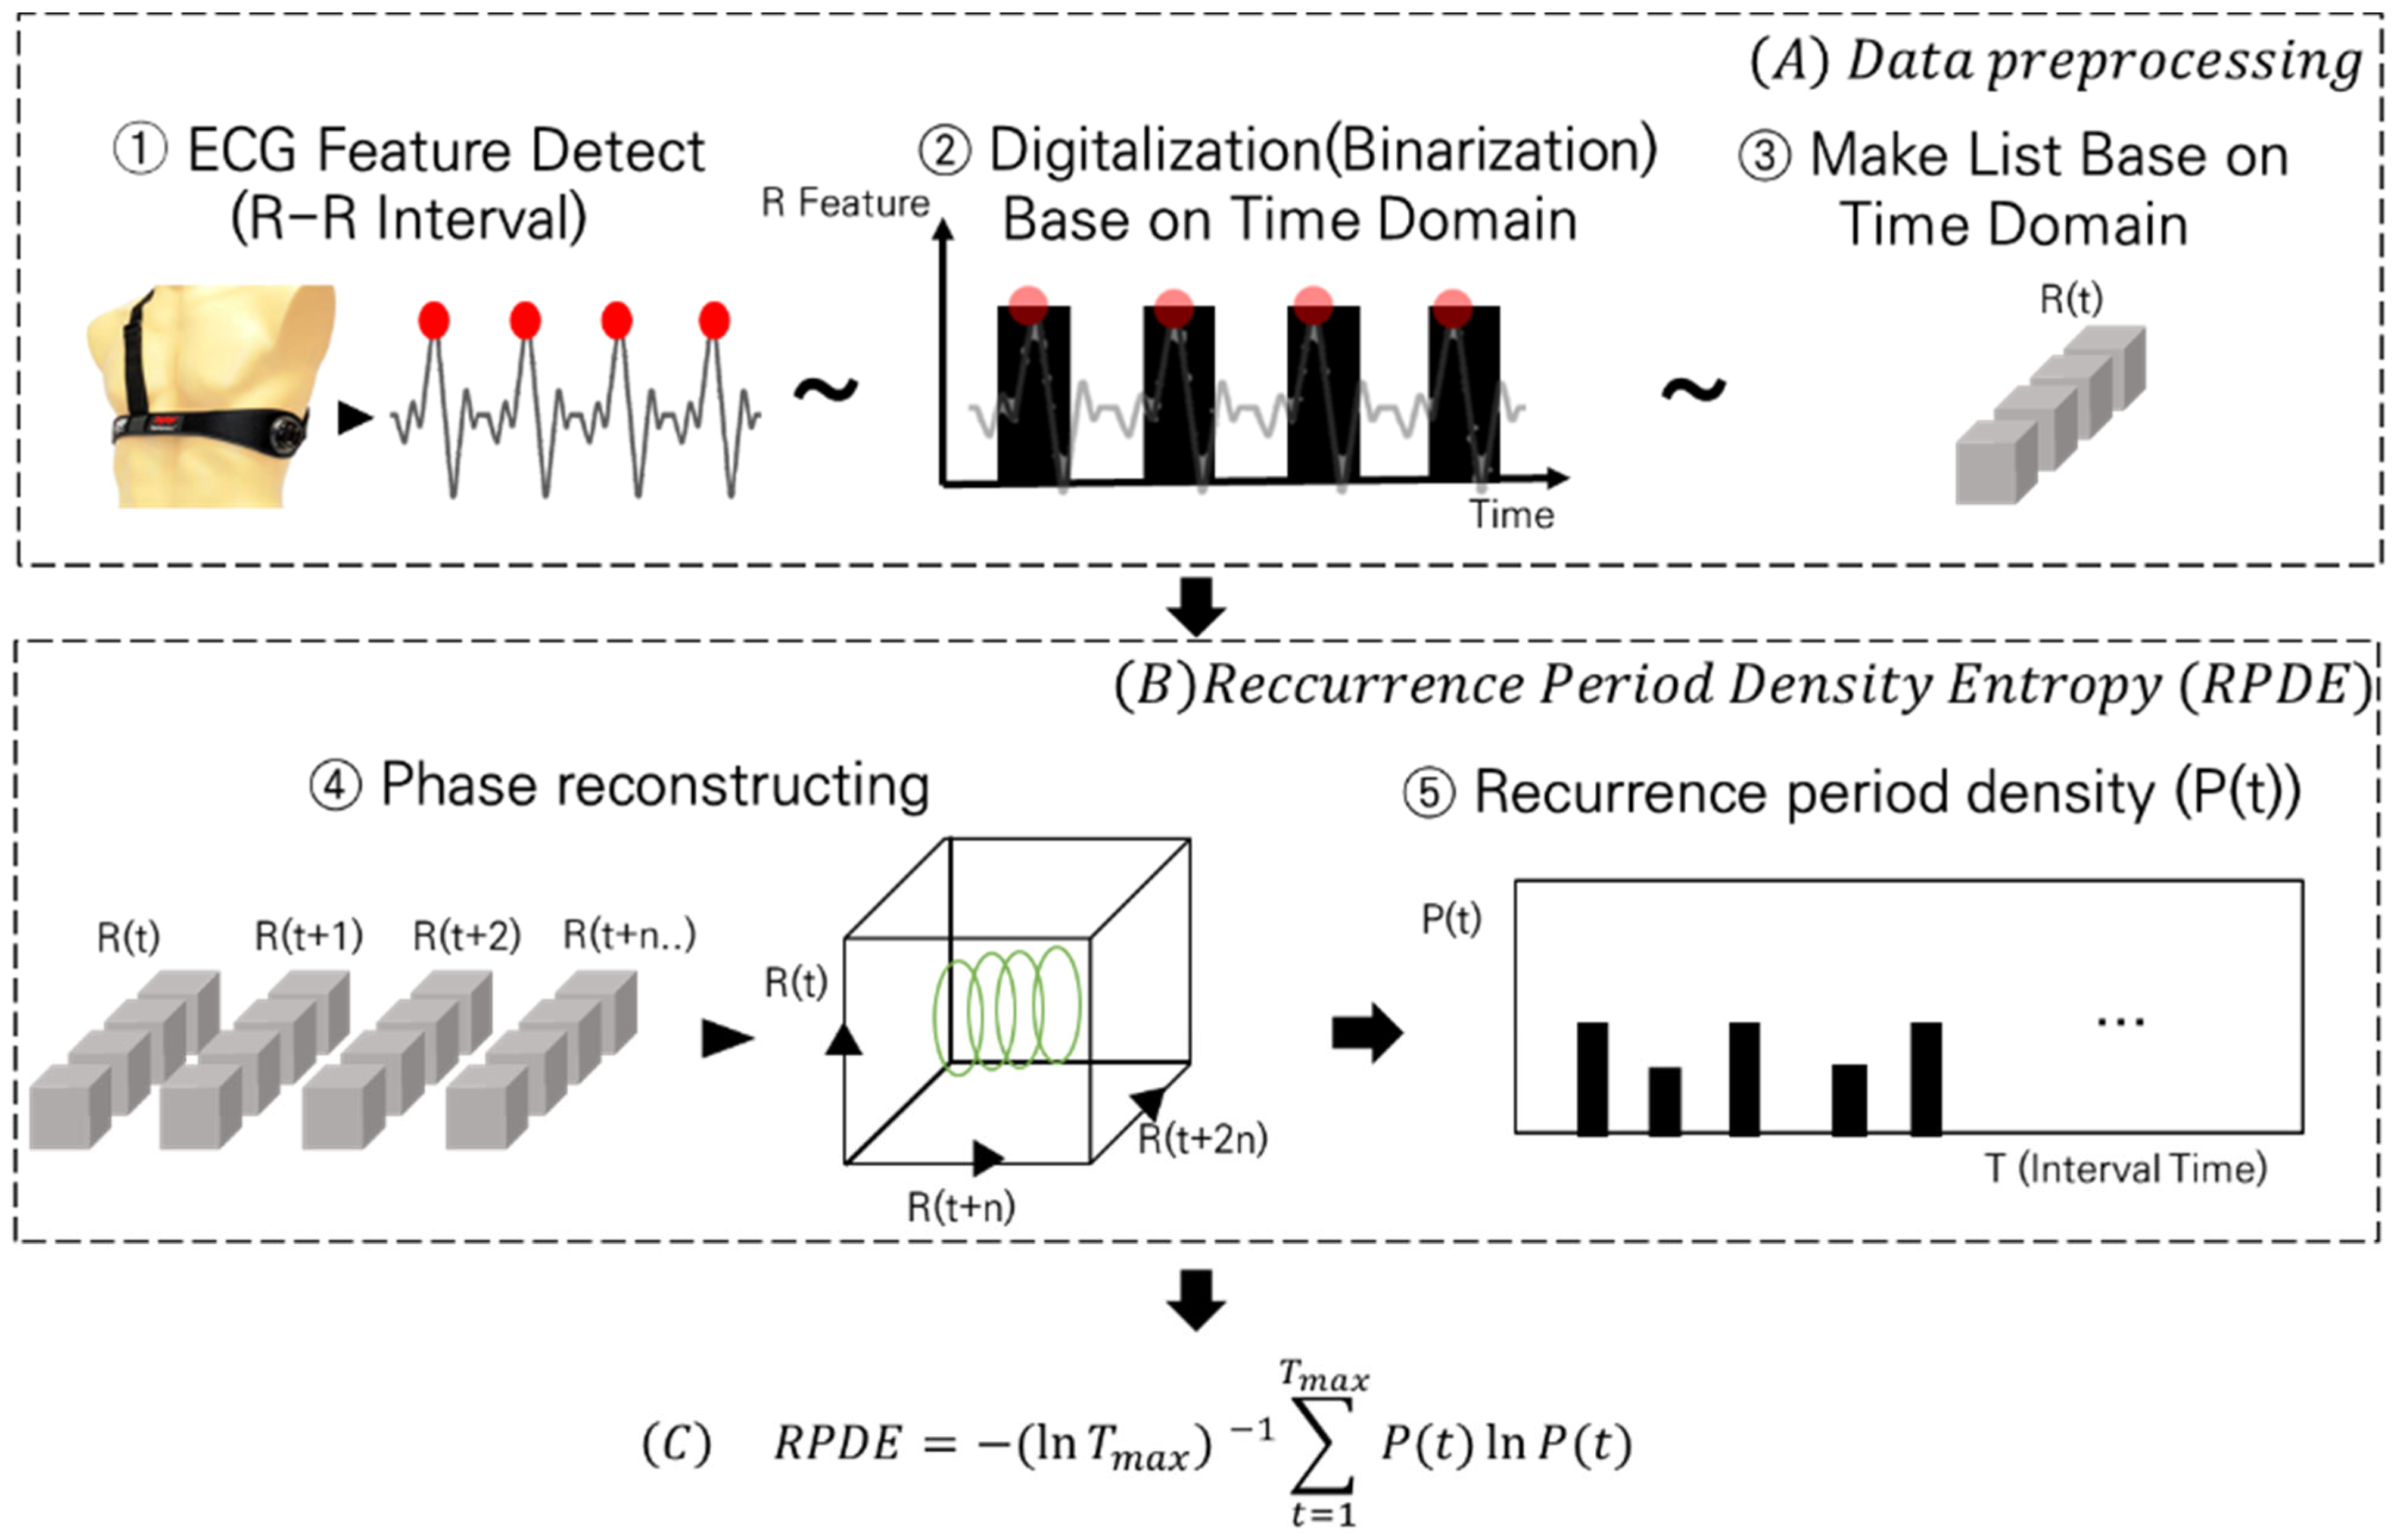
In this section, we describe the proposed method. The proposed method consists of two steps and an equation, as illustrated in
Figure 1. Step (A) details the preprocessing steps for inputting the ECG data into the RPDE. In Step (B), the preprocessed data are introduced into the RPDE process to illustrate their manipulation. Finally, in Equation (C), the RPDE values are derived from the input of the processed data.
The data preprocessing step (A) consisted of three processes: ECG feature detection, time-domain-based data binarization, and time series formation.
First, (A)—① ECG feature detection. ECG data represent the physiological activity with periodicity, which can be expressed as RR intervals. Various methods can be used to derive time series related to these intervals. However, in this study, we employed a windowing method to extract the maximum values within specific intervals, treating them as R peak points. We used ECG data from the 5 to 15 min period, during which VR sickness primarily occurs, and iteratively extracted R peak points every second from the data. Then, binarization was performed to calculate the heart rate.
Second, (A)—② involves time-domain-based data binarization. Once the R peak points were detected, we assigned a true value to the corresponding time points in the time series and a false value to areas where no peaks were detected, thereby binarizing the data.
Third, (A)—③ is time series formation. We converted these data into a list format, allowing true/false values to be input according to the time series. This format was used as an input for the RPDE algorithm. The second step is RPDE (B), which consists of two processes: state-space embedding and recurrence-period density extraction.
In (B)—④, we first continuously calculated the data distributions in R(t) and R(t + 1) from a single time series exhibiting periodicity. The calculated data columns were then mapped to the state space to determine when most of the repetitions occurred.
In steps (B)—⑤, the number of cycles repeated within a certain time frame (T) was quantified to produce the cycle density value (P(t)). Subsequently, this calculated value was substituted into Equation (C) to derive the RPDE.
2.2. Experiment
The resulting RPDE values indicated the periodicity of the heartbeat cycle. A higher RPDE value suggests that the beating cycle of the heart is more random, whereas a lower value indicates a regular beating cycle. To determine whether these values were associated with actual VR sickness, the following experiment was conducted.
This experiment was conducted with the approval from the Institutional Review Board at the Korea University of Technology and Education (KOREATECH, Approval No: 21052602).
The experimental setup is shown in
Figure 2. Content similar to that shown in
Figure 2a was used to induce VR sickness. Additionally, data collection during VR sickness was conducted while the sensors were worn, as shown in
Figure 2b.
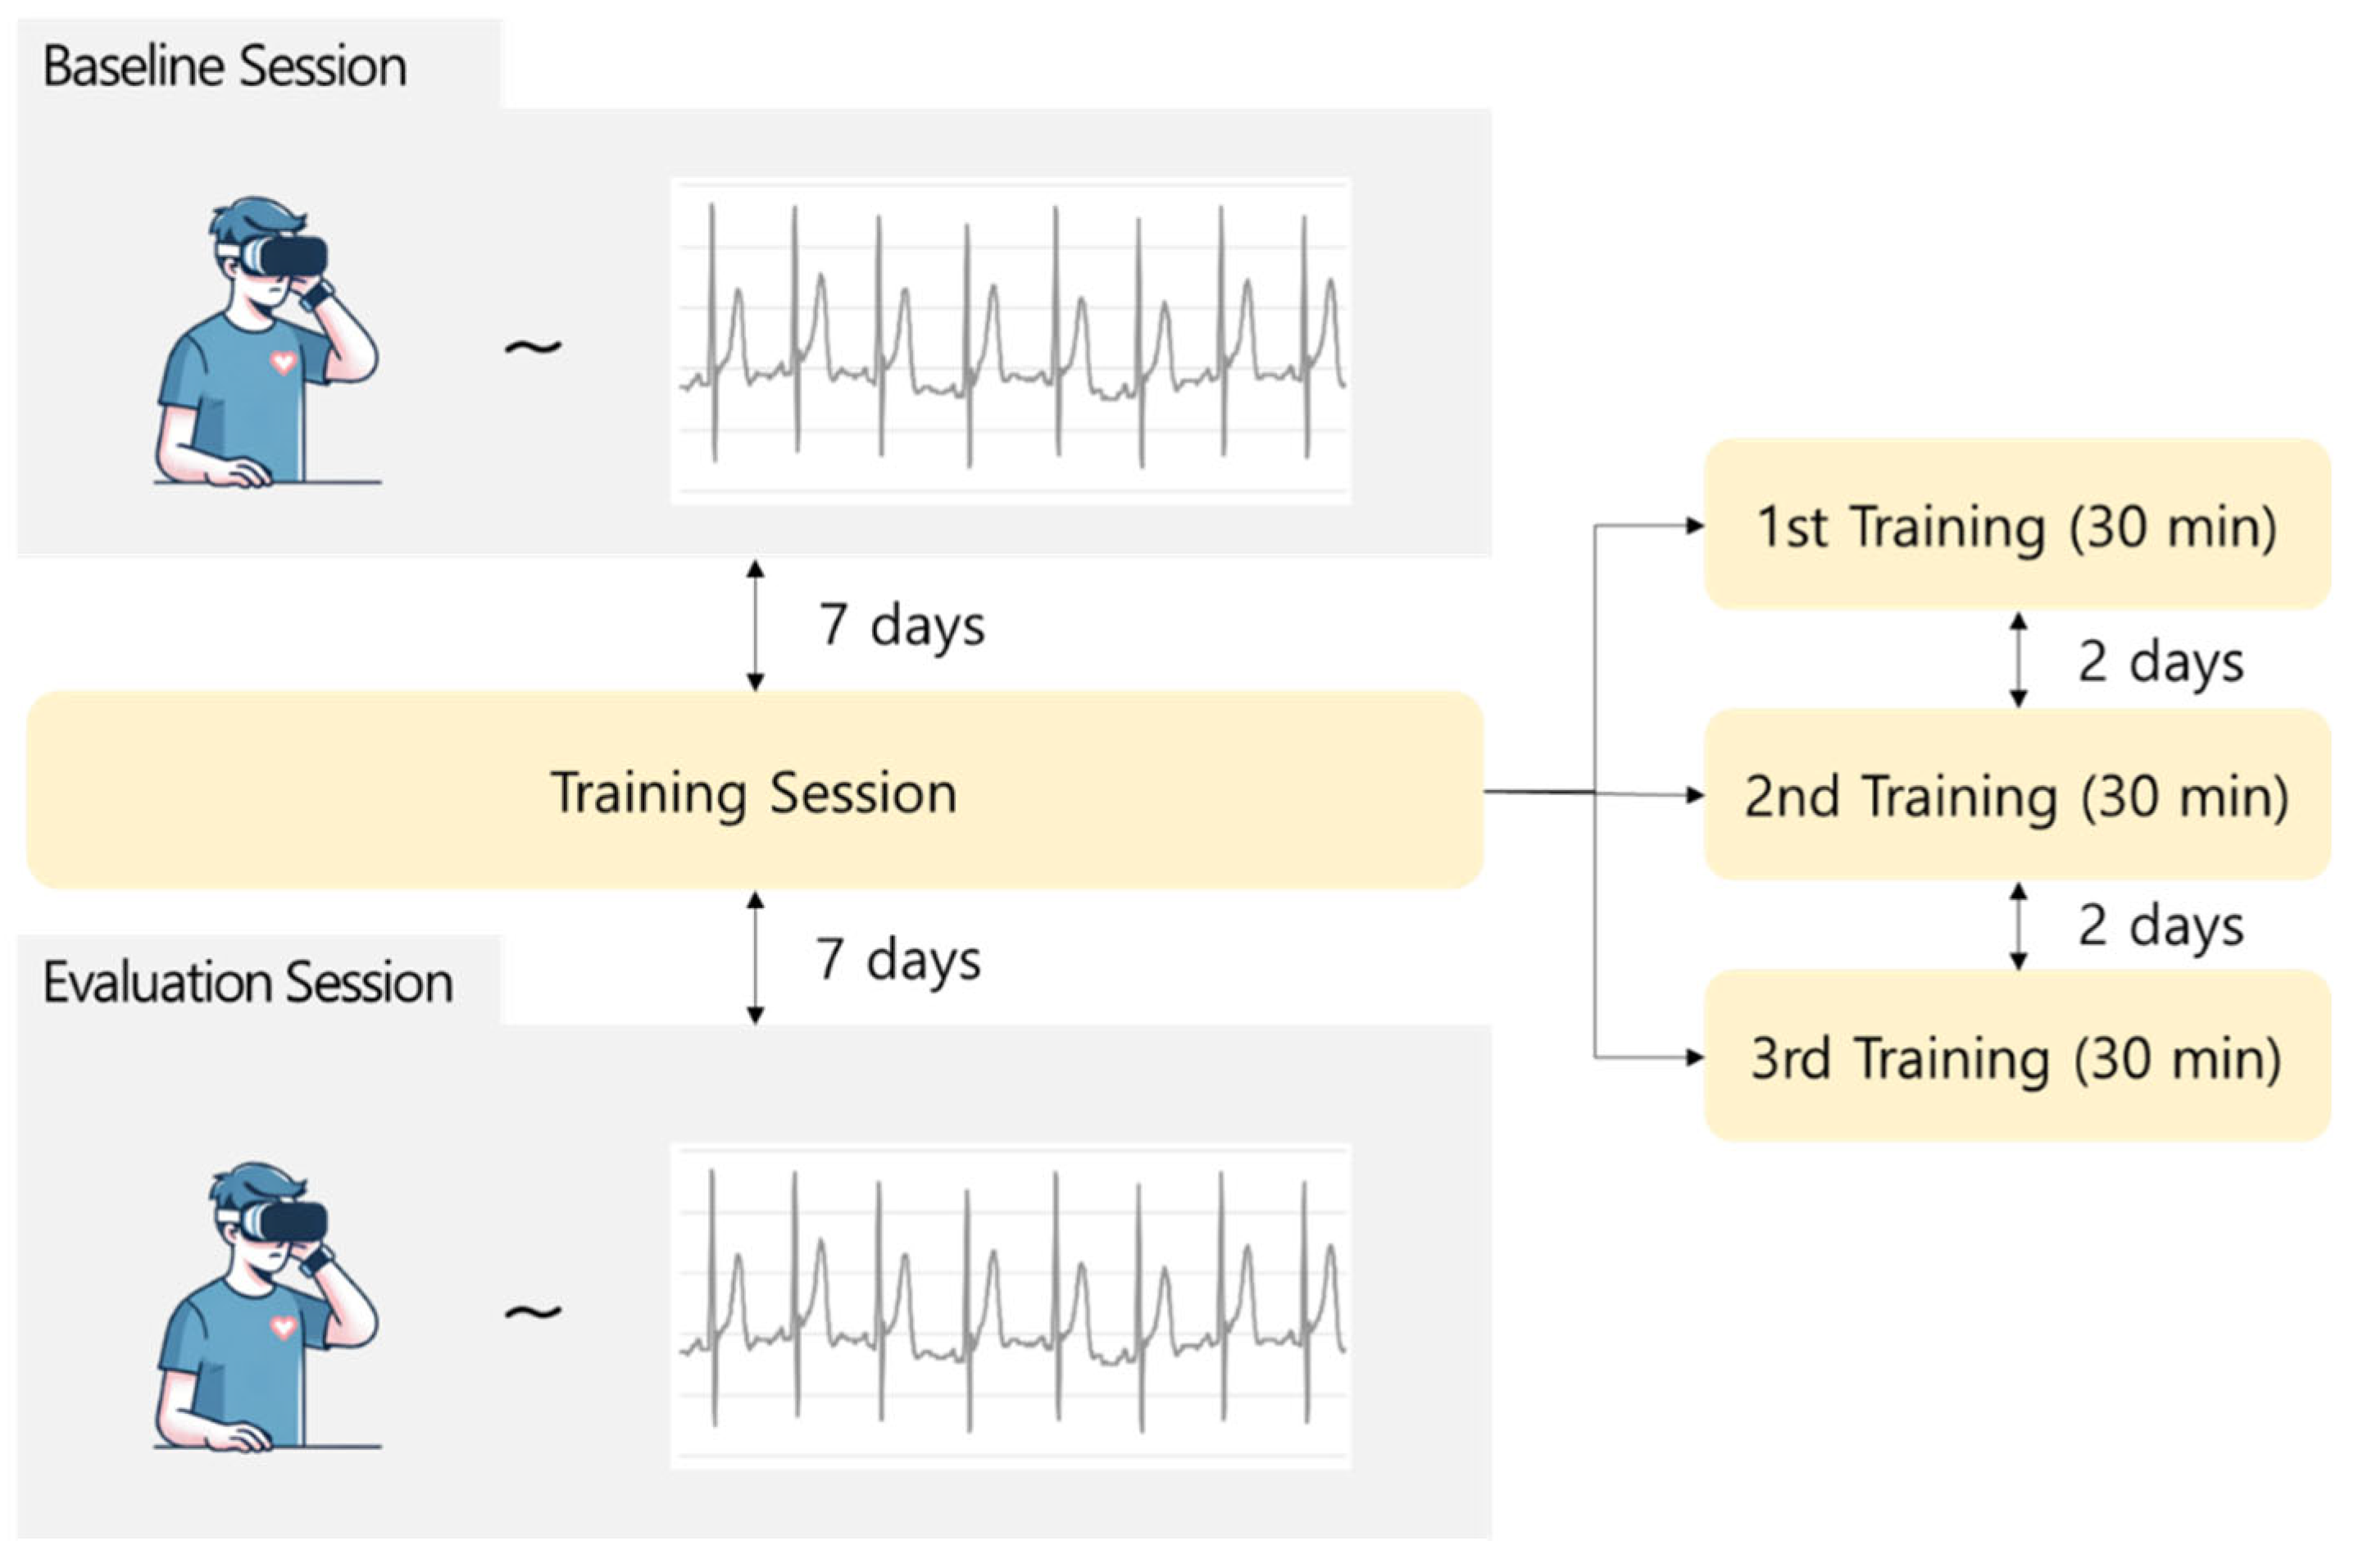
The experimental process is illustrated in
Figure 3. During the baseline session, participants watched VR sickness-inducing content for 30 min, and SSQ surveys and ECG data were collected. After completion of the baseline session, the training session was conducted at 7-day intervals. The training session consisted of three sessions, each involving the continuous repetition of VR sickness-inducing content with the same pattern. This was aimed at familiarizing the participants with VR sickness by repeatedly exposing them to the same VR sickness pattern for 30 min in each training session. Finally, during the evaluation session, the participants watched the same experimental content as that presented in the baseline session, and the SSQ surveys and ECG data were collected. The scores for each SSQ collected during the baseline and evaluation sessions were computed as listed in
Table 1.
3. Result
The experiment involved 13 participants, 2 of whom discontinued video viewing because of severe VR sickness during the experiment. The participants were all in their 20s and consisted of 10 males and 3 females.
Table 2 presents the results of the SSQ analysis.
The SSQ scores in the evaluation session decreased by approximately 20% compared with those in the baseline session. Notably, in the nausea domain, the
p-value was 0.04, and in the oculomotor discomfort domain, it was 0.02, indicating a statistically significant difference. Considering the statistically significant differences observed in certain areas of VR sickness between the baseline and evaluation sessions, the RPDE was extracted from the ECG data of both sessions for statistical analysis. Owing to equipment issues, only ECG data from 5 of the 13 participants were available for analysis. Therefore, the RPDE values were extracted and a statistical analysis was conducted based on the proposed method (
Section 1) for these five participants.
Segments corresponding to the main occurrence of VR sickness from 5 to 15 min [
15,
16,
17] were extracted from the ECG data of the five participants for analysis. To extract the R peaks from the 10-min data segments, the distances between the R peaks were converted into time series data. Subsequently, the transformed time series data were embedded into the state space, and the RPDE was computed using the embedded time series data. The calculated RPDE values for each participant are listed in
Table 3.
To investigate whether RPDE values correlated with VR sickness, a correlation analysis was conducted. The correlation analysis was performed between individual SSQ scores (nausea, oculomotor discomfort) and RPDE values from both the baseline and evaluation sessions. The reliability of these correlations was also assessed.
Table 4 presents the results of the study.
The p-values for all domains did not satisfy the threshold of 0.05. This indicates that the correlation between VR sickness and the RPDE values is not reliable, suggesting that there is no significant correlation between the two values. Therefore, because the RPDE values were confirmed to have a limited correlation with the subjective VR sickness indicator SSQ, we considered the RPDE values as individualized metrics and analyzed the individual RPDE changes across sessions.
Given the observed reduction in VR sickness effects in the nausea and oculomotor discomfort domains between the baseline and evaluation sessions, we assumed that the baseline session represented the VR sickness and the evaluation session represented the non-VR sickness for analysis. Due to the limited number of participants for whom RPDE values could be computed (only five individuals), we increased the sample size to 5000 for each session using bootstrapping techniques. Based on the data, we validated whether the difference between the pre- and post-adaptation training sessions was statistically significant. As shown in
Figure 4, the results reveal a mean difference of 0.065 and confidence intervals of [0.00309, 0.1316]. Because the confidence interval from bootstrapping did not include zero, we confirmed that the mean difference between the two sessions was significant.
4. Discussion
In this experiment, we compared the RPDE values of baseline session and evaluation session states. In this experiment, we compared the RPDE values of the baseline session and the evaluation session. Although no direct correlation was found between RPDE values and SSQ scores, significant differences in RPDE change were observed between VR sickness. Generally, increased variability in heart rate (RR interval) is related with higher stress levels. The research of YM Ishbulatov [
18] confirmed a relation between RR intervals and stress levels. Tripska et al. [
19] demonstrated that irregular heart rate variability correlated with increased stress levels. Additionally, according to Kang’s research [
20], during stressful states, the heart beats irregularly and rapidly, with a decrease in the RR interval and an increase in the heart rate. Similarly, Holmes [
21] and Fadeev [
22] confirmed an increase in heart rate during VR sickness. Furthermore, in the experiment, it was observed that RPDE values indicating irregularity in the heart rate cycle increased during VR sickness, which aligns with the findings of previous research. Therefore, based on previous studies, it has been confirmed that higher RPDE change values may indicate a higher level of stress. Although high RPDE values may not directly indicate a state of stress, interpreting high RPDE change values could suggest a stressed state, similar to the characteristics of physiological indicators used to determine health status based on changes.
A correlation analysis between the RPDE and SSQ scores was conducted to further investigate their association with VR sickness. However, the analysis revealed that the magnitude of RPDE was not directly correlated with the VR sickness. The results of the correlation analysis can be interpreted in two ways. First, the RPDE of the cardiac cycle is an indicator of individual characteristics. Generally, individual physiological indicators have either high or low values. Individual physiological indicators may have direct correlations with certain health conditions. However, when assessing health status based on changes in these indicators, a different perspective is often applied.
Therefore, although high RPDE values may not directly indicate a state of stress, interpreting high RPDE change values could suggest a stressed state, similar to the characteristics of the physiological indicators used to determine health status based on changes.
When interpreting these results, it is important to recognize that individuals who experience VR sickness can be divided into two groups: those who are sensitive to VR sickness and those who are not [
23,
24]. Individuals who are less sensitive to VR sickness may find it difficult to perceive changes in any mitigation training or method because they experience less VR sickness. This is a limitation of the SSQ, as it is a subjective questionnaire that reflects subjectivity and operates on a 0–3 point scale, limiting its ability to capture subtle differences in sensations [
25,
26]. However, when considering physiological data such as body or heart data, these subtle differences can be reflected. Therefore, changes in the VR sickness that may not be detected by subjective data could be reflected, as seen in the results of our study, by a decrease in RPDE values in situations where individuals experienced less VR sickness (evaluation sessions). In summary, according to previous studies, there is a direct correlation between RPDE and VR sickness.
However, in this experiment, no clear correlation between SSQ and RPDE was observed. This is likely because the RPDE operates as an indicator of individual variability and assesses health status based on changes, whereas the SSQ provides subjective data, making it difficult to confirm specific indicators directly.
To validate the significance of RPDE change values between the two sessions with distinct VR sickness, statistical tests were conducted, confirming the significance of RPDE changes between the two sessions. Therefore, although the RPDE values themselves may not serve as direct indicators of VR sickness, changes in individual RPDE values can be considered as indicators of VR sickness. In this study, the utility of RPDE was demonstrated by analyzing the cycle of heartbeats observed in ECG data.
This study identified a relation between the changes in RPDE values derived from cardiac cycle data and VR sickness. However, this study has several limitations that need to be acknowledged.
First, no direct correlation was observed between the RPDE values and SSQ scores, raising doubts about the reliability of RPDE as a dependable indicator.
Second, the experimental data were limited. While the sample size was increased through bootstrapping, the scarcity of original experimental data samples may have led to estimated parameter distributions that did not accurately reflect the distribution of the actual population.
Third, considering the potential influence of other unidentified factors on VR sickness, a cautious approach is required when using RPDE values alone to measure the sickness.
Finally, the data used in this experiment included comparisons between groups with significant differences in VR sickness symptoms. However, typically, such comparisons rely on contrasting groups that have watched the content with those that have not. Therefore, additional validation is required to consider RPDE values as conventional indicators of VR sickness.
Because of these limitations, ensuring confidence in the RPDE values derived from cardiac cycle data used in this study was challenging. Therefore, conducting expanded research using periodic physiological data, including ECG data, is crucial to verify the potential of RPDE as a novel and common metric.
In conclusion, this study utilized ECG data, the most representative periodic biological data, to derive RPDE values and confirmed the relation between changes in RPDE values and VR sickness. These findings suggest the potential utility of RPDE values as a new metric for measuring VR sickness.
5. Conclusions
In this study, a standardized method for analyzing VR sickness using the RPDE index is proposed. To validate the effectiveness of this method, comparative experiments were conducted using the most periodic and representative physiological data, namely, heart ECG data. By comparing the pre- (baseline session) and post-adaptation (evaluation session) states of VR sickness, SSQ and ECG data were collected according to the VR sickness and non-VR sickness.
Subsequently, statistical analysis was conducted on the SSQ to determine whether VR sickness occurred during the two sessions. The results revealed significant differences in the nausea and oculomotor discomfort domains of the SSQ scores, confirming the significance of the differences between the VR and non-VR sickness. Because significant differences in VR sickness were observed between the two sessions in the two domains, the RPDE values were extracted to validate whether the RPDE was associated with VR sickness in each state. Correlation analysis was performed to determine whether the extracted RPDE data were directly related to VR sickness. The analysis revealed that the correlation coefficients between the two VR sickness domains and RPDE values did not reach the 95% confidence level (p < 0.05), indicating that a correlation between the RPDE values and VR sickness (SSQ scores) could not be established.
Therefore, considering the RPDE values themselves as indicative of individual variability in physiological data, attention was directed toward analyzing the changes in these values. To ascertain whether the changes in RPDE values were significant in the two sessions where the VR sickness was confirmed, a bootstrap analysis was conducted. The results showed a difference of 0.065 between the two groups, confirming the significance at the 95% confidence level.
The results of this study are discussed based on the aforementioned experimental results. The conclusions are summarized as follows:
First, RPDE values are considered as individual metrics of physiological indicators, and the variation in RPDE values suggests their potential function as a measure of VR sickness.
Second, the RPDE values may have identified subtle differences that were not captured in the subjective survey data.
Third, the RPDE values of the periodic physiological data can be used as new and common indicators to measure VR sickness. Therefore, if this method is effective for other periodic physiological datasets, it could be used as an integrated metric. If such an integrated metric is used, the proposed method is expected to contribute to the scoring and standardization of VR sickness.
Furthermore, if VR sickness can be scored or standardized using a single criterion, the indicator can be used as a benchmark. The future research of this study involves integrating VR technology by utilizing the proposed method as a metric for real-time monitoring and adaptive interventions.


