Article

An Attention-Based Full-Scale Fusion Network for Segmenting Roof Mask from Satellite Images

1
Institute of Future Human Habitats, Tsinghua Shenzhen International Graduate School, Tsinghua University, Shenzhen 518055, China
2
Shenzhen Graduate School, Harbin Institute of Technology Shenzhen, Shenzhen 518055, China
3
National Supercomuting Center in Shenzhen, Shenzhen 518055, China
4
CCSTC (China Construction Science and Technology Cooperation), Low-Carbon & Smart City Technology Co., Ltd., Beijing 100195, China
*
Author to whom correspondence should be addressed.
Appl. Sci. 2024, 14(11), 4371; https://doi.org/10.3390/app14114371
Submission received: 1 April 2024 / Revised: 16 May 2024 / Accepted: 16 May 2024 / Published: 22 May 2024

Abstract

:
Accurately segmenting building roofs from satellite images is crucial for evaluating the photovoltaic power generation potential of urban roofs and is a worthwhile research topic. In this study, we propose an attention-based full-scale fusion (AFSF) network to segment a roof mask from the given satellite images. By developing an attention-based residual ublock, the channel relationship of the feature maps can be modeled. By integrating attention mechanisms in multi-scale feature fusion, the model can learn different weights for features of different scales. We also design a ladder-like network to utilize weakly labeled data, thereby achieving pixel-level semantic segmentation tasks assisted by image-level classification tasks. In addition, we contribute a new roof segmentation dataset, which is based on satellite images and uses the roof as the segmentation target rather than the entire building to further promote the algorithm research of estimating roof area using satellite images. The experimental results on the new roof segmentation dataset, WHU dataset, and IAIL dataset demonstrate the effectiveness of the proposed network.

1. Introduction

In response to climate change, the Chinese government committed to reach peak carbon emissions by 2030 and to achieve carbon neutrality by 2060 in September 2020 [1]. To achieve this goal, national climate targets must be decomposed into several key sectors to plan their detailed roadmaps targeting carbon neutrality [2]. As one of the highest carbon emitters, the building sector contributes approximately 20 % of the total carbon emissions in China [3]. The urban residential building sector accounts for approximately 40 % of the building carbon emissions [4]. Therefore, finding a feasible path to building carbon neutrality is crucial for China to achieve its carbon emission reduction goals.
As is well known, solar photovoltaic (PV) is the most promising and important technology to achieve carbon neutrality in the world in the 21st century [5]. Considering that roof PV [6] has unique advantages, such as its proximity to consumers [7], lack of a need for additional land [8], and shading and power supply energy-saving effects [9], it is an effective and suitable technology to increase the energy self-sufficiency rate of urban buildings and, as a result, to reduce their carbon emissions [10]. Researchers have developed various methods to estimate the roof solar photovoltaic potential [11]. Research on the Canary Islands suggests that 45 % of the total roof area of its buildings can provide 9000 GWh of the total electrical energy needs for the buildings [12]. Likewise, other research [13] on Seoul buildings shows that roof-based distributed PV panels can provide approximately 30 % of the city’s total annual electricity needs.
Though the roof-based distributed PV demonstrates enormous potential for power generation and carbon emission reduction, the roofs of many buildings around the world that can install photovoltaic are idle, which can be proven by taking China’s roof condition as an example. In 2020, the total building area of China was approximately 66 billion m 2 , including 29.2 billion m 2 for urban residential areas, 22.7 billion m 2 for rural residential areas, and 14 billion m 2 for public buildings. Although the installed roof area of distributed photovoltaic in China has continued to grow in recent years, there are still a large number of building roofs that are idle, which, in theory, could be installed with 830 million kilowatts of photovoltaic, with 123 trillion kWh of power generation annually [14]. As a matter of fact, photovoltaic power generation largely depends on the actual photovoltaic installed capacity, which is strongly correlated with the building roof area. Therefore, to fully utilize these idle roofs, an efficient and accurate method for estimating city-scale building roof area is crucial, which is an important basis for urban energy transformation planning and decision making [15].
Evaluating roof area using satellite images involves two steps: roof segmentation and area mapping. Roof segmentation refers to the use of semantic image segmentation techniques to identify pixels belonging to the roof from satellite remote sensing images, which is crucial for evaluating the roof area. After identifying the pixels belonging to the roof, the area of the roof can be calculated based on parameters such as the scale and shooting angle of the satellite image, which is called area mapping. Therefore, using semantic segmentation technology to accurately identify pixels belonging to the roof from satellite remote sensing images is the core step in evaluating the roof area, and the accuracy of semantic image segmentation is crucial for evaluating the roof area. Researchers have developed several methods to estimate the roof area [16,17] over the past few decades. Among these methods, machine learning algorithms that integrate with geographic information systems (GIS) are the most popular approach for estimating the roof solar photovoltaic potential of a large region. The general process of machine learning-based methods includes the following: (1) data collection and preprocessing; (2) model design and training; (3) model reasoning and result post-processing. Several satellite imagery segmentation datasets containing buildings such as Massachusetts [18], Inria Aerial Image Labeling [19], WHU [20], LoveDA [21], and ref. [22] have been published by researchers. Despite the fact that these public datasets provide high-precision building masks, manually annotated, we found that the building masks are generally larger than or equal to the mask area of the building roof (Figure 1). When we use building masks to evaluate the photovoltaic capacity that can be installed on building roofs, we receive an exaggerated evaluation result. Taking the three buildings in Figure 1 as an example, from the satellite image, we can calculate that their roof areas are 1184   m 2 , 1173   m 2 , and 1140   m 2 , respectively, with corresponding building areas of 2551   m 2 , 2750   m 2 , and 2549   m 2 . This means that the estimated roof photovoltaic power generation and carbon emission reduction potential calculated from the building area will be more than twice the actual value. One may argue that this issue is due to the use of heavily tilted remote sensing images. However, considering the large surface area of the Earth, remote sensing satellites cannot continuously adjust their positions to capture vertical images of each region, which is too inefficient and costly. Therefore, we cannot obtain vertical images of all regions. Additionally, accurately labeling the contours of building roofs on satellite images is a time-consuming, labor-intensive, and extremely challenging task. However, it is much simpler to only annotate whether there are buildings (roofs) in the image. In this paper, we refer to data that only annotate whether there are buildings (roofs) in the image as weakly labeled data. Therefore, determining how to fully utilize weakly labeled data to assist in training networks for roof segmentation is a worthwhile research objective.
Researchers applied machine learning algorithms such as agent-based modeling [23], the statistical method [24], CNN [25], FCN [19], Mask-RCNN [26], and UNet [27] in order to segment buildings from satellite images. Due to the use of early-developed computer vision algorithms with limited performance, the error in estimating the roof photovoltaic potential based on these algorithms is relatively large.
In this study, we attempted to solve the above limitations by improving current roof area estimation algorithms and developing a new building roof segmentation dataset. The accuracy of city-scale roof area estimation can be significantly improved. The main contributions of this study can be summarized as the following four aspects:
(1) We design an attention-based residual ublock, which is the basic block of the proposed network, to model the channel relationship.
(2) We propose a full-scale feature fusion strategy based on an attention mechanism to achieve full fusion and utilization of features in various stages of the network. Specifically, when fusing features at different scales, we use attention mechanisms to learn different weights for features at different scales.
(3) We develop a network with a ladder-like structure to enhance the sensitivity of the model to roofs using weakly labeled data. Specifically, we use image-level classification tasks to assist in training pixel-level semantic segmentation network.
(4) We contribute a new dataset for the study of building roof segmentation algorithms. Unlike existing datasets, the new dataset calculates roof area based on building roof boundaries rather than building boundaries. We verify the effectiveness of the proposed network on the new dataset and WHU dataset through experiments.
We organize the rest of this study as follows. In Section 2, we briefly review the works that are most closely related to this paper. The details of the proposed attention-based full-scale fusion (AFSF) network are presented in Section 3. The new roof segmentation dataset is described in Section 4. The experimental results are provided in Section 5 to show the effectiveness of the proposed approach. Finally, some concluding remarks are given in Section 7.

2. Related Work

In this section, we briefly review two types of works that are related to our approach: (1) deep learning methods for semantic segmentation of remote sensing imagery; (2) attention mechanisms.

2.1. Deep Learning Methods for Semantic Segmentation of Remote Sensing Imagery

On the one hand, semantic segmentation of remote sensing imagery is an important prerequisite for many applications of remote sensing images. On the other hand, in the past decade, deep learning has surpassed traditional algorithms in performance and become the mainstream technology in computer vision applications such as object detection [28], segmentation, and recognition. Intuitively, several classic deep learning-based semantic segmentation algorithms have been transferred to the semantic segmentation of remote sensing images [29]. A Fully Convolutional Network (FCN) [30] can accept input images of any size and classify them at the pixel level, thus solving the problem of semantic-level image segmentation. Several works extend FCN to the task of semantic segmentation of remote sensing imagery [19,31,32]. SegNet [33], consisting of an encoder and decoder, assists in restoring spatial information and improving the accuracy of boundary segmentation by reusing pooling position indices, and is applied to remote sensing image segmentation tasks [34]. DeepLab [35] is an extension of FCN but employs atrous convolution to enlarge the scope of filters. In [36], authors develop models based on DeepLab for land cover segmentation and road segmentation, respectively. UNet [37] shares a similar architecture to SegNet. The difference between UNet and SegNet is that UNet transfers the features extracted by the encoders to the corresponding decoders then concatenates them into upsampled feature maps. Several works [38,39] extend UNet to the remote sensing image segmentation task. DIResUNet [40] integrates an inception module and a dense global spatial pyramid pooling module in UNet to simultaneously extract multi-level features and contextual features. The authors in [41] introduce attention operation in the fusion of hierarchical features corresponding to the encoder and decoder of UNet network in order to achieve better multi-level feature fusion and improve the model’s ability to detect deforestation. The multi-attention-based semantic segmentation network proposed in [42] uses a coordinate attention-based residual network in the encoder and a content-aware reorganization module in the decoder to improve the extraction capability of the network. To solve the multi-scale problem, a fused attention module is adopted for feature map fusion. In [43], Depth-wise Pyramid Pooling (DPP) block and a dense block with multi-dilated depth-wise residual connections are designed to form the DPPNet for land cover segmentation from high-resolution satellite images, which takes full advantage of pyramid structure and features of different levels.
To further improve the accuracy of roof segmentation, we simultaneously introduce attention mechanisms in each basic feature extraction module of U2Net [44] and the operation of fusing features of different scales (full-scale feature fusion strategy based on attention mechanism). In fact, U2Net is an improved version of the UNet and has a two-level nested U structure. To the best of our knowledge, the full-scale feature fusion strategy based on attention mechanism is the first work which can fully integrate the features of all levels in the U2Net (both encoder and decoder) through attention method, which is useful for semantic segmentation tasks. Furthermore, we add another branch to the network to further enhance the sensitivity of the model to building roofs by utilizing weakly labeled data.

2.2. Visual Attention Mechanism

Inspired by the human cognitive system, researchers design various attention modules to help visual models focus on the essential features, thus model performance can be improved [45]. In [46], the Squeeze-and-Excitation Block designs a method to learn the weight for each channel of the convolution block’s output, then applies the weight to choose the best representation from features of different channels. Convolutional Block Attention Module [47] applies sequential channel attention and spatial attention to refine the intermediate feature map at every convolutional block. DANet [48] weights and selectively aggregates the features of all positions through the position attention module, and selectively emphasizes interdependent channel maps by integrating associated features among all channel maps by the channel attention module. RANet [49] introduces two blocks, i.e., the Region Construction Block and the Region Interaction Block, to embed local features of each layer into an elongated representation. ACFNet [50] extracts global context from a classification perspective by proposing an Attentional Class Feature module for improving semantic segmentation performance.
In this study, we introduce attention mechanism in the U2Net network, aiming to simultaneously enhance the network’s feature extraction and full-scale feature fusion capabilities. To the best of our knowledge, this is the first attempt to use the attention mechanism simultaneously in feature extraction and full-scale feature fusion stages.

3. The Proposed Attention-Based Full-Scale Fusion Network

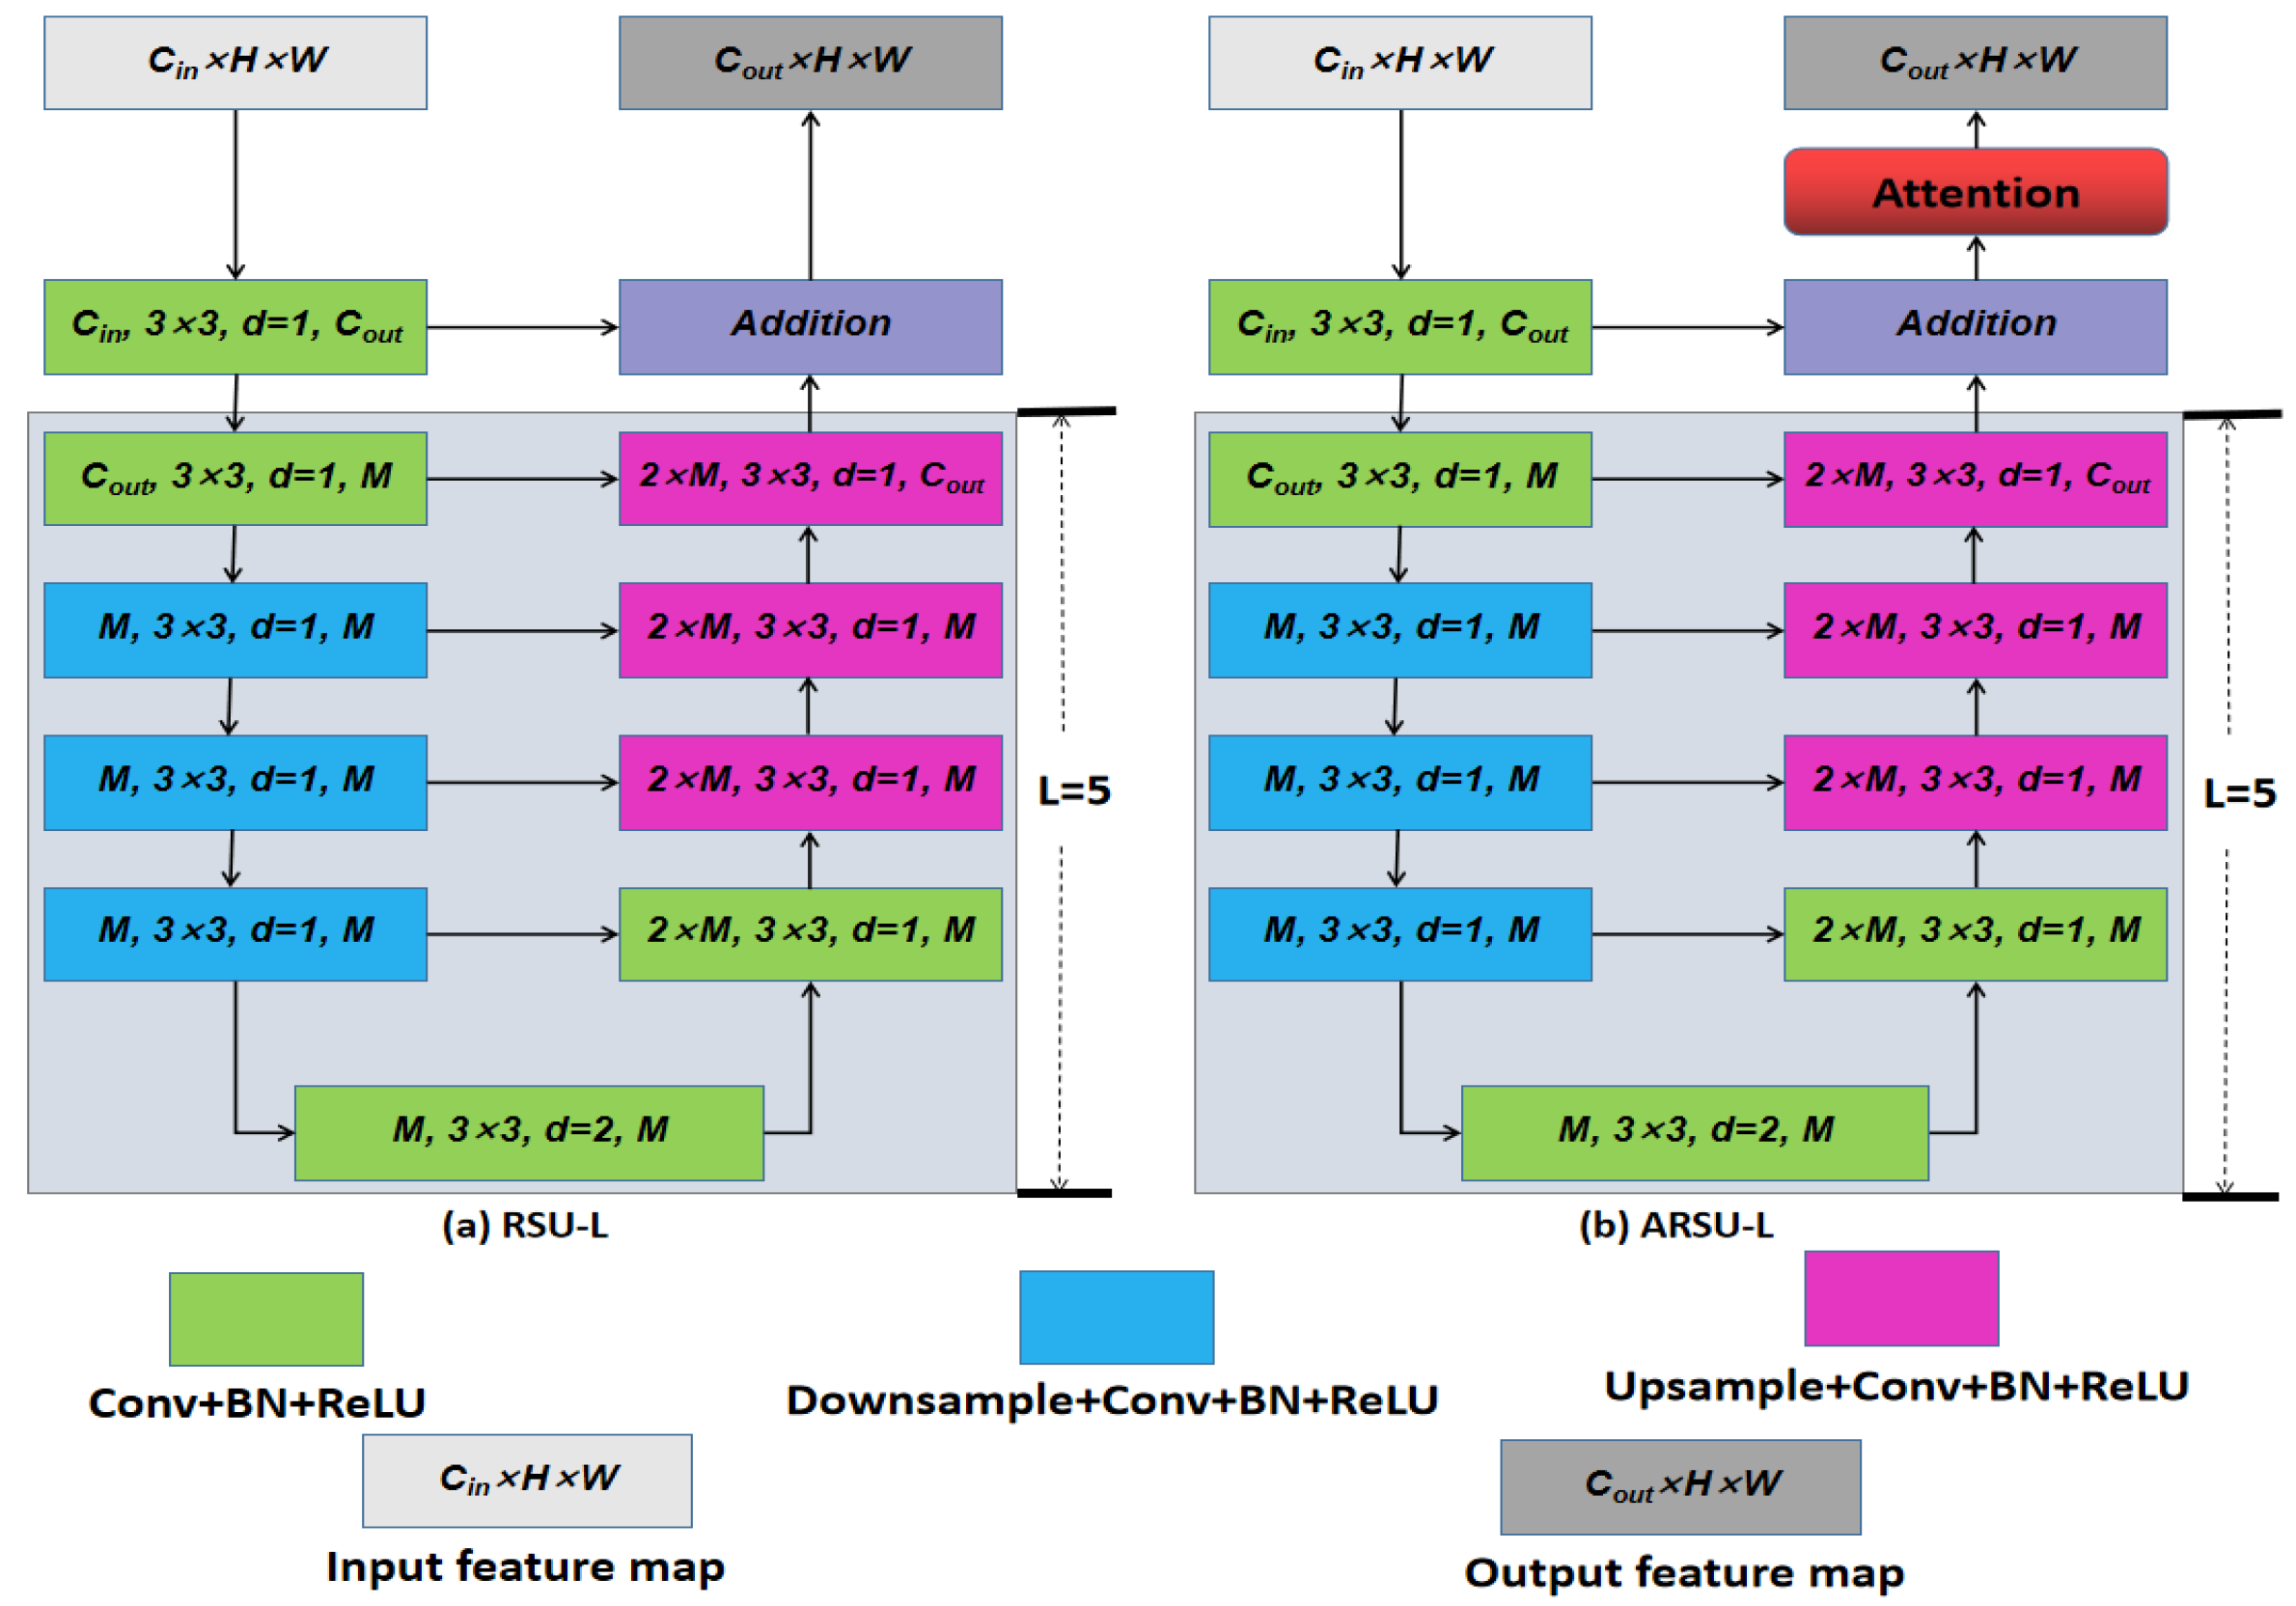
3.1. Attention-Based Residual Ublock

The core of U2Net [44] is the residual ublock (RSU) module. RSU is proposed to capture intra-stage multi-scale features. The structure of RSU-L is presented in Figure 2a. As can be seen, RSU-L is composed of four basic modules stacked together: C o n v + B N , C o n v + B N + R e L U , D o w n s a m p l e + C o n v + B N + R e L U , and U p s a m p l e + C o n v + B N + R e L U . The definitions of C o n v , B N , D o w n s a m p l e , U p s a m p l e , and R e L U are shown in Table 1, and + represents that the two modules before and after it are connected in series. Take the C o n v + B N + R e L U block with a parameter of ( C i n , 3 × 3 ,   d = 1 ,   C o u t ) in Figure 2a as an example: it consists of a convolutional layer, batch-norm layer, and an R e L U activation layer. The kernel size, stride size, and dilation size of the convolutional layer are 3 × 3 , 1, and 1, respectively. The numbers of the channel of the input feature and output feature of the C o n v + B N + R e L U block are C i n and C o u t , respectively. Given a feature map x C i n × H × W , where C i n refers to the number of channels in x C i n × H × W , and H and W denote the height and width of x, respectively, it is first input into a C o n v + B N + R e L U block to extract the local features x C o u t × H × w 0 . Then, x C o u t × H × w 0 is processed by a UNet-like symmetric encoder–decoder structure with a height of L to produce the multi-scale contextual feature x C o u t × H × w = μ x C o u t × H × W 0 . Note that the first basic block of RSU-L’s encoder is a C o n v + B N + R e L U with a dilation size of 1, the last basic block of RSU-L’s encoder is C o n v + B N + R e L U with a dilated size of 2, and the remaining L 2 modules of the encoder use D o w n s a m p l e + C o n v + B N + R e L U ; for the decoder, the first basic block is a C o n v + B N + R e L U with a dilated size of 1, and the remaining L 2 modules use U p s a m p l e + C o n v + B N + R e L U . Finally, the local features x C o u t × H × w 0 and x C o u t × H × w are summarized by a residual connection to produce the output of the RSU-L block: x C o u t × H × w = x C o u t × H × w 0 + x C o u t × H × w . In order to better extract features from small-resolution feature maps, the pooling layer and upsampling layer in the RSU-4 block are replaced with dilated convolution to form RSU-4F so that all intermediate features have the same resolution as the input feature maps.
Different objects (e.g., roofs) may have different scales, such that multi-scale features also need to be considered in image segmentation. The RSU module is a feature pyramid network, which can provide rich feature information, enabling segmentation models to better distinguish the boundaries and regions of different objects. Compared with the UNet [37] network, the RSU in this work is equivalent to applying the idea of two feature pyramids, which can better capture features of different scales.
Residual ublock with attention: The Squeeze-and-Excitation (SE) block [46] is an attention proposed to model the channel relationship and enhance the important features so that the model can focus more on features related to the target to be segmented. The SE block consists of two operations: squeeze and excitation. The squeeze operation is designed to compute the global information representation vector. Given an input feature x C × H × w , the SE block first applies the global average pooling to each channel:
g k = F s q x k = 1 W × H i = 1 W j = 1 H x k i , j ,
where g k refers to the global information representation value of the k t h channel. Then, the global information representation vector g, which consists of the global information representation value of all channels, is processed by the excitation operation. The excitation operation adopts two fully connected layers F e x to learn the weight for each channel. Note that the first fully connected layer is followed by a ReLU layer, and the second fully connected layer is followed by a sigmoid layer. The excitation operation can be expressed as follows:
ω = F e x g = S i g m o i d F C Re L U F C g ,
where F C , R e L U , and s i g m o i d refer to the fully connected layer, R e L U function, and s i g m o i d function, respectively. Finally, the output of the SE block is x C × H × W = Φ g , ω . The diagram of the SE block is shown in Figure 3.
Inspired by the excellent performance of the SE block [46], we integrate the SE block into the RSU block to form the attention-based RSU block (ARSU). As can be seen in Figure 2b, in the ARSU block, the SE block is applied to the output of the RSU module. In the proposed AFSF network (Figure 4), we stack several ARSU or ARSU-4F blocks to form the encoder and decoder. As illustrated in Figure 4, in the encoder stage, six ARSU or ARSU-4F blocks are connected in series through a downsampling operation; in the decoder stage, five ARSU or ARSU-4F blocks are connected in series through the upsampling operation. To generate the auxiliary prediction mask, we apply a mask generator, which consists of a 3 × 3 convolution layer, upsampling operation, and sigmoid function, to each output feature of the last encoder and all decoders. For clarity, we mark the modules connected to the mask generator in purple in Figure 4. For each purple module, its output feature map is copied into two copies: one for the input part of the next RSU or RSU-L module, and the other for the input to the mask generator. In addition, the output masks of the last encoder and all decoders are first concatenated in the channel dimension and then processed by another mask generator to produce the fusion mask. Note that, during the test (inference) phase, we adopt the fusion mask as the only prediction mask of the model.

3.2. Full-Scale Fusion with Attention (FSFA)

The semantic information contained in features at different scales of the network varies, and their impact on semantic segmentation tasks also varies. We believe that fully fusing features from various scales is beneficial for improving semantic segmentation tasks. Meanwhile, when performing feature fusion, it is necessary to consider the differences in importance of features at different scales. Taking inspiration from the UNet 3+ [51] and attention mechanism [46], we design an attention-based full-scale feature fusion module. For the convenience of description, we number all modules (ARSU or ARSU-4F block) of the model according to the positive direction of information flow in the model. The first encoder module is numbered as 1, and the last decoder module is numbered as n E + n D , where n E and n D are the number of modules included in the encoder and decoder, respectively. The input of module n ( 1 < n < = n E + n D ) is the fusion of the outputs from modules 1 to n 1 , i.e., O 1 ,   O 2 ,   O n 1 . Taking the module numbered n as an example to explain our FSFA mechanism, firstly, we unify the size of all feature maps in O 1 ,   O 2 ,   O n 1 . Specifically, for feature maps with a size larger than O n 1 , we use adaptive max pooling to downsample the feature maps to the same size as O n 1 . For feature maps with a size smaller than O n 1 , we use bilinear interpolation to upsample the feature maps to the same size as O n 1 . Then, we concatenate all uniformly sized features and apply the SE operation [46] to them. Finally, we use a convolutional layer with a kernel size of 1, a batch-norm layer, and an ReLU layer to reduce the number of channels and control the size of the model parameters.

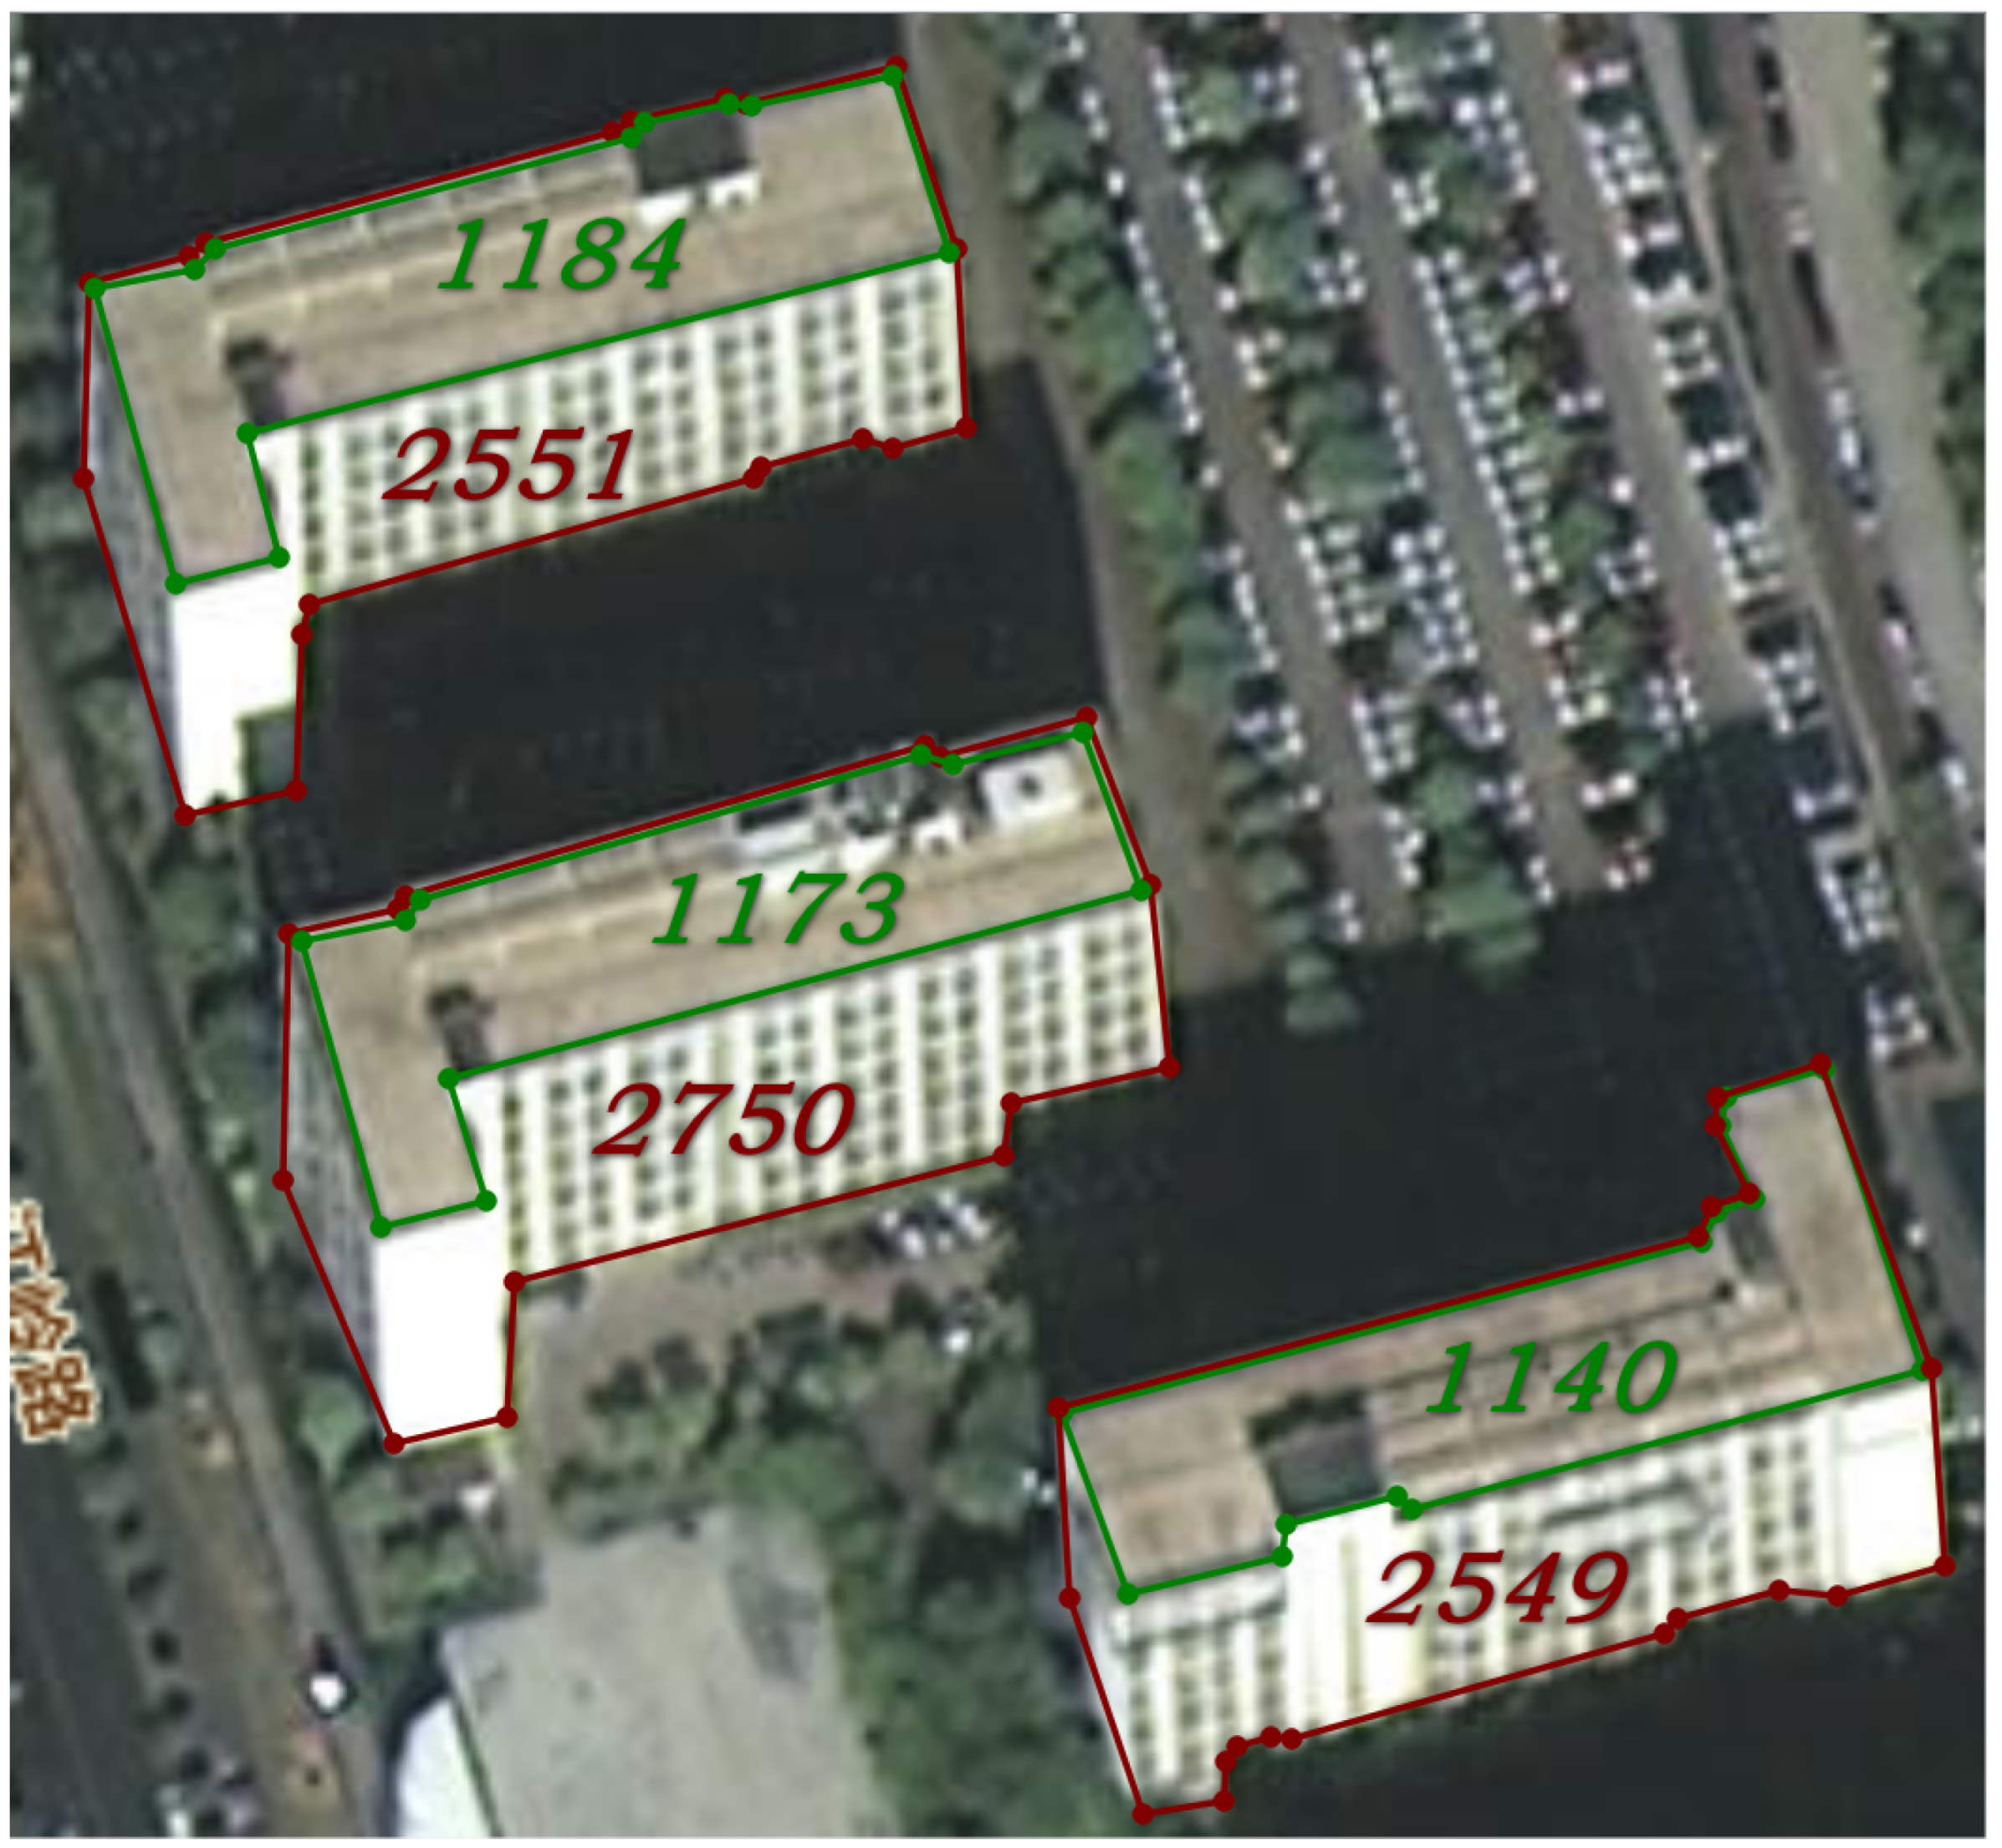
3.3. Roof Discrimination

Considering the high cost of annotating semantic segmentation data and the fact that satellite images without buildings can be easily selected (weakly labeled images), we add a roof discrimination (RD) module to predict whether the input image has a roof or not. The roof discrimination module consists of a dropout layer, a convolutional layer with kernel of 1 × 1 , a max-pooling layer, and a sigmoid layer. Through this extra classification task, weakly labeled images can be further utilized to enhance the network’s representation ability. Note that the roof discrimination module is applied to the output of the last encoder.
We manually select weakly labeled data. The weakly labeled data used in this study belong to the same batch of data captured by the same satellite as the labeled data, ensuring consistency in image quality and a lack of environmental differences. It should be noted that the cost of the selection is much lower than that of the annotation of semantic segmentation datasets.

3.4. Loss Function

Similarly to [44], we adopt the following loss to train the model:
Γ = ζ f u s e + k = 1 K ζ a u k ,
where ζ a u and ζ f u s e denote the loss of the auxiliary prediction mask and fusion mask, respectively. For the ζ a u , K = 6 , corresponding to the prediction mask output by five decoders and the prediction mask output by the last encoder. To calculate each term ζ , we adopt the standard binary cross-entropy function:
ζ = r , c H , W P G r , c log P S r , c + 1 P G r , c log 1 P S r , c .
In addition, we apply a binary cross-entropy loss function [52] Ψ to the output of the roof discrimination module, thereby utilizing weakly labeled data to enhance the model’s sensitivity to roofs and non-roofs.

3.5. Implementation Details

The proposed AFSF network is implemented using the PyTorch 2.0 [53] framework on two NVIDIA GTX 3090 GPUs. We train the proposed AFSF network 1000 epochs from scratch on the new roof dataset. The adjustment strategy of the learning rate is the same as that of [44]. We set the batch size to 128. In each batch, 64 images contain buildings (roofs), while the remaining 64 images do not contain any building (roof). At the training phase, each image is first randomly cropped to 128 × 128 . To increase the diversity of the training data, we adopt the following data augmentation operations: (1) geometric deformation enhancement operations, i.e., RandomAffine, RandomErasing, RandomFisheye, RandomHorizontalFlip, RandomVerticalFlip, RandomRotation, and RandomThinPlateSpline; and (2) non-geometric deformation enhancement operations, i.e., RandomGaussianBlur, RandomElasticTransform, RandomPlasmaBrightness, RandomPlasmaContrast, RandomGamma, RandomGrayscale, RandomGaussianNoise, RandomHue, RandomMotionBlur, RandomPosterize, RandomSaturation, RandomSharpness, RandomSolarize, RandomMedianBlur, RandomSnow, RandomRain, RandomBoxBlur, RandomBrightness, RandomContrast, RandomInvert, RandomPerspective, RandomPlanckianJitter, and RandomPlasmaShadow, implemented in kornia [54]. To add more detail, in each training iteration, we randomly select one to three geometric deformation enhancement operations and one to five non-geometric deformation enhancement operations, while for the testing phase, we do not use any data augmentation method.

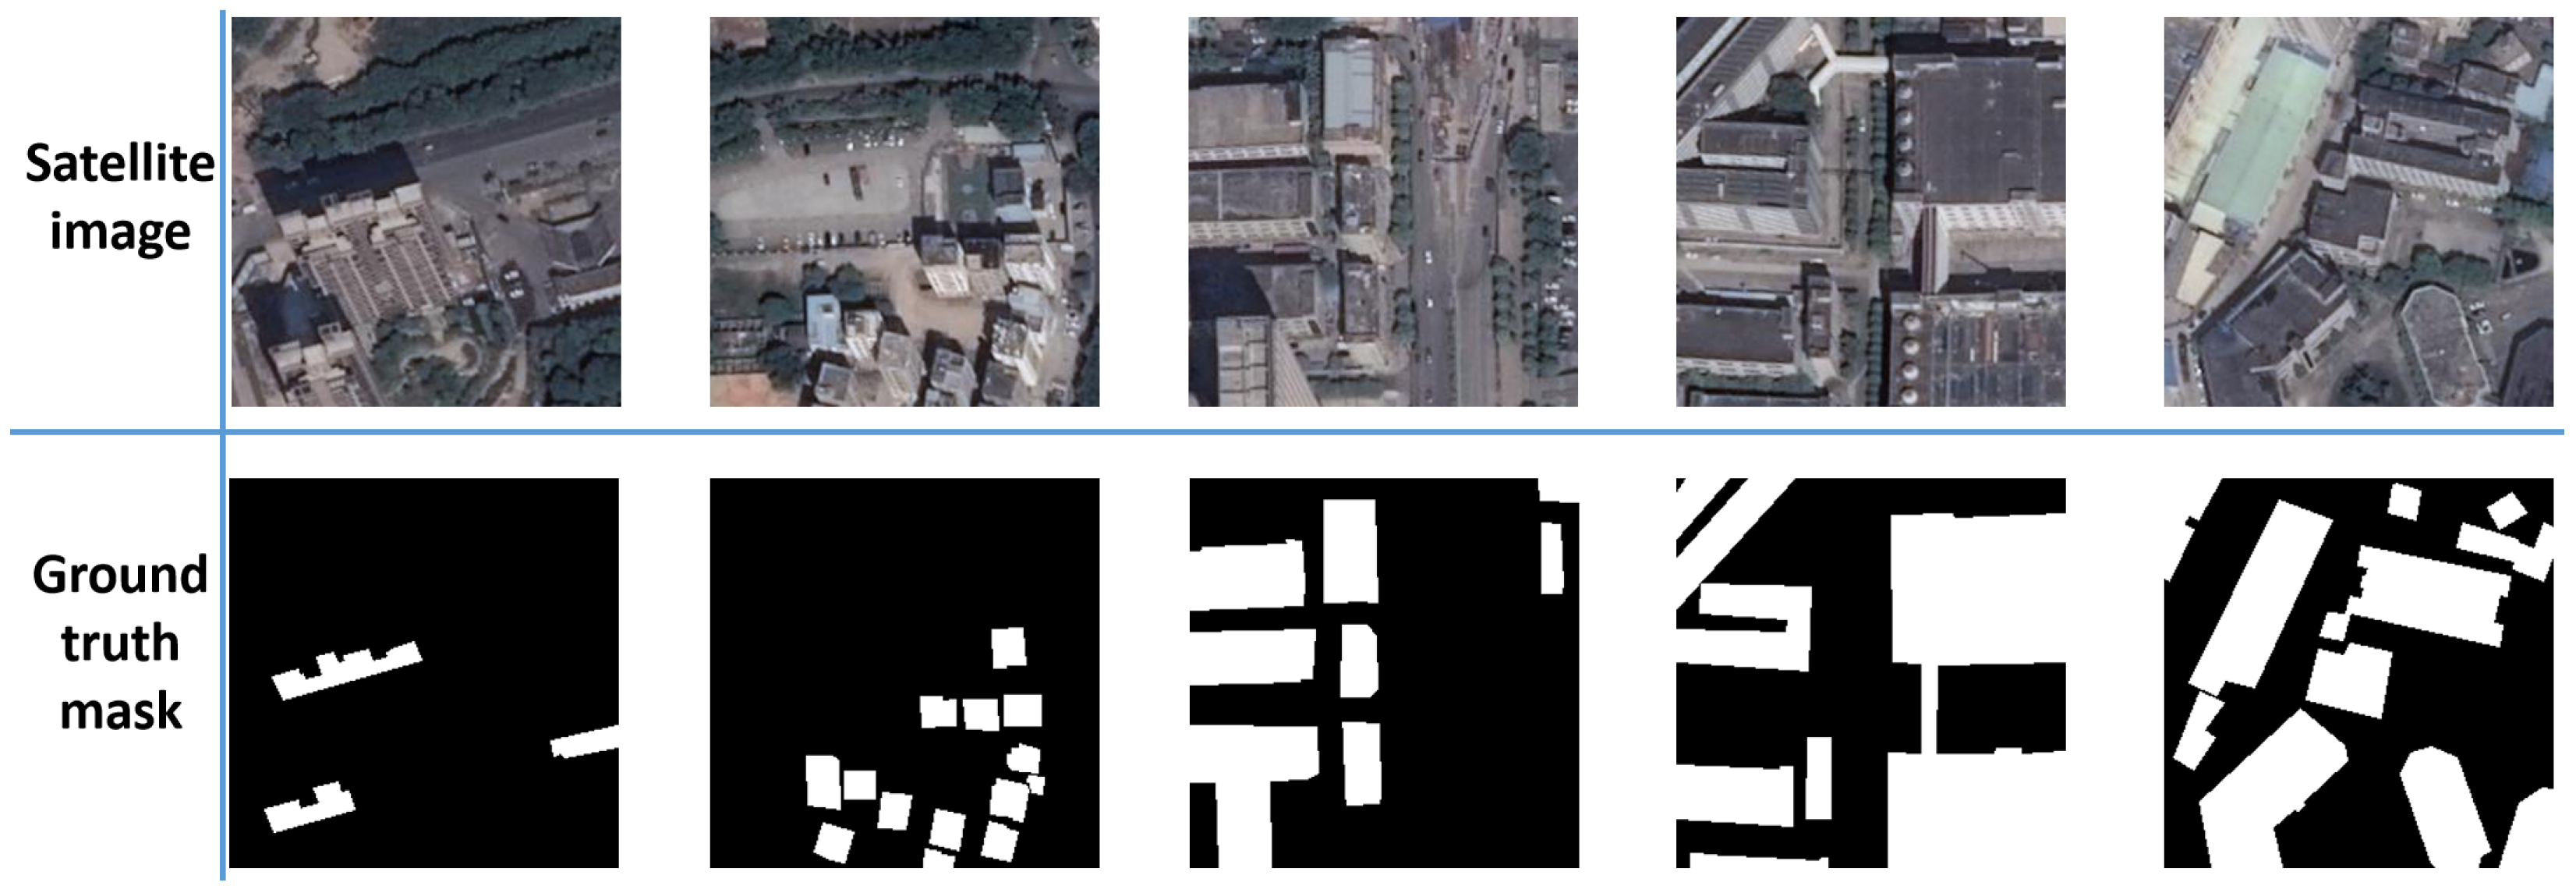
4. Roof Segmentation Dataset

We use the Shuijing micro-image software (http://www.rivermap.cn/down.html) (accessed on 15 May 2024) to obtain satellite images and then use the labelme (https://github.com/mpitid/pylabelme) (accessed on 15 May 2024) software to annotate satellite images. In the satellite imagery view of the Shuijing Micromap software, we select the target area through the rectangular box, then set the zoom level and the size of a single tile, and then we can download all tiles in the area. In this study, we choose Shenzhen, Guangdong, China as the target area, with a zoom level of 19. Each tile is an RGB image with a size of 256 × 256 . It is worth pointing out that the zoom level of each satellite image should be recorded, as it will be used to calculate the roof area based on the roof mask map.
We selected 2188 images containing buildings from the downloaded tiles and used the labelme software to obtain the roof outline annotation file. It should be noted that, in order to accurately predict the roof area, we use the roof boundaries instead of the building boundaries as the annotation target. Afterward, a program based on Opencv was written to generate roof masks from roof contour annotation files. Finally, we obtained a total of 15,468 roof masks. Some examples of the new roof segmentation dataset are presented in Figure 5. To facilitate the measurement of the performance of the model to be tested, we selected 200 images from 2188 and used these 200 images and their corresponding masks as the test set, while other images and corresponding masks were used as the training set.

5. Experiments

5.1. Evaluation Metrics

To evaluate the performance of the proposed method, three commonly used evaluation indicators in semantic segmentation are adopted in this paper, namely precision, recall, and mIoU. Since the calculation of these four indicators requires the use of four other basic indicators, True Positives (TP), True Negatives (TN), False Positives (FP), and False Negatives (FN), we present the definition of them in Table 2. Then, the precision refers to the ratio of pixels correctly classified as positive by the model to all pixels classified as positive by the model, and the formula for calculating precision is
p r e c i s i o n = T P T P + F P
The recall denotes the ratio of pixels correctly classified as positive by the model to all true positive pixels, and the value of the recall is given by the equation,
r e c a l l = T P T P + F N
Finally, the intersection over union (IoU) is defined as the ratio of the intersection of the model predictions and the true values of each category.
I o U = T P F N + F P + T P

5.2. Ablation Study

In this section, we analyze the validity of each component in the AFSF network. In order to clearly verify the effectiveness of each module or part proposed in this study, we add one module at a time and observe the changes in model performance. Note that we use U2Net as the baseline network in this section.
The effect of attention-based residual ublock: We start our ablation study by verifying the effectiveness of the attention module introduced in the residual ublock. As shown in Table 3, when introducing attention mechanisms into the basic modules of the U2Net network ( U 2 N e t + A R U ), we observed that the model precision, recall, and IoU were improved by 2.7 % , 3.6 % , and 3.2 % , respectively, compared with the U2Net. The improvement of various indicators indicates that introducing an attention mechanism in the feature extraction stage can effectively enhance the model’s ability to extract semantic features, thereby enhancing the semantic segmentation effect of the model.
The effect of full-scale fusion with an attention module: As can be seen in Table 3, after introducing full-scale fusion with an attention operation on the basis of U 2 N e t + A R U ( U 2 N e t + A R U + F S F A ), the precision, recall, and IoU of the model have been improved again by 4.0 % , 2.4 % , and 3.2 % , respectively. These improvements confirm that there are differences in the information contained in multi-scale features, and sufficient multi-scale feature fusion is beneficial for semantic segmentation tasks.
The effect of roof discrimination: As for the last part of our ablation study, we add a roof discrimination branch and apply a roof discrimination function to the output of the last encoder in U 2 N e t + A R U + F S F A (AFSF in Table 3). Meanwhile, we introduce weakly labeled data during the network training phase. It can be observed that the performance of the model has been improved, with improvements of 0.3 % , 2.2 % , and 1.2 % in precision, recall, and IoU, respectively. These results demonstrate the effectiveness of introducing weakly labeled data in improving the performance of semantic segmentation models.

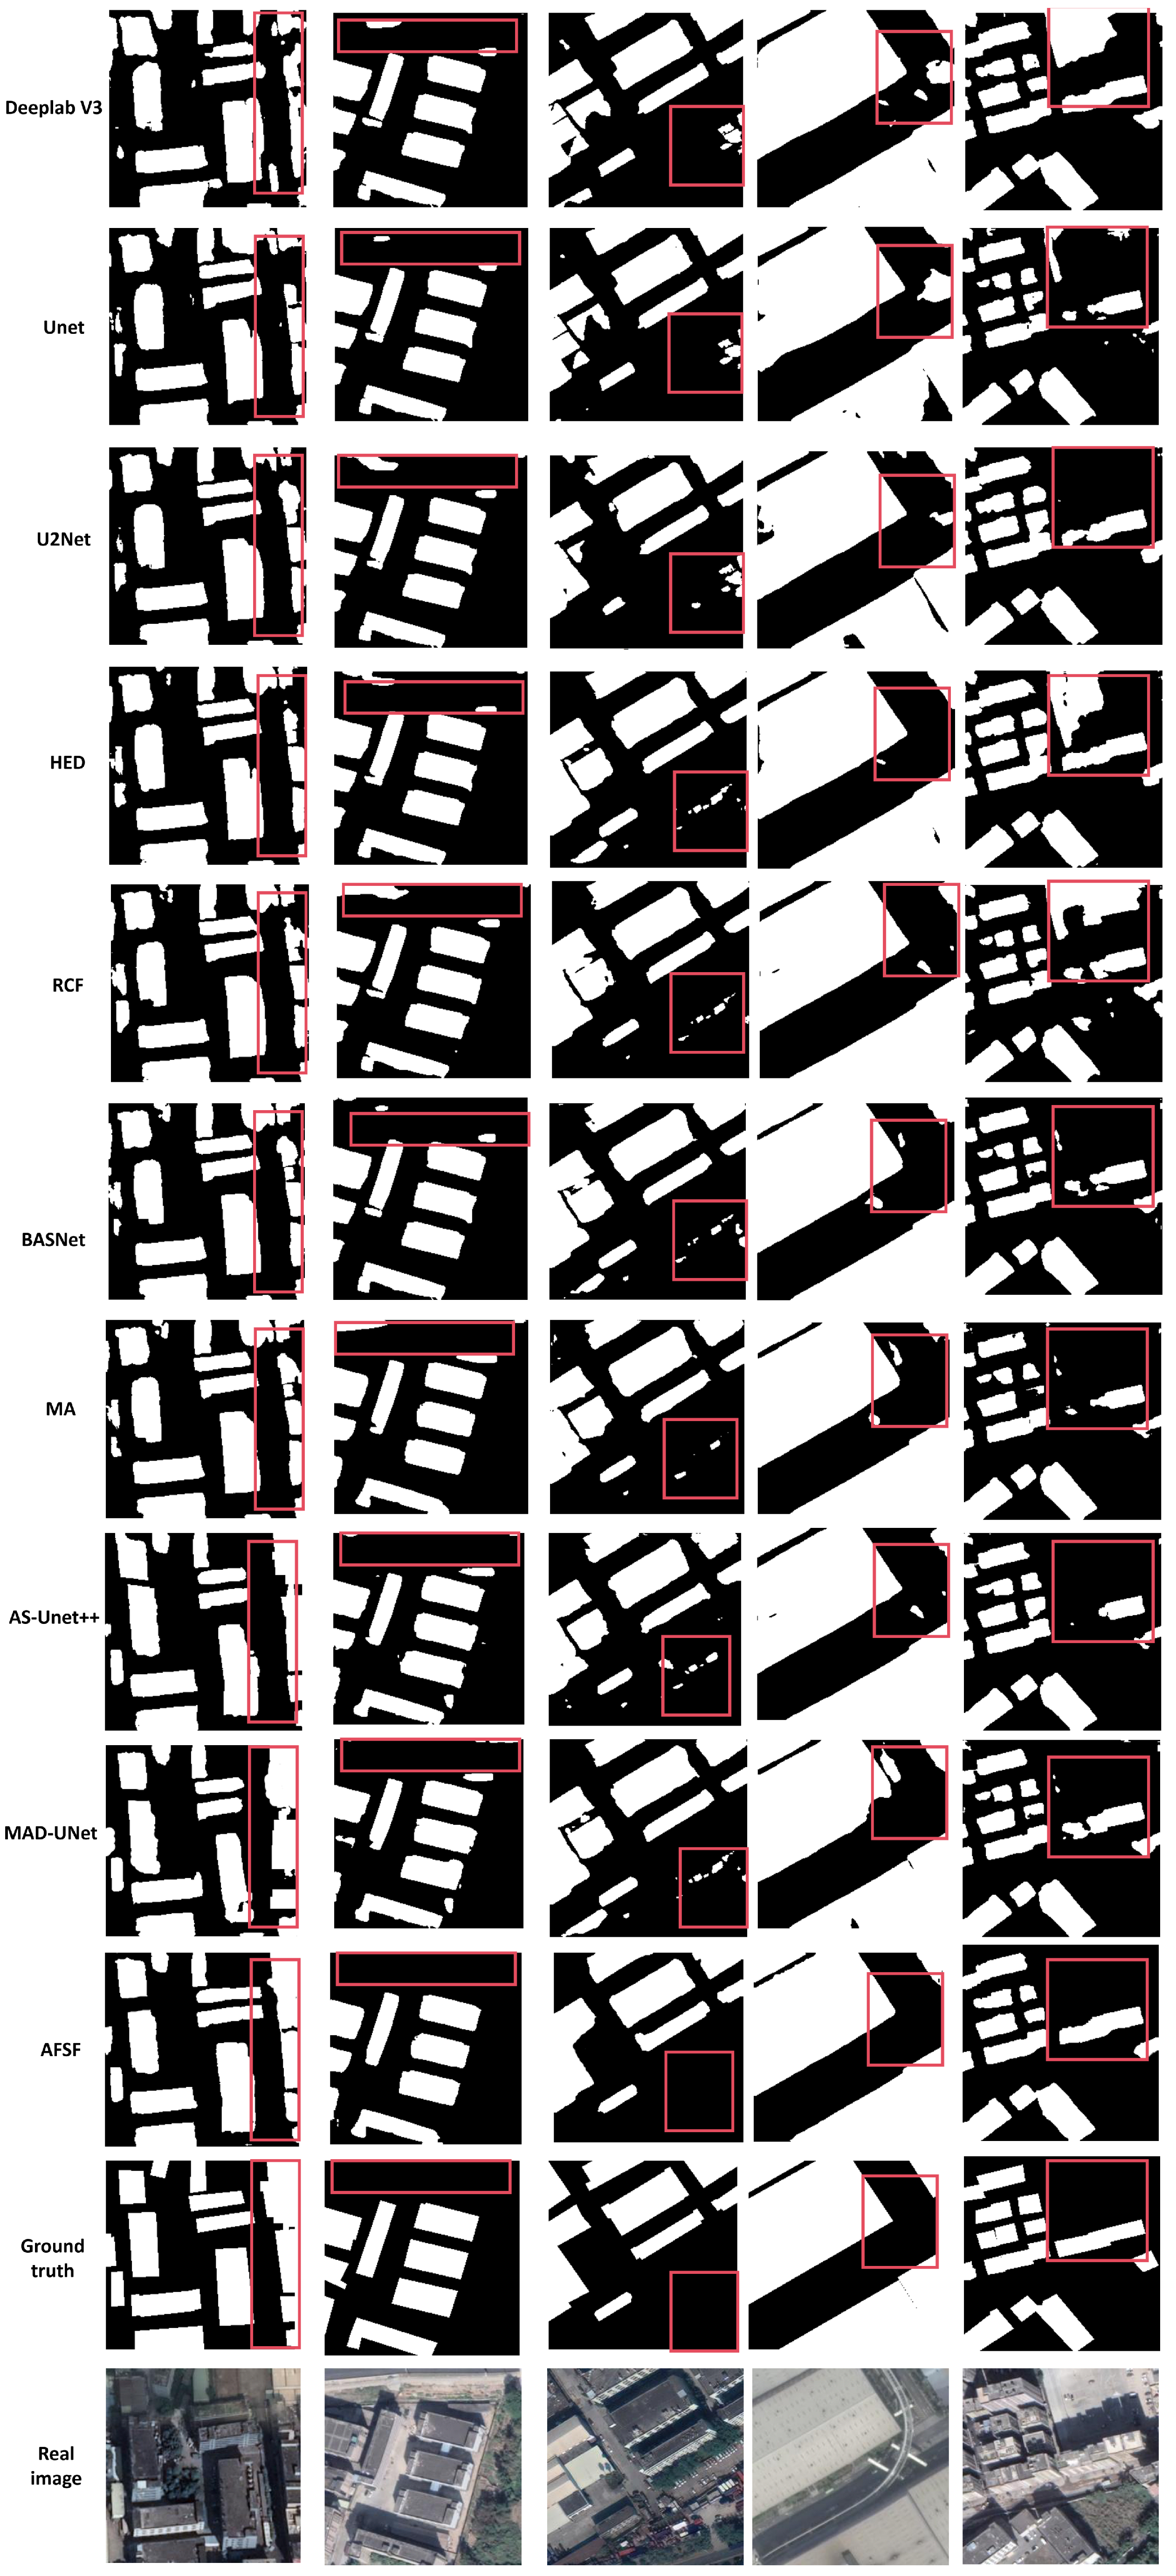
5.3. Comparison with the State of the Art

To verify the effectiveness of the proposed AFSF network, we conducted experiments on the new roof segmentation dataset and two common remote sensing semantic image segmentation datasets, i.e., the Inria Aerial Image Labeling (IAIL) [19] and WHU [20] datasets, and compare the results with several state-of-the-art methods, including Deeplab V3 [55], UNet [37], U2Net [44], HED [56], RCF [57], BASNet [58], MA [42], AS-UNet++ [59], and MAD-UNet [60].
Results on the new roof segmentation dataset: We compare our AFSF network with several state-of-the-art methods. Table 4 illustrates the results of three evaluation metrics using seven methods on the new roof segmentation dataset. Our results show that the proposed AFSF network achieves the best performance on all three indicators. More specifically, the proposed AFSF network is 1.8 % , 2.6 % , and 3.1 % higher than the best compared method, AS-UNet++ [59], in precision, recall, and IoU, respectively. These results highlight the effectiveness of the proposed AFSF network. It should be noted that both AS-UNet++ and MAD-UNet are based on UNet networks and both introduce attention mechanisms. We believe that, compared with AS-UNet++ and MAD-UNet, our method can better integrate features from all levels, which is important for semantic segmentation tasks. In addition, we also utilized more weakly labeled data to train the model, thereby improving its generalization ability. Figure 6 displays the segmentation results of the proposed AFSF and compared methods.
Result on the IAIL [19] and WHU [20] datasets: To further validate the effectiveness of the proposed AFSF network, we compared the performance of our method with several state-of-the-art methods on the IAIL and WHU datasets in Table 5 and Table 6. As we can see, our AFSF network achieves the best performance in all metrics on both of the two datasets. For example, on the IAIL dataset, the proposed AFSF network outperforms the second-best model, AS-UNet++ [59], by 0.7 % , 0.7 % , and 1.1 % in terms of the precision, recall, and IoU, respectively; on the WHU dataset, the proposed AFSF network outperforms the second-best model, AS-UNet++ [59], by 0.6 % , 0.5 % , and 0.8 % in terms of the precision, recall, and IoU, respectively.

6. Limitations of the Model and Future Work

The method proposed in this article has low detection accuracy for some roof edges, especially for roof edges with variable shapes in small areas. The model can be improved in the future to enhance its detection performance on roof edges and, in addition, to consider that there may be some pipelines and other facilities on the roof. Generally speaking, the area where photovoltaics can be installed on the roof is equal to the total roof area minus the area occupied by pipelines and other facilities. The current method is to directly multiply the empirical coefficient by the roof area to obtain the area where photovoltaics can be installed, which has a certain degree of error. Therefore, if the model can accurately identify the structures inside the roof after identifying the roof area, it can further accurately calculate the area where photovoltaic panels can be installed on the roof, which is also a point that can be further studied.

7. Conclusions

In this study, we analyze the difficulties of the existing task of segmenting roofs from satellite images, including the shortcomings of existing models and the problems of existing datasets in this task. To address the shortcomings of existing models, we propose an attention-based full-scale fusion (AFSF) network to segment roofs more accurately from satellite images. Specifically, we develop an attention-based residual ublock to model the channel relationship of the feature maps. By integrating attention mechanisms in multi-scale feature fusion, our model learns different weights for features of different scales. In addition, we propose the ladder-like network to utilize weakly labeled data; therefore, the pixel-level semantic segmentation tasks are assisted by the image-level classification tasks. In order to train the model to segment the roof instead of the entire building, we constructed a new roof segmentation dataset that provides accurate roof segmentation masks. The experimental results on the new roof segmentation dataset and WHU dataset demonstrate the effectiveness of the proposed AFSF network.

Author Contributions

Conceptualization, H.Q., Y.Z. and L.C.; Methodology, L.C., Q.M. and F.Q.; Dataset, Z.L.; Experiment, L.C. and F.Q.; Writing—original draft, L.C.; Writing—review and editing, Y.Z., Q.M. and Z.L. All authors have read and agreed to the published version of the manuscript.

Funding

This research was supported in part by Key Research Program of China Construction (CSCEC-2021-J-2); Key Research Program of China Southern Power Grid (090000KK52210134); Tsinghua SIGS-CCSTG Future City Joint Lab funding; Research and Development Project of Ministry of Housing and Urban-Rural Development of the People’s Republic China (Grant No. 2022-K-121).

Institutional Review Board Statement

Not applicable.

Informed Consent Statement

Not applicable.

Data Availability Statement

Conflicts of Interest

AuthorHe Qi was employed by the company CCSTC (China Construction Science and Technology Cooperation), Low-Carbon & Smart City Technology Co. The remaining authors declare that the research was conducted in the absence of any commercial or financial relationships that could be construed as a potential conflict of interest.

References

  1. Zhao, X.; Ma, X.; Chen, B.; Shang, Y.; Song, M. Challenges toward carbon neutrality in China: Strategies and countermeasures. Resour. Conserv. Recycl. 2022, 176, 105959. [Google Scholar] [CrossRef]
  2. Liu, J.; Yin, M.; Xia-Hou, Q.; Wang, K.; Zou, J. Comparison of sectoral low-carbon transition pathways in China under the nationally determined contribution and 2 °C targets. Renew. Sustain. Energy Rev. 2021, 149, 111336. [Google Scholar] [CrossRef]
  3. Zhou, N.; Khanna, N.; Feng, W.; Ke, J.; Levine, M. Scenarios of energy efficiency and CO2 emissions reduction potential in the buildings sector in China to year 2050. Nat. Energy 2018, 3, 978–984. [Google Scholar] [CrossRef]
  4. Huo, T.; Cao, R.; Du, H.; Zhang, J.; Cai, W.; Liu, B. Nonlinear influence of urbanization on China’s urban residential building carbon emissions: New evidence from panel threshold model. Sci. Total Environ. 2021, 772, 145058. [Google Scholar] [CrossRef] [PubMed]
  5. Jiang, H.; Lu, N.; Wang, X. Assessing Carbon Reduction Potential of Rooftop PV in China through Remote Sensing Data-Driven Simulations. Sustainability 2023, 15, 3380. [Google Scholar] [CrossRef]
  6. Jiang, H.; Yao, L.; Lu, N.; Qin, J.; Liu, T.; Liu, Y.; Zhou, C. Geospatial assessment of rooftop solar photovoltaic potential using multi-source remote sensing data. Energy AI 2022, 10, 100185. [Google Scholar] [CrossRef]
  7. Bódis, K.; Kougias, I.; Jäger-Waldau, A.; Taylor, N.; Szabó, S. A high-resolution geospatial assessment of the rooftop solar photovoltaic potential in the European Union. Renew. Sustain. Energy Rev. 2019, 114, 109309. [Google Scholar] [CrossRef]
  8. Sacchelli, S.; Garegnani, G.; Geri, F.; Grilli, G.; Paletto, A.; Zambelli, P.; Ciolli, M.; Vettorato, D. Trade-off between photovoltaic systems installation and agricultural practices on arable lands: An environmental and socio-economic impact analysis for Italy. Land Use Policy 2016, 56, 90–99. [Google Scholar] [CrossRef]
  9. Wang, D.; Qi, T.; Liu, Y.; Wang, Y.; Fan, J.; Wang, Y.; Du, H. A method for evaluating both shading and power generation effects of rooftop solar PV panels for different climate zones of China. Sol. Energy 2020, 205, 432–445. [Google Scholar] [CrossRef]
  10. Gassar, A.A.A.; Cha, S.H. Review of geographic information systems-based rooftop solar photovoltaic potential estimation approaches at urban scales. Appl. Energy 2021, 291, 116817. [Google Scholar] [CrossRef]
  11. Jurasz, J.K.; Dąbek, P.B.; Campana, P.E. Can a city reach energy self-sufficiency by means of rooftop photovoltaics? Case study from Poland. J. Clean. Prod. 2020, 245, 118813. [Google Scholar] [CrossRef]
  12. Schallenberg-Rodríguez, J. Photovoltaic techno-economical potential on roofs in regions and islands: The case of the Canary Islands. Methodological review and methodology proposal. Renew. Sustain. Energy Rev. 2013, 20, 219–239. [Google Scholar] [CrossRef]
  13. Byrne, J.; Taminiau, J.; Kurdgelashvili, L.; Kim, K.N. A review of the solar city concept and methods to assess rooftop solar electric potential, with an illustrative application to the city of Seoul. Renew. Sustain. Energy Rev. 2015, 41, 830–844. [Google Scholar] [CrossRef]
  14. Tsinghua University Building Energy Efficiency Research Center. Annual Development Research Report on Building Energy Efficiency in China; China Architecture and Building Press: Beijing, China, 2022. [Google Scholar]
  15. Zhong, T.; Zhang, Z.; Chen, M.; Zhang, K.; Zhou, Z.; Zhu, R.; Wang, Y.; Lü, G.; Yan, J. A city-scale estimation of rooftop solar photovoltaic potential based on deep learning. Appl. Energy 2021, 298, 117132. [Google Scholar] [CrossRef]
  16. Sampath, A.; Bijapur, P.; Karanam, A.; Umadevi, V.; Parathodiyil, M. Estimation of rooftop solar energy generation using Satellite Image Segmentation. In Proceedings of the 2019 IEEE 9th International Conference on Advanced Computing (IACC), Tiruchirappalli, India, 13–14 December 2019; IEEE: Piscataway, NJ, USA, 2019; pp. 38–44. [Google Scholar]
  17. Zhang, Z.; Qian, Z.; Zhong, T.; Chen, M.; Zhang, K.; Yang, Y.; Zhu, R.; Zhang, F.; Zhang, H.; Zhou, F.; et al. Vectorized rooftop area data for 90 cities in China. Sci. Data 2022, 9, 66. [Google Scholar] [CrossRef] [PubMed]
  18. Mnih, V. Machine Learning for Aerial Image Labeling. Ph.D. Thesis, University of Toronto, Toronto, ON, Canada, 2013. [Google Scholar]
  19. Maggiori, E.; Tarabalka, Y.; Charpiat, G.; Alliez, P. Can Semantic Labeling Methods Generalize to Any City? The Inria Aerial Image Labeling Benchmark. In Proceedings of the IEEE International Geoscience and Remote Sensing Symposium (IGARSS), Fort Worth, TX, USA, 23–28 July 2017; IEEE: Piscataway, NJ, USA, 2017. [Google Scholar]
  20. Ji, S.; Wei, S.; Lu, M. Fully convolutional networks for multisource building extraction from an open aerial and satellite imagery data set. IEEE Trans. Geosci. Remote Sens. 2018, 57, 574–586. [Google Scholar] [CrossRef]
  21. Wang, J.; Zheng, Z.; Ma, A.; Lu, X.; Zhong, Y. LoveDA: A remote sensing land-cover dataset for domain adaptive semantic segmentation. arXiv 2021, arXiv:2110.08733. [Google Scholar]
  22. Azimi, S.M.; Henry, C.; Sommer, L.; Schumann, A.; Vig, E. Skyscapes fine-grained semantic understanding of aerial scenes. In Proceedings of the IEEE/CVF International Conference on Computer Vision, Seoul, Republic of Korea, 27 October–2 November 2019; pp. 7393–7403. [Google Scholar]
  23. Lee, M.; Hong, T. Hybrid agent-based modeling of rooftop solar photovoltaic adoption by integrating the geographic information system and data mining technique. Energy Convers. Manag. 2019, 183, 266–279. [Google Scholar] [CrossRef]
  24. Mainzer, K.; Fath, K.; McKenna, R.; Stengel, J.; Fichtner, W.; Schultmann, F. A high-resolution determination of the technical potential for residential-roof-mounted photovoltaic systems in Germany. Sol. Energy 2014, 105, 715–731. [Google Scholar] [CrossRef]
  25. Mainzer, K.; Killinger, S.; McKenna, R.; Fichtner, W. Assessment of rooftop photovoltaic potentials at the urban level using publicly available geodata and image recognition techniques. Sol. Energy 2017, 155, 561–573. [Google Scholar] [CrossRef]
  26. Ohleyer, S. Building Segmentation on Satellite Images. 2018. Available online: https://project.inria.fr/aerialimagelabeling/files/2018/01/fp_ohleyer_compressed.pdf (accessed on 25 March 2024).
  27. Sun, T.; Shan, M.; Rong, X.; Yang, X. Estimating the spatial distribution of solar photovoltaic power generation potential on different types of rural rooftops using a deep learning network applied to satellite images. Appl. Energy 2022, 315, 119025. [Google Scholar] [CrossRef]
  28. Zhou, X.; Xu, X.; Liang, W.; Zeng, Z.; Yan, Z. Deep-learning-enhanced multitarget detection for end–edge–cloud surveillance in smart IoT. IEEE Internet Things J. 2021, 8, 12588–12596. [Google Scholar] [CrossRef]
  29. Yuan, X.; Shi, J.; Gu, L. A review of deep learning methods for semantic segmentation of remote sensing imagery. Expert Syst. Appl. 2021, 169, 114417. [Google Scholar] [CrossRef]
  30. Long, J.; Shelhamer, E.; Darrell, T. Fully convolutional networks for semantic segmentation. In Proceedings of the IEEE Conference on Computer Vision and Pattern Recognition, Boston, MA, USA, 7–12 June 7 2015; pp. 3431–3440. [Google Scholar]
  31. Kampffmeyer, M.; Salberg, A.B.; Jenssen, R. Semantic segmentation of small objects and modeling of uncertainty in urban remote sensing images using deep convolutional neural networks. In Proceedings of the IEEE Conference on Computer Vision and Pattern Recognition Workshops, Las Vegas, NV, USA, 26 June–1 July 2016; pp. 1–9. [Google Scholar]
  32. Pan, X.; Gao, L.; Zhang, B.; Yang, F.; Liao, W. High-resolution aerial imagery semantic labeling with dense pyramid network. Sensors 2018, 18, 3774. [Google Scholar] [CrossRef]
  33. Badrinarayanan, V.; Kendall, A.; Cipolla, R. Segnet: A deep convolutional encoder-decoder architecture for image segmentation. IEEE Trans. Pattern Anal. Mach. Intell. 2017, 39, 2481–2495. [Google Scholar] [CrossRef]
  34. Audebert, N.; Le Saux, B.; Lefèvre, S. Beyond RGB: Very high resolution urban remote sensing with multimodal deep networks. ISPRS J. Photogramm. Remote Sens. 2018, 140, 20–32. [Google Scholar] [CrossRef]
  35. Chen, L.C.; Papandreou, G.; Kokkinos, I.; Murphy, K.; Yuille, A.L. Deeplab: Semantic image segmentation with deep convolutional nets, atrous convolution, and fully connected crfs. IEEE Trans. Pattern Anal. Mach. Intell. 2017, 40, 834–848. [Google Scholar] [CrossRef]
  36. Henry, C.; Azimi, S.M.; Merkle, N. Road segmentation in SAR satellite images with deep fully convolutional neural networks. IEEE Geosci. Remote Sens. Lett. 2018, 15, 1867–1871. [Google Scholar] [CrossRef]
  37. Ronneberger, O.; Fischer, P.; Brox, T. U-net: Convolutional networks for biomedical image segmentation. In Proceedings of the Medical Image Computing and Computer-Assisted Intervention–MICCAI 2015: 18th International Conference, Munich, Germany, 5–9 October 2015; Proceedings, Part III 18. Springer: Berlin/Heidelberg, Germany, 2015; pp. 234–241. [Google Scholar]
  38. Li, R.; Liu, W.; Yang, L.; Sun, S.; Hu, W.; Zhang, F.; Li, W. DeepUNet: A deep fully convolutional network for pixel-level sea-land segmentation. IEEE J. Sel. Top. Appl. Earth Obs. Remote Sens. 2018, 11, 3954–3962. [Google Scholar] [CrossRef]
  39. Yang, R.; Qi, Y.; Su, Y. U-Net neural networks and its application in high resolution satellite image classification. Remote Sens. Technol. Appl. 2020, 35, 767–774. [Google Scholar]
  40. Priyanka; Sravya, N.; Lal, S.; Nalini, J.; Reddy, C.S.; Dell’Acqua, F. DIResUNet: Architecture for multiclass semantic segmentation of high resolution remote sensing imagery data. Appl. Intell. 2022, 52, 15462–15482. [Google Scholar] [CrossRef]
  41. An attention-based U-Net for detecting deforestation within satellite sensor imagery. Int. J. Appl. Earth Obs. Geoinf. 2022, 107, 102685.
  42. Jia, J.; Song, J.; Kong, Q.; Yang, H.; Teng, Y.; Song, X. Multi-Attention-Based Semantic Segmentation Network for Land Cover Remote Sensing Images. Electronics 2023, 12, 1347. [Google Scholar] [CrossRef]
  43. Sravya, N.; Priyanka; Lal, S.; Nalini, J.; Reddy, C.S.; Dell’Acqua, F. DPPNet: An Efficient and Robust Deep Learning Network for Land Cover Segmentation From High-Resolution Satellite Images. IEEE Trans. Emerg. Top. Comput. Intell. 2023, 7, 128–139. [Google Scholar]
  44. Qin, X.; Zhang, Z.; Huang, C.; Dehghan, M.; Zaiane, O.R.; Jagersand, M. U2-Net: Going deeper with nested U-structure for salient object detection. Pattern Recognit. 2020, 106, 107404. [Google Scholar] [CrossRef]
  45. Hassanin, M.; Anwar, S.; Radwan, I.; Khan, F.S.; Mian, A. Visual attention methods in deep learning: An in-depth survey. arXiv 2022, arXiv:2204.07756. [Google Scholar] [CrossRef]
  46. Hu, J.; Shen, L.; Sun, G. Squeeze-and-excitation networks. In Proceedings of the IEEE Conference on Compute Vision and Pattern Recognition, Salt Lake City, UT, USA, 18–23 June 2018; pp. 7132–7141. [Google Scholar]
  47. Woo, S.; Park, J.; Lee, J.Y.; Kweon, I.S. Cbam: Convolutional block attention module. In Proceedings of the European Conference on Computer Vision (ECCV), Munich, Germany, 8–14 September 2018; pp. 3–19. [Google Scholar]
  48. Fu, J.; Liu, J.; Tian, H.; Li, Y.; Bao, Y.; Fang, Z.; Lu, H. Dual attention network for scene segmentation. In Proceedings of the IEEE/CVF Conference on Computer Vision and Pattern Recognition, Long Beach, CA, USA, 15–20 June 2019; pp. 3146–3154. [Google Scholar]
  49. Shen, D.; Ji, Y.; Li, P.; Wang, Y.; Lin, D. Ranet: Region attention network for semantic segmentation. Adv. Neural Inf. Process. Syst. 2020, 33, 13927–13938. [Google Scholar]
  50. Zhang, F.; Chen, Y.; Li, Z.; Hong, Z.; Liu, J.; Ma, F.; Han, J.; Ding, E. Acfnet: Attentional class feature network for semantic segmentation. In Proceedings of the IEEE/CVF International Conference on Computer Vision, Seoul, Republic of Korea, 27 October–2 November 2019; pp. 6798–6807. [Google Scholar]
  51. Huang, H.; Lin, L.; Tong, R.; Hu, H.; Wu, J. UNet 3+: A Full-Scale Connected UNet for Medical Image Segmentation. arXiv 2020, arXiv:2004.08790. [Google Scholar]
  52. de Boer, P.; Kroese, D.P.; Mannor, S.; Rubinstein, R.Y. A Tutorial on the Cross-Entropy Method. Ann. Oper. Res. 2005, 134, 19–67. [Google Scholar] [CrossRef]
  53. Paszke, A.; Gross, S.; Chintala, S.; Chanan, G.; Yang, E.; DeVito, Z.; Lin, Z.; Desmaison, A.; Antiga, L.; Lerer, A. Automatic differentiation in PyTorch. 2017. Available online: https://api.semanticscholar.org/CorpusID:40027675 (accessed on 25 March 2024).
  54. Riba, E.; Mishkin, D.; Ponsa, D.; Rublee, E.; Bradski, G. Kornia: An Open Source Differentiable Computer Vision Library for PyTorch. In Proceedings of the Winter Conference on Applications of Computer Vision, Snowmass Village, CO, USA, 1–5 March 2020. [Google Scholar]
  55. Chen, L.C.; Papandreou, G.; Schroff, F.; Adam, H. Rethinking atrous convolution for semantic image segmentation. arXiv 2017, arXiv:1706.05587. [Google Scholar]
  56. Xie, S.; Tu, Z. Holistically-Nested Edge Detection. In Proceedings of the IEEE International Conference on Computer Vision, Santiago, Chile, 7–13 December 2015. [Google Scholar]
  57. Liu, Y.; Cheng, M.M.; Hu, X.; Bian, J.W.; Zhang, L.; Bai, X.; Tang, J. Richer Convolutional Features for Edge Detection. IEEE Trans. Pattern Anal. Mach. Intell. 2019, 41, 1939–1946. [Google Scholar] [CrossRef] [PubMed]
  58. He, J.; Zhang, S.; Yang, M.; Shan, Y.; Huang, T. BDCN: Bi-Directional Cascade Network for Perceptual Edge Detection. IEEE Trans. Pattern Anal. Mach. Intell. 2022, 44, 100–113. [Google Scholar] [CrossRef] [PubMed]
  59. Nan, G.; Li, H.; Du, H.; Liu, Z.; Wang, M.; Xu, S. A Semantic Segmentation Method Based on AS-Unet++ for Power Remote Sensing of Images. Sensors 2024, 24, 269. [Google Scholar] [CrossRef]
  60. Xue, H.; Liu, K.; Wang, Y.; Chen, Y.; Huang, C.; Wang, P.; Li, L. MAD-UNet: A Multi-Region UAV Remote Sensing Network for Rural Building Extraction. Sensors 2024, 24, 2393. [Google Scholar] [CrossRef] [PubMed]
Figure 1. The difference in area between buildings and their roofs in satellite images. The green polygon represents the outline of the roof, and the green number indicates the area of the roof. The red polygon represents the building outline, and the red number indicates the area of the building.
Applsci 14 04371 g001
Figure 2. Illustration of RSU and the proposed ARSU: (a) RSU, (b) ARSU.
Applsci 14 04371 g002
Figure 3. Illustration of Squeeze-and-Excitation block.
Applsci 14 04371 g003
Figure 4. Illustration of the proposed AFSF network. Multiple connecting lines of the same color in the figure indicate that the same set of feature maps are simultaneously sent to multiple processing nodes in the network for feature fusion. For clarity, we mark the modules connected to the mask generator in purple.
Applsci 14 04371 g004
Figure 5. Some examples of the new roof segmentation dataset.
Applsci 14 04371 g005
Figure 6. Some examples of prediction masks generated by the proposed AFSF and compared methods.
Applsci 14 04371 g006
Table 1. The definitions of C o n v , B N , R e L U , D o w n s a m p l e , and U p s a m p l e .
NameDefinition
C o n v A convolutional layer with a kernel size of 3 × 3 and a stride size of 1
B N Batch-norm layer
R e L U R e L U activation function
D o w n s a m p l e Max pooling with a stride of 2 × 2
U p s a m p l e A layer that uses the bilinear interpolation algorithm to expand the length and
width of the input image twice, respectively
Table 2. The definition of TP, TN, FP, and FN.
MetricDefinition
TPThe number of positive pixels predicted as positive by the model
TNThe number of negative pixels predicted as negative by the model
FPThe number of negative pixels predicted as positive by the model
FNThe number of positive pixels predicted as negative by the model
Table 3. Ablation study results.
MethodPrecision (%)Recall (%)IoU (%)
U2Net76.380.778.4
U2Net+ARU79.084.381.6
U2Net+ARU+FSFA83.086.784.8
AFSF83.388.986.0
Table 4. Comparison of the proposed AFSF network and several methods on the new roof segmentation dataset.
MethodPrecision (%)Recall (%)IoU (%)
Deeplab V344.853.748.8
UNet72.982.277.2
U2Net76.380.778.4
HED [56]65.372.652.4
RCF [57]70.581.360.7
BASNet [58]80.285.470.6
MA [42]81.185.671.3
AS-UNet++ [59]81.586.372.4
MAD-UNet [60]81.085.370.8
AFSF83.388.975.5
Table 5. Comparison of the proposed AFSF network and several methods on the IAIL dataset.
MethodPrecision (%)Recall (%)IoU (%)
UNet83.181.169.7
U2Net84.881.571.1
BASNet [58]86.383.273.5
HED [56]82.580.268.5
RCF [57]84.380.970.3
MA [42]87.185.776.0
AS-UNet++ [59]87.386.176.5
MAD-UNet [60]86.685.275.3
AFSF88.086.877.6
Table 6. Comparison of the proposed AFSF network and several methods on the WHU dataset.
MethodPrecision (%)Recall (%)IoU (%)
UNet94.690.786.2
U2Net95.091.287.0
BASNet [58]95.992.989.3
HED [56]94.290.485.6
RCF [57]95.090.786.6
MA [42]96.093.289.7
AS-UNet++ [59]96.193.490.1
MAD-UNet [60]95.993.089.6
AFSF96.793.990.9
Disclaimer/Publisher’s Note: The statements, opinions and data contained in all publications are solely those of the individual author(s) and contributor(s) and not of MDPI and/or the editor(s). MDPI and/or the editor(s) disclaim responsibility for any injury to people or property resulting from any ideas, methods, instructions or products referred to in the content.

