Abstract
The transportation sector is regarded as the main culprit in greenhouse gas emission in the urban network, particularly idling vehicles waiting at signalized intersections. Although autonomous vehicles can be a promising technology to tackle vehicle idling, their environmental benefits receive little attention compared with their safety and mobility issues. This study investigated the environmental benefits of autonomous vehicles equipped with an automatic idling control function based on the queue discharge time and traffic signal information transmitted from the traffic signal controller via V2I communication using microscopic mobility and emission simulation models, VISSIM and MOVES, in Haeundae-gu in Busan, Korea. This study found that the function contributes to a significant reduction in CO2 emissions by 23.6% for all-inclusive emission and 94.3% for idling emission, respectively. Moreover, total reduced idling time accounts for 47.6% of the total travel time and 94.3% of the total idling time, respectively. Consequently, the autonomous vehicles equipped with automatic vehicle idling control function under C-ITS can play an important role in reducing greenhouse gas emissions and fuel consumption as well in the urban network.
1. Introduction
1.1. Background
Figure 1 describes that, since 2010, the transportation sector accounts for about 14.3% of total greenhouse gas emissions (GHGs) (Figure 1a) and that approximately 95.2% or more of the transportation-related GHGs (Figure 1b) is attributable to the vehicles on the road among all transport systems in Korea [1]. Particularly, it is reported that a huge part of them originates from idling vehicles waiting at signalized intersections in the urban network [2,3]. To tackle this problem, recently manufactured vehicles can automatically control vehicle idling with a stop-and-go function when waiting for a desired traffic signal. Besides this, autonomous vehicles can be another promising technology to control vehicle idling; however, most studies regarding autonomous vehicles have been mainly focused on the safety and mobility and not on the environmental impact.
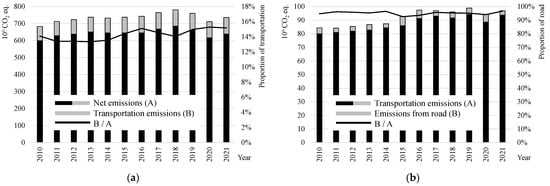
Figure 1.
Status of greenhouse gas emissions of the transportation sector and roads in Korea.
The safety and mobility performance of autonomous vehicles could be secured and reinforced with the aid of communication capability in the fashion of vehicle-to-vehicle (V2V) and vehicle-to-infrastructure (V2I) communications (i.e., cooperative intelligent transportation system, C-ITS), so it is necessary to investigate the environmental benefits of autonomous vehicles under C-ITS, particularly vehicle idling control at signalized intersections in urban areas.
1.2. Research Purpose
Recently, a new technology for transmitting traffic signal information from a traffic management center (TMC) or a traffic signal controller installed at the individual intersections of an approaching vehicle through wireless communication has been developed, and it is entering into practical uses.
The introduced mobility application using the traffic signal information transmitted to vehicles is simply intended to adjust their approaching speeds to minimize the chance for the vehicle to stop at the intersection, improve drivers’ comfort, and reduce fuel consumption and GHG emission. This study highlights that such valuable information should be used for more diverse applications such as automatic vehicle idling control.
This study aims to evaluate the environmental benefits of autonomous vehicles internally enhanced by an automatic vehicle idling control function, capable of reflecting the queue length and traffic signal information shared through C-ITS, specifically V2I, by employing a microscopic mobility and emission simulators, VISSIM and VISSIM COM (i.e., component object model) and MOVES (i.e., motor vehicle emission simulator), respectively.
The remainder of this study is organized as follows: Section 2 provides an informative summary of related works. Section 3 describes the research methodology with the underlying concept and algorithm for the automatic vehicle idling control of autonomous vehicles under C-ITS. Section 4 presents the research methodology, conducted with VISSIM and VISSIM COM coupled with MOVES, and evaluates the proposed vehicle idling control function with a case study in Haeundae-gu in Busan, Korea. Lastly, Section 5 contains conclusions, research limitations, and future research issues.
2. Related Works
2.1. Identification of Traffic Signal Information
Prior to propagating traffic signal information through C-ITS such as V2I communication, a number of studies on the identification of traffic signal, localization, and state classification (i.e., traffic signal color) have mainly counted on the vision-based methods up to recently, conceding its problems due to occlusions, illumination, scale variations, and so on [4,5]. Nevertheless, most studies on it have made greater efforts to improve their detection performance, aiming for utilization in autonomous vehicle applications.
Jimenez-Palacios (1999), Omar et al. (2020), and Li et al. (2021) proposed and evaluated a vision-based traffic lights recognition algorithm under a variety of lighting conditions using a public data set on the actual city road at night with YOLOv3, YOLOv4, and convolutional neural network (CNN) models, concluding that it has a relatively high accuracy rate in complex scenarios and can promote the engineering application of autonomous vehicles with some limitations, such as the distance from vehicles to the traffic signal [4,5,6]. Vitas et al. (2020) employed the improved YOLOv4 algorithm and investigated its effectiveness in enhancing the detection and recognition precision of traffic signals, resulting in a precision that was 2.86% higher than the mean average precision of the original YOLOv4 algorithm and introducing it as a practical method for autonomous vehicle applications [7]. Also, Escalera et al. (2003) implemented the adaptive thresholding and deep learning method to recognize the traffic signal based on images taken by a camera mounted on a vehicle, revealing an 89.60% true detection rate [8].
Despite these research efforts, there are still inherent limitations with the vision-based traffic signal recognition methods, which is that approaching vehicles must recognize the traffic signal and state without any latency due to traffic safety issues. Hence, a more robust and solid method (e.g., V2I communication) to recognize the traffic signal information compared with the vision-based one should be developed and implemented for the diverse autonomous vehicle applications.
2.2. Environmental Effect of Vehicle Idling
Pal et al. (2012), Bahndari et al. (2013), and Sharma et al. (2019) investigated the environmental impact of vehicular idling on emissions and found that significant emissions from idling vehicles account for the huge part of the total emissions from the transport sector, particularly at the signalized intersections during peak hour in urban areas [9,10,11]. Chaichan (2014) reported that CO2 concentrations increased with idle time and engine speed from a diesel engine, and Kumar et al. (2015) specifically noted that the total emissions amounted to 2398.055 mg/m3 of hydrocarbons, 1087.068 mg/m3 of NOx, and 10,612.612 mg/m3 of carbon monoxide daily during vehicle idling across 600 intersections in Delhi, India [12,13].
Engelmann et al. (2021) observed significant variations in emissions from passenger cars in special driving or non-driving situations like idling, which depended on vehicle types and the warm-up of their exhaust aftertreatment systems; Barlow et al. (2020) also showed that diesel heavy goods vehicles (HGVs) emitted the most pollutants per minute of idling, followed by SUVs, as obtained from the Department for Transport’s Portable Emissions Measuring System (PEMS) database in London [3,14].
Accordingly, Martin et al. (2017) highlighted that it is generally better to turn off and restart the vehicle, even for short stops for emission reduction, and Omar et al. (2020) found that vehicle positioning in a queue and congestion levels significantly impact the decision to turn off the engine in India [5,15]. Wu et al. (2015) indicated that the idling stop policy has significant potential savings in CO2 emissions from a case study in Taipei City [16].
2.3. Technology for Vehicle Idling Control
Kumar et al. (2013), Rahman et al. (2013), Shancita et al. (2014), and Yates et al. (2016) underscored the importance of adopting idle-reduction strategies to mitigate the adverse effects of vehicle idling on air quality at signalized intersections in urban areas and suggested multiple mitigation measures, such as auxiliary power units (APUs), direct-fired heaters, fuel cells, truck stop electrification, improving signal timing, promoting public transport, implementing land use and transport policies, encouraging non-motorized transport modes, and so forth [17,18,19,20]. This study mainly focused on stop-and-go technology and traffic signal operations aided with the sophisticated systems among the existing research efforts on alleviating the environmental effect of vehicle idling.
Stop-and-go technology allows vehicles to automatically turn off the internal combustion engine (ICE) during idling periods and restart it when the driver restarts, which is particularly beneficial in urban traffic conditions where vehicles frequently stop and start, leading to higher environmental pollution, thereby enabling significant improvements in reducing CO2 emissions [21,22,23,24].
Cho et al. (2012) employed an ultrasonic sensor to estimate frontal traffic conditions and developed a neural network-based fuzzy logic algorithm to control engine idling for the idle stop-and-go system [25]. Zhu et al. (2017) analyzed vehicle specific power (VSP) to understand the impact of stop-and-go driving behaviors at intersections on emissions by employing a high-resolution driving simulator to analyze acceleration and deceleration behaviors [26]. Zhu et al. (2022) investigated the effects of stop-and-go systems on particulate emissions in gasoline direct injection vehicles under varying temperature conditions with testing vehicles equipped with stop-and-go systems [27]. Aarathy et al. (2015), Lee et al. (2020), Chen et al. (2022), and Sim et al. (2022) introduced an enhanced control algorithm to stop-and-go technology by determining the optimal time to turn off the engine based on traffic light information disseminated through vehicle-to-infrastructure (V2I) communication, which is a significant step in integrating traffic signal information into idle stop-and-go systems [28,29,30,31].
Prati et al. (2018) showed that stop-and-go technology can reduce CO2 emissions by more than 4–7% in urban traffic from a field test using three cars equipped with portable emission systems (PEMSs) to measure emissions in Napoli [22]. Fonseca et al. (2011) found that a vehicle equipped with a stop-and-go system reduced more than 20% of CO2 emissions compared with one without the system in urban traffic conditions [32]. Also, Zhu et al. (2017) proved that the automatic stop-and-go function in hybrid electric vehicles (HEVs) can save over 16% of emissions [23].
Many researchers inspected the optimal time duration to control vehicle idling; that is, Chahal et al. (2018) revealed that idling for over 13 s leads to greater emissions than stopping and restarting the engine [33]. The U.S. Department of Energy (2015) highlighted that idling for more than 10 s produces more emissions than restarting the engine [34]. Sharma et al. (2017) indicated that it is more efficient to turn off the engine if idling is expected to last over 10 s [35]. Gaines et al. (2011) investigated the emissions associated with idling versus restarting the engine by comparing actual idling emissions, aiming to determine the impact of idling over various durations by the Argonne National Laboratory, finding that idling for more than 10 s emits more CO2 than restarting the engine [36]. Alwis et al. (2017) recommended switching off vehicle engines if the waiting time is more than 15–20 s [37].
Besides the stop-and-go technology, numerous studies on the optimal operation of traffic signal and vehicle speed adjustment have been conducted. In detail, Bakibillah et al. (2020) explored the development of an eco-driving strategy that learns from driving data to generate optimal speed trajectories at signalized intersections by advising appropriate driving behaviors near intersections with the gaussian process regression (GPR) [38]. Zhao et al. (2019) studied vehicle emissions at unsaturated signalized intersections using a car-following model combined with a specific power emission model, finding that longer signal cycles, higher vehicle arrival rates, and increased traffic interference amplify emissions per vehicle [39]. Chen et al. (2007) developed a microscopic traffic–emission simulation platform to investigate the relationship between traffic operations and emissions and found that vehicle emissions are strongly influenced by their operating modes, especially during acceleration, and that optimized signal timing plans can significantly reduce emissions for all vehicle categories [40]. Zhao et al. (2021) presented a study on the influence of signal timing on CO2 emissions in a mixed traffic environment of fuel and electric vehicles by developing a signal timing model aimed at minimizing CO2 emissions under different traffic conditions, resulting in the observation that optimizing signal timing from the perspective of CO2 emissions is effective in balancing emissions during acceleration, deceleration, and idling stages [41].
Li et al. (2018) proposed an optimal velocity control and separation strategy for connected and automated vehicles (CAVs) to minimize idling at red lights by accessing traffic light timing and adjusting their speed accordingly; the simulation results showed that implementing the strategy resulted in a 19.2% reduction in total travel time [42]. Jayawardana et al. (2022) proposed a reinforcement learning (RL) approach to develop eco-driving control strategies at signalized intersections to reduce CO2 emissions with connected autonomous vehicles (CAVs) investigated with the SUMO microscopic traffic simulator, resulting in significant reductions in CO2 emissions up to 25% [43]. Ubiergo (2014) explored the use of vehicle-to-infrastructure (V2I) communication to improve mobility and reduce environmental impacts by combining a car-following model and an emission model to simulate vehicle behavior and calculate emissions at signalized intersections, showing that around 8% of CO2 emissions can be saved [44].
Out of the analysis of related works on the effect of autonomous vehicles on the reduction of CO2 emission, little research has been conducted on the environmental benefits of automatic idling control function in autonomous vehicles with C-ITS in the urban network. Furthermore, unless the time it takes for an individual vehicle in the queue to start moving can be taken into account, the traffic signal information shared through V2I communication cannot be integrated into the proposed function in determining whether or not to control vehicle idling and in estimating the CO2 emission. Therefore, this study is distinguished from other studies in the respect that it considered the time to move in the queue based on the arrival time of shockwave from the stop line to vehicle position in the queue and compared it with the shared traffic signal information.
3. Research Methodology
While vehicles traverse the urban traffic network, which is composed of multiple signalized intersections, drivers could manage vehicle idling themselves by turning off the engine while waiting for the traffic signal associated with turning direction. However, drivers do not have any ways to know how long their waiting time is until they pass the intersection, so a sophisticated technology needs to be applied to autonomously control vehicle idling without depending on human instincts.
As seen in Section 2. Related Works, research efforts have not been made on the environmental benefits of autonomous vehicles under C-ITS, whose function is enhanced with automatic vehicle idling control at signalized intersection in the urban network, according to the best of our knowledge. Accordingly, this study creates a pivotal idling control method and evaluates its environmental benefits with microscopic simulation models, VISSIM, VISSIM COM, and MOVES.
This study suggests a novel methodology of estimating CO2 emissions from vehicles waiting in the queue at signalized intersections in Figure 2. Specifically, this study needs to observe the spatial and temporal trajectories of all vehicles around signalized intersections to find idling situations, interactively implement control of vehicle idling, and accordingly estimate the CO2 emission, so the microscopic simulation models (i.e., mobility and emission) supported by the user interface are an important research means.
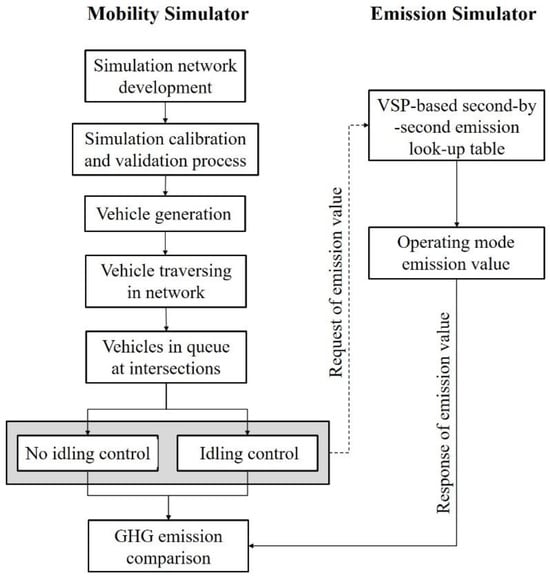
Figure 2.
Research framework with analytical modules.
The microscopic mobility simulator, VISSIM, is typically used to investigate the impact of traffic infrastructure or operation alternatives on traffic flow or safety because it is faster, safer, and more cost-effective than a field experiment and implementation [45,46,47]. It used to be complemented with a user interface (i.e., VISSIM COM), capable of not only reading the data of the internal objects such as vehicles, links, evaluations, etc., but also modifying their attributes and properties like vehicle routing, speed, signal timing, etc., at a discrete time step during the running of a simulation [48,49]. In addition, MOVES (motor vehicle emission simulator) is a representative microscopic emission simulator developed by the U.S. Environmental Protection Agency (U.S. EPA) and refers to the vehicle trajectories and vehicle specific power (VSP).
3.1. Mobility Simulator for Idling Control Process
The basic concept and algorithm of automatic vehicle idling control are provided in Figure 3. There are two fundamental requirements for the algorithm: that is, the autonomous vehicle should be physically equipped with a communication device and the reference time should be set to be compared with the waiting time to execute automatic vehicle idling control. The reference time is supposed to be defined according to the various vehicle characteristics such as vehicle type, vehicle year, fuel type, etc., but this study adopted a specific value (i.e., 10 s) referenced from the existing works.
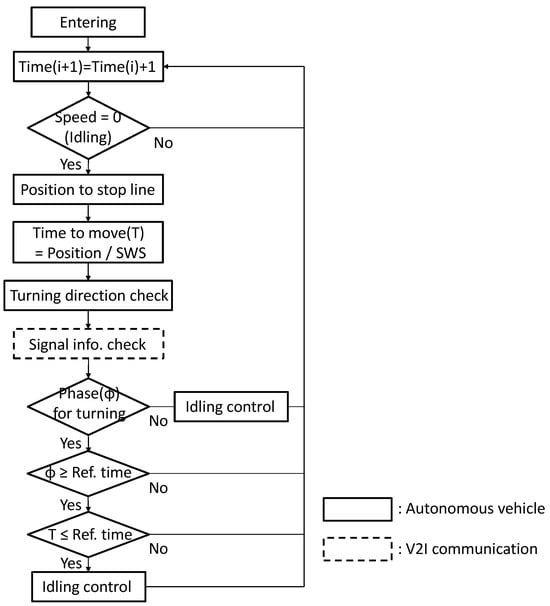
Figure 3.
Automatic vehicle idling control method.
Specifically, the mobility simulator consists of five steps from vehicle generation to vehicle idling identification and control. Most steps (i.e., solid box in Figure 3) can be realized by the autonomous vehicles themselves, such as speed, position, turning direction, vehicle idling control, etc., except one step (i.e., dashed box in Figure 3), which is sharing traffic signal information via V2I communication. Each step is explained as follows:
- Step 1: Vehicle generation
Vehicles are generated on the entering links at pre-determined headways depending on traffic demand.
- Step 2: Identification of vehicle idling situations
The speed of individual vehicles is monitored at every simulation time and when their speed is 0 kph, which is when they stop before a stop line or join a queue and the idling condition occurs. Then, this study computes the time that the shockwave reaches stopped vehicles from the stop line at the intersection of interest, referring to the time for vehicles to be able to start to move.
- Step 3: Transmission of signal information through V2I communication
Every time vehicle idling situation is identified, the traffic signal information such as cycle length, current and consecutive phases, phase sequence, etc., is checked to determine if the automatic vehicle idling control function should be activated or not.
- Step 4: Determination of vehicle idling control
At first, if the transmitted signal phase is not compatible with the turning direction of idling vehicles, the vehicle idling should be controlled. On the other hand, in case the signal phase matches the turning direction of idling vehicles and the phase is same as the reference time (i.e., Ref. time in Figure 3) or more, if the shockwave arrival time to the idling vehicles (i.e., time to start to move) is same as the reference time or less, the vehicle idling is controlled as well.
- Step 5: Estimating GHG emissions reciprocally linked to emission simulator
At every simulation time, all individual vehicles resort to the emission simulator to calculate the CO2 emissions corresponding to operation modes such as braking, idling, and running. Later, aggregated CO2 emissions associated with scenarios with or without an automatic vehicle idling control function are compared to see the environmental benefits of the proposed function.
There are two types of scenarios depending on the automatic vehicle idling control of an autonomous vehicle under C-ITS. One is no idling control (i.e., Figure 4a), and the other is vehicle idling control considering the queue length, time to start, reference time, and traffic signal information transmitted through V2I communication (i.e., Figure 4b).
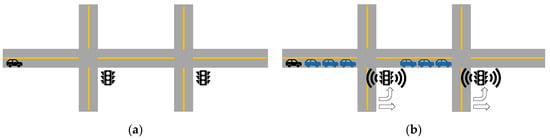
Figure 4.
Scenario illustration with or without vehicle idling control function. Note: the arrow means signal phase.
More specifically for Figure 4b, VISSIM observes all trajectories of individual vehicles at every simulation time and compares the waiting time and signal phase corresponding to the designated turning direction when stopping at the intersection until the simulation is terminated. When the waiting time is over the reference time defined in this study, the automatic idling control function is implemented, assuming that the reference time is 10 s. For example, if the waiting time informed by the traffic signal controller through V2I communication is 15 s, the vehicle automatically controls the idling by turning off the engine and restarts afterwards, consequently resulting in a reduction of CO2 emissions corresponding to 5 s.
3.2. Emission Simulator for GHG Emission Estimation
The U.S. EPA has developed and upgraded an emission simulator named the motor vehicle emission simulator (MOVES) for estimating the amount of CO, NOx, and CO2 emitted by vehicles at different levels from on-road and non-road sources. MOVES depends on the operation modes defined by vehicle speed and vehicle specific power (VSP) as explanatory variables that were noted as highly correlated with the emissions of interest [50]. The concept of VSP is the instantaneous power demand of the vehicle divided by its mass, which is used in the evaluation of vehicle emissions. As can be seen in Equation (1), it is the value obtained by dividing the sum of the loads resulting from aerodynamic drag, acceleration, rolling resistance, and hill-climbing by the mass of the vehicle [4,51].
where:
- Vehicle specific power ;
- Rolling resistance ;
- Rotating resistance ;
- Drag resistance ;
- Source mass ;
- Speed ;
- Acceleration ;
- Road grade;
- Acceleration of gravity ;
- Fixed mass factor [52,53].
Table 1 shows the weighted average of CO2 emissions of all vehicles for 23 operating modes in MOVES such as braking, idling, coasting, cruising, and accelerating by referring to the emission rate of CO2 associated with VSP, vehicle speed, vehicle type, and fuel type.

Table 1.
CO2 emission rates for multiple operating modes in MOVES.
4. Evaluation of Automatic Idling Control of CAVs
This study investigated the environmental benefits of the automatic vehicle idling control function in Haeundae-gu in Busan, Korea, within the established research framework. Because Haeundae-gu is a globally highly popular tourist town that has grown rapidly over the past few decades, it is an appropriate study site due to the sufficient traffic demand for this study.
4.1. Case Study with Haeundae-Gu in Busan, Korea
Figure 5 shows the study area, Haeundae-gu, in Busan, Korea. The basic input data required to build the VISSIM network such as the geometry, traffic flow (i.e., traffic volume and turning ratio), and traffic signal information (i.e., cycle length, phase, phase sequence, etc.) has been collected from an up-to-date aerial photo, traffic impact assessment reports, and the regional Road Traffic Authority with field survey complementation. After one hour of warm-up time, during which the network was populated with a sufficient number of vehicles, the vehicles entering the network for the next one hour were used for the analysis.
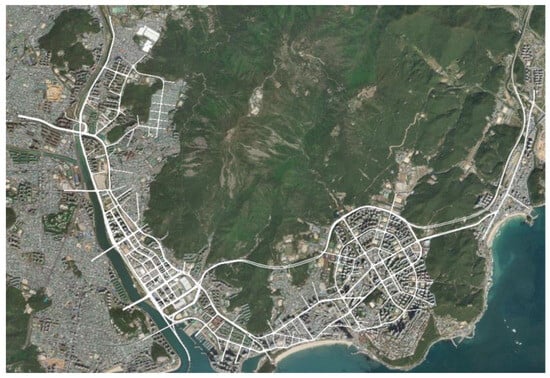
Figure 5.
VISSIM network (10 km × 10 km) of Haeundae-gu in Busan, Korea.
As for MOVES, the VSP operates in numerous operating modes at various speeds and accelerations collected from the microscopic simulation model, VISSIM. This study considers the passenger cars and gasoline as the vehicle type and fuel type in Table 1. Also, Table 2 indicates the default values corresponding to individual variables in Equation (1), excluding geographical factor (i.e., network slope) [53].
Table 2.
MOVES default database in Equation (1).
This study has calibrated the Haeundae-gu network with the three most significant queue length-related parameters, such as emergency stopping distance, lane change distance, and average standstill distance, out of 50 internal parameters based on the afternoon non-peak traffic demand using a Monte Carlo experiment. The simulation network was calibrated with three parameters adjusted to 7.2 m, 30.3 m, and 2.0 m, respectively. For validation purposes, the morning non-peak traffic demand has been input to the calibrated model, and it estimated the queue length within a reasonably acceptable range on the main artery. Therefore, the simulation outputs derived from this network are reliable enough to evaluate the environmental effect of the automatic vehicle idling control function [49].
4.2. Results and Analysis
This study evaluated the temporal and environmental benefits of autonomous vehicles under C-ITS when automatically controlling idling in the case that the informed waiting time is longer than the reference time in the Haeundae-gu network.
Table 3 shows that the total number of vehicles analyzed in this study is 15,888 vehicles, and 99.5% of them (i.e., 15,813 vehicles) were forced to experience idling at least once until leaving the network, resulting in 1602 idling hours out of total travel time, 3173 h, which is approximately 50.5%. The average travel time per vehicle is 719 s/veh, which is the sum of average moving time (354 s/veh) and average idling time (365 s/veh). The total saved idling time by applying the automatic vehicle idling control function proposed in this study is 1511 h, which accounts for 47.6% of the total travel time and 94.3% of the total idling time, respectively. The average saved idling time is 334 s/veh, which is the same percentage as the saved travel time.
Table 3.
Temporal and environmental effects of automatic vehicle idling control function.
Table 3 also reveals that the total CO2 emissions from all vehicles is 64,641,228 kg/h at an average of 4069 kg/h. The amount of CO2 emissions from idling vehicles takes up 25.0% of the total CO2 emissions, which is 1017 kg/h per vehicle on average. The saved CO2 emissions due to the proposed function in this study corresponds to 23.6% of the total CO2 emissions and 94.3% of the total idling CO2 emissions, respectively. Therefore, the proposed function enables idling time and CO2 emitted during idling to be significantly reduced by over 94% without relying on human judgement.
In addition to the total and average travel time and CO2 emissions in terms of vehicle unit, it is noteworthy to analyze them at the individual idling level. Table 4 shows that the total number of idling experienced by 15,813 vehicles is 113,986 times, which is 7.2 times per vehicle on average. Their average time and emission per idling are 50.6 s and 142 kg/h, respectively. Consequently, approximately 134 kg/h CO2 emissions out of 142 kg/h, accounting for 94.3% of the total, were saved by the automatic vehicle idling control function, which was executed based on the queue discharge time, reference time, and traffic signal information transmitted from the traffic signal controller through V2I communication.
Table 4.
Effects of the automatic vehicle idling control function at the individual idling level.
5. Conclusions, Discussion, and Future Research Issues
The transportation sector is regarded as a main culprit in greenhouse gas emission in the urban network, particularly idling vehicles waiting at signalized intersections. There have been many efforts to alleviate these adverse effects by utilizing more advanced information and communication technologies and enforcing emission regulations as well. Even though autonomous vehicles can be a promising technology to tackle vehicle idling, their environmental benefits obtain no attention compared with the safety and mobility issues.
This study underlined that the CO2 emitted by idling vehicles at signalized intersections accounts for a significant proportion of the citywide emissions, suggesting that controlling vehicle idling is an inevitable way to reduce CO2 emissions. This study introduces an automatic vehicle idling control function that enables vehicles to autonomously decide vehicle idling control in the queue at signalized intersections and investigate its environmental benefits.
This study attempts to introduce the basic algorithm of the automatic idling control function and investigate the environmental benefits of autonomous vehicles equipped with it based on the traffic signal information transmitted from the traffic signal controller under C-ITS by employing the microscopic mobility and emission simulator, VISSIM, VISSIM COM, and MOVES, in Haeundae-gu in Busan, Korea, as a case study. The most discernable point of this study from the existing works is to simultaneously take into account the queue length, reference time, and transmitted traffic signal information prior to determination of the vehicle idling control.
According to the simulation outputs, the total saved idling time thanks to the automatic idling control function accounts for 47.6% of the total travel time and 94.3% of the total idling time, respectively. Also, it could reduce 23.6% and 94.3% of CO2 emissions out of the total and idling amounts, respectively.
In conclusion, the autonomous vehicles equipped with an automatic vehicle idling control function under C-ITS can play an important role in reducing the CO2 emissions in the urban traffic network. Particularly, this study contributes to suggesting a novel methodology to compute the queue discharge time, utilized to determine whether to control vehicle idling or not, and utilizing on data about vehicle position in the queue, shockwave speed, reference time, and traffic signal information shared by V2I communication.
In addition, although electric vehicles and low-emission vehicles are rapidly being distributed, they have not yet had a meaningful impact on the overall reduction of CO2 emissions in urban areas to date. Therefore, the function proposed in this study can play a sufficient role in reducing CO2 emissions in the process of expanding the market penetration rate of these vehicles. Therefore, this study strongly supports a logical basis on the assertive deployment of the automatic vehicle idling control function in major cities, especially those suffering from CO2 emissions.
Even though there is a drawback to the stop-and-go function, which is a representative technology of vehicle idling control introduced in Section 2, that is, it cannot reflect the queue discharge time and reference time and unconditionally controls vehicle idling whenever the vehicle stops, it is expected to significantly reduce CO2 emissions. Intuitively, the automatic vehicle idling control function proposed in this study outperforms the stop-and-go function in reducing CO2 emission, but this study has a limitation in that it did not make a quantitative comparison between them.
Because the related technology and equipment to implement the proposed function are already off-the-shelf, it is expected to see it in reality in the near future. Prior to the actual implementation, the following issues should be addressed to improve the research performance in future research. The reference time to be compared with the queue discharge time and traffic signal information is assumed to be 10 s but should be more realistic, reflecting the vehicle type, vehicle year, fuel, etc. All vehicles are assumed to be powered by gasoline, but vehicle types should be diversified due to the fast propagation of more eco-friendly vehicles such as electric vehicles, hydrogen vehicles, etc., which means that the CO2 emission value should be more diverse to be referenced. Lastly, the shockwave speed used to estimate the queue discharge time should be investigated in the field.
Funding
This work was supported by the Dong-A University research fund.
Institutional Review Board Statement
Not applicable.
Informed Consent Statement
Not applicable.
Data Availability Statement
The original contributions presented in the study are included in the article, further inquiries can be directed to the corresponding author.
Conflicts of Interest
The author declares no conflicts of interest.
References
- Korea Transport Database. Available online: https://www.ktdb.go.kr/eng/index.do (accessed on 15 April 2024).
- Kathait, N.; Agarwal, A. Behaviour of drivers towards vehicle idling at signalized intersections. In Proceedings of the 13th International Conference on Transportation Planning and Implementation Methodologies for Developing Countries (TPMDC), Mumbai, India, 10–11 December 2020. [Google Scholar]
- Engelmann, D.; Hüssy, A.; Comte, P.; Czerwinski, J.; Bonsack, P. Emissions of passenger cars in special driving situations. In Proceedings of the TAP Conference, Graz, Austria, 30 March–1 April 2021. [Google Scholar]
- Jimenez-Palacios, J.L. Understanding and quantifying motor vehicle emissions with vehicle specific power and TILDAS remote sensing. Environ. Sci. Technol. 1999, 33, 118–127. [Google Scholar]
- Omar, W.; Lee, I.; Lee, G.; Park, K.M. Detection and localization of traffic lights using YOLOv3 and Stereo Vision. Int. Arch. Photogramm. Remote Sens. Spatial Inf. Sci. 2020, XLIII-B2-2020, 1247–1252. [Google Scholar]
- Li, Z.; Zeng, Q.; Liu, Y.; Liu, J.; Li, L. An improved traffic lights recognition algorithm for autonomous driving in complex scenarios. Int. J. Distrib. Sensor Netw. 2021, 17, 15501477211018374. [Google Scholar] [CrossRef]
- Vitas, D.; Tomic, M.; Burul, M. Traffic light detection in autonomous driving systems. IEEE Consum. Electron. Mag. 2020, 9, 90–96. [Google Scholar] [CrossRef]
- de la Escalera, A.; Armingol, J.M.; Mata, M. Traffic sign recognition and analysis for intelligent vehicles. Image Vis. Comput. 2003, 11, 247–258. [Google Scholar] [CrossRef]
- Pal, M.; Sarkar, D. Delay, fuel loss and noise pollution during idling of vehicles at signalized intersection in Agartala city, India. Civ. Environ. Res. 2012, 2, 8–14. [Google Scholar]
- Bhandari, K.; Parida, P.; Singh, P. Estimation of carbon footprint of fuel loss due to idling of vehicles at signalized intersection in Delhi. Procedia Soc. Behav. Sci. 2013, 104, 1168–1177. [Google Scholar] [CrossRef]
- Sharma, N.; Kumar, P.P.; Dhyani, R.; Ravisekhar, C.; Ravinder, K. Idling fuel consumption and emissions of air pollutants at selected signalized intersections in Delhi. J. Clean. Prod. 2019, 212, 8–21. [Google Scholar] [CrossRef]
- Chaichan, M.T. Experimental study of the effect of Exhaust Gas Recirculation (EGR) and injection timing on emitted emissions at idle period. Al-Khwarizmi Eng. J. 2014, 10, 33–44. [Google Scholar]
- Kumar, R.; Parida, P.; Shukla, S.; Saleh, W. MOVES model for idling emission of signalized junction in developing country. World J. Sci. Technol. Sustain. 2015, 12, 25–38. [Google Scholar]
- Barlow, T.; Cairns, O. Idling Action Research—Review of Emissions Data; TRL Limited: Berkshire, UK, 2020. [Google Scholar]
- Martin, R.S.; Woods, C.; Thomas, J. Assessment of Automobile Start and Idling Emissions under Utah Specific Conditions; Final Report; Utah State University and Weber State University: Ogden, UT, USA, 2017. [Google Scholar]
- Wu, J.S.; Hsieh, W.C. Estimating the effect of idling stops on energy saving and carbon reduction at signalized intersection. In Proceedings of the Scientific Cooperations Workshops on Engineering Branches, Istanbul, Turkey, 12–13 September 2015; pp. 143–157. [Google Scholar]
- Kumar, R.; Parida, P.; Tiwari, D.; Gangopadhyay, S. Idling emission at intersection and exploring suitable mitigation measures. Traffic Logist. Eng. 2013, 1, 184–190. [Google Scholar] [CrossRef]
- Rahman, S.M.A.; Masjuki, H.H.; Kalam, M.A.; Abedin, M.J.; Sanjid, A.; Sajjad, H. Impact of idling on fuel consumption and exhaust emissions and available Idle-Reduction technologies for diesel vehicles—A Review. Energy Convers. Manag. 2013, 74, 171–182. [Google Scholar] [CrossRef]
- Shancita, I.; Masjuki, H.H.; Kalam, M.A.; Fattah, I.M.R.; Rashed, M.M.; Rashedul, H.K. A review on idling reduction strategies to improve fuel economy and reduce exhaust emissions of transport vehicles. Energy Conv. Manag. 2014, 88, 794–807. [Google Scholar] [CrossRef]
- Yates, D.; Minaie, A. Reducing Vehicle Idle Time Emissions at Intersections. Computer Engineering Program; Utah Valley University: Orem, Utah, 2016. [Google Scholar]
- Hu, Z.; Wang, Z.; Lu, Z.; Fu, J. Effect of idle-start-go on the economy and emissions of gasoline vehicles. J. Automob. Eng. 2022, 238, 159–171. [Google Scholar] [CrossRef]
- Prati, M.V.; Costagliola, M.A.; Pagliara, F.; Mastantuono, E. Idling vehicle emissions and fuel consumption in urban use: Influence of the Stop&Start technology. In Proceedings of the International Conference on Environment and Electrical Engineering and IEEE Industrial and Commercial Power Systems Europe (EEEIC/I&CPS Europe), Palermo, Italy, 12–15 June 2018; pp. 112–117. [Google Scholar]
- Zhu, T.; Wu, Y.; Li, B.; Zong, C.; Li, J. Simulation research on the Start-Stop system of hybrid electric vehicle. J. Adv. Veh. Eng. 2017, 3, 55–64. [Google Scholar]
- Wang, H. Vehicle idling stop and start testing system. In Proceedings of the 2nd International Conference on Machinery, Electronics and Control Simulation (MECS), Taiyuan, China, 24–25 June 2017; p. 138. [Google Scholar]
- Cho, K.; Choi, S.B.; Choi, S.; Son, M. Adaptive neural network based fuzzy control for a smart idle stop and go vehicle control system. Int. J. Automot. Technol. 2012, 13, 791–799. [Google Scholar] [CrossRef]
- Zhu, S.; Kim, I.; Zhao, Q.; Song, G.; Yu, L.; Chen, Z. Analysis of vehicle stop-and-go driving behaviors at signalized intersections. In Proceedings of the COTA International Conference of Transportation Professionals (CICTP), Beijing, China, 7–9 July 2017. [Google Scholar]
- Zhu, R.; Fu, Y.; Wang, L.; Hu, J.; He, L.; Wang, M.; Lai, Y.; Su, S. Effects of a start-stop system for gasoline direct injection vehicles on fuel consumption and particulate emissions in hot and cold environments. Environ. Pollut. 2022, 308, 119689. [Google Scholar] [CrossRef] [PubMed]
- Aarathy, M.S.; Abinaya, S. Efficacious Idle-Stop system in automobiles using intelligent traffic control algorithm. In Proceedings of the IEEE International Conference on Intelligent Transportation Systems, Madurai, India, 15–18 September 2015; pp. 465–539. [Google Scholar]
- Lee, J.H.; Sun, Y.; Humphrey, J.; Ha, J.; Lee, B. Development of advanced idle Stop-and-Go control utilizing V2I. SAE 2020, 14, 0581. [Google Scholar]
- Chen, H.; Rakha, H.; Jeihani, M.; Ahangari, S. Integrated Optimization of Vehicle Trajectories and Traffic Signal Timings: System Development and Testing; Final Report; Virginia Tech Transportation Institute: Blacksburg, VA, USA, 2022. [Google Scholar]
- Sim, K.; Hwang, S.H. A control algorithm of an idle stop and go system with traffic conditions for hybrid electric vehicles. IEEE Trans. Intell. Trans. Syst. 2022, 23, 14427–14438. [Google Scholar] [CrossRef]
- Fonseca, N.; Casanova, J.; Valdés, M. Influence of the Stop/Start system on CO2 emissions of a diesel vehicle in urban traffic. Transp. Res. D 2011, 16, 194–200. [Google Scholar] [CrossRef]
- Chahal, G.; Anuradha, P. Experimental study of fuel consumption and emission characteristics of the Medium-Duty vehicle. Int. J. Adv. Res. Ideas Innov. Technol. 2018, 4, 1748–1755. [Google Scholar]
- U.S. Department of Energy. Idling reduction for personal vehicles. In DOE/CHO-AC-06CH11357-1502; Vehicle Technologies Office: Chandler, AZ, USA, 2015. [Google Scholar]
- Sharma, A.; Singh, M.; Sharma, S. Influence of fuel consumption and instantaneous exhaust pollutants on euro 4 gasoline vehicles at traffic signalized intersections: Idling and Start/Restart manoeuvre. Int. J. Veh. Struct. Syst. 2017, 8, 313–316. [Google Scholar]
- Gaines, L.; Rask, E.; Keller, G. Which Is Greener: Idle, or Stop and Restart? Comparing Fuel Use and Emissions for Short Passenger—Car Stops; Argonne National Laboratory, 2011; Supported by the U.S. Department of Energy, Office of Vehicle Technologies, Clean Cities Program: Lemont, IL, USA, 2011. [Google Scholar]
- Alwis, L.N.V.; Amarasingha, N. Estimating the fuel loss during idling of vehicles at signalized intersections in Colombo. In Proceedings of the NCTM 2017, Colombo, Sri Lanka, 27 January 2017. [Google Scholar]
- Bakibillah, A.S.M.; Kamal, M.A.S.; Tan, C.P. Sustainable Eco-Driving strategy at signalized intersections from driving data. In Proceedings of the 59th Annual Conference of the Society of Instrument and Control Engineers of Japan (SICE), Chiang Mai, Thailand, 23–26 September 2020. [Google Scholar]
- Zhao, H.; He, R.; Jia, X. Estimation and analysis of vehicle exhaust emissions at signalized intersections using a car-following model. Sustainability 2019, 11, 3992. [Google Scholar] [CrossRef]
- Chen, K.; Yu, L. Microscopic Traffic-Emission simulation and case study for evaluation of traffic control strategies. J. Transp. Syst. Eng. Inf. Technol. 2007, 7, 93–100. [Google Scholar] [CrossRef]
- Zhao, H.X.; He, R.C.; Yin, N. Modeling of vehicle CO2 emissions and signal timing analysis at a signalized intersection considering fuel vehicles and electric vehicles. Eur. Transp. Res. Rev. 2021, 13, 5. [Google Scholar] [CrossRef]
- Li, L.H.; Gan, J.; Li, W.Q. A separation strategy for connected and automated vehicles: Utilizing traffic light information for reducing idling at red lights and improving fuel economy. Adv. Transp. 2018, 2018, 5679064. [Google Scholar] [CrossRef]
- Jayawardana, V.; Wu, C. Learning Eco-Driving strategies at signalized intersections. In Proceedings of the 2022 European Control Conference (ECC), London, UK, 12–15 August 2022. [Google Scholar]
- Ubiergo, G.A. Mobility and Environment Improvement of Signalized Networks through Vehicle-to-Infrastructure (V2I) Communications. Master’s Thesis, Universitat Politècnica de Catalunya, Barcelona, Spain, 2014. [Google Scholar]
- Shaaban, K.S.; Radwan, E. A calibration and validation procedure for microscopic simulation model: A case study of simtraffic for arterial streets. In Proceedings of the Presented at the Transportation Research Board (TRB) Annual Meeting, Washington, DC, USA, 9–13 January 2005. [Google Scholar]
- Park, B.; Schneeberger, J.D. Microscopic Simulation Model Calibration and Validation Handbook; Office of Research and Development: Washington, DC, USA, 2003; pp. 1–123. [Google Scholar]
- Park, B.; Schneeberger, J.D. Microscopic simulation model calibration and validation: A case study of VISSIM for a coordinated actuated signal system. Trans. Res. Rec. 2003, 1856, 185–192. [Google Scholar] [CrossRef]
- Siddharth, S.M.P.; Ramadurai, G. Calibration of VISSIM for Indian heterogeneous traffic conditions. Procedia—Soc. Behav. Sci. 2013, 104, 380–389. [Google Scholar] [CrossRef]
- Kim, M.; Kim, H.K. Investigation of environmental benefits of traffic signal countdown timers. Transp. Res. Part D 2020, 85, 102464. [Google Scholar] [CrossRef]
- Zhai, H.; Frey, H.C.; Rouphail, N.M. A Vehicle-Specific power approach to Speed- and Facility-Specific emissions estimates for diesel transit buses. Environ. Sci. Technol. 2008, 42, 7985–7991. [Google Scholar] [CrossRef]
- Jiménez, J.L.; McClintock, P.; McRae, G.J.; Nelson, D.D.; Zahniser, M.S. Vehicle specific power: A useful parameter for remote sensing and emissions studies. Environ. Sci. Technol. 1999, 33, 2091–2096. [Google Scholar]
- U.S. Environmental Protection Agency. Technical Guidance on the Use of MOVES2010 for Emission Inventory Preparation in State Implementation Plans and Transportation Conformity; EPA-420-B-10-041; U.S. Environmental Protection Agency: Washington, DC, USA, 2010. [Google Scholar]
- U.S. Department of Transportation Federal Highway Administration. Available online: https://www.fhwa.dot.gov/environment/air_quality/conformity/research/project_level_analyses/pla02.cfm (accessed on 15 April 2024).
Disclaimer/Publisher’s Note: The statements, opinions and data contained in all publications are solely those of the individual author(s) and contributor(s) and not of MDPI and/or the editor(s). MDPI and/or the editor(s) disclaim responsibility for any injury to people or property resulting from any ideas, methods, instructions or products referred to in the content. |
© 2024 by the author. Licensee MDPI, Basel, Switzerland. This article is an open access article distributed under the terms and conditions of the Creative Commons Attribution (CC BY) license (https://creativecommons.org/licenses/by/4.0/).