Article

Characterization of Surface α-Particle Radiation, Internal Traceability and Simulation of Typical Tin Spheres

1
Institutes of Physical Science and Information Technology, Anhui University, Hefei 230601, China
2
Science and Technology on Reliability Physics and Application of Electronic Component Laboratory, China Electronic Product Reliability and Environmental Testing Research Institute, Guangzhou 511370, China
*
Authors to whom correspondence should be addressed.
Appl. Sci. 2024, 14(10), 4257; https://doi.org/10.3390/app14104257
Submission received: 8 February 2024 / Revised: 25 March 2024 / Accepted: 30 March 2024 / Published: 17 May 2024
(This article belongs to the Section Applied Physics General)

Abstract

:
Surface α-particle emissivity testing and spectral characterization of two leaded tin spheres (Sn10%Pb90%, Sn63%Pb37%) and one lead-free tin sphere (Sn96.5%Ag3.0%Cu0.5%, SAC305) were carried out. The results show that Sn10%Pb90% Sn spheres have the highest α-particle emissivity; Sn63%Pb37% Sn spheres are the next highest, which is an order of magnitude lower than the α-particle emissivity of Sn10%Pb90% Sn spheres; and SAC305 Sn spheres have the lowest emissivity, which is reduced by about 55.6% compared to the emissivity of Sn63%Pb37% Sn spheres. All three types of tin spheres, after purification treatment, achieved the grade of ultra-low alpha particle emissivity (<0.002 α/(cm2·h)). The internal radionuclide traceability of the tin sphere, combined with the energy spectrum, reveals that the emission spectrum of the tin sphere exhibits an obvious “single peak” characteristic, with the peak energy in the interval of 5 MeV~5.5 MeV. Comparative analyses revealed that 210Po is the main nuclide that produces alpha particles, and 210Po originates from the decay of 210Pb. Further Monte Carlo simulations show that α-particles with energies greater than 4.1 MeV in the measured energy spectrum all come from the contribution of radionuclides within 5 μm of the surface layer of the tin sphere, which accounts for 60% of the total radioactivity. Combining the experimental and simulation results, it is found that the internal radionuclides of the tin sphere are characterized by more surface layer and less internal layer. The above results are of great significance for the establishment of α-particle mitigation methods for tin spheres.

1. Introduction

Electronic materials naturally contain uranium (U), thorium (Th), and other radioactive elements, whose decay will release the very ionizing ability of alpha particles. When the alpha particles propagate inside the chip, it will generate a large number of electron-hole pairs along the direction of propagation, these electron-hole pairs are collected by an electric field to generate a current pulse, and when the charge collection exceeds the critical charge corresponding to the node of the chip, then a soft error will occur [1]. Distinguishing from hard errors [2], soft errors do not cause catastrophic damage to the device but can lead to varying degrees of data loss. Achieving high integration, high speed, and low power consumption is crucial in integrated circuit manufacturing processes [3]. Along with the development of its manufacturing process, the soft errors caused by alpha particles and other factors, such as increased integration, reduced operating voltage, and reduced node capacitance, pose a great threat to the reliability of integrated circuits, and in the chip industry, the problem of its reliability may directly affect the core competitiveness of the product [4,5,6]. In the atmospheric environment, soft errors mainly originate from α-particles, energetic neutrons, and thermal neutrons [7,8,9]. Among them, the proportion of the soft error rate (SER) caused by α-particles is closely related to the device process, package material grade, and usage environment [10] and is an important part of the overall SER. In order to reduce the soft error rate, common measures include improving the purity of packaging materials, adding a protective layer on the chip surface, changing the structural design, and changing the circuit design [11].
Alpha particles within chips in terrestrial environments mainly originate from radionuclides in raw materials, such as solder joints composed of lead-based solder, bonding wires, and aluminum in ceramic packages, with alpha particles generated by the solder being the main factor [12,13]. As an important and indispensable material in the new type of packaging, solder balls are used to replace the pins in the integrated circuit (IC) package structure to meet the requirements of electrical interconnections and mechanical connections.
As the process size of ICs enters the nanoscale, related research in China and abroad focuses on the measurement of a-particle SERs of ICs, the contribution ratio to neutron SERs [14,15,16], as well as the morphology and properties of tin spheres. For example, in China, and Luo et al. introduced the technique of ultra-low background α-particle testing and radiometric characterization of the solder [17]. Overseas, Jiao et al. studied the effects of thermal cycling and current on the reliability of different solder ball weld joints [18], Chia et al. did a study on the mechanics of the solder ball shear test and the effect of shear rate [19], and so on. The characterization and simulation of α-particle radioactivity in tin spheres is lacking. The α-particles emitted from tin spheres located at the bottom of the chip can directly enter into the chip, thus endangering the reliability of the chip. Therefore, it is of great significance to test the α-particle emissivity and emission spectra of tin spheres, to confirm their internal emitting nuclides through the spectra, and to reveal the intrinsic mechanism through simulation.

2. Alpha Decay Properties of Common Nuclides

Firstly, the decay properties of trace radionuclides that may exist inside the electronic material are summarized and analyzed, laying the foundation for the next step of identifying the intrinsic nuclides through the α-particle spectroscopic features on the surface of the material.
As can be seen from Table 1, the half-lives of different nuclides are very different, and the half-life of some nuclides can be as long as hundreds of millions of years, while the half-life of other nuclides may be only a few seconds or even a few microseconds. The energy of α-particles produced by the decay of different nuclides is different, mostly concentrated in the interval of 4 MeV–8 MeV. It can be seen that the measurement of α-particle energy spectra of samples can achieve the identification of their internal radionuclides.

3. Measurement Tests
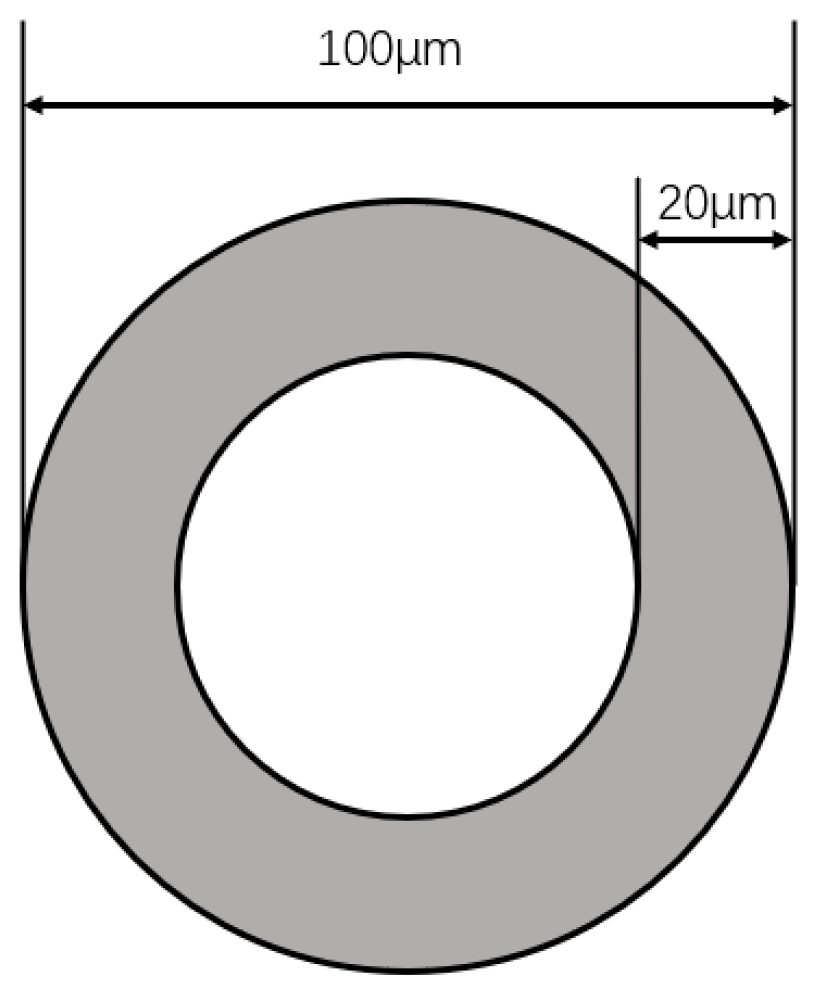
3.1. Sample

The representative Sn63%Pb37% tin sphere, Sn10%Pb90% tin sphere, and SAC305 tin sphere selected for this test were produced by Qunwei Electronic Materials Co., Ltd., Chongqing, China. The test environment was filled with argon gas, and the parameters of the test samples are shown in Table 2. The first three groups are ordinary samples and the last three groups are ultra-low α-particle emissivity samples prepared by a special production process.

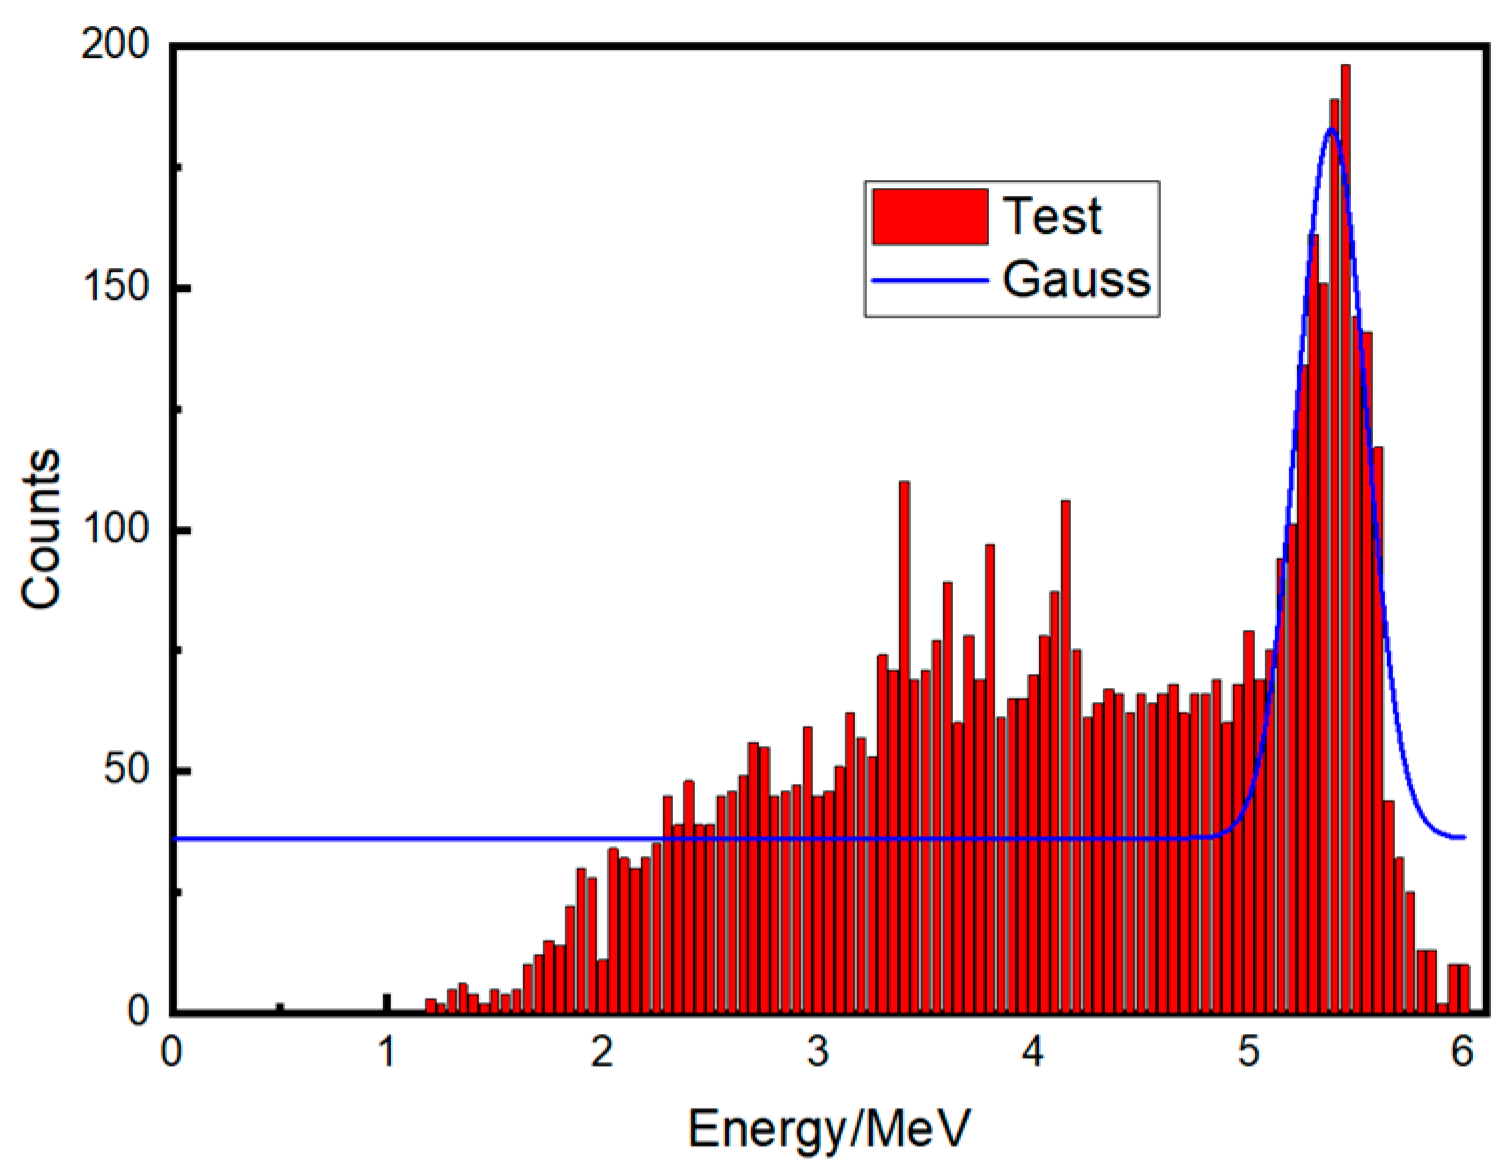
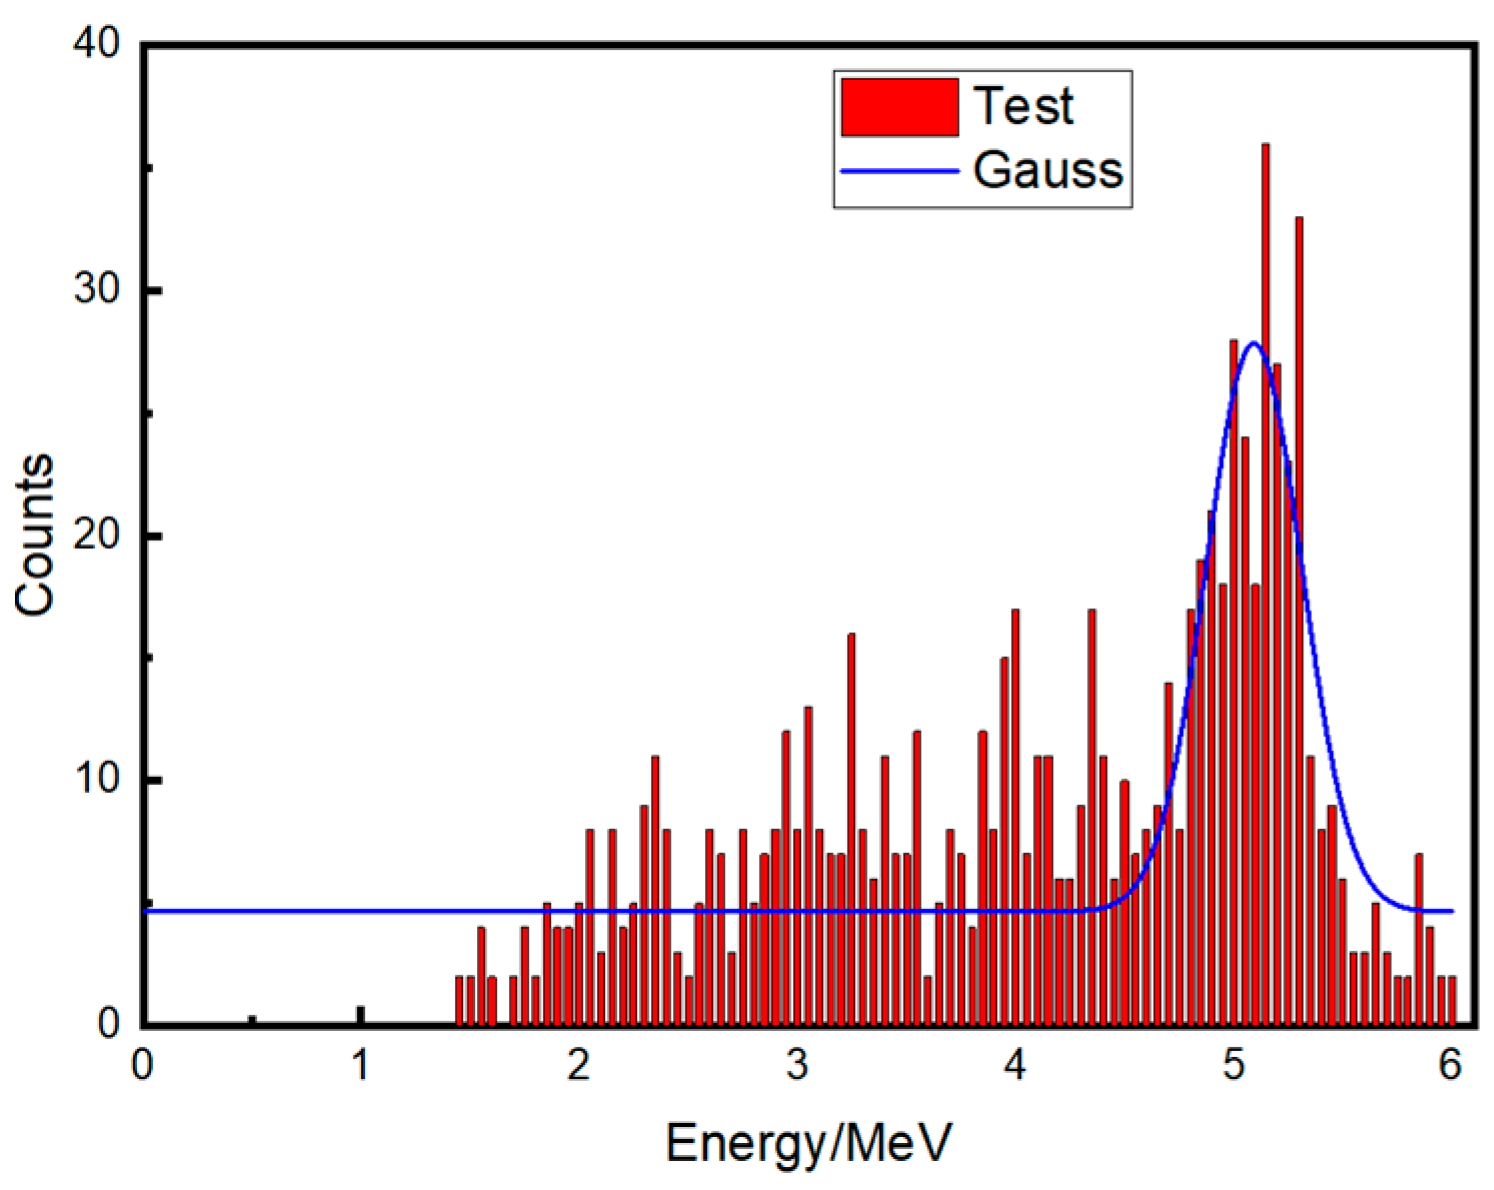
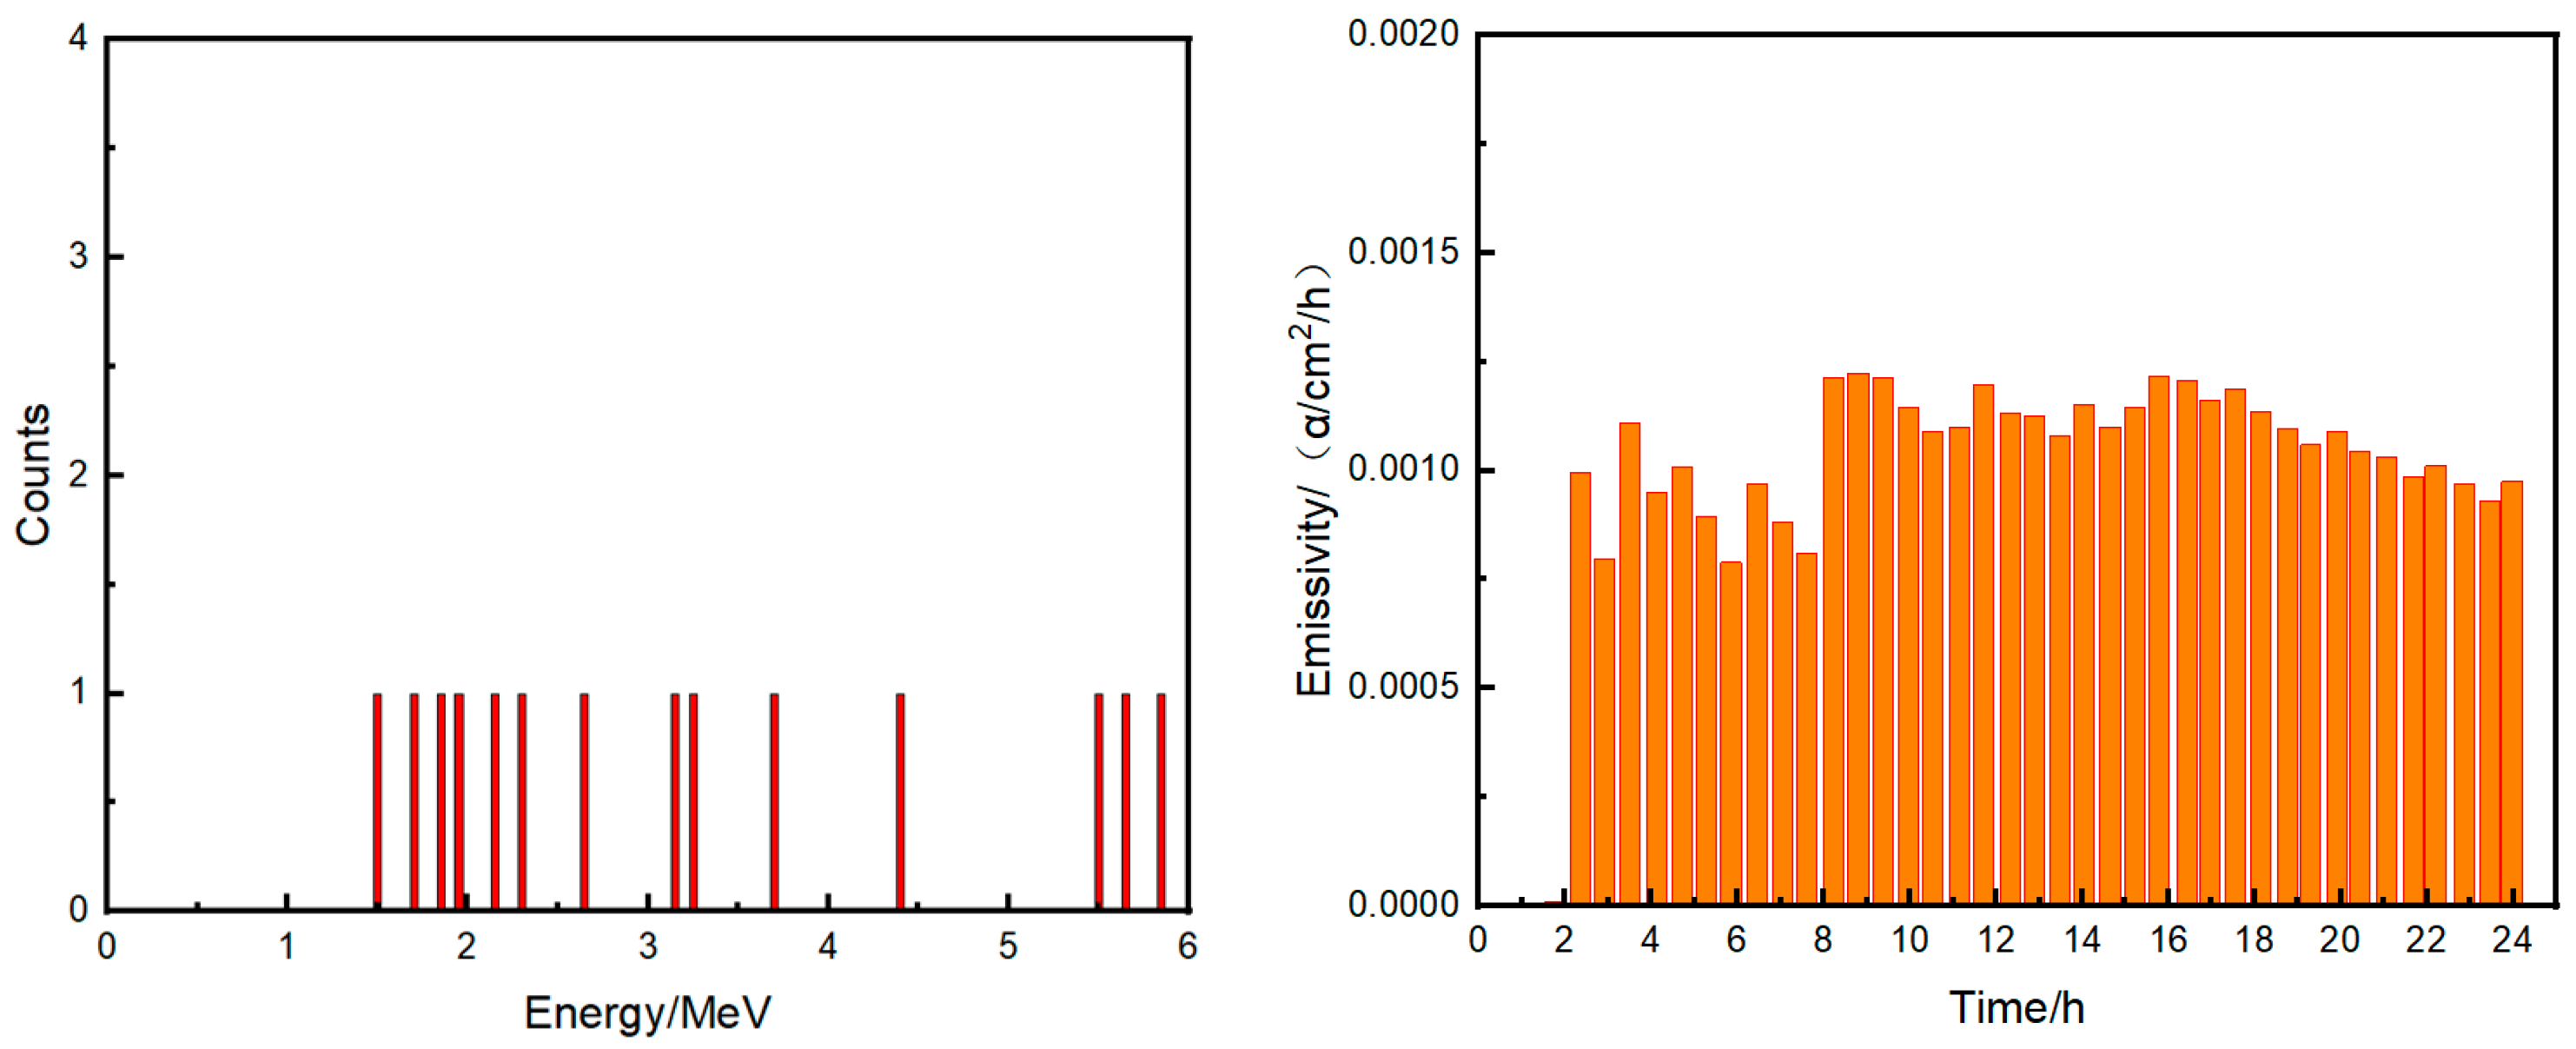
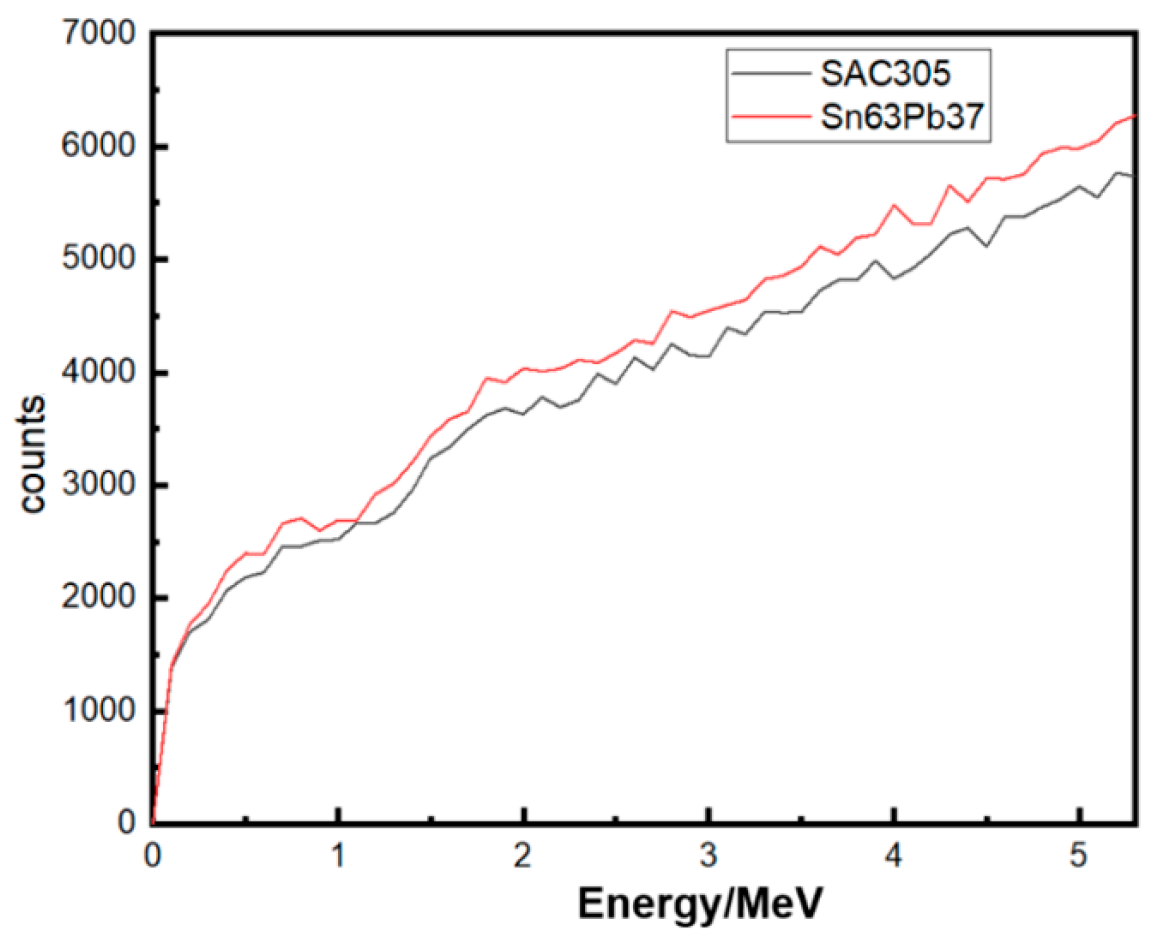
3.2. Test Results and Analysis

The tests in this article used a gas ionization counter. The model number of the test instrument is UltraLo-1800 Alpha Particle, manufactured by XIA. The background can be as low as 0.0005 α/(cm2·h) [21]. The instrument consists of an ionization chamber, an electrical signal amplifier, and a receiver. The instrument determines the location of signal generation by intentionally increasing the geometry of the emission signals of alpha particles emitted from different surfaces, and then the reduction of background effects is achieved by actively shielding the signal from the surface of the ionized room. This ensures the reliability of the test results.
The flow of the test is as follows:
(1) Before the test, the instrument and the non-radioactive tray for the test is cleaned and background tested to ensure that the emissivity of the instrument is lower than 0.002 α/(cm2·h) and the measured background emissivity is ε0.
(2) The tin sphere is placed on the test tray in the test area (A1) after the test into the ionization chamber, the closure of the ionization chamber for vacuum and argon filling, the test mode selection “wafer” (test area of A0 = 707 cm2), the test obtained the emissivity of ε1.
(3) Background clipping: The actual test area of the sample is generally different from the instrumental test area, and the instrument displays the average surface emissivity of the α-particles under the actual test area rather than the average surface emissivity of the sample’s own area, so it is necessary to process the test results, i.e., bottom clipping, at the end of the test. The formula for background clipping is:
ε = ε 0 A 0 ε 1 1 A A 0 A
The surface α-particle emissivity of the Sn63%Pb37% tin sphere, Sn10%Pb90% tin sphere, and SAC305 tin sphere are given in Table 3. From the table, it can be seen that: (1) the surface α-particle emissivity of the Sn63%Pb37% tin sphere is about one order of magnitude lower than that of the Sn10%Pb90% tin sphere, and the α-particle emissivity of the SAC305 tin sphere is the lowest of the three, which is reduced by about 55.6% compared to the emissivity of the Sn63%Pb37% tin sphere. (2) The surface α-particle emissivity of the low α tin sphere is reduced by thousands or even tens of thousands of times. According to the α-particle emissivity grade classification method in Table 4, some samples have reached the level of ultra-low emissivity grade.
Figure 1 and Figure 2 show the α-particle energy spectra emitted by the Sn10%Pb90% tin sphere and Sn63%Pb37% tin sphere obtained from the tests and the Gaussian function to fit the curve. As seen from the figure, the α-particle spectra of the two kinds of tin spheres show similar characteristics:
(1) The test results show that the peak of the spectra is located between 5.3 MeV and 5.5 MeV and the peak of the curve fitted by Gaussian function is 5.38 MeV.
(2) There is a relatively single peak. Figure 3 gives the α-particle emission spectra of the thick-film material containing 232Th, which can be seen to exist in a number of peaks, which is obviously different from Figure 1 and Figure 2. The analysis suggests that, due to the fact that 232Th is located in the upstream of the decay chain, its emission spectrum carries multiple-seeded nuclei and its emission spectra are different from that of Figure 1 and Figure 2. It is surmised that, since 232Th is located in the upstream of the decay chain, its emission spectrum carries the α-particle energy peaks generated by the decay of multiple sub-nuclides, while the radionuclides inside the tin sphere may be located at the end of the decay chain.
(3) The reason for this is that the alpha particles emitted from the inside of the tin sphere lose their energy by means of electron and nuclear energy loss during the process of ejection from the sphere, which leads to their ejection energy being lower than that of the original energy (5.3 MeV), and thus an extended region is formed.
The sources of radioactivity inside the Sn10%Pb90% tin sphere and Sn63%Pb37% tin sphere were analyzed based on the energy spectra in Figure 1 and Figure 2. The nuclides whose decay-produced α-particle energies are in the interval of 5.3 MeV to 5.5 MeV, are 210Po (5.304 MeV), 228Th (5.423 MeV (probability of 73.4%), 5.34 MeV (probability of 26%)), and 222Rn (5.489 MeV) [10]. 222Rn’s decay product is 218Po, which has a half-life of 3.8 days, and the energy of the α-particle produced by the decay is 5.489 MeV; its daughter nuclide 218Po has a half-life of 3.1 s, and the energy of the α-particle produced by the decay is 6.002 MeV, so there should be at least two peaks in the energy spectrum of 222Rn. 228Th is located in the upstream of the decay chain, and the half-lives of its decay products 224Ra and 220Rn are 3.7 days and 55.6 s, respectively. The energy of the α-particles produced by the decay of 224Ra and 220Rn is 5.685 MeV and 6.288 MeV, respectively, so the energy spectrum of 228Th should have at least four or more peaks.
210Po undergoes α-decay and produces α-particles with an energy of 5.304 MeV, and 210Po is the most terminal decayable nuclide, and its decay product is the stable 206Pb, which leads to only a single peak in Figure 1 and Figure 2. Therefore, the radionuclide within the Sn10%Pb90% tin sphere and Sn63%Pb37% tin sphere is 210Po.
As can be seen from the half-lives of the individual nuclides in Table 1, the half-lives of 210Po and 210Bi are 138 days and 5 days, respectively, which are very short and will not exist stably in the tin sphere for a long time. While the half-life of 210Pb is 22.2 years, which is longer and can exist in the sample relatively stably. Therefore, it can be concluded that 210Pb undergoes successive β-decays to form 210Bi and 210Po in turn, while 210Po is the source of α-particles obtained from the test. From the α-particle emissivity in Table 3, it can be seen that as the content of the Pb element in the tin sphere decreases, its α-particle emissivity undergoes a more obvious decrease, which is also supported by the positive correlation between the α-particle emissivity and the content of lead.
Figure 4 shows the energy spectrum of the α-particles emitted and the Gaussian function to fit the curve by the SAC305 tin sphere with an emissivity of 3.76 ± 0.2 α/(cm2·h). Due to the relatively low emissivity, the test time was adjusted to 200 h, and the obtained energy spectrum is shown in Figure 4. As can be seen from the figure, the α-particle counts increased significantly in the energy range from 5 MeV to 5.3 MeV, and the peak position of the Gaussian function fitted curve is at 5.1 MeV. The internal radionuclide types were analyzed, and the radionuclides whose decay-produced α-particle energies were in the range of 5 MeV~5.3 MeV were 210Po (5.304 MeV) and 228Th (5.423 MeV (73.4% probability), 5.340 MeV (26% probability)). For 228Th, previously analyzed as having at least four peaks in its emission energy spectrum with some of the peaks corresponding to energies greater than 6 MeV, there is obviously no such feature shown in Figure 4, so 228Th is not an internal radionuclide. Therefore, the internal radionuclide of the SAC305 tin sphere is the same as that of Sn10%Pb90% tin sphere and Sn63%Pb37% tin sphere, all of which are 210Po. The presence of traces of 210Pb nuclides in SAC305 tin sphere leads to the production of 210Po.
Figure 5, Figure 6 and Figure 7 show the α-particle emission energy spectra and emissivity-time histograms for Sn10%Pb90% tin spheres, Sn63%Pb37% tin spheres, and low-α SAC305 tin spheres, respectively. As can be seen from the emissivity-time histograms, emissivity eventually stabilizes, so the ultra-low emissivity data are completely reliable. And, as can be obtained from the energy spectra, the energy spectra of the three types of tin spheres exhibit a discrete distribution. Since the emissivities of the low α tin sphere were all ≤0.002 α/(cm2·h), a low number of collected α-particles result. The emissivity of the purified and treated low α tin sphere was reduced by 3 to 4 orders of magnitude.

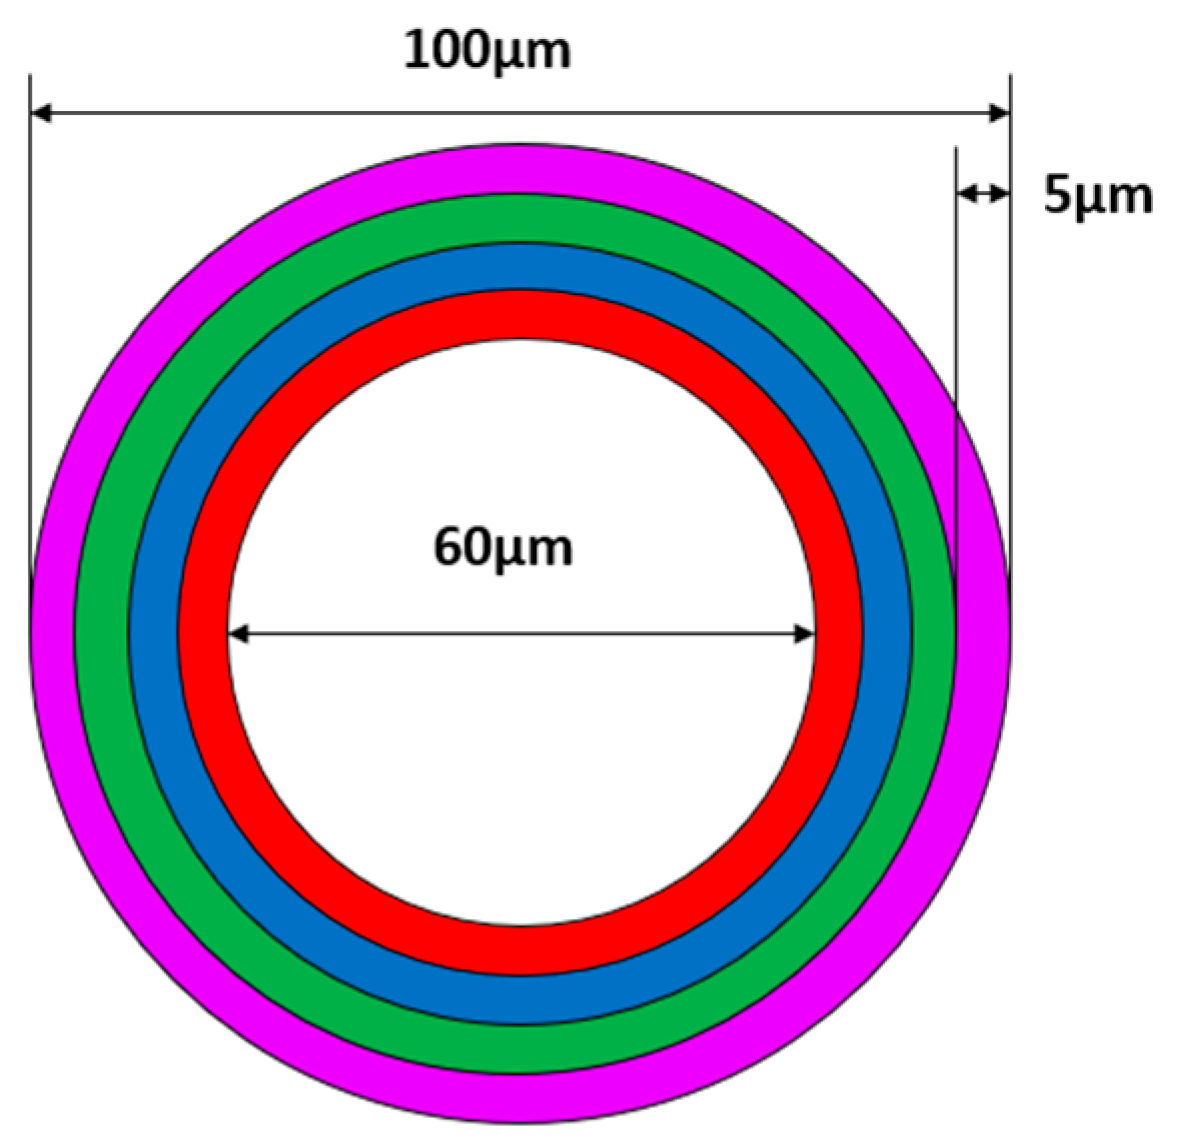
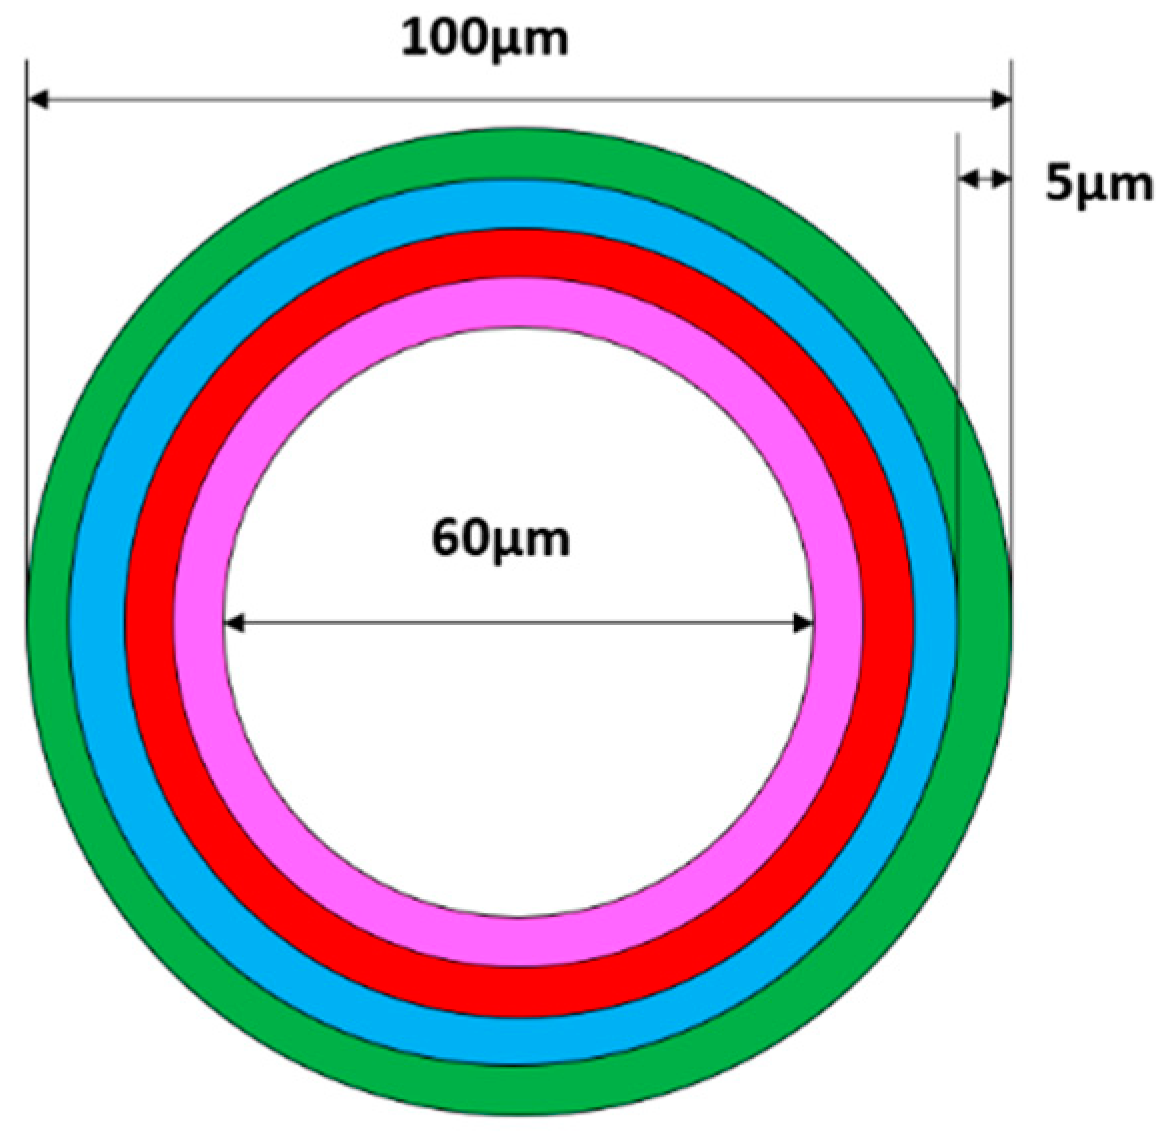
4. Monte Carlo Simulation

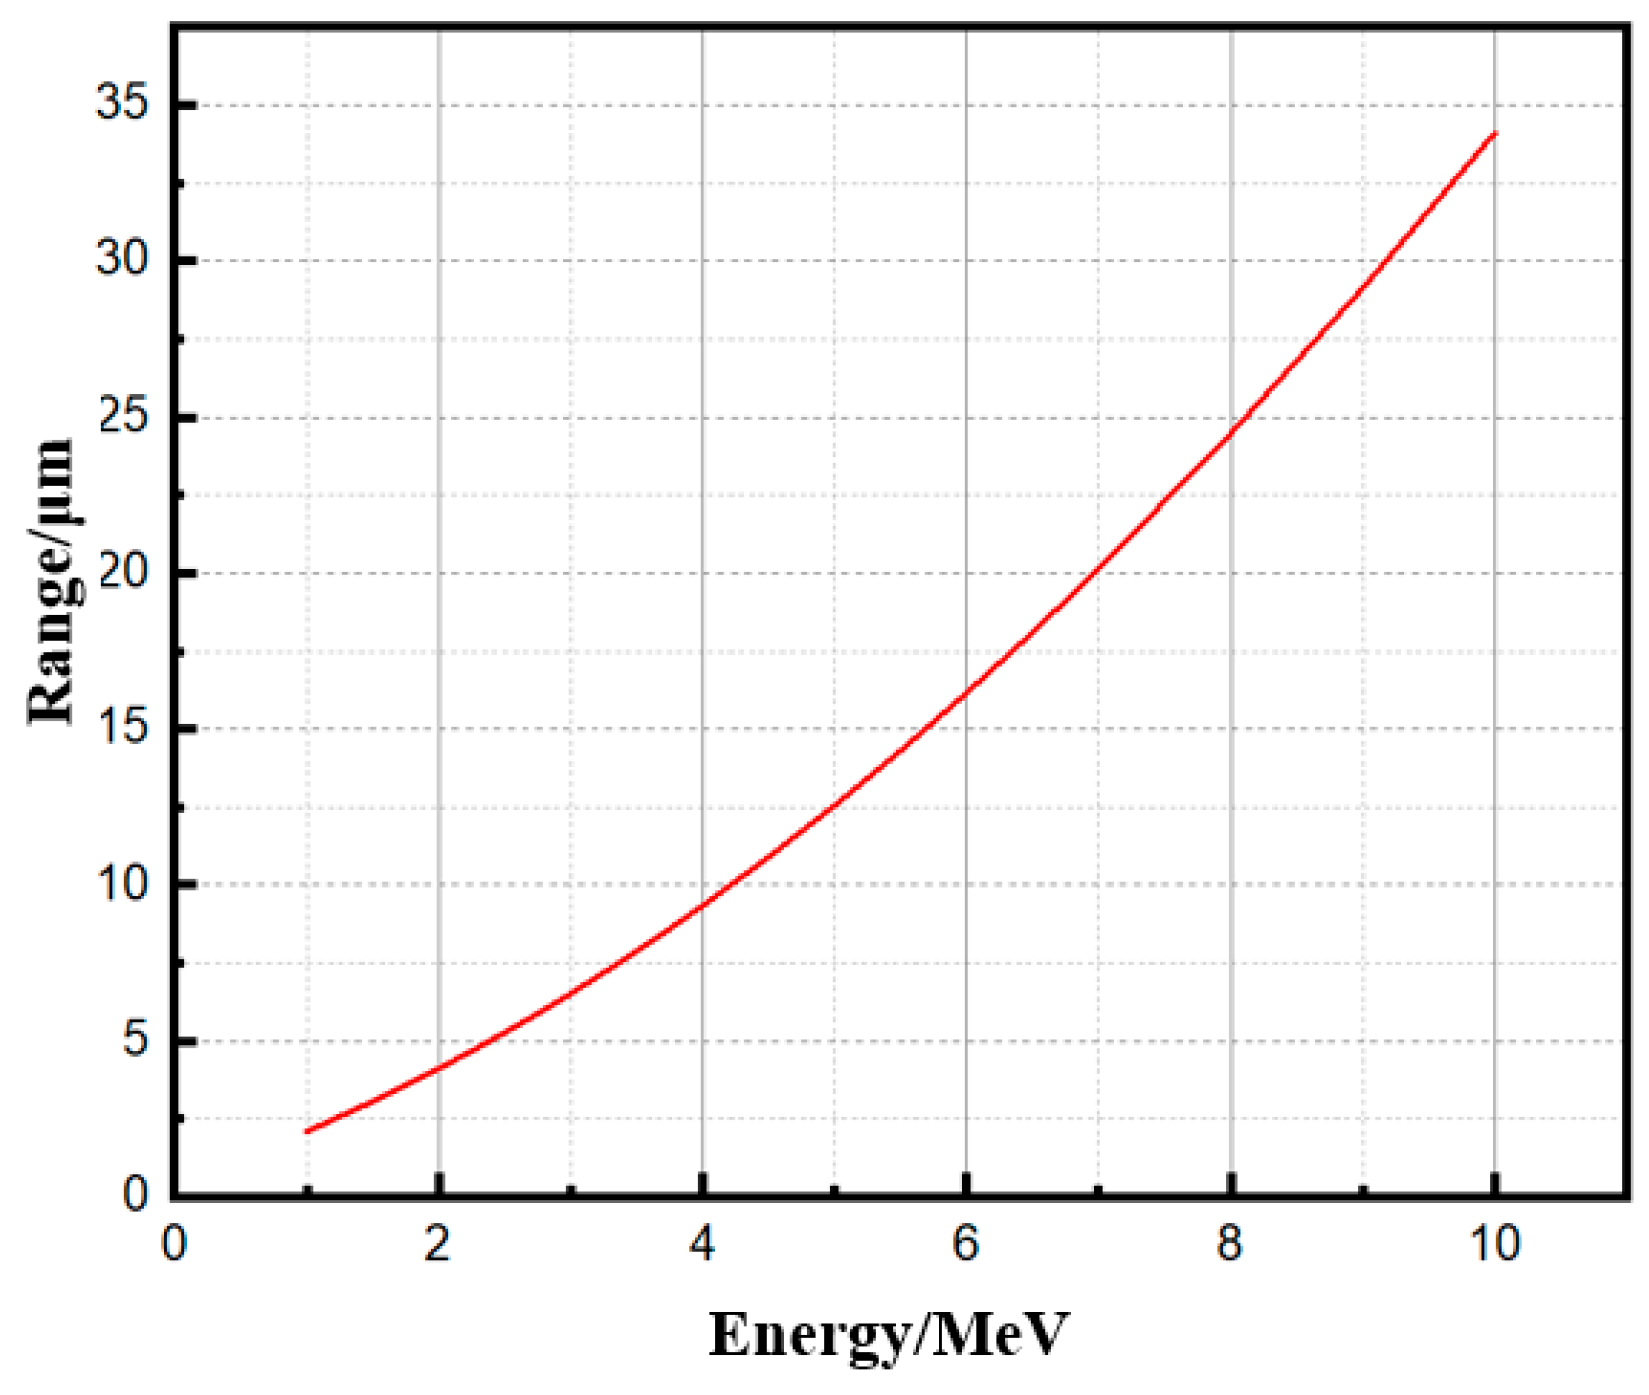
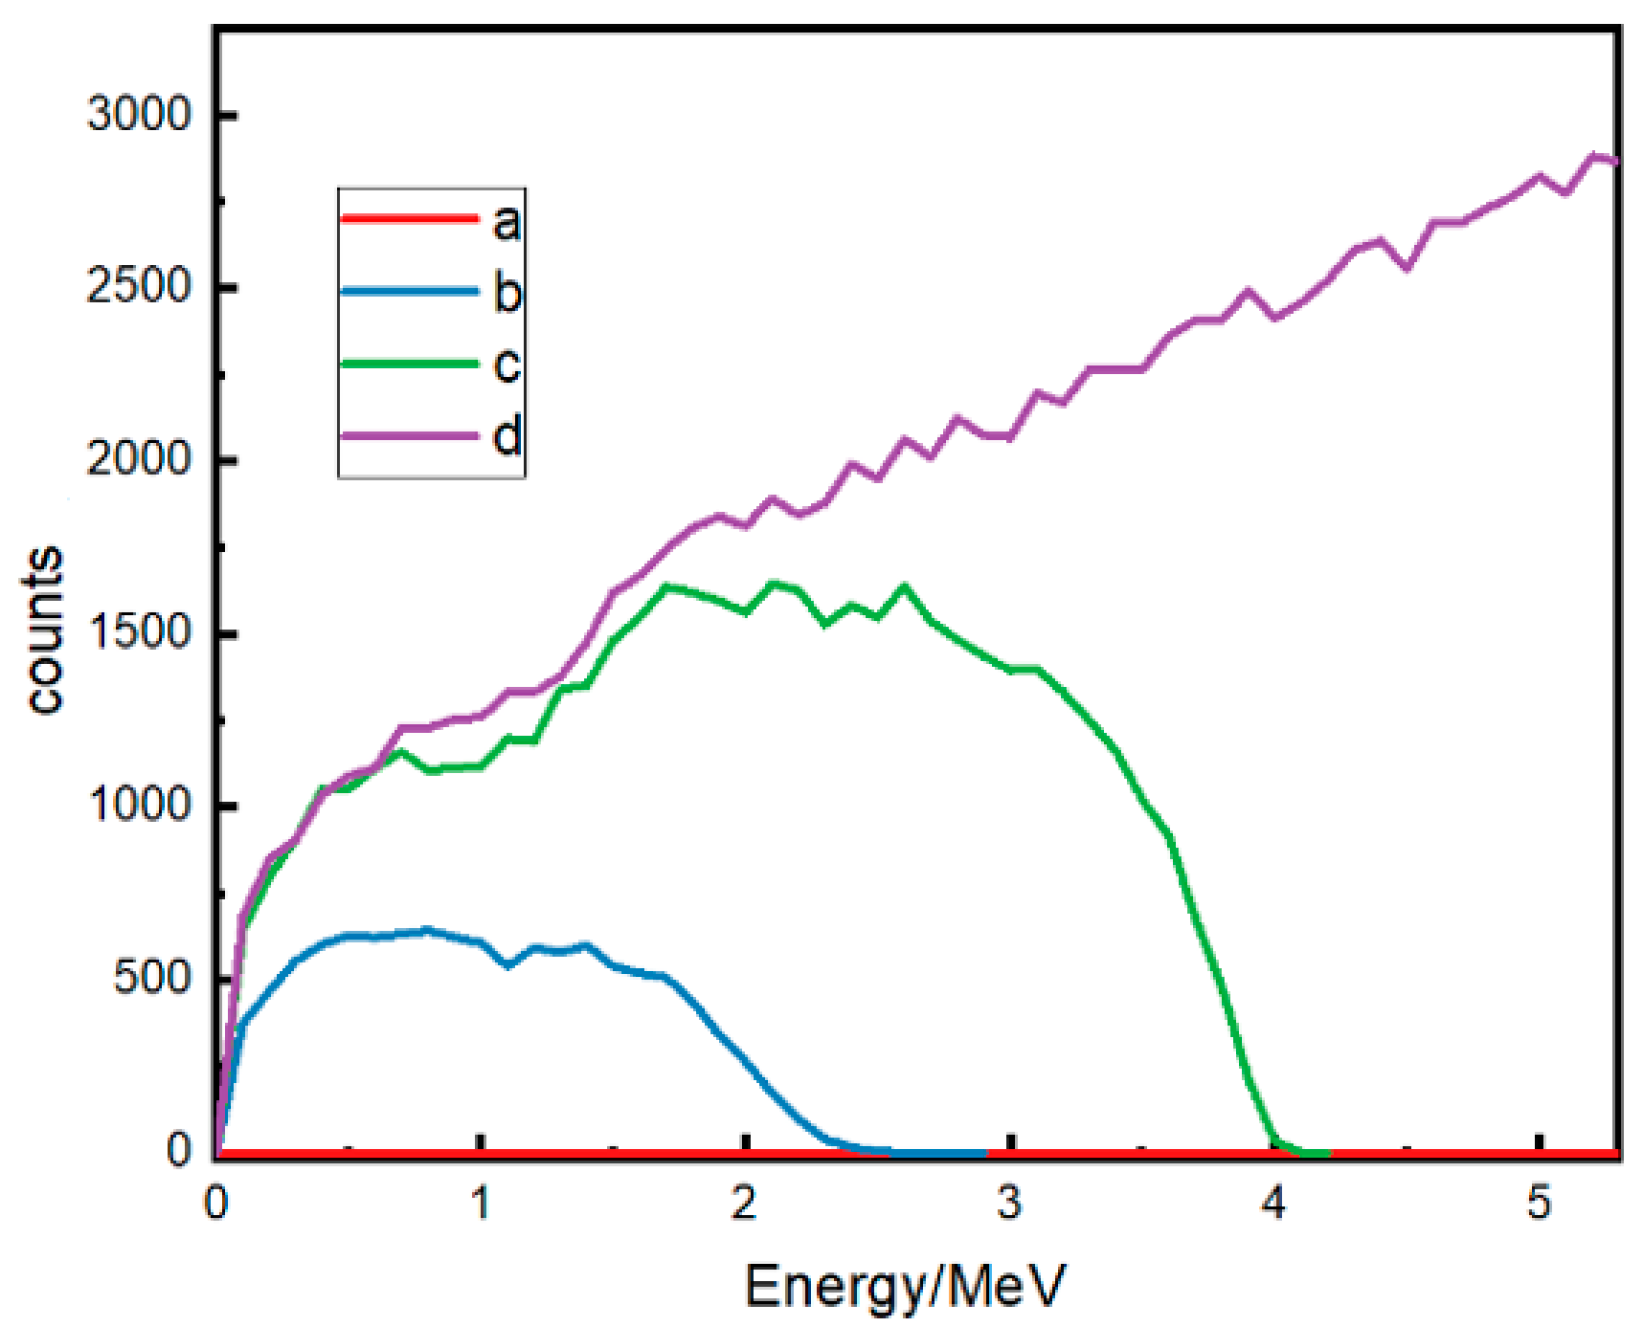
4.1. SRIM Simulation Results and Analysis

SRIM [22] (stopping and range of ions in matter-version) is a simulation software for calculating the physical effects associated with incident particles in the target material, which is generally used for calculating energy damage, simulating ion implantation, etc.
The SR (ion stopping and range table) module of SRIM is used to calculate the range and energy loss of the incident particles in the target material. In order to fulfill this function, it is necessary to enter the parameters of the target (material and element ratio of the target, relative atomic mass of the material elements, etc.) and the parameters of the incident particles (type of particles, initial energy, etc.). The calculation will take full account of processes such as direct ionization and Coulomb scattering of alpha particles during their motion.
This section focuses on obtaining the ranges of α-particles with different energies in various tin spheres through SRIM simulation to provide input parameters for the subsequent Geant4 simulation.
Figure 8 and Figure 9 show the ranges of α-particles from 1 MeV to 10 MeV in Sn63% Pb37% and SAC305 tin spheres, respectively. As can be seen from the figure, the ranges show an increasing trend of increasing magnitude as the particle energy increases. The range of α-particles with an energy of 5.3 MeV is about 19 μm in the Sn63%Pb37% tin sphere and about 14 μm in the SAC305 tin sphere.

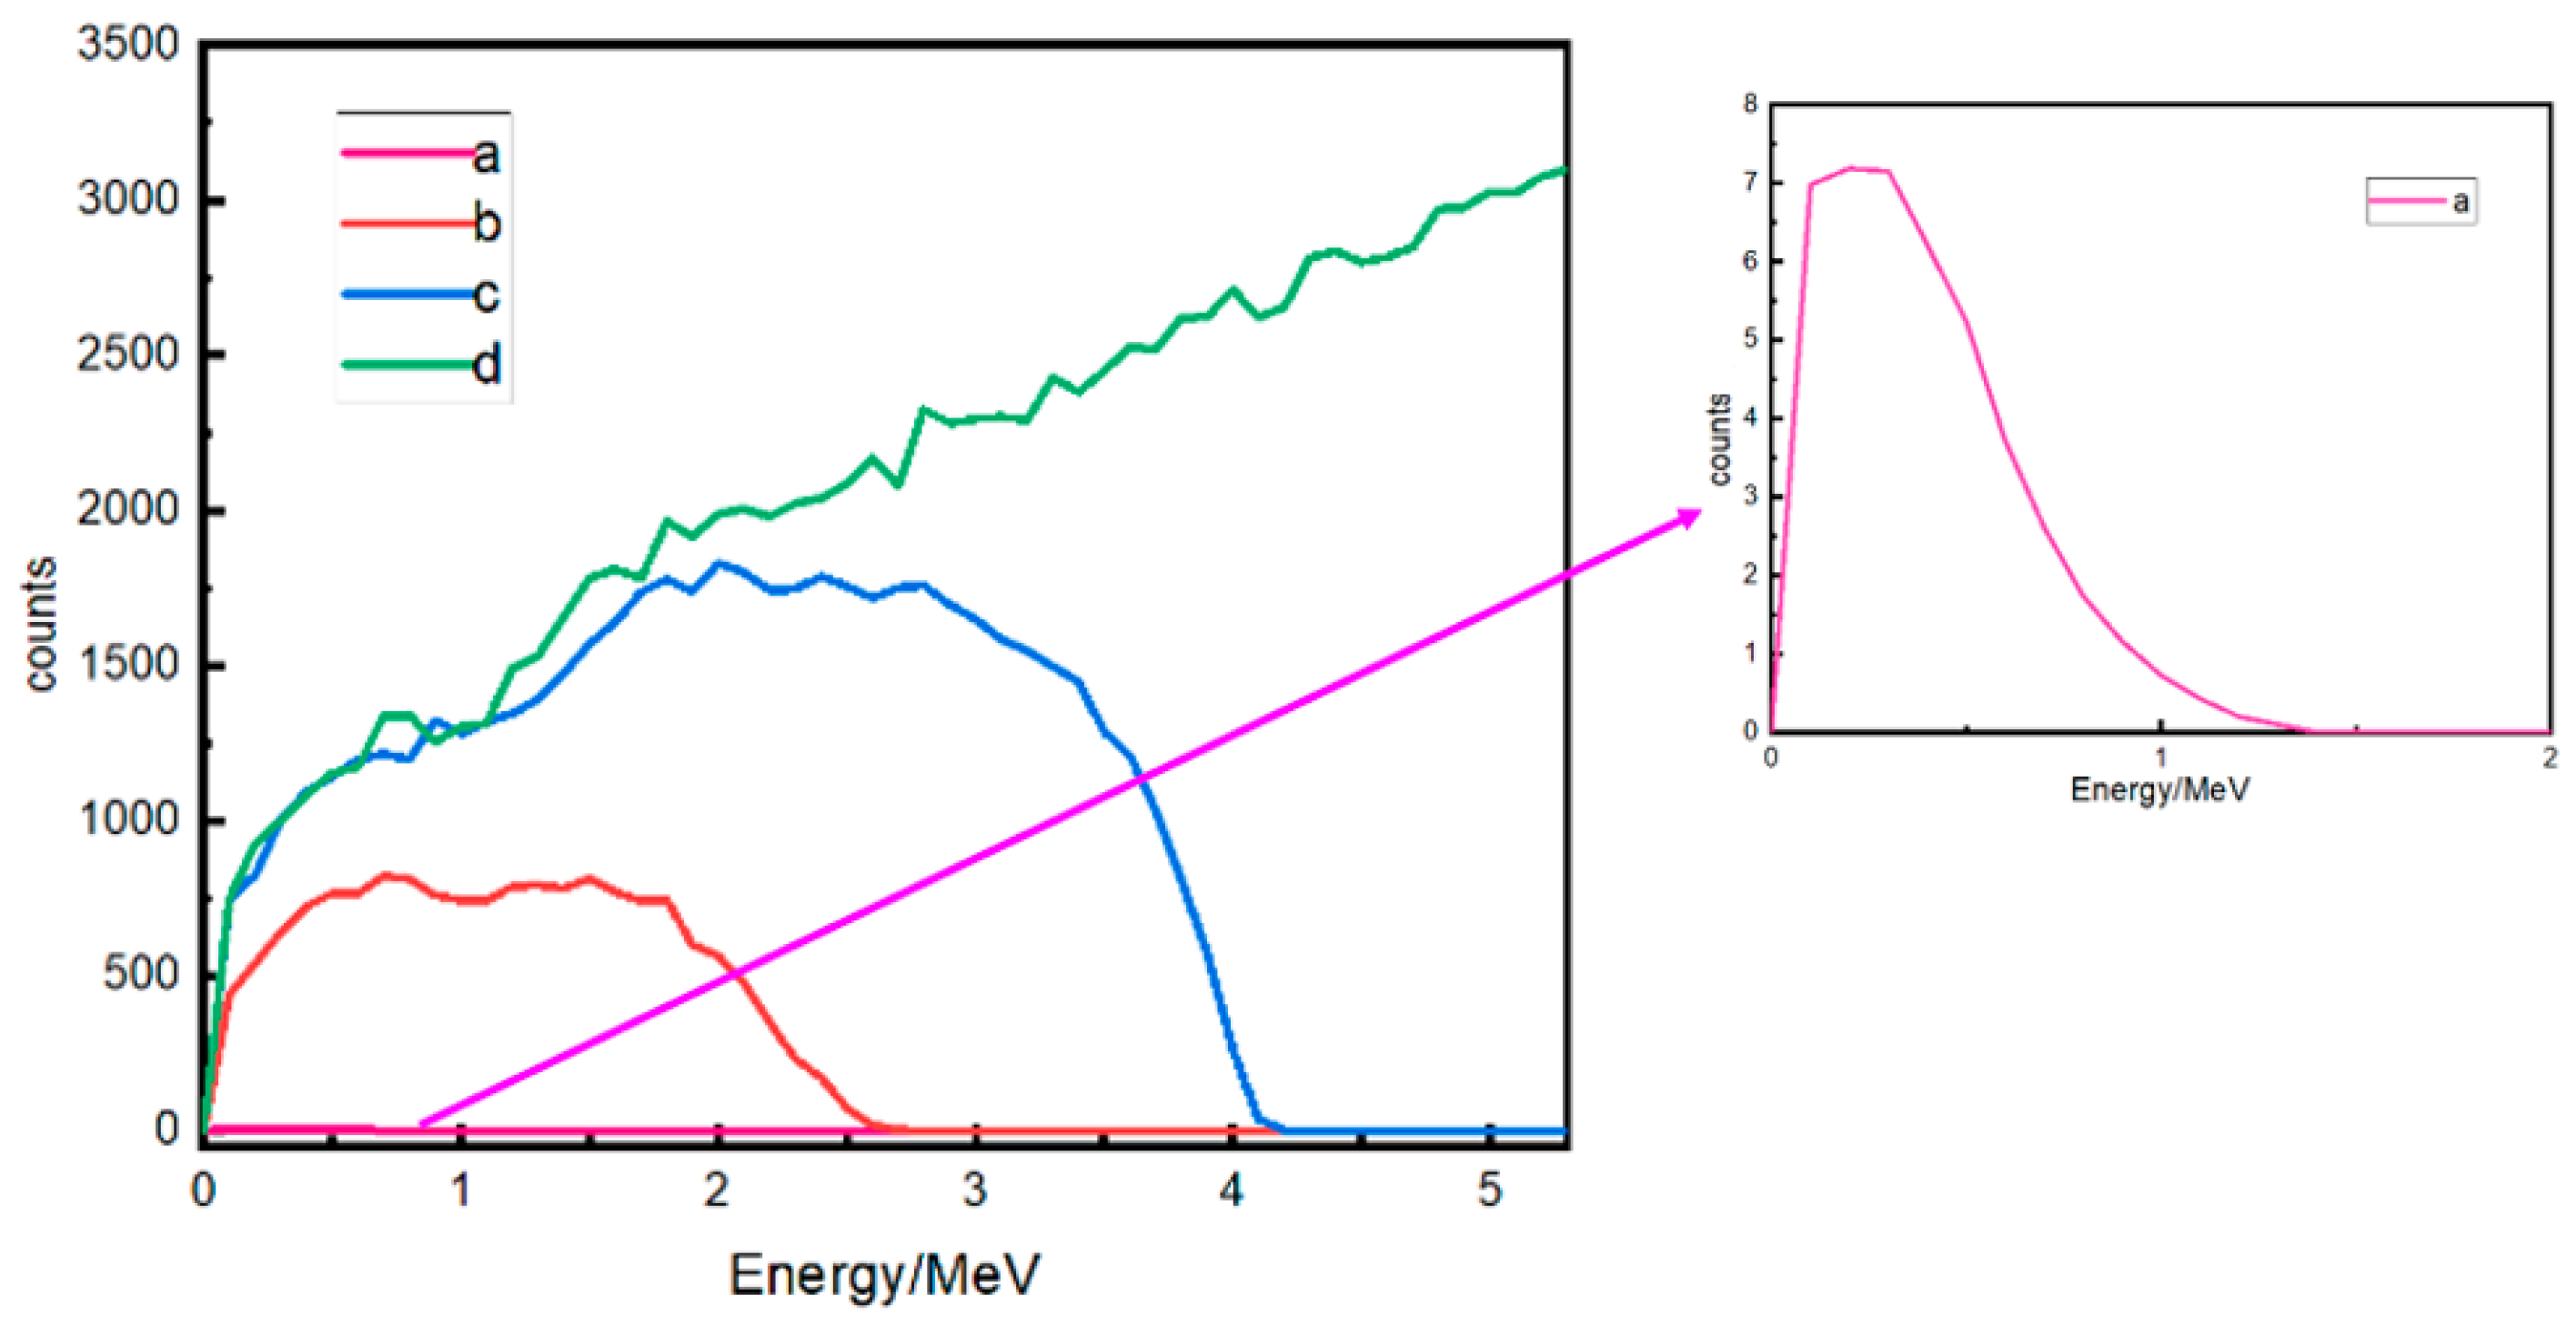
4.2. Geant4 Simulation Results and Analysis

Geant4 [23] is a Monte Carlo simulation package commonly used in particle simulation technology, providing a variety of particles, models, geometric description classes, and a series of visualization interfaces and other tools, with multi-physics process simulation capabilities, flexible geometric models, open source code, a rich toolbox, and other advantages [24,25]. In this section, we use Geant4 software to simulate the transport process of α-particles inside tin spheres by constructing various tin sphere models, obtaining the corresponding surface emission energy spectra, and investigating the internal radionuclide distribution pattern.
A schematic of the simulation model for Sn63%Pb37% and SAC305 tin spheres is shown in Figure 10. The outer diameter of the tin sphere is 100 μm, and according to the SRIM simulation results, radionuclides are uniformly set inside the 20 μm thick spherical shell inward from the surface of the tin sphere. The materials of the spherical shells were set as Sn63%Pb37% and Sn96.5%Ag3.0%Cu0.5%, and their densities were ρSn63%Pb37% = 7.34 g/cm3 and ρSAC305 = 8.84 g/cm3, respectively. One million alpha particles with an energy of 5.3 MeV are randomly ejected and their outgoing direction is random. The calculations take into account in detail the secondary electron and nuclear reaction processes in the α-particle and record the deposition energy distribution and cross-section information in the sensitive region. The physical processes used include: decay, EmStandard Screened, hElasticWEL_ CHIPS_HP, particles, G4 GammaLeptoNuclear-Phys, hInelastic FTFP_CEM_HP, stopping, and IonInelasticLAQGSM [26].
The α-particle energy spectrum on the surface of the tin spheres obtained by probing is shown in Figure 11:
(1) The emission energy spectra of the two tin spheres in the region of 0~0.2 MeV almost overlap; the slope of the spectra decreases with increasing α-particle energy; the peak of the spectra is located at 5.3 MeV;
(2) Compared with the measurement results (see Figure 2 and Figure 4), the “tail” of the simulated spectrum in the low-energy region appears to be higher and longer, and the reasons for this are analyzed as follows: Due to the uniform distribution of internal radionuclides in the simulation model of Figure 10, the energy of α-particles generated inside the tin sphere is significantly reduced when they are detected on the surface, resulting in a higher number of α-particles in the low-energy region in Figure 10; therefore, it can be inferred that the internal radionuclides of the tin sphere used for the test are not uniformly distributed, presenting the characteristics of more in the outer layer and less in the inner layer;
(3) Using SRIM calculations, it was determined that the LET value of α-particles in the SAC305 tin sphere is 3.12 × 10⁻¹ MeV·cm2/mg, which is higher than its LET value in the Sn63%Pb37% tin sphere (2.67 × 10⁻¹ MeV·cm2/mg), i.e., the α-particles are more prone to lose their energy in the SAC305 tin sphere, which results in some of the particles failing to be exited to the surface of the tin sphere. As a result, the number of α-particles detected on the surface of the SAC305 Sn sphere in Figure 11 is higher than that of the Sn63%Pb37% tin sphere.
Further simulations were carried out. As shown in Figure 12 and Figure 13, the 20-μm-thick spherical shell is divided into four equal layers of 5 μm, with inner to outer layers a, b, c, and d, respectively, and radionuclides are set uniformly in each layer. The materials of the spherical shells were set as Sn63%Pb37% and SAC305, and their densities were ρSn63%Pb37% = 7.34 g/cm3 and ρSAC = 8.84 g/cm3, respectively. One million α-particles with an energy of 5.3 MeV were randomly ejected within each layer.
The energy spectra of the ejected α-particles in each layer were probed at the surface, as shown in Figure 14 and Figure 15:
(1) Very few alpha particles are emitted from the innermost layers of the tin sphere, and the energy distribution is in the range of 0 to 1 MeV;
(2) The energy of the α-particles emitted from the b-layer is concentrated in the range of 0-2.5 MeV, and converges to 0 at energies higher than 2.5 MeV.
(3) The energy of the α-particles emitted from the c-layer is concentrated in the range of 0-4 MeV, tends to zero at energies higher than 4 MeV, and the number of α-particles emitted from 0–1 MeV is similar to that of the d-layer;
(4) The d-layer emits the largest total number of α-particles and all α-particles with energies higher than 4.1 MeV originate from the d-layer.
A combination of simulation and experimental results is analyzed. In the emission energy spectrum, α-particles with energies higher than 4 MeV all originate from the contribution of radionuclides within 5 μm of the surface layer. Therefore, about 60% of the α-particles in the energy spectrum of the Sn63%Pb37% tin sphere in Figure 2 originate from the contribution of radionuclides within 5 μm of the surface layer of the tin sphere, and about 62% of the α-particles in the energy spectrum of the SAC305 tin sphere in Figure 4 originate from the contribution of radionuclides within 5 μm of the surface layer of tin sphere.

5. Conclusions

In this paper, the surface α-particle emissivity and energy spectrum characteristics of three typical tin spheres were investigated by a combination of experimental and simulation methods. The internal radionuclides were traced back and the intrinsic mechanism was thoroughly studied by combining Monte Carlo simulations. Firstly, surface α-particle emissivity tests and energy spectrum characterization were carried out on two types of lead-containing tin spheres (Sn10%Pb90%, Sn63%Pb37%) and one type of lead-free tin sphere (SAC305). The results showed that the α-particle emissivity of the Sn10%Pb90% tin sphere is the highest; while the emissivity of the Sn63%Pb37% tin sphere, the second highest, is one order of magnitude lower than the α-particle emissivity of the Sn10%Pb90% tin sphere; and the SAC305 tin sphere had the lowest emissivity, which was reduced by about 55.6% compared with the emissivity of Sn63%Pb37% tin sphere. The emission spectra of the tin spheres showed obvious single peak characteristics. The internal radionuclide traceability of the tin spheres, combined with the spectra, revealed that 210Po was the main nuclide producing α-particles, and that 210Po originated from the decay of 210Pb. The energy spectrum of the purified low-alpha tin spheres showed a discrete distribution and its emissivity was reduced by three to four orders of magnitude.
By establishing a simulation model of tin spheres and using Monte Carlo simulation to simulate the transport process of α-particles inside the spheres, the corresponding surface emission spectra were obtained to reveal the distribution pattern of internal radionuclides. The results showed that the α-particles with energies higher than 4 MeV in the emission spectra originated from the radionuclides within 5 μm of the surface layer of the tin sphere, accounting for 60% of the total number of particles. According to the test results and simulation analyses, it was found that the internal radionuclides of the tin spheres used for the test show the characteristics of more surface layer and less internal layer. The above results are important for the establishment of α-particle mitigation methods for tin spheres, which, in turn, will help to improve the reliability of chips from the material level and reduce the risk of soft errors in chips.

Author Contributions

Conceptualization, L.L.; methodology: L.L., Z.Z. and Z.L.; software: H.Z.; validation: H.Z.; formal analysis: J.L. and C.P.; investigation: L.L. and C.S.; resources: Z.Z. data curation, L.L.; writing original draft preparation, L.L.; writing review and editing: L.L. and H.L.; visu-alization, Y.H.; upervision, Z.Z.; project administration: Z.Z.; funding acquisition, Z.Z. All authors have read and agreed to the published version of the manuscript.

Funding

This research was funded by National Natural Science Foundation of China grant number 12175045, 12075065. The Key-Area Research and Development Program of Guangdong Province (Grant No. 2022B0701180002).

Institutional Review Board Statement

Not applicable.

Informed Consent Statement

Not applicable.

Data Availability Statement

The datasets presented in this article are not readily available because the data are part of an ongoing study. Requests to access the datasets should be directed to [email protected].

Conflicts of Interest

The authors declare no conflict of interest.

References

  1. May, T.C.; Woods, M.H. Alpha-particle-induced soft errors in dynamic memories. IEEE Trans. Electron. Dev. 1979, 26, 2. [Google Scholar] [CrossRef]
  2. Anlin, H.E.; Guo, G.; Shen, D. Proton Induced Single Event Upsets Test and Soft Error Rate Prediction of nm Device. Annu. Rep. China Inst. At. Energy 2017, 93–94. [Google Scholar]
  3. Zhang, Z.; Ye, B.; Ji, Q.; Guo, J.; Xi, K.; Lei, Z.; Huang, Y.; Peng, C.; He, Y.; Liu, J.; et al. Study of alpha particle soft error mechanism in nanoscale static random access memory. Acta Phys. Sinica 2020, 69, 255–263. [Google Scholar]
  4. Bhuva, B. Soft error trends in advanced silicon technology nodes. In Proceedings of the 2018 IEEE International Electron Devices Meeting (IEDM), San Francisco, CA, USA, 1–5 December 2018; p. 34.4.1. [Google Scholar]
  5. Lei, Z.F.; Zhang, Z.G.; En, Y.F.; Huang, Y. Mechanisms of atmospheric neutron-induced single event upsets in nanometric SOI and bulk SRAM devices based on experiment-verified simulation tool. Chin. Phys. B 2018, 27, 338–342. [Google Scholar] [CrossRef]
  6. Wang, X.; Zhang, F.Q.; Chen, W.; Guo, X.Q.; Ding, L.L.; Luo, Y.H. Assessment of the application of the China Scattered Neutron Source to the study of atmospheric neutron single-particle effects. Acta Phys. Sin. 2019, 68, 44–53. [Google Scholar]
  7. JESD89; A Measurement and Reporting of Alpha Particle and Terrestrial Cosmic Ray-Induced Soft Errors in Semiconductor Devices. JEDEC Standard: Arlington, VA, USA, 2006.
  8. Auden, E.C.; Quinn, H.M.; Wender, S.A.; O’ Donnell, J.M.; Lisowski, P.W.; George, J.S.; Xu, N.; Black, D.A.; Black, J.D. Thermal Neutron-Induced Single-Event Upsets in Microcontrollers Containing Boron-10. IEEE Trans. Nucl. Sci. 2020, 67, 29. [Google Scholar] [CrossRef]
  9. Weulersse, C.; Houssany, S.; Guibbaud, N.; Segura-Ruiz, J.; Beaucour, J.; Miller, F.; Mazurek, M. Contribution of Thermal Neutrons to Soft Error Rate. IEEE Trans. Nucl. Sci. 2018, 65, 1851–1857. [Google Scholar] [CrossRef]
  10. Autran, J.L.; Munteanu, D.; Sauze, S.; Gasiot, G.; Roche, P. Accurate Resolution of Time-Dependent and Circuit-Coupled Charge Transport Equations: 1-D Case Applied to 28-nm FD-SOI Devices. In Proceedings of the 2014 IEEE Radiation Effects Data Workshop (REDW), Paris, France, 14–18 July 2014; p. 1. [Google Scholar]
  11. Ai, Y. Soft errors induced by alpha particles in large-scale integrated circuits and measures to reduce soft errors. J. Jixi Univ. 2003, 57–58. [Google Scholar] [CrossRef]
  12. Claeys, C.L.; Simoen, E. Radiation Effects in Advanced Semiconductor Materials and Devices; Springer: Berlin/Heidelberg, Germany, 2002. [Google Scholar]
  13. Li, J.; Li, J.; Ding, Y.; Liu, C.; Hou, X.; Chen, H.; Xiong, Y.; Zhang, D.W.; Chai, Y.; Zhou, P. Highly Area-Efficient Low-Power SRAM Cell with 2 Transistors and 2 Resistors. In Proceedings of the 2019 IEEE International Electron Devices Meeting (IEDM), San Francisco, CA, USA, 7–11 December 2019. [Google Scholar]
  14. Lee, S.; Uemura, T.; Monga, U.; Choi, J.H.; Kim, G.; Pae, S. Soft error rate analysis for incident angle and N-well structure dependencies using small-sized alpha source in 10 nm FinFET technology. In Proceedings of the 2017 IEEE International Reliability Physics Symposium (IRPS), Monterey, CA, USA, 2–6 April 2017; pp. SE.1.1–SE.1.4. [Google Scholar]
  15. Uemura, T.; Lee, S.; Monga, U.; Choi, J.; Lee, S.; Pae, S. Technology Scaling Trend of Soft Error Rate in Flip-Flops in 1 × nm Bulk FinFET Technology. IEEE Trans. Nucl. Sci. 2018, 65, 1255–1263. [Google Scholar] [CrossRef]
  16. Fang, Y.P.; Oates, A.S. Soft errors in 7nm FinFET SRAMs with integrated fan-out packaging. In Proceedings of the 2018 IEEE International Reliability Physics Symposium (IRPS), Burlingame, CA, USA, 11–15 March 2018. [Google Scholar]
  17. Luo, J.; Zhang, Z.; Lei, Z.; Chen, Z.; Peng, C.; Yue, S.; Zhang, H.; Zhong, X.; Sun, C.; Huang, Y.; et al. Ultra-low background α-particle testing technology and experimental research on electronic materials. Electron. Prod. Reliab. Environ. Test. 2022, 40, 37–41. [Google Scholar]
  18. Jiao, Y.; Jermsittiparsert, K.; Krasnopevtsev, A.Y. Interaction of thermal cycling and electric current on reliability of solder joints in different solder balls et al. Mater. Res. Express 2019, 6, 106302. [Google Scholar] [CrossRef]
  19. Chia JY, H.; Cotterell, B.; Chai, T.C.; Cotterell, B.; Chai, T.C. The mechanics of the solder ball shear test and the effect of shear rate. Mater. Sci. Eng. A 2006, 417, 259–274. [Google Scholar] [CrossRef]
  20. Persson, B.; Holm, E. Polonium-210 and lead-210 in the terrestrial environment a historical review. J. Environ. Radioact. 2011, 102, 420–429. [Google Scholar] [CrossRef] [PubMed]
  21. Available online: https://xia.com/support/ultralo-1800/ (accessed on 10 January 2024).
  22. The Stopping and Range of Ions in Matter, Ziegler J F. Available online: http://www.srim.org/ (accessed on 17 January 2024).
  23. Battistoni, G.; Boehlen, T.; Cerutti, F.; Boehlen, T.; Cerutti, F.; Chin, P.W.; Esposito, L.S.; Fassò, A.; Ferrari, A.; Lechner, A.; et al. Overview of the FLUKA code. Ann. Nucl. Energy 2015, 82, 10. [Google Scholar] [CrossRef]
  24. Díaz-Francés, J.A.; Cortés-Giraldo, M.A.; Jiménez-Ramos, M.C.; Hurtado-Bermúdez, S. Simulation of the response of a PIPS detector using GEANT4 code. Nucl. Instrum. Methods Phys. Res. Sect. A Accel. Spectrometers Detect. Assoc. Equip. 2017, 875, 21–26. [Google Scholar] [CrossRef]
  25. Moslehi, A.; Baradaran, S.; Taheri, M. The microdosimetic one-hit detector model for calculating the alpha particles detection efficiency of polycarbonate SSNTD. Nucl. Instrum. Methods Phys. Res. Sect. A Accel. Spectrometers Detect. Assoc. Equipment. 2022, 1033, 166714. [Google Scholar] [CrossRef]
  26. Geant4 Collaboration. “Geant4: A Simulation Toolkit”, Physics Reference Manual, Release 11.1. 2022. Available online: https://geant4-userdoc.web.cern.ch/UsersGuides/PhysicsReferenceManual/fo/PhysicsReferenceManual.pdf (accessed on 15 January 2024).
Figure 1. The α-particle energy spectrum of the Sn10%Pb90% tin sphere emission.
Applsci 14 04257 g001
Figure 2. The α-particle energy spectrum of the Sn63%Pb37% tin sphere emission.
Applsci 14 04257 g002
Figure 3. The α-particle emission energy spectrum of thick-film material containing 232Th [5].
Applsci 14 04257 g003
Figure 4. The α-particle energy spectrum of the SAC305 tin sphere emission.
Applsci 14 04257 g004
Figure 5. The low α α-particle energy spectrum of the Sn10%Pb90% tin sphere emission and emissivity-time histograms.
Applsci 14 04257 g005
Figure 6. The low α α-particle energy spectrum of the Sn63%Pb37% tin sphere emission and emissivity-time histograms.
Applsci 14 04257 g006
Figure 7. The low α α-particle energy spectrum of the SAC305 tin sphere emission and emissivity-time histograms.
Applsci 14 04257 g007
Figure 8. Ranges of α-particles with different energies inside the Sn63%Pb37% tin sphere.
Applsci 14 04257 g008
Figure 9. Ranges of α-particles with different energies inside the SAC305 tin sphere.
Applsci 14 04257 g009
Figure 10. Schematic diagram of the simulation model of tin sphere.
Applsci 14 04257 g010
Figure 11. Emission energy spectra of 5.3 MeV α-particles on the surface of two kinds of tin spheres obtained by simulation.
Applsci 14 04257 g011
Figure 12. Simulation model of the SAC305 tin sphere.
Applsci 14 04257 g012
Figure 13. Simulation model of Sn63%Pb37% tin sphere.
Applsci 14 04257 g013
Figure 14. Emission energy spectra of α-particles at 5.3 MeV obtained from simulation on the surface of the SAC305 tin sphere. There are four cases, a represents the emission energy spectrum of radionuclides on the surface within the a-layer, b represents the emission energy spectrum of radionuclides on the surface within the b-layer, c represents the emission energy spectrum of radionuclides on the surface within the c-layer and d represents the emission energy spectrum of radionuclides on the surface within the d-layer.
Applsci 14 04257 g014
Figure 15. Emission energy spectra of α-particles at 5.3 MeV obtained from simulation on the surface of Sn63%Pb37% tin sphere. There are four cases, a represents the emission energy spectrum of radionuclides on the surface within the a-layer, b represents the emission energy spectrum of radionuclides on the surface within the b-layer, c represents the emission energy spectrum of radionuclides on the surface within the c-layer and d represents the emission energy spectrum of radionuclides on the surface within the d-layer.
Applsci 14 04257 g015
Table 1. Alpha particle energies and half-lives of 238U decay chains [20].
Parent NuclideT1/2Type of DecayDecaying Alpha Particle Energy/MeVRadio Nuclide
238U4.468 × 109 yα4.198 (79%), 4.151 (21%)234Th
234Th-β-234Pa
234Pa-β-234U
234U2.455 × 105 yα4.775 (71%), 4.772 (28%)230Th
230Th7.538 × 104 yα4.687 (76%), 4.620 (23%)226Ra
226Ra1600 yα4.784 (94%), 4.601 (6%)222Rn
222Rn3.8 dα5.489218Po
218Po3.1 sα6.002214Pb
214Pb-β-214Bi
214Bi-β-214Po
214Po163 μsα7.687210Pb
210Pb22.2 yβ-210Bi
210Bi5 dβ-210Po
210Po138 dα5.304206Pb
Table 2. Parameters of samples to be measured.
GroupSample CompositionBall DiameterDensities (g/cm3)
1#Sn10%Pb90%0.1 mm10.7
2#Sn63%Pb37%0.1 mm7.34
3#SnAg3.0%Cu0.5%0.1 mm8.84
4#LowαSn10%Pb90%0.1 mm10.7
5#LowαSnAg3.0%Cu0.5%0.1 mm7.34
6#LowαSn63%Pb37%0.1 mm8.84
Table 3. Sample alpha particle surface emissivity.
GroupSample CompositionBall Diameterα-Particle Emissivity α/(cm2·h)
1#Sn10%Pb90% 0.1 mm85.12 ± 0.7
2#Sn63%Pb37% 0.1 mm8.47 ± 0.2
3#SAC3050.1 mm3.76 ± 0.2
4#Low α Sn10%Pb90%0.1 mm0.0019 ± 0.00035
5#Low α Sn63%Pb37%0.1 mm0.0017 ± 0.00029
6#Low α SAC3050.1 mm0.0010 ± 0.00048
Table 4. Alpha particle emissivity scale.
Alpha Particle Emissivity ClassEmissivity (α/(cm2·h))
Uncontrolled Alpha>0.05
Low Alpha0.002~0.05
Ultra Low Alpha (ULA)<0.002
Disclaimer/Publisher’s Note: The statements, opinions and data contained in all publications are solely those of the individual author(s) and contributor(s) and not of MDPI and/or the editor(s). MDPI and/or the editor(s) disclaim responsibility for any injury to people or property resulting from any ideas, methods, instructions or products referred to in the content.

