IAQ Prediction in Apartments Using Machine Learning Techniques and Sensor Data
Abstract
Featured Application
Abstract
1. Introduction
2. Experimental Design
2.1. Sensor Device for IAQ Monitoring
2.2. Apartments
2.3. IAQ Monitoring Study
3. Methods
3.1. Prediction Model Structure
3.2. Prediction Models–MLT Models and Naive Approach
3.2.1. Decision Tree (DT)
3.2.2. Random Forest Regression (RFR)
3.2.3. K-Nearest Neighbors (KNN)
3.2.4. Multilayer Perceptron (MLP)
3.2.5. Multiple Linear Regression (MLR)
3.2.6. Naive Approach
3.3. Prediction Model Validation
3.4. Performance Metrics
4. Results
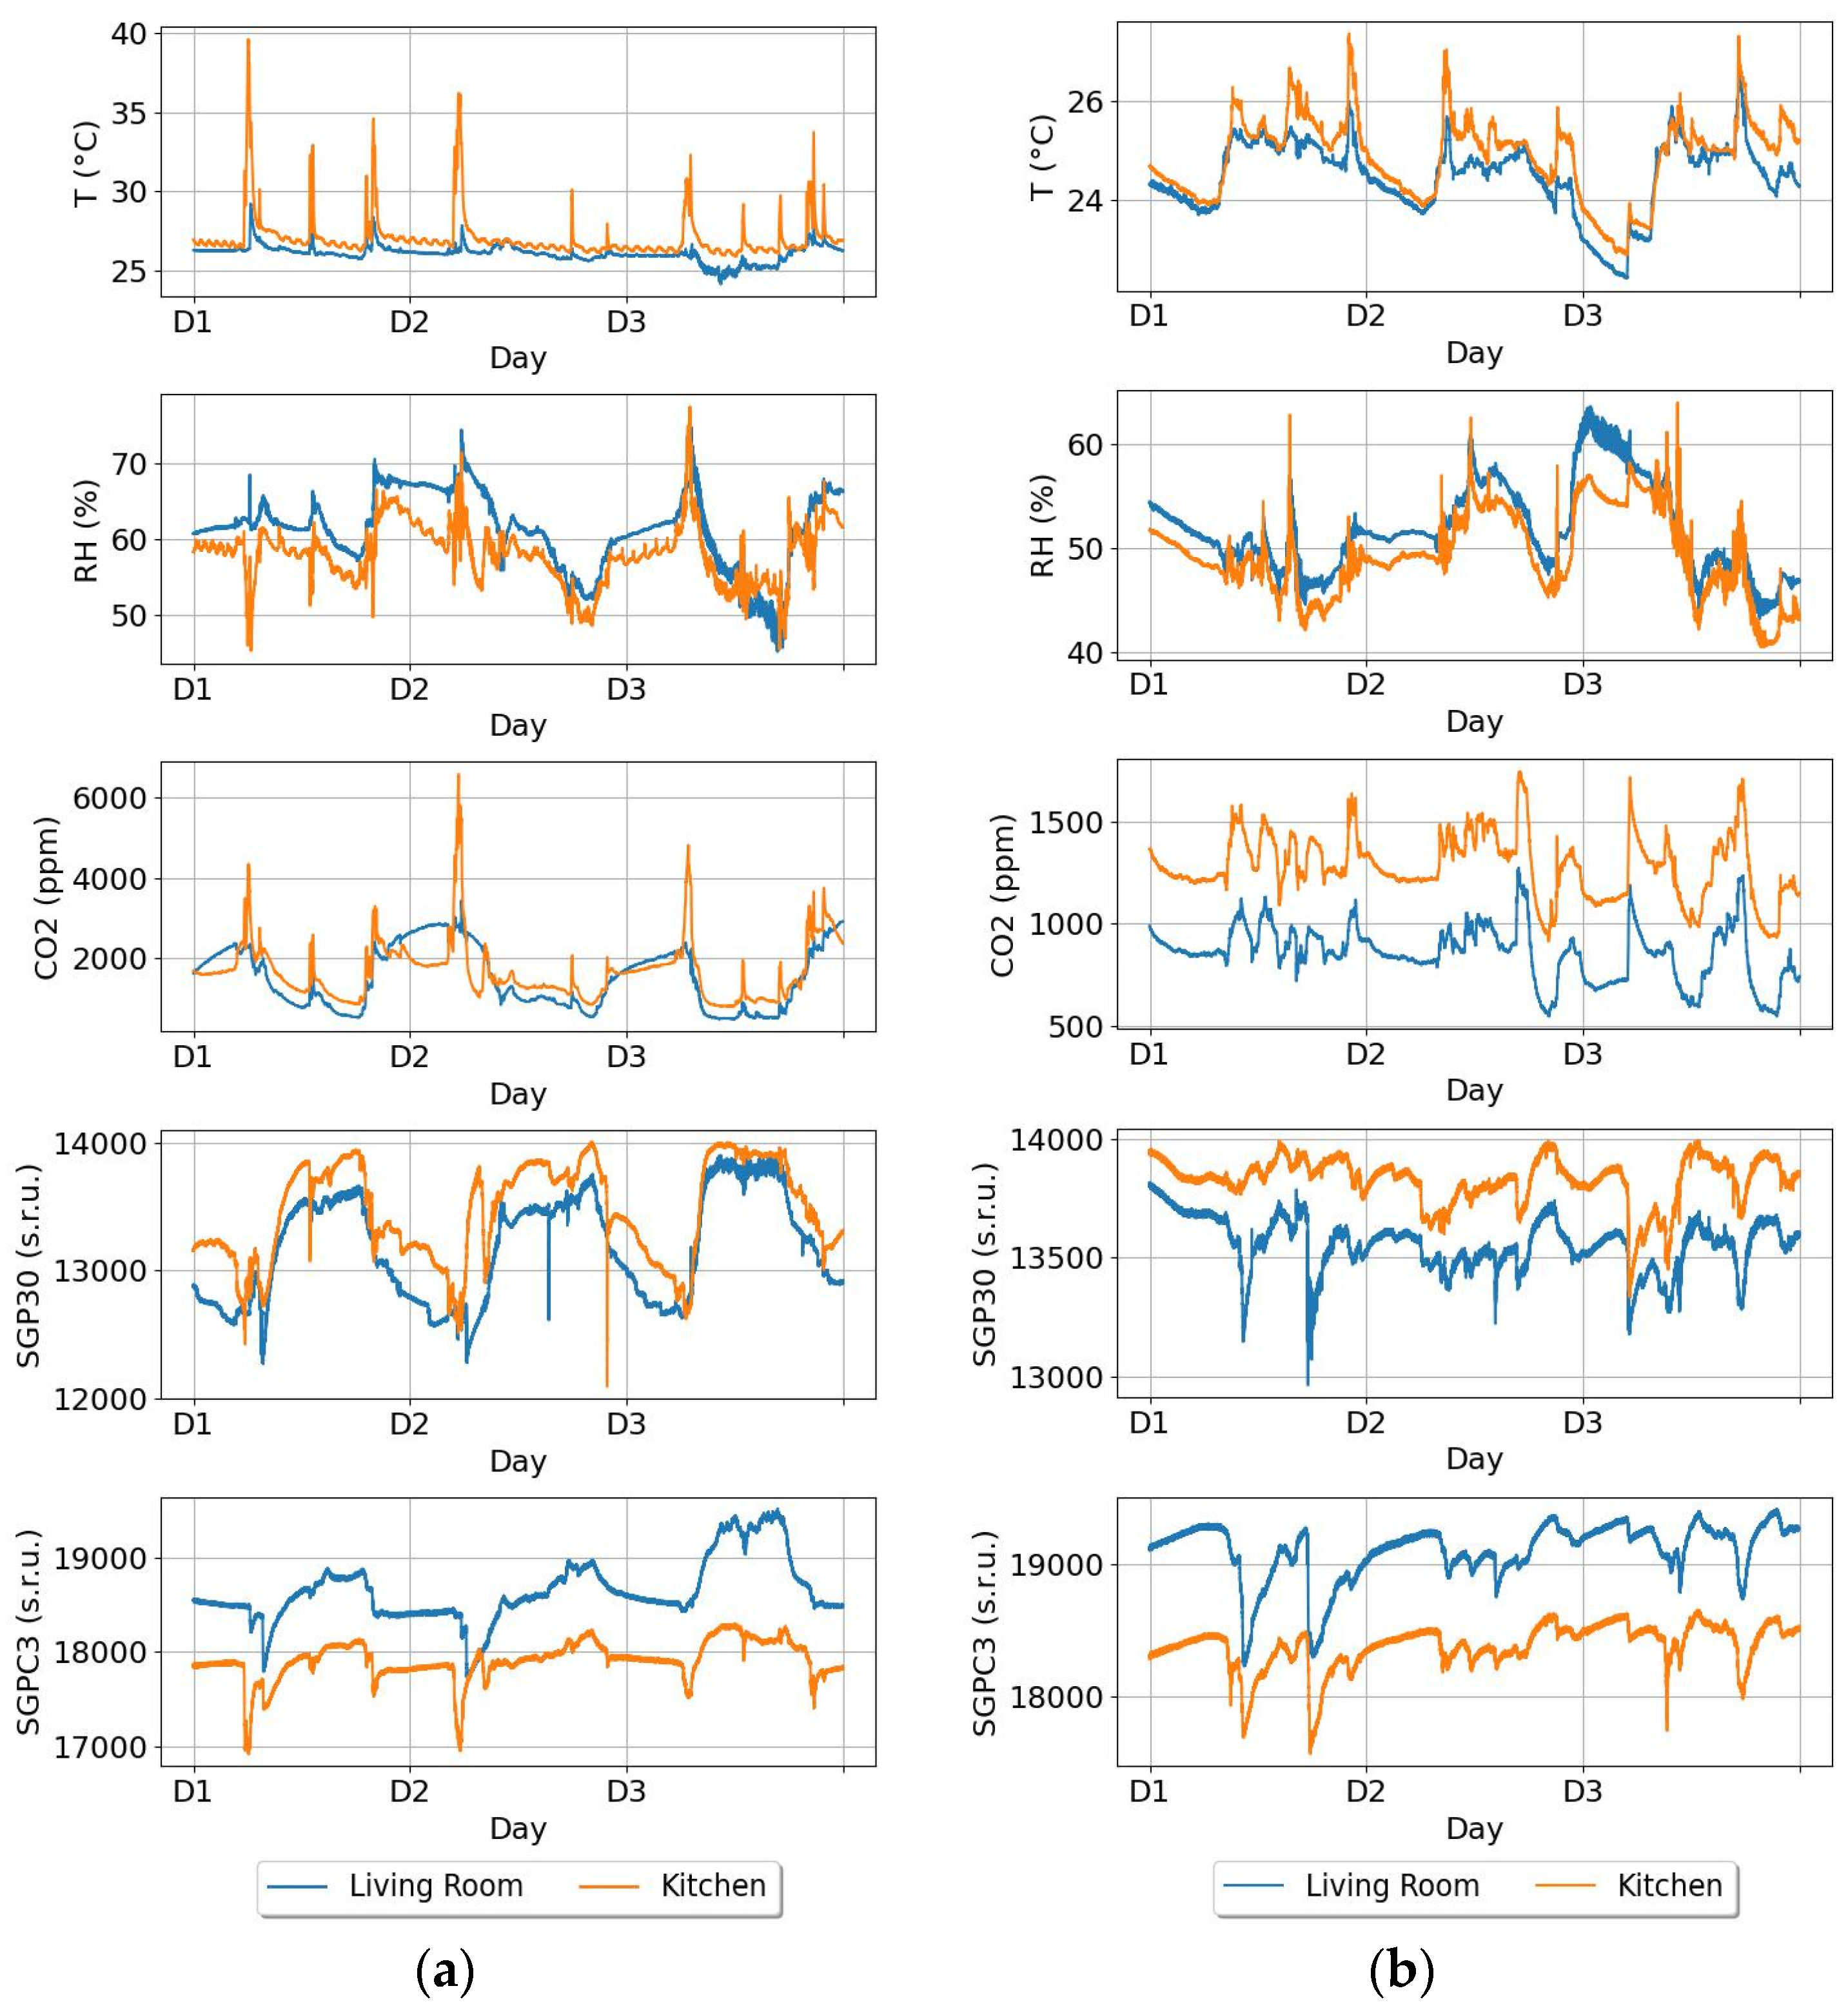
4.1. Selected Results of IAQ Monitoring in Apartments
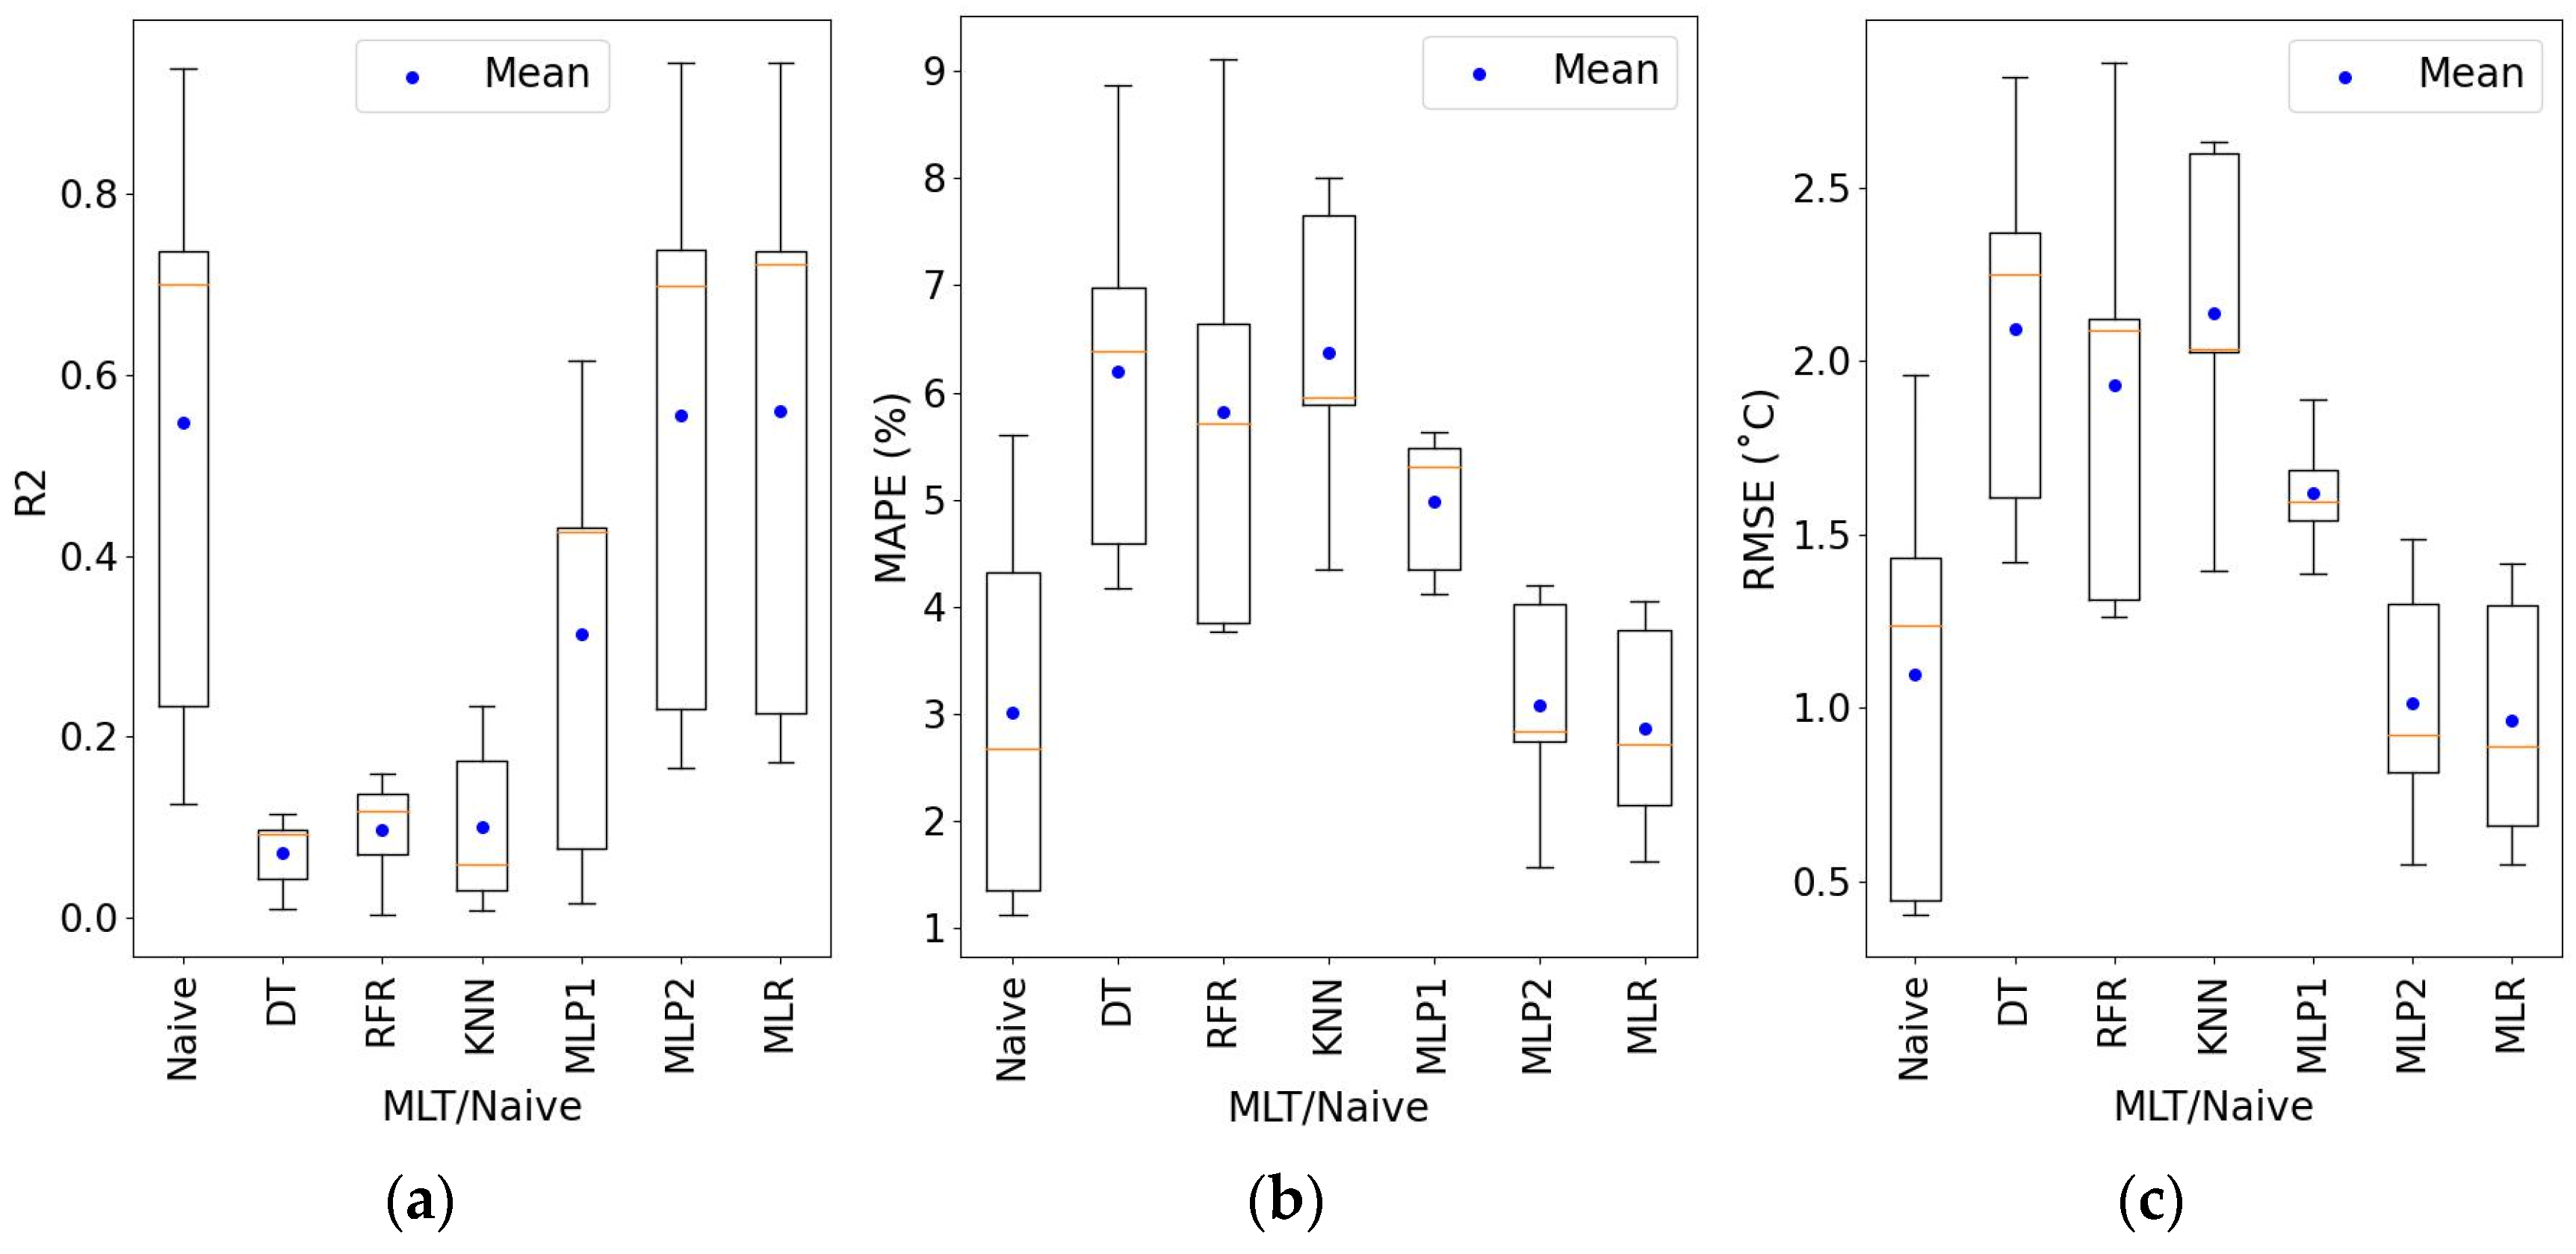
4.2. Temperature Prediction
4.3. Relative Humidity Prediction
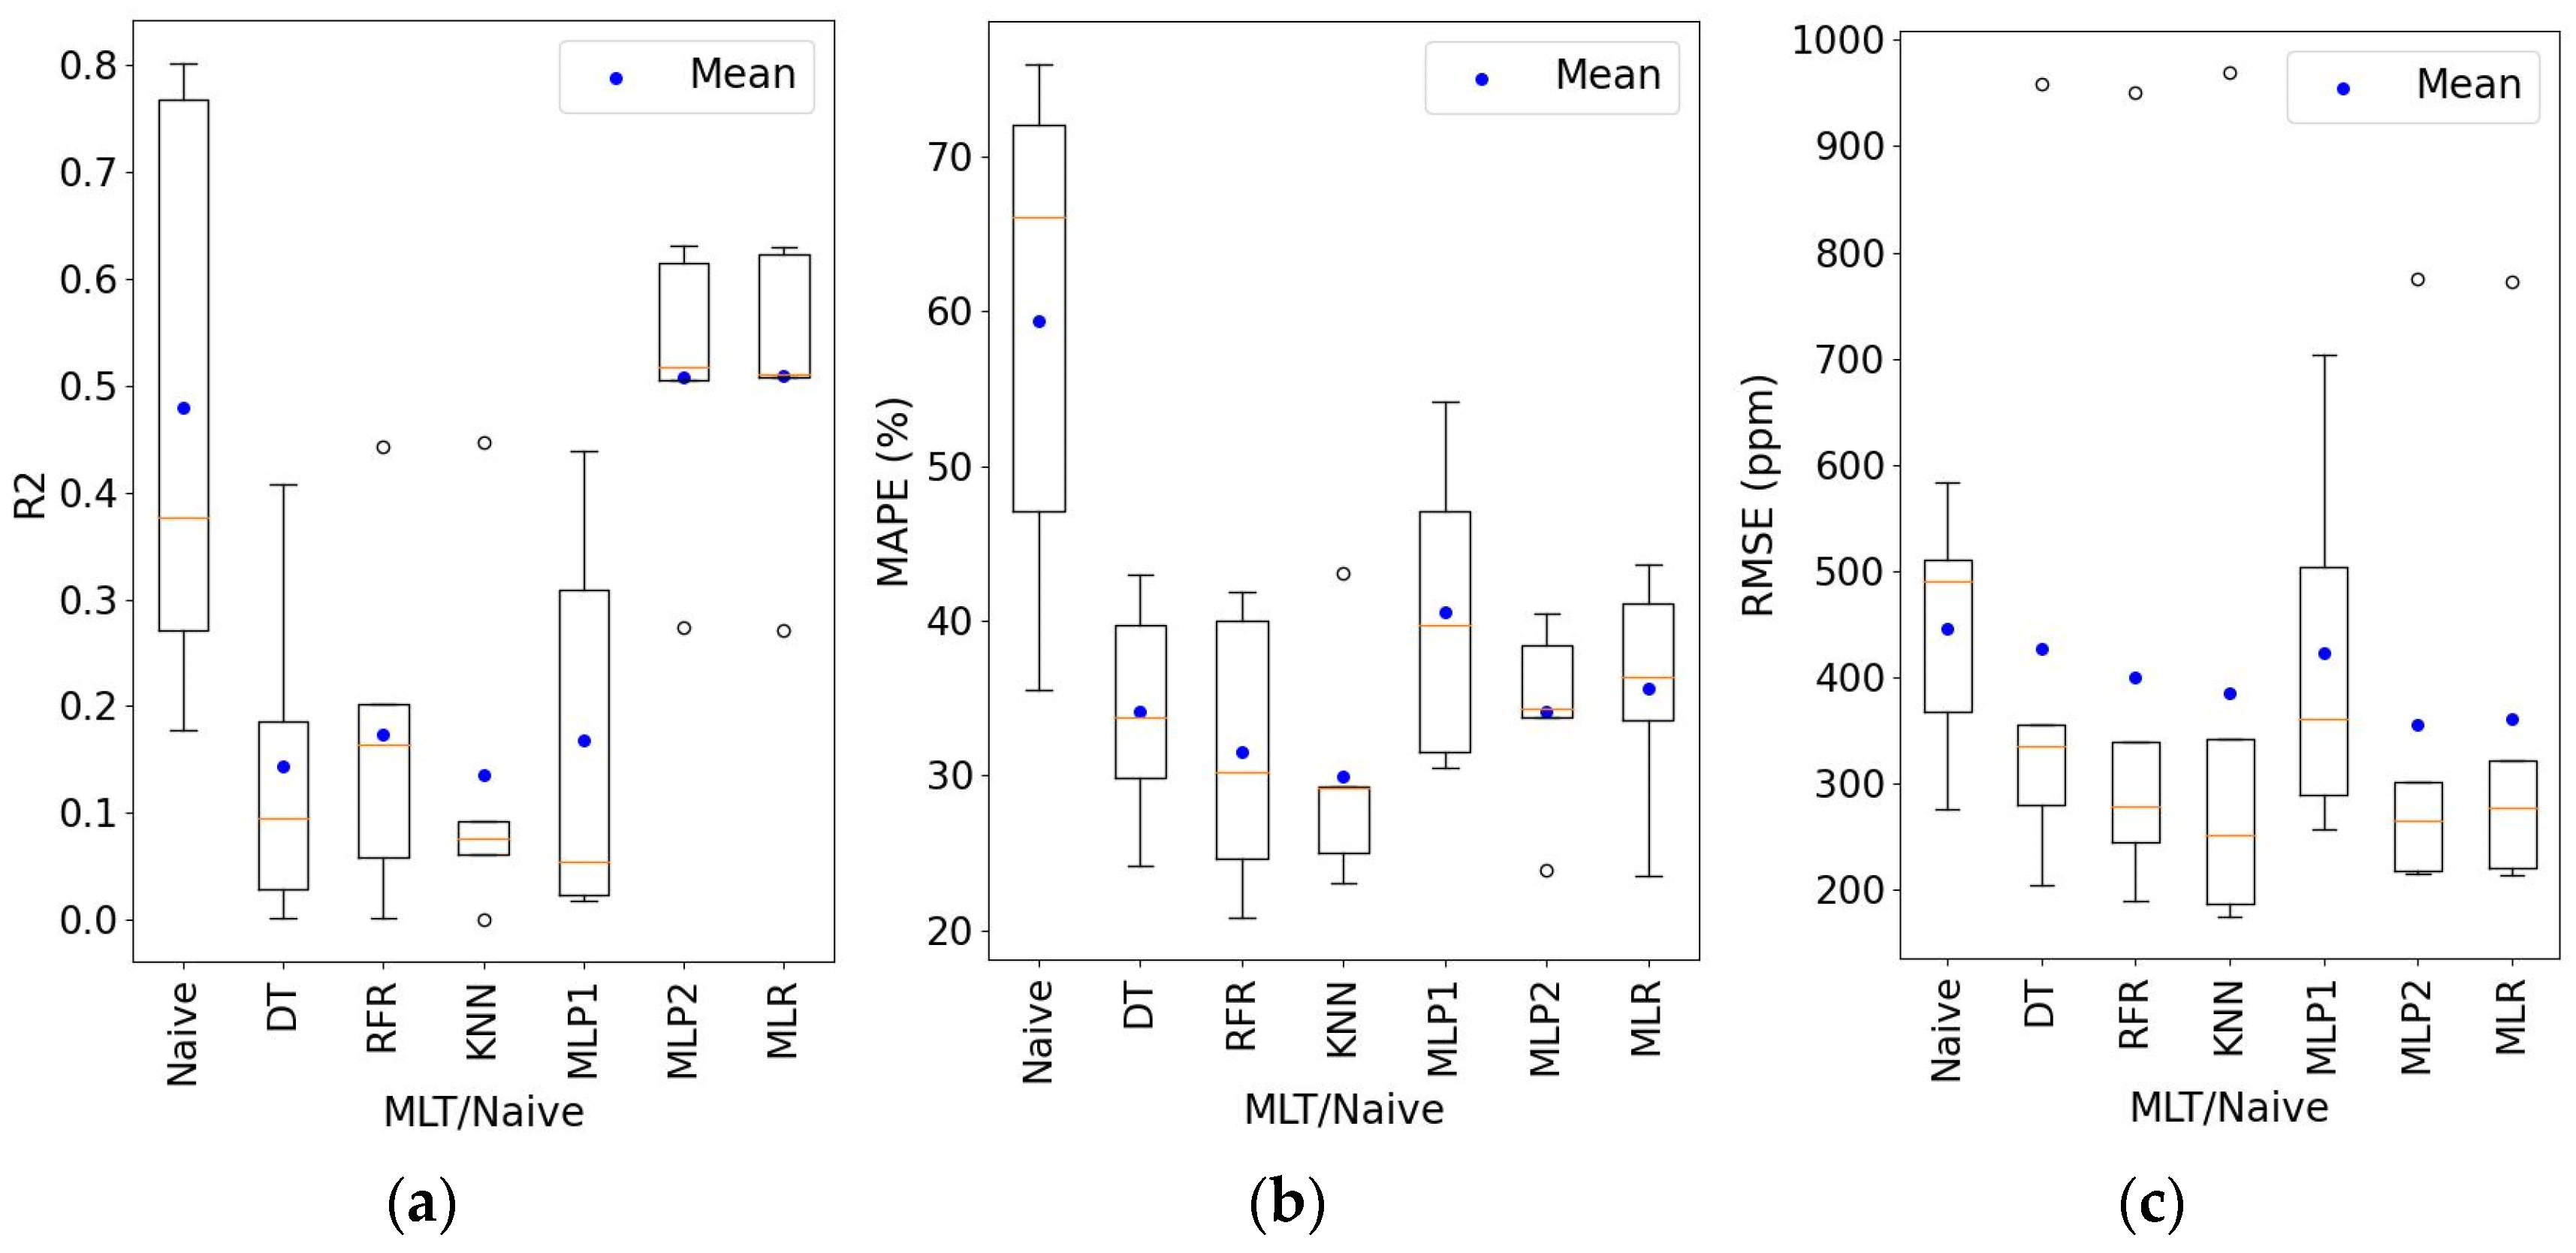
4.4. CO2 Concentration Prediction
4.5. TVOC Content Prediction (SGP30 Sensor Response)
4.6. TVOC Content Prediction (SGPC3 Sensor Response)
5. Discussion
6. Conclusions
Author Contributions
Funding
Institutional Review Board Statement
Informed Consent Statement
Data Availability Statement
Conflicts of Interest
References
- World Air Quality Report. 2020. Available online: https://www.jagranjosh.com/general-knowledge/world-air-quality-report-2020-all-about-delhi-being-the-most-polluted-capital-of-the-world-1615966983-1 (accessed on 12 May 2024).
- United States Environmental Protection Agency. Introduction to Indoor Air Quality. 2023. Available online: https://www.epa.gov/indoor-air-quality-iaq/introduction-indoor-air-quality (accessed on 12 May 2024).
- Shooshtari, M.; Salehi, A. An electronic nose based on carbon nanotube -titanium dioxide hybrid nanostructures for detection and discrimination of volatile organic compounds. Sens. Actuators B Chem. 2022, 357, 131418. [Google Scholar] [CrossRef]
- Peters, T.; Zheng, C. Evaluating Indoor Air Quality Monitoring Devices for Healthy Homes, Buildings. Buildings 2024, 14, 102. [Google Scholar] [CrossRef]
- Yasin, A.; Delaney, J.; Cheng, C.-T.; Pang, T.Y. The Design and Implementation of an IoT Sensor-Based Indoor Air Quality Monitoring System Using Off-the-Shelf Devices. Appl. Sci. 2022, 12, 9450. [Google Scholar] [CrossRef]
- Tsoulou, I.; He, R.; Senick, J.; Mainelis, G.; Andrews, C.J. Monitoring summertime indoor overheating and pollutant risks and natural ventilation patterns of seniors in public housing. Indoor Built Environ. 2023, 32, 992–1019. [Google Scholar] [CrossRef]
- Liu, J.; Dai, X.; Lia, X.; Jia, S.; Pei, J.; Sun, Y.; Lai, D.; Shen, X.; Sun, H.; Yin, H.; et al. Indoor air quality and occupants’ ventilation habits in China: Seasonal measurement and long-term monitoring. Build. Environ. 2018, 142, 119–129. [Google Scholar] [CrossRef]
- Cheung, P.K.; Jim, C.Y. Indoor air quality in substandard housing in Hong Kong. Sustain. Cities Soc. 2019, 48, 101583. [Google Scholar] [CrossRef]
- Kraus, M.; Senitková, I.J. Particulate Matter Mass Concentration in Residential Prefabricated Buildings Related to Temperature and Moisture, World Multidisciplinary Civil Engineering-Architecture-Urban Planning Symposium—WMCAUS. IOP Conf. Ser. Mater. Sci. Eng. 2017, 245, 042068. [Google Scholar] [CrossRef]
- Tahmasebi, F.; Wang, Y.; Cooper, E.; Shimizuhttps, D.G.; Stamp, S.; Mumovic, D. Window operation behaviour and indoor air quality during lockdown: A monitoring-based simulation-assisted study in London. Build. Serv. Eng. Res. Technol. 2022, 43, 5–21. [Google Scholar] [CrossRef]
- Dimdiņa, I.; Lešinskis, A.; Krūmiņš, Ē.; Šnīdere, L.; Zagorskis, V. Indoor air quality and energy efficiency in multi-apartment buildings before and after renovation: A case study of two buildings in Riga. In Proceedings of the 3rd International Conference Civil Engineering’11 Proceedings IV Engineering of Environmental Energy, Jelgava, Latvia, 12–13 May 2011. [Google Scholar]
- Gupta, R.; Zahir, S. Indoor air quality in social housing flats retrofitted with heat pumps. In Proceedings of the 17th International Conference on Indoor Air Quality and Climate, INDOOR AIR, Kuopio, Finland, 12–16 June 2022. [Google Scholar]
- Stamp, S.; Burman, E.; Shrubsole, C.; Chatzidiakou, L.; Mumovic, D.; Davies, M. Seasonal variations and the influence of ventilation rates on IAQ: A case study of five low-energy London apartments. Indoor Built Environ. 2022, 31, 607–623. [Google Scholar] [CrossRef]
- Guyot, G.; Jardinier, E.; Parsy, F.; Berthin, S.; Hallemans, E.; Roux, E.; Charrier, S.; Legrée, M. Smart Ventilation Performance Durability Assessment: Preliminary Results from a Long-Term Residential Monitoring of Humidity-based Demand-Controlled Ventilation, Indoor Environmental Quality Performance Approaches (IAQ 2022), PT 1. In Proceedings of the 7th venticool Conference, Athens, Greece, 4–6 May 2022. [Google Scholar]
- Kim, H.-H.; Kwak, M.-J.; Kim, K.-J.; Gwak, Y.-K.; Lee, J.-H.; Yang, H.-H. Evaluation of IAQ Management Using an IoT-Based Indoor Garden. Int. J. Environ. Res. Public Health 2020, 17, 1867. [Google Scholar] [CrossRef]
- Szczurek, A.; Dolega, A.; Maciejewska, M. Profile of occupant activity impact on indoor air—Method of its determination. Energy Build. 2018, 158, 1564–1575. [Google Scholar] [CrossRef]
- Son, Y.J.; Pope, Z.C.; Pantelic, J. Perceived air quality and satisfaction during implementation of an automated indoor air quality monitoring and control system. Build. Environ. 2023, 243, 110713. [Google Scholar] [CrossRef]
- Sakamoto, H.; Uchiyama, S.; Isobe, T.; Kunugita, N.; Ogura, H.; Nakayama, S.F. Spatial Variations of Indoor Air Chemicals in an Apartment Unit and Personal Exposure of Residents. Int. J. Environ. Res. Public Health 2021, 18, 11511. [Google Scholar] [CrossRef] [PubMed] [PubMed Central]
- Sidhardhan, S.; Das, D. Indoor Carbon dioxide (CO2) level control using Wearable smart watches over a wireless channel. In Proceedings of the International conference on computer communication and informatics (iccci), Coimbatore, India, 27–29 January 2021. [Google Scholar] [CrossRef]
- Gan, D.; Huang, D.; Yang, J.; Zhang, L.; Ou, S.; Feng, Y.; Peng, Y.; Peng, X.; Zhang, Z.; Zou, Y. Assessment of kitchen emissions using a backpropagation neural network model based on urinary hydroxy polycyclic aromatic hydrocarbons. Environ. Pollut. 2020, 265, 114915. [Google Scholar] [CrossRef] [PubMed]
- Liao, C.; Fan, X.; Bivolarova, M.; Laverge, J.; Sekhar, C.; Akimoto, M.; Mainka, A.; Lan, L.; Wargocki, P. A cross-sectional field study of bedroom ventilation and sleep quality in Denmark during the heating season. Build. Environ. 2022, 224, 109557. [Google Scholar] [CrossRef]
- Sanyal, S.; Amrani, F.; Dallongeville, A.; Banerjee, S.; Blanchard, O.; Deguen, S.; Costet, N.; Zmirou-Navier, D.; Annesi-Maesano, I. Estimating indoor galaxolide concentrations using predictive models based on objective assessments and data about dwelling characteristics. Inhal. Toxicol. 2017, 29, 611–619. [Google Scholar] [CrossRef] [PubMed]
- Mohri, A.T.M.; Rostamizadeh, A. Foundation of Machine Learning; MIT Pr.: Cambridge, UK, 2012; ISBN 78026203940. [Google Scholar] [CrossRef]
- Braniš, M.; Šafránek, J. Characterization of coarse particulate matter in school gyms. Environ. Res. 2011, 111, 485–491. [Google Scholar] [CrossRef] [PubMed]
- Elbayoumi, M.; Ramli, N.A.; Yusof, N.F.F.M. Development and comparison of regression models and feedforward backpropagation neural network models to predict seasonal indoor PM2.5–10 and PM2.5 concentrations in naturally ventilated schools. Atmos. Pollut. Res. 2015, 6, 1013–1023. [Google Scholar] [CrossRef]
- Elbayoumi, M. Multivariate methods for indoor PM10 and PM2.5 modelling in naturally ventilated schools buildings. Atmos. Environ. 2014, 94, 11–21. [Google Scholar] [CrossRef]
- Sarkhosh, M.; Najafpoor, A.A.; Alidadi, H.; Shamsara, J.; Amiri, H.; Andrea, T.; Kariminejad, F. Indoor Air Quality associations with sick building syndrome: An application of decision tree technology. Build. Environ. 2021, 188, 107446. [Google Scholar] [CrossRef]
- Yuchi, W. Modelling Fine Particulate Matter Concentrations Inside the Homes of Pregnant Women in Ulaanbaatar, Mongolia. Master’s Thesis, Simon Fraser University, Burnaby, BC, Canada, 2017. [Google Scholar]
- Yuchi, W.; Gombojav, E.; Boldbaatar, B.; Galsuren, J.; Enkhmaa, S.; Beejin, B.; Naidan, G.; Ochir, C.; Legtseg, B.; Byambaa, T.; et al. Evaluation of random forest regression and multiple linear regression for predicting indoor fine particulate matter concentrations in a highly polluted city. Environ. Pollut. 2019, 245, 746–753. [Google Scholar] [CrossRef] [PubMed]
- Song, G.; Ai, Z.; Zhang, G.; Peng, Y.; Wang, W.; Yan, Y. Using machine learning algorithms to multidimensional analysis of subjective thermal comfort in a library. Build. Environ. 2022, 212, 108790. [Google Scholar] [CrossRef]
- Park, H.; Park, D.Y. Comparative analysis on predictability of natural ventilation rate based on machine learning algorithms. Build. Environ. 2021, 195, 107744. [Google Scholar] [CrossRef]
- Wei, W.; Ramalho, O.; Malingre, L.; Sivanantham, S.; Little, J.C.; Mandin, C. Machine learning and statistical models for predicting indoor air quality. Indoor Air 2019, 29, 704–726. [Google Scholar] [CrossRef] [PubMed]
- Khazaei, B.; Shiehbeigi, A.; Kani, A.R.H.M.A. Modeling indoor air carbon dioxide concentration using artificial neural network. Int. J. Environ. Sci. Technol. 2019, 16, 729–736. Available online: https://api.semanticscholar.org/CorpusID:103868478 (accessed on 12 May 2024). [CrossRef]
- Maciejewska, M.; Azizah, A.; Szczurek, A. Co-Dependency of IAQ in Functionally Different Zones of Open-Kitchen Restaurants Based on Sensor Measurements Explored via Mutual Information Analysis. Sensors 2023, 23, 7630. [Google Scholar] [CrossRef] [PubMed]
- Czajkowski, M.; Jurczuk, K.; Kretowski, M. Steering the interpretability of decision trees using lasso regression—An evolutionary perspective. Inf. Sci. 2023, 638, 118944. [Google Scholar] [CrossRef]
- Czajkowski, M.; Kretowski, M. The role of decision tree representation in regression problems—An evolutionary perspective. Appl. Soft Comput. 2016, 48, 458–475. [Google Scholar] [CrossRef]
- Breiman, L. Classification and Regression Trees, 1st ed.; Routledge: New York, NY, USA, 2017. [Google Scholar] [CrossRef]
- Breiman, L. Random Forests. Mach. Learn. 2001, 45, 5–32. [Google Scholar] [CrossRef]
- Borup, D.; Christensen, B.J.; Mühlbach, N.S.; Nielsen, M.S. Targeting predictors in random forest regression. Int. J. Forecast. 2023, 39, 841–868. [Google Scholar] [CrossRef]
- Athey, S.; Tibshirani, J.; Wager, S. Generalized random forests. Ann. Stat. 2019, 47, 1179–1203. [Google Scholar] [CrossRef]
- Biau, G.; Scornet, E. A random forest guided tour. Test 2016, 25, 197–227. [Google Scholar] [CrossRef]
- Goyal, R.; Chandra, P.; Singh, Y. Suitability of KNN Regression in the Development of Interaction based Software Fault Prediction Models. IERI Procedia 2014, 6, 15–21. [Google Scholar] [CrossRef]
- Kudraszow, N.L.; Vieu, P. Uniform consistency of kNN regressors for functional variables. Stat. Probab. Lett. 2013, 83, 1863–1870. [Google Scholar] [CrossRef]
- Nader, Y.; Sixt, L.; Landgraf, T. DNNR: Differential Nearest Neighbors Regression. Proc. Mach. Learn. Res. 2022, 162, 16296–16317. [Google Scholar]
- Kramer, O. K-Nearest Neighbors. In Dimensionality Reduction with Unsupervised Nearest Neighbors; Springer: Berlin/Heidelberg, Germany, 2013; pp. 13–23. [Google Scholar] [CrossRef]
- Alexopoulos, E.C. Introduction to Multivariate Regression Analysis. Hippokratia 2010, 14, 23–28. Available online: https://www.ncbi.nlm.nih.gov/pmc/articles/PMC3049417/pdf/hippokratia-14-23.pdf (accessed on 12 May 2024).
- del Águila, M.M.R.; Benítez-Parejo, N. Simple linear and multivariate regression models. Allergol. Immunopathol. 2011, 39, 159–173. [Google Scholar] [CrossRef]
- Taheri, S.; Razban, A. Learning-based CO2 concentration prediction: Application to indoor air quality control using demand-controlled ventilation. Build. Environ. 2021, 205, 108164. [Google Scholar] [CrossRef]
- Plevris, V.; Solorzano, G.; Bakas, N.P.; Seghier, M.E.A.B. Investigation of Performance Metrics in Regression Analysis and Machine Learning-Based Prediction Models. In Proceedings of the ECCOMAS Congress 2022, 8th European Congress on Computational Methods in Applied Sciences and Engineering, Oslo, Norway, 5–9 June 2022. [Google Scholar] [CrossRef]
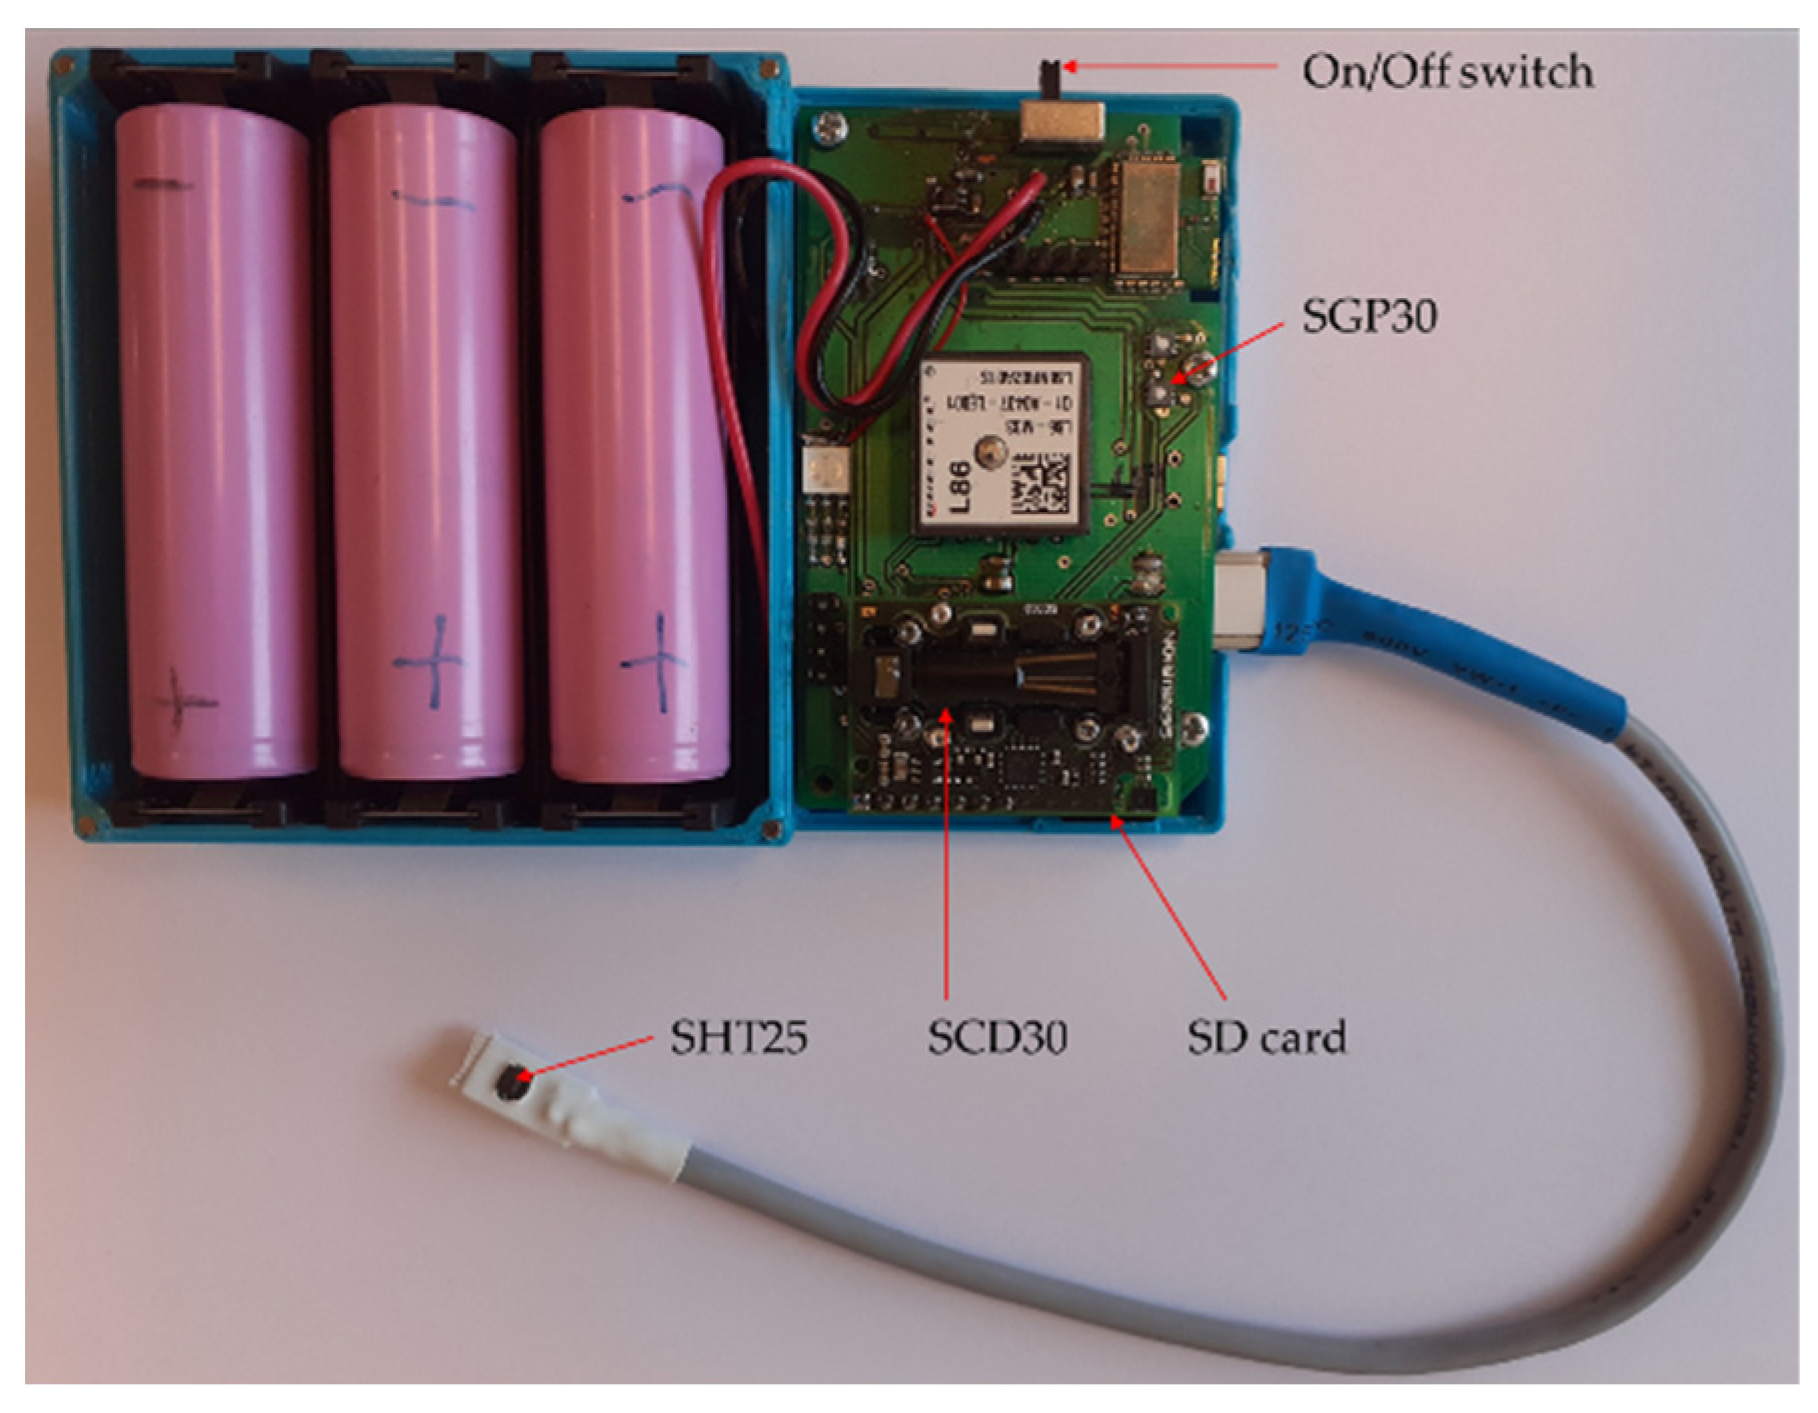



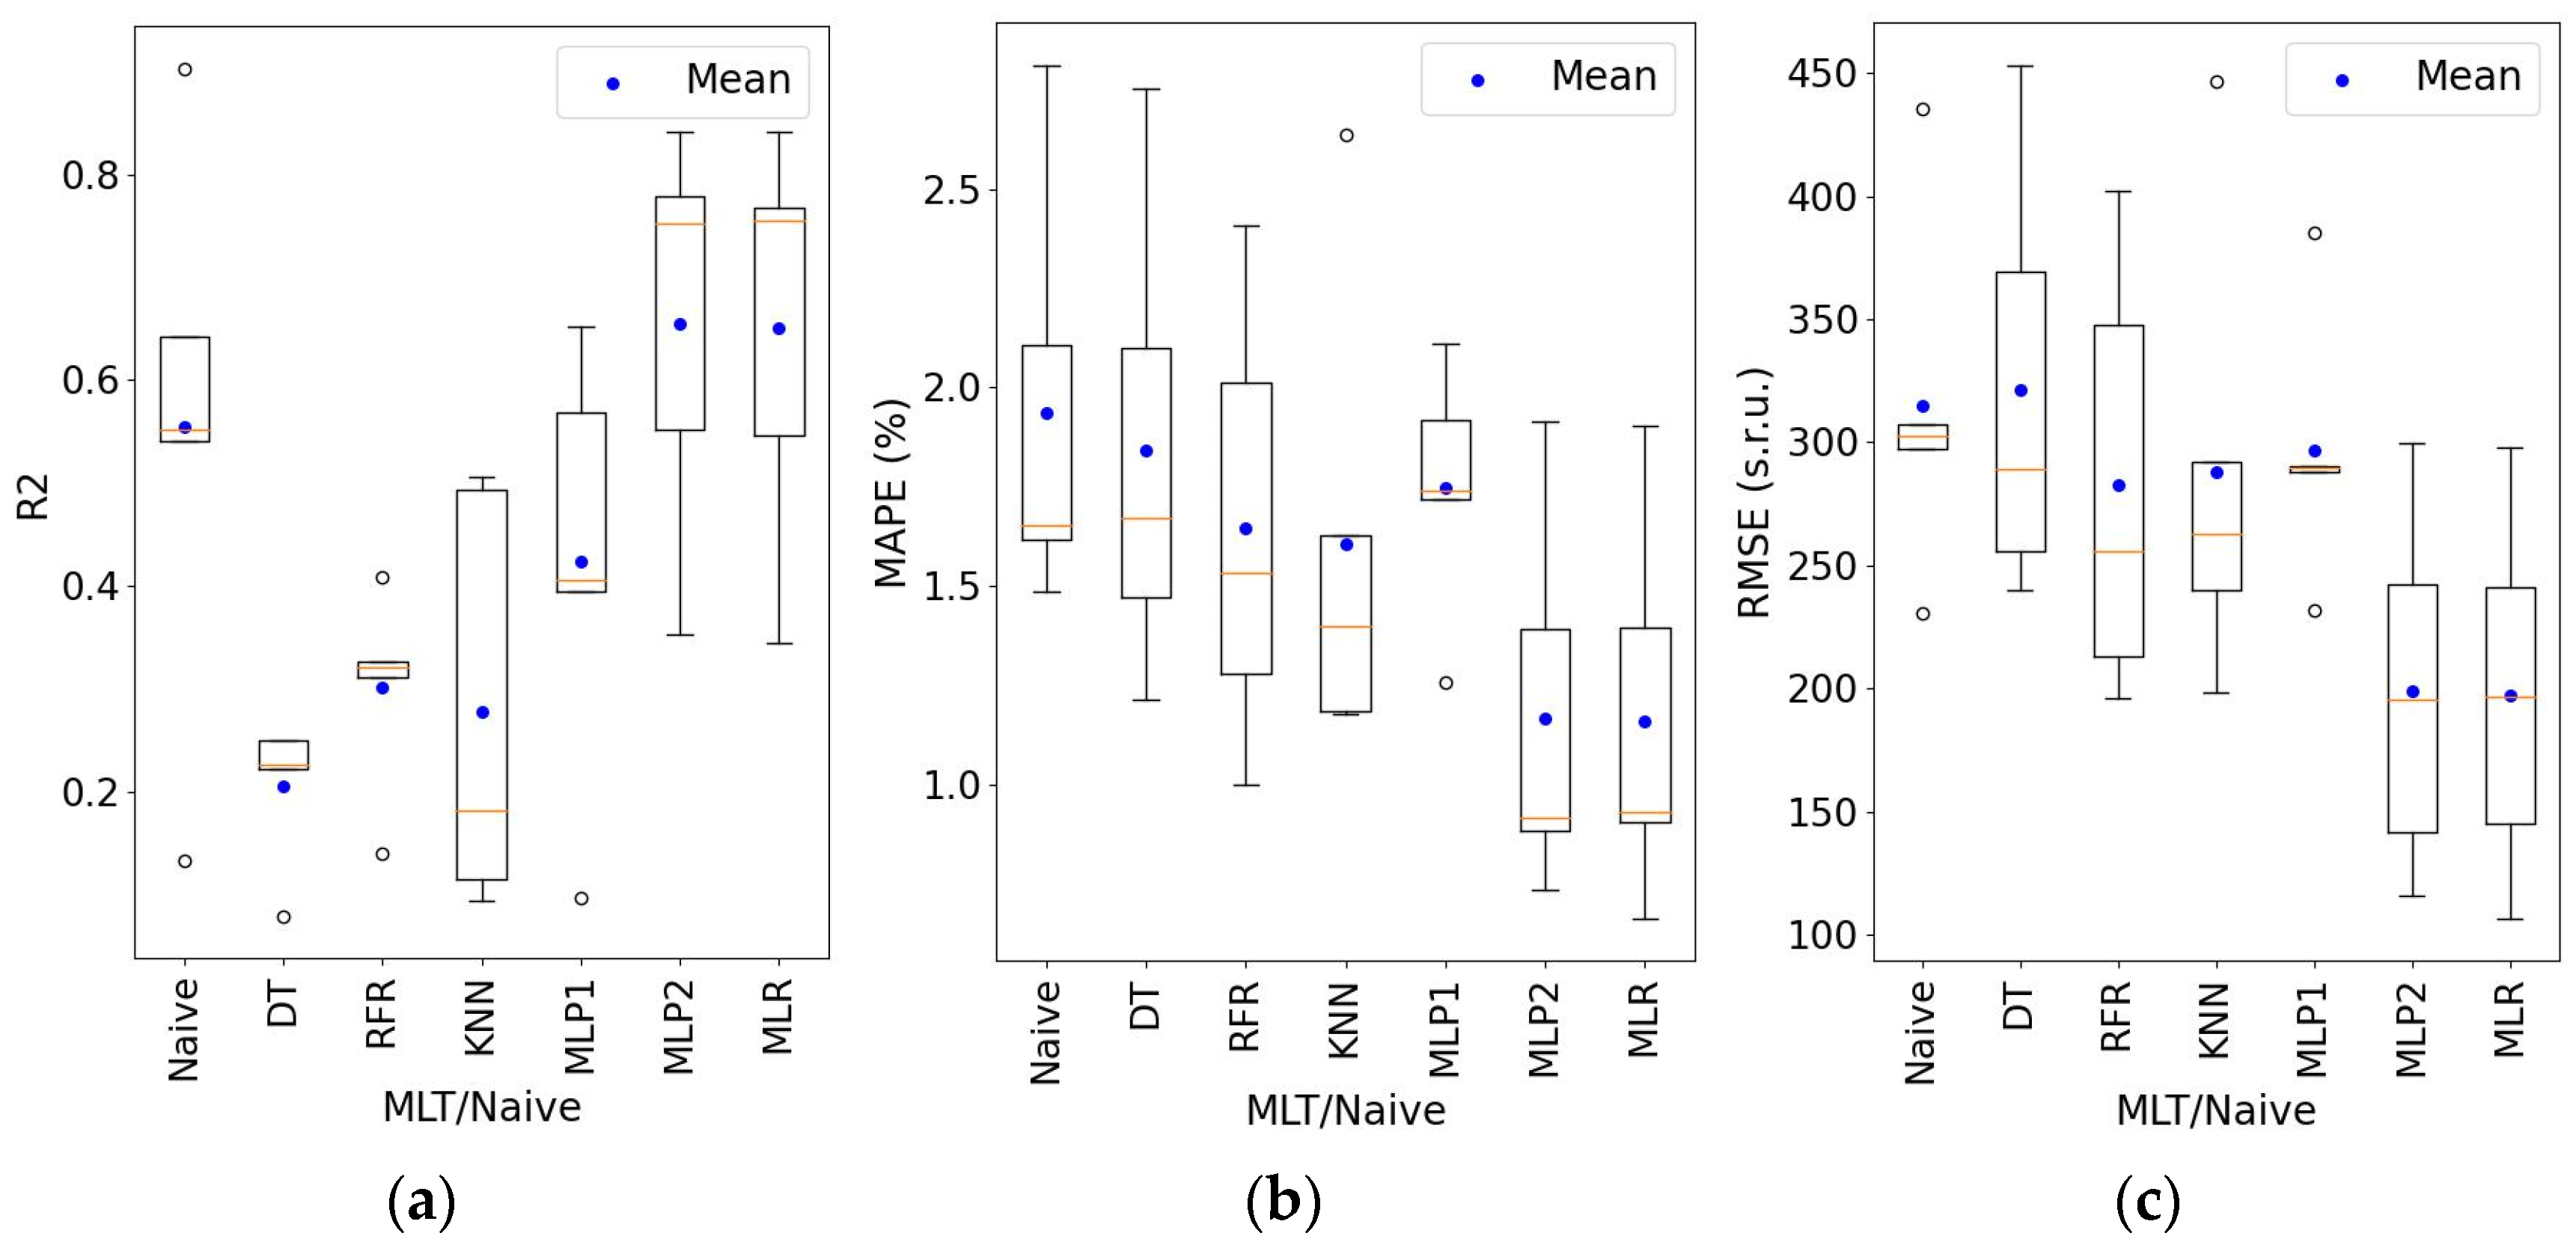
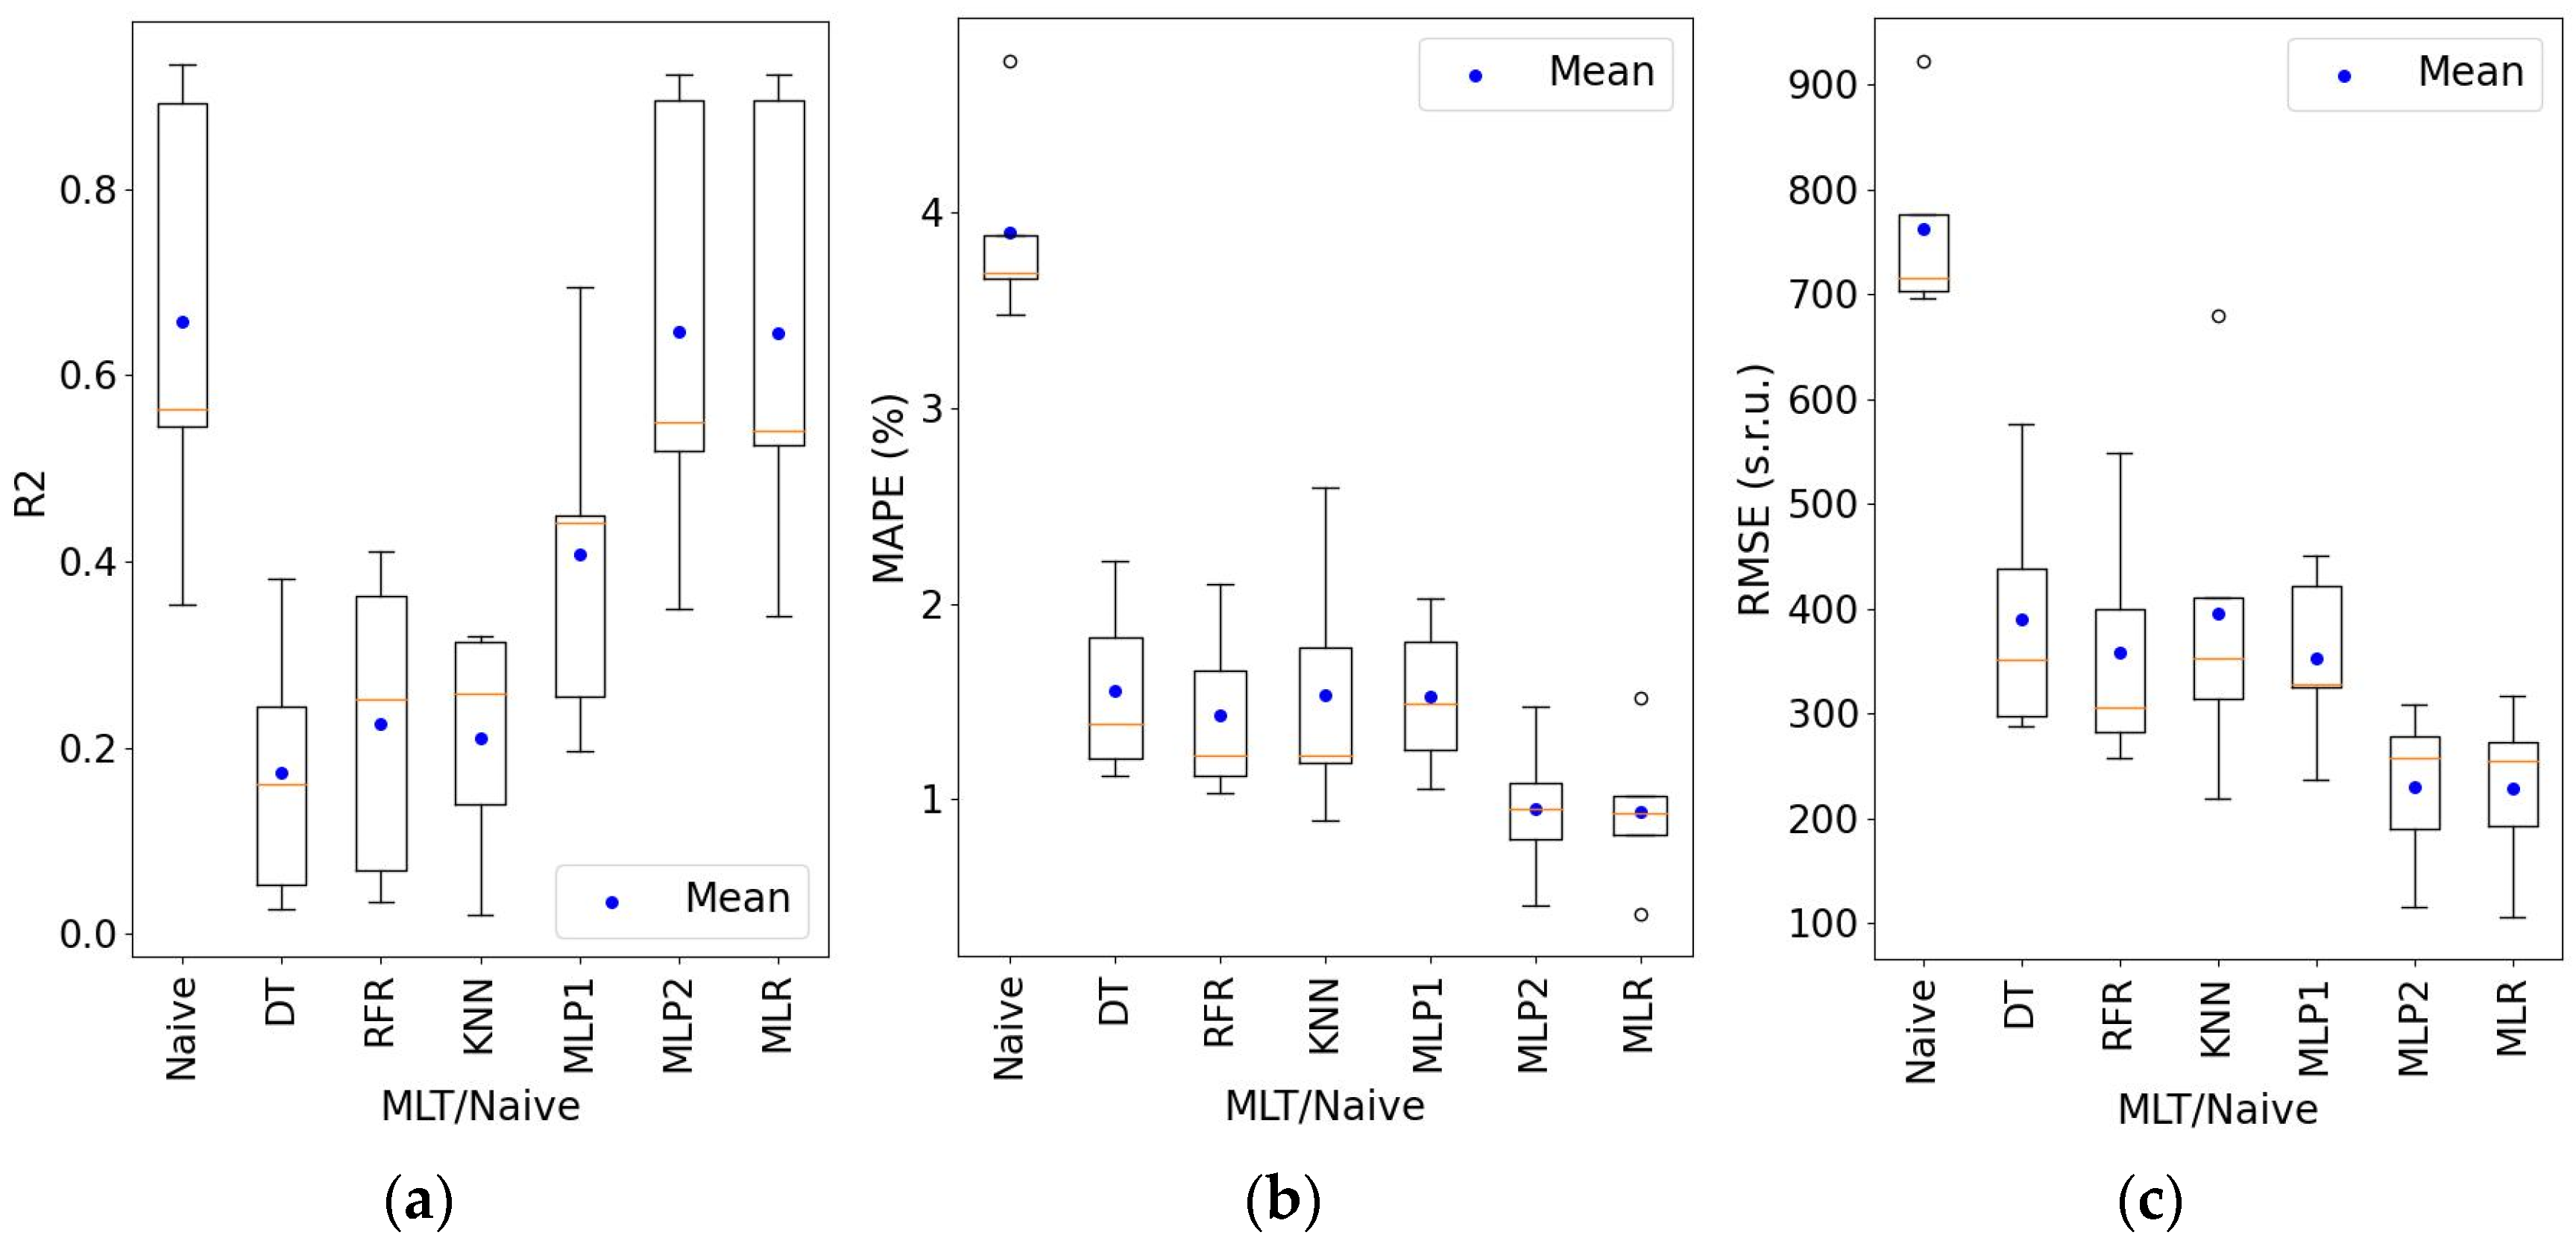
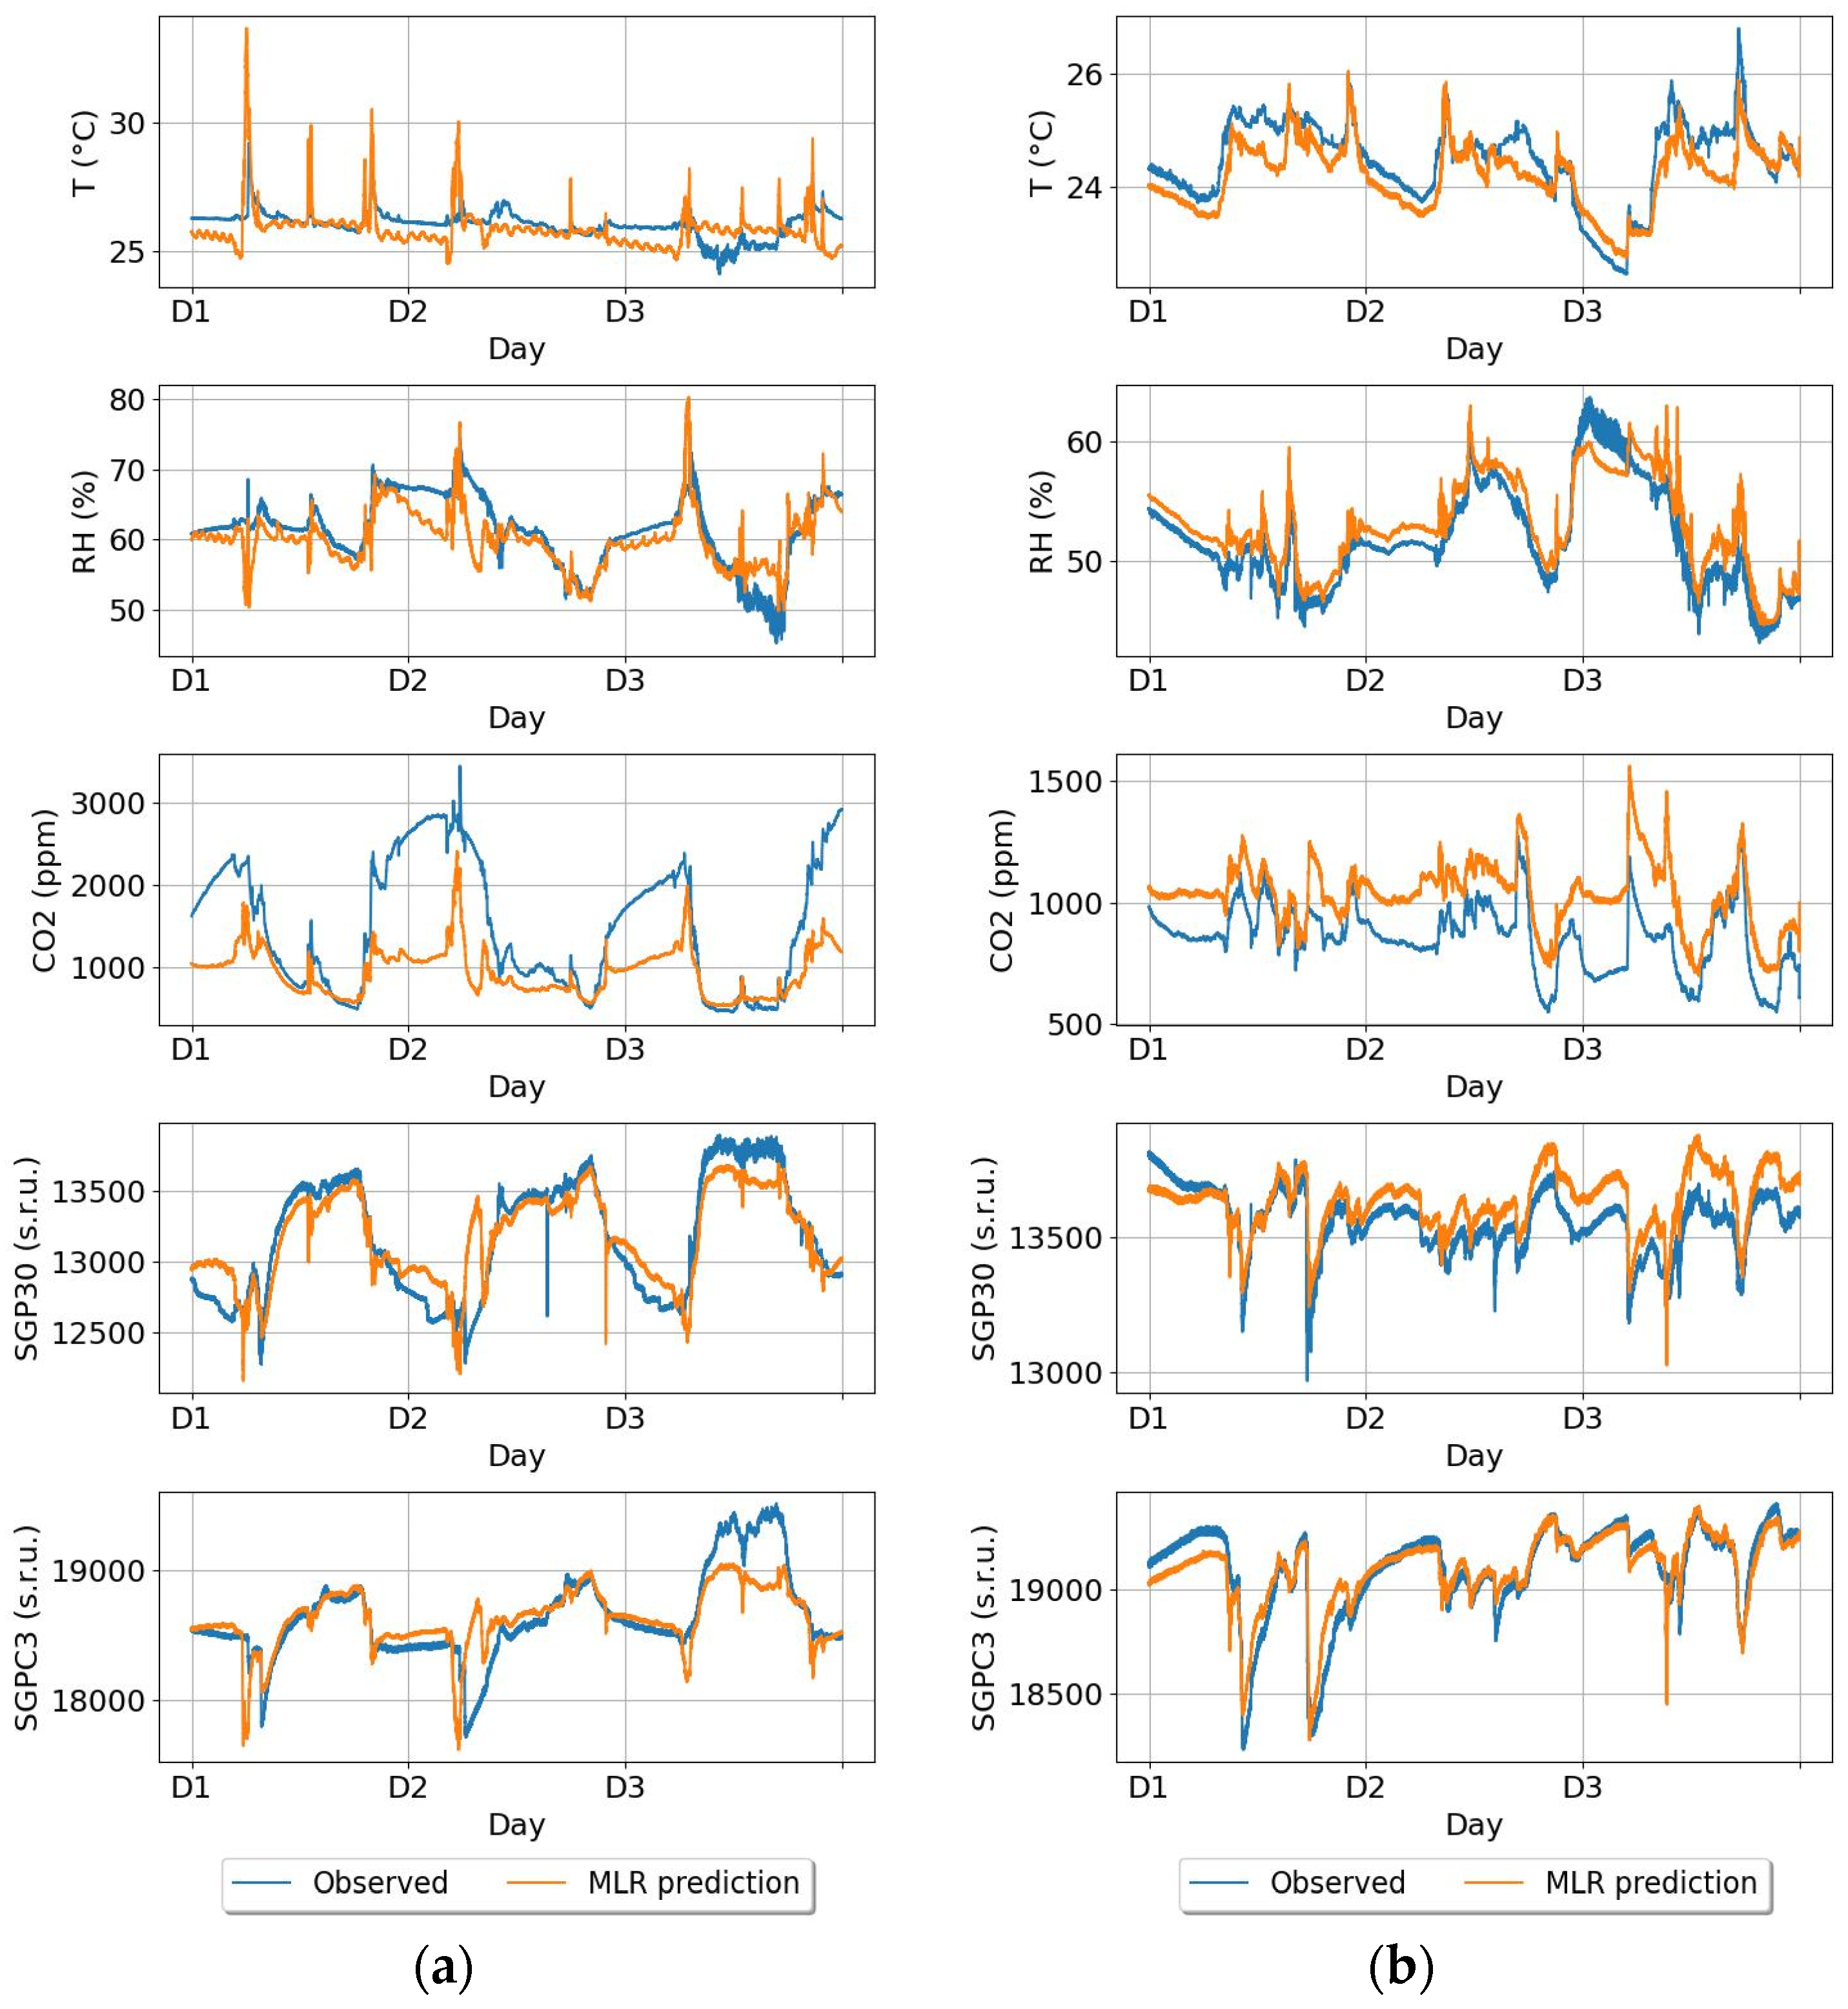

| Sensor | Measured Parameter | Detection Principle | Measurement Range | Accuracy | Resolution | Repeatability | Long-Term Drift |
|---|---|---|---|---|---|---|---|
| SHT 25 | T | Bandgap temperature sensor | −40 to 125 °C | Typ. ±0.2 °C | 0.04 °C | ±0.1 °C | <0.02 °C/yr |
| RH | Capacity-type humidity sensor | 0 to 95% RH | ±1.8%RH | 0.04%RH | ±0.1%RH | <0.25%RH/yr | |
| SCD30 | CO2 | Non-dispersive infrared (NDIR) | 0–5000 ppm | ±(30 ppm + 3% meas. Value) | - | ±10 ppm | ±50 ppm |
| SGP30 | TVOCs and CO2eq | Metal oxide gas sensor (chemical resistor) | 0.3–30 ppm ethanol 0–1000 ppm ethanol | Typ. 15% of meas. value | Typ. 0.2% of meas. value | - | Typ. 1.3% of meas. value |
| SGPC3 | TVOCs | Metal oxide gas sensor (chemical resistor) | 0.3–30 ppm ethanol 0–1000 ppm ethanol | Typ. 15% of meas. value | Typ. 0.2% of meas. value | - | Typ. 1.3% of meas. value |
| Feature | Apartment 1 | Apartment 2 | Apartment 3 | Apartment 4 | Apartment 5 |
|---|---|---|---|---|---|
| Flat size | 56 m2 | 35 m2 | 64 m2 | 27 m2 | 22.75 m2 |
| Type of the kitchen | Open kitchen | Open kitchen | Closed kitchen | Open kitchen | Closed kitchen |
| Kitchen size | 7 m × 5.5 m | 3.5 m × 2 m | 3 m × 2 m | 4 m × 4 m | 1.5 m × 3 m |
| Living room size | 3.5 m × 3 m | 2 m × 2.5 m | 2.5 m × 3.5 m | ||
| Floor cover | Kitchen: panels Living room: panels and no carpet | Kitchen: tiles Living room: wood and no carpet | Kitchen: tiles Living room: panels with baby mattress | Kitchen: tiles Living room: tiles and woolen carpet | Kitchen: tiles Living room: panels and no carpet |
| Furniture | Not many items in the room. The furniture is new and made of fabric and wood. | Crowded with old furniture made of wood. | Crowded with old furniture made of wood and fiberboard. | Crowded with new furniture made of fabric and wood. | Crowded with old furniture made of wood and fabric. |
| Door between the kitchen and living room | None | None | Daytime: door opens while cooking. Nighttime: door mostly closed. | None | 60% open 40% close |
| Kitchen window | None | None | None | Opens for 24 h | Opens for 24 h |
| Living room windows | Open for 24 h | Open for 24 h | Open from 6.00 a.m. to 7.00 p.m. | Open from 7.00 a.m. to 8.00 p.m. | Open for 24 h |
| Kitchen exhaust | No exhaust | Passive exhaust | Mechanical exhaust | Hood. | Hood and passive exhaust |
| Cooker | Induction | Gas | Gas | Induction | Gas |
| Cooking intensity | Twice a day (around 11.00 and 20.00) | Twice a day (around 8.00 and 18.00) | 2–3 times a day (around 5.00, 12.00, 18.00) | 1–2 times a day (around 9.00 and 14.00) | Twice a day (around 11.00 and 18.00) |
| Dishwashing | Dishwasher | Manually | Manually | Dishwasher | Manually |
| Location | Residential area | In the garden | In the green area (tress) | Residential area | By the main street |
| Type of building/age | Apartment building/new | Block of flats/old | Block of flats/old | Apartment building/new | Block of flats/old |
| Floor | 5th | 1st | 1st | 1st | 5th |
| Occupants | 2 adults | 2 adults | 2 adults with a baby | 2 adults | 2 adults |
| Additional information | One occupant fully works from home. | Occupants work from home 3 days a week. Smoker in the flat. | One occupant works from home 2 days a week. | Occupants fully work from home. | One occupant fully works from home. |
| MLT/ Naive | R2 | RMSE | MAPE [%] | ||||||||||||
|---|---|---|---|---|---|---|---|---|---|---|---|---|---|---|---|
| T | RH | CO2 | SGP30 | SGPC3 | T [°C] | RH [%] | CO2 [ppm] | SGP30 [s.r.u.] | SGPC3 [s.r.u.] | T | RH | CO2 | SGP30 | SGPC3 | |
| DT | 0.09 | 0.31 | 0.10 | 0.23 | 0.16 | 2.3 | 6.3 | 335 | 289 | 351 | 6.4 | 8.0 | 33.7 | 1.7 | 1.4 |
| RFR | 0.12 | 0.40 | 0.16 | 0.32 | 0.25 | 2.1 | 5.3 | 278 | 256 | 306 | 5.7 | 6.9 | 30.2 | 1.5 | 1.2 |
| KNN | 0.06 | 0.40 | 0.08 | 0.18 | 0.26 | 2.0 | 5.2 | 252 | 263 | 353 | 6.0 | 7.4 | 29.2 | 1.4 | 1.2 |
| MLP1 | 0.43 | 0.58 | 0.05 | 0.41 | 0.44 | 1.6 | 4.6 | 360 | 290 | 328 | 5.3 | 7.2 | 39.7 | 1.7 | 1.5 |
| MLP2 | 0.7 | 0.71 | 0.52 | 0.75 | 0.55 | 0.9 | 3.1 | 265 | 195 | 257 | 2.8 | 4.2 | 34.3 | 0.9 | 1.0 |
| LR | 0.72 | 0.71 | 0.51 | 0.75 | 0.54 | 0.9 | 3.3 | 277 | 197 | 255 | 2.7 | 4.4 | 36.4 | 0.9 | 0.9 |
| Naive | 0.7 | 0.72 | 0.38 | 0.55 | 0.56 | 1.2 | 4.1 | 491 | 303 | 715 | 2.7 | 6.6 | 66.1 | 1.7 | 3.7 |
Disclaimer/Publisher’s Note: The statements, opinions and data contained in all publications are solely those of the individual author(s) and contributor(s) and not of MDPI and/or the editor(s). MDPI and/or the editor(s) disclaim responsibility for any injury to people or property resulting from any ideas, methods, instructions or products referred to in the content. |
© 2024 by the authors. Licensee MDPI, Basel, Switzerland. This article is an open access article distributed under the terms and conditions of the Creative Commons Attribution (CC BY) license (https://creativecommons.org/licenses/by/4.0/).
Share and Cite
Maciejewska, M.; Azizah, A.; Szczurek, A. IAQ Prediction in Apartments Using Machine Learning Techniques and Sensor Data. Appl. Sci. 2024, 14, 4249. https://doi.org/10.3390/app14104249
Maciejewska M, Azizah A, Szczurek A. IAQ Prediction in Apartments Using Machine Learning Techniques and Sensor Data. Applied Sciences. 2024; 14(10):4249. https://doi.org/10.3390/app14104249
Chicago/Turabian StyleMaciejewska, Monika, Andi Azizah, and Andrzej Szczurek. 2024. "IAQ Prediction in Apartments Using Machine Learning Techniques and Sensor Data" Applied Sciences 14, no. 10: 4249. https://doi.org/10.3390/app14104249
APA StyleMaciejewska, M., Azizah, A., & Szczurek, A. (2024). IAQ Prediction in Apartments Using Machine Learning Techniques and Sensor Data. Applied Sciences, 14(10), 4249. https://doi.org/10.3390/app14104249


