
Attention-Oriented CNN Method for Type 2 Diabetes Prediction

 and
and
Abstract
1. Introduction
- We propose a robust T2DM prediction framework to aid the clinical diagnosis of diabetes. In particular, in order to deal with problems such as normality and class imbalance in the dataset, we adopted data-preprocessing methods of outlier replacement and missing value filling. Feature selection is performed, and the most important risk factors are screened out through comprehensive analysis of variance and logistic regression. In addition, we reasonably allocate class weights for class imbalance situations. Through these processing methods, we aim to ensure the quality and consistency of the data and improve the performance and stability of the model.
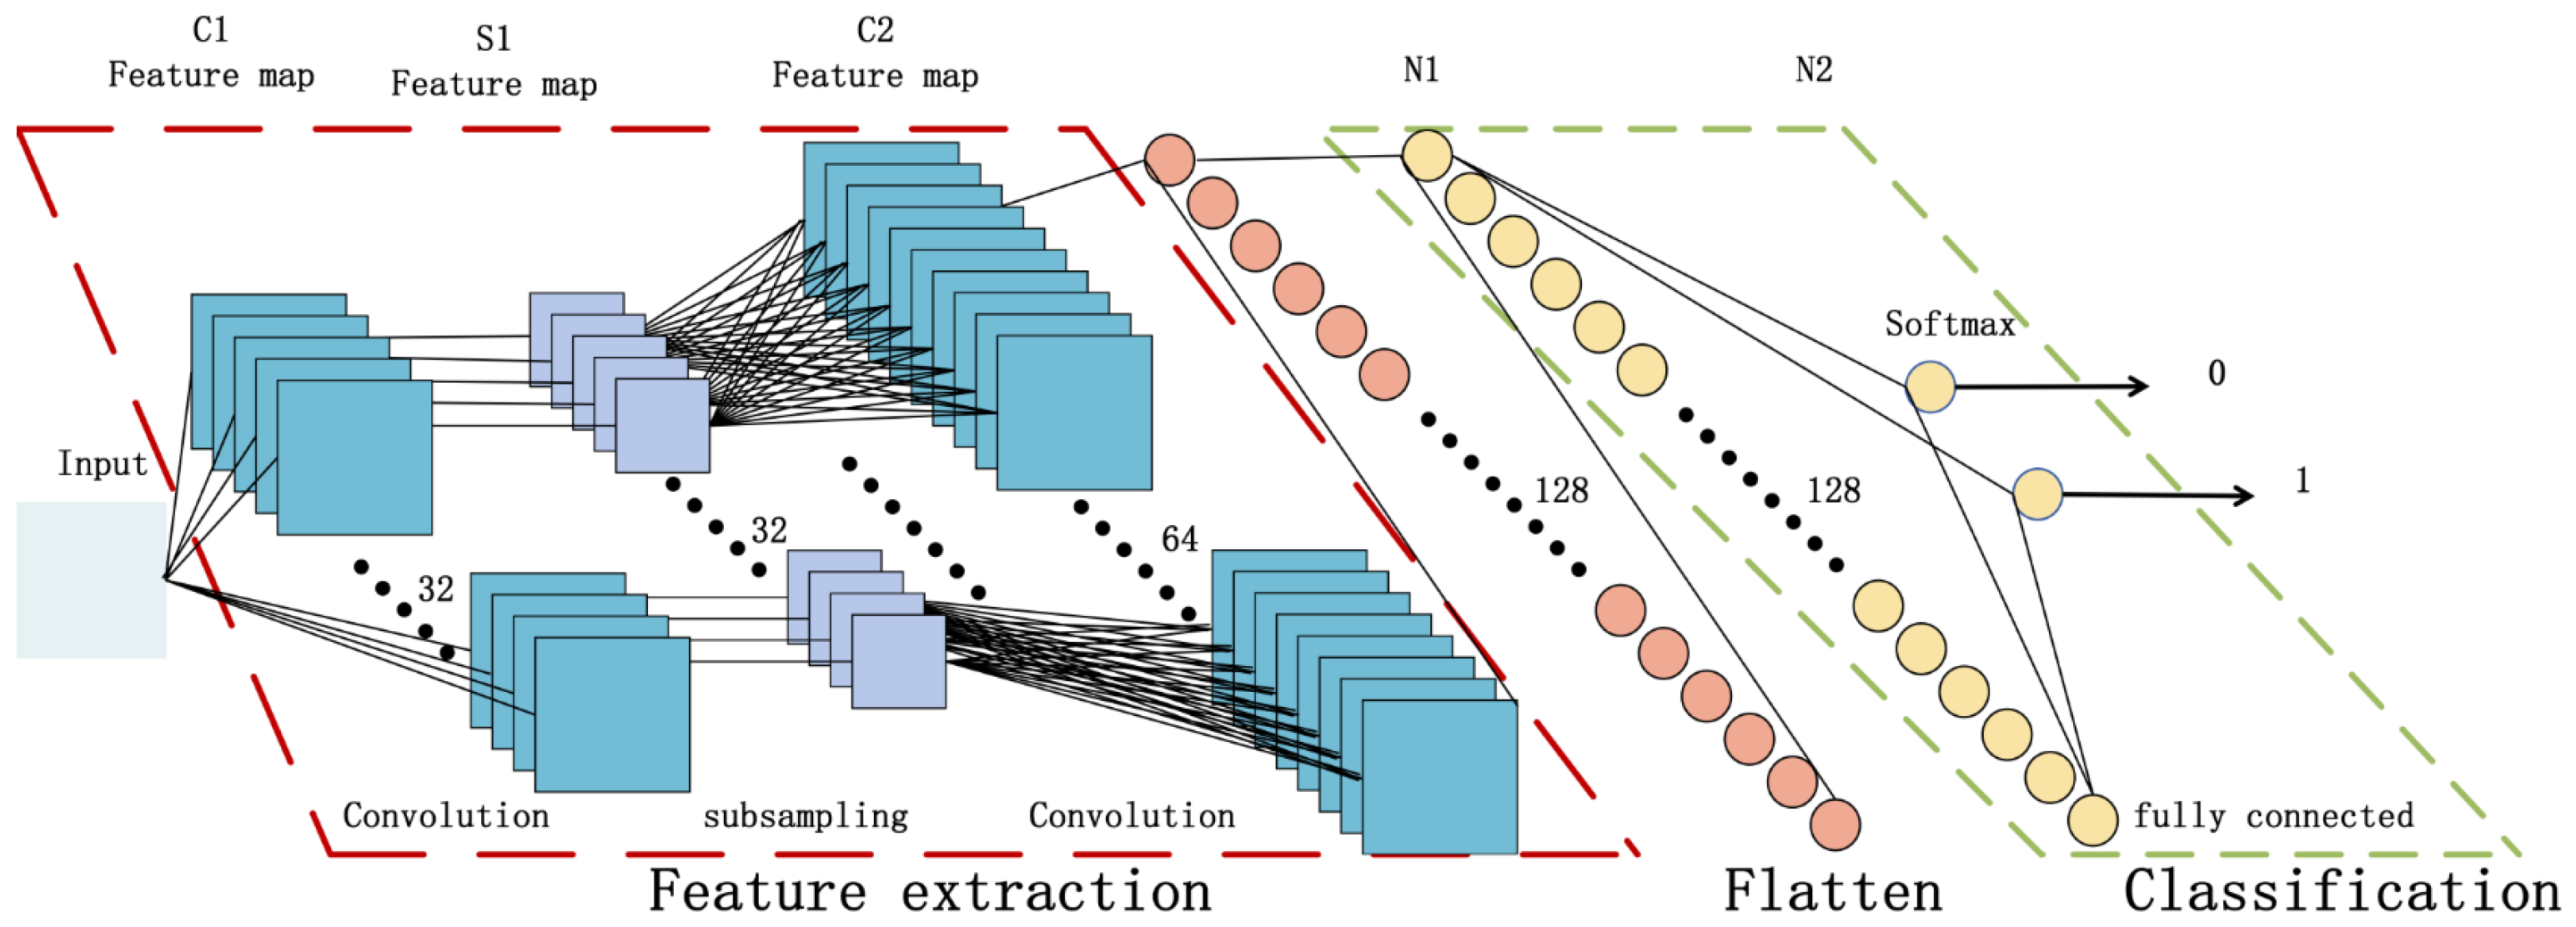
- We design a CNN for diabetes prediction and establish a new attention-oriented convolutional neural network (SECNN) by introducing a channel attention mechanism. By introducing a channel attention layer to adjust the weight of each channel, the network can selectively focus on the most relevant and useful features in the input data, improving the expressive ability and performance of the model. By using the NHANES dataset and the PID dataset for testing, the performance is improved significantly. Compared with CNN, the accuracy is increased by 0.94% and 1.89% respectively, which is better than other methods discussed in this article.
- We use both the PIMA dataset and the NHANES dataset for model evaluation to provide more comprehensive and reliable model performance evaluation results and enhance the model’s generalization ability and application reliability.
2. Related Work
3. Materials and Methods
3.1. Datasets
Dataset Description
3.2. Proposed Framework
3.2.1. Data Preprocessing
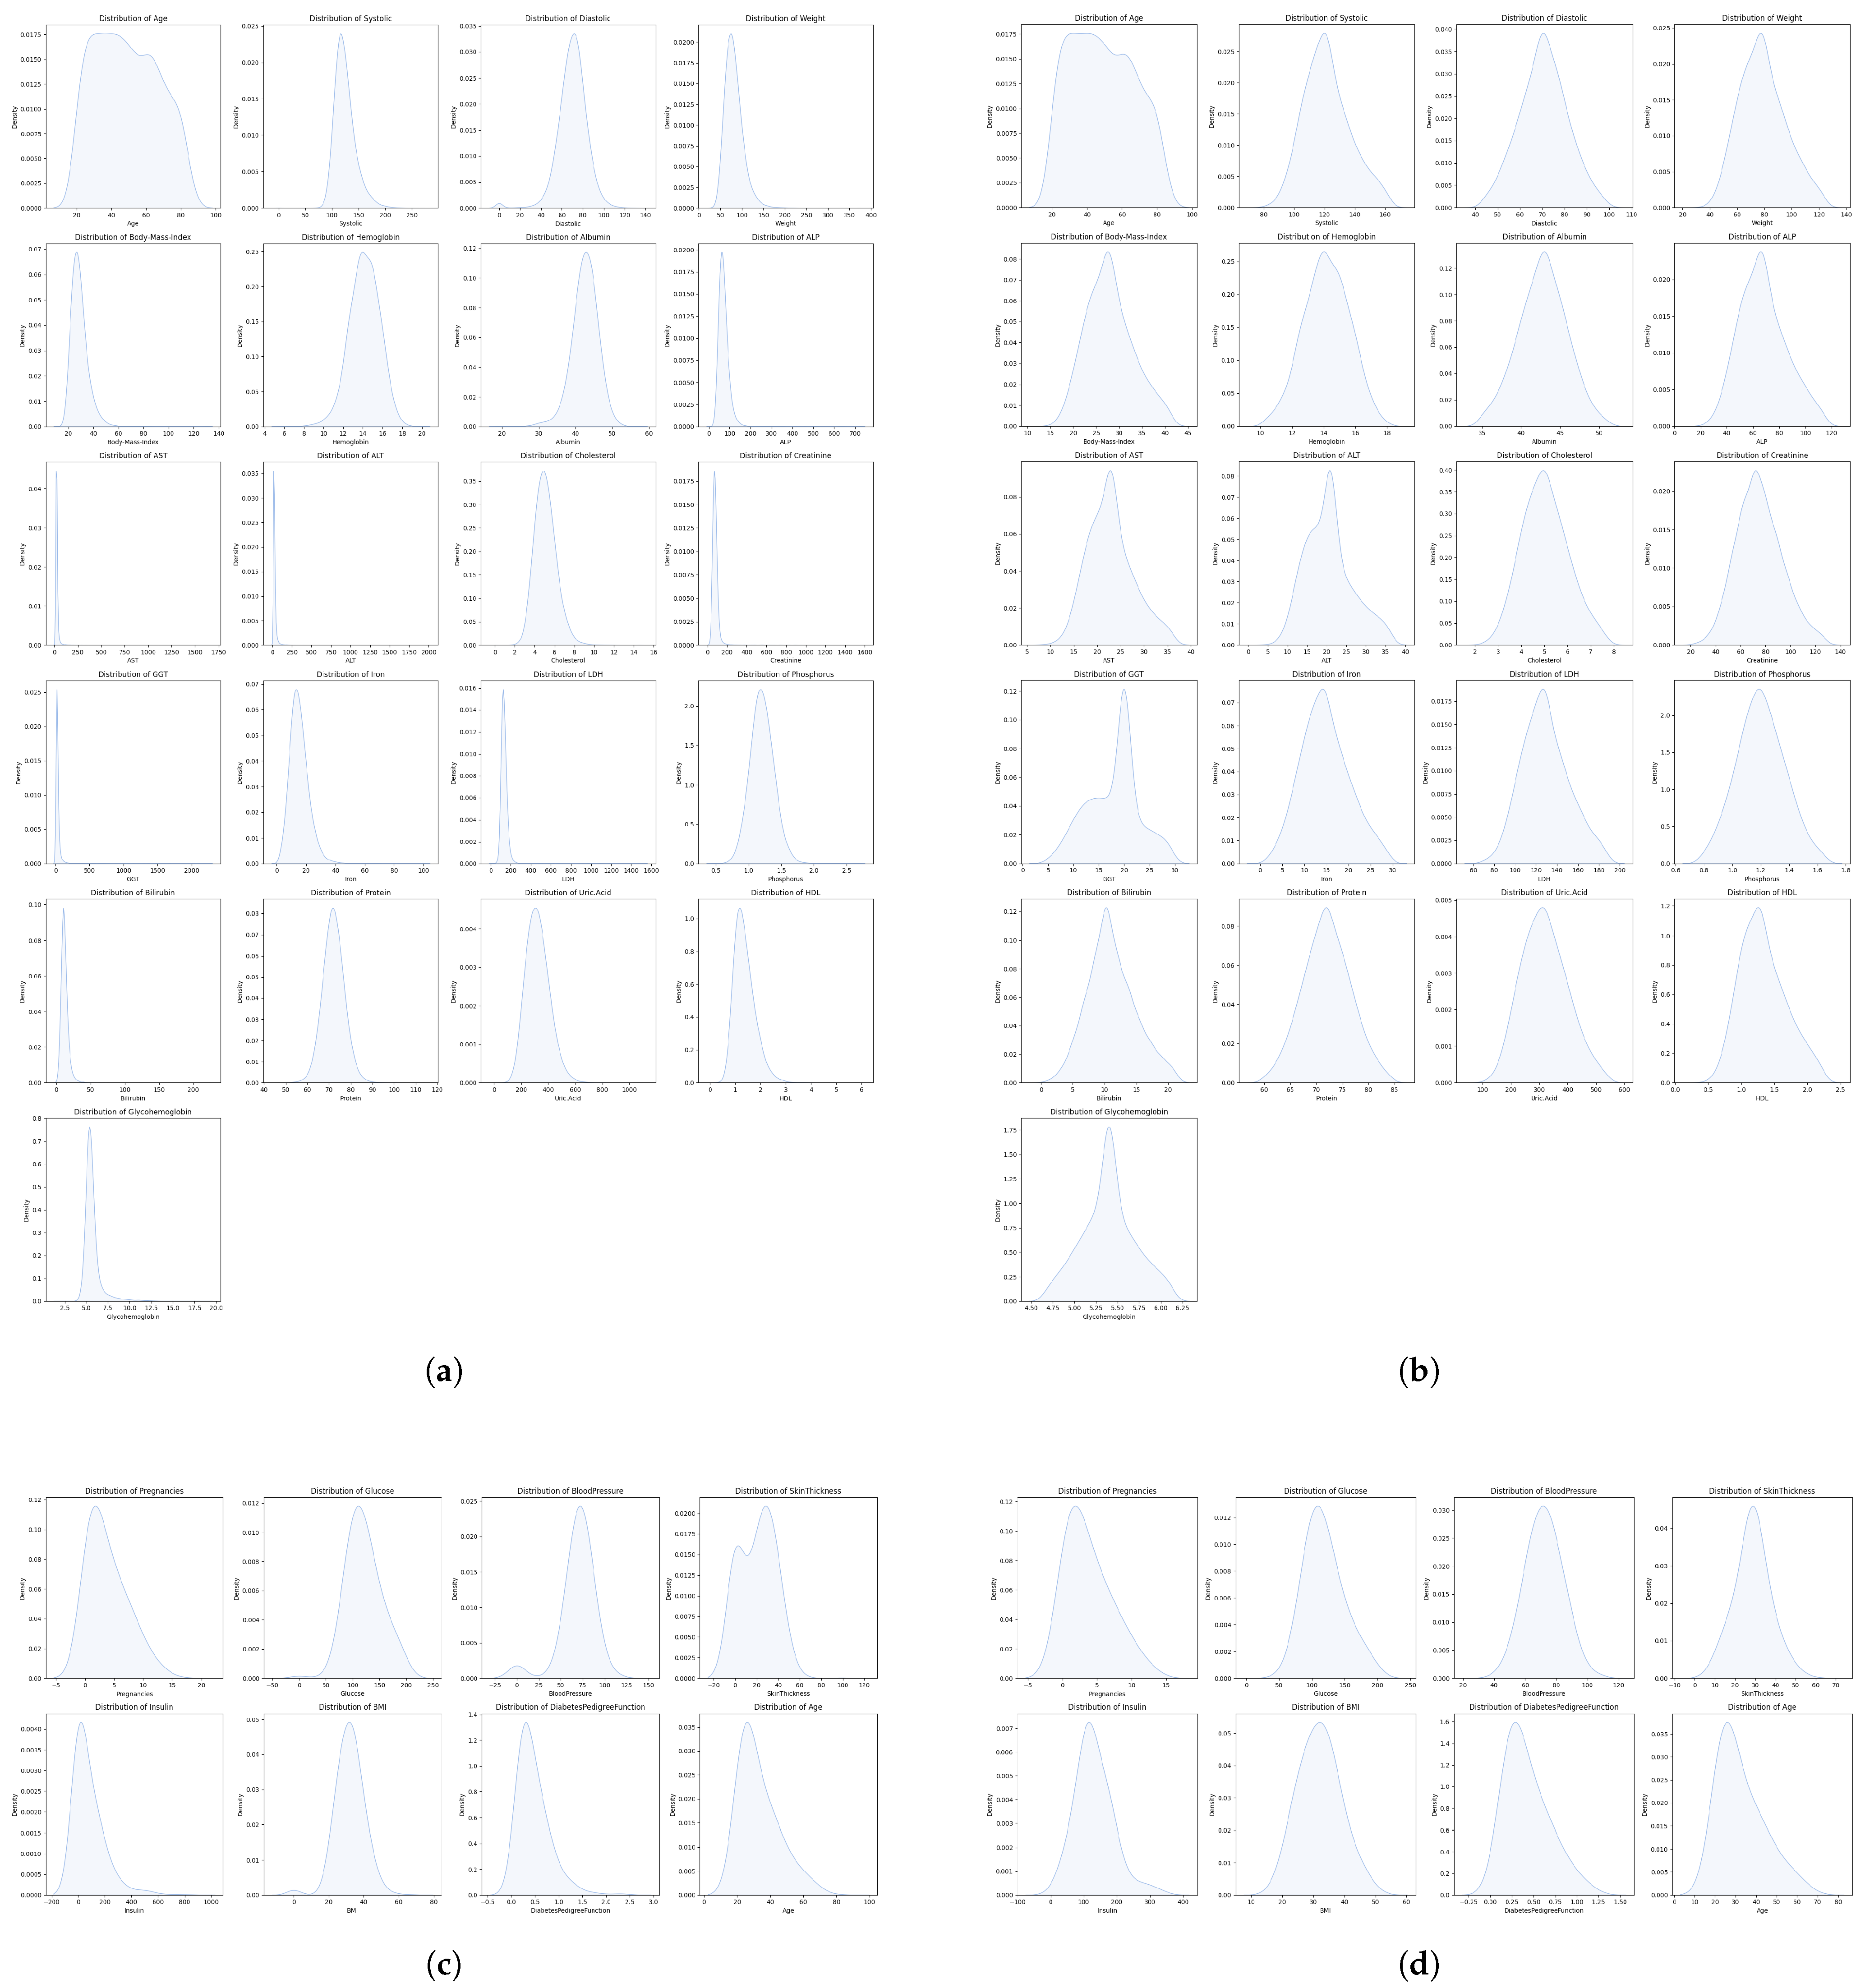
Missing Value Padding
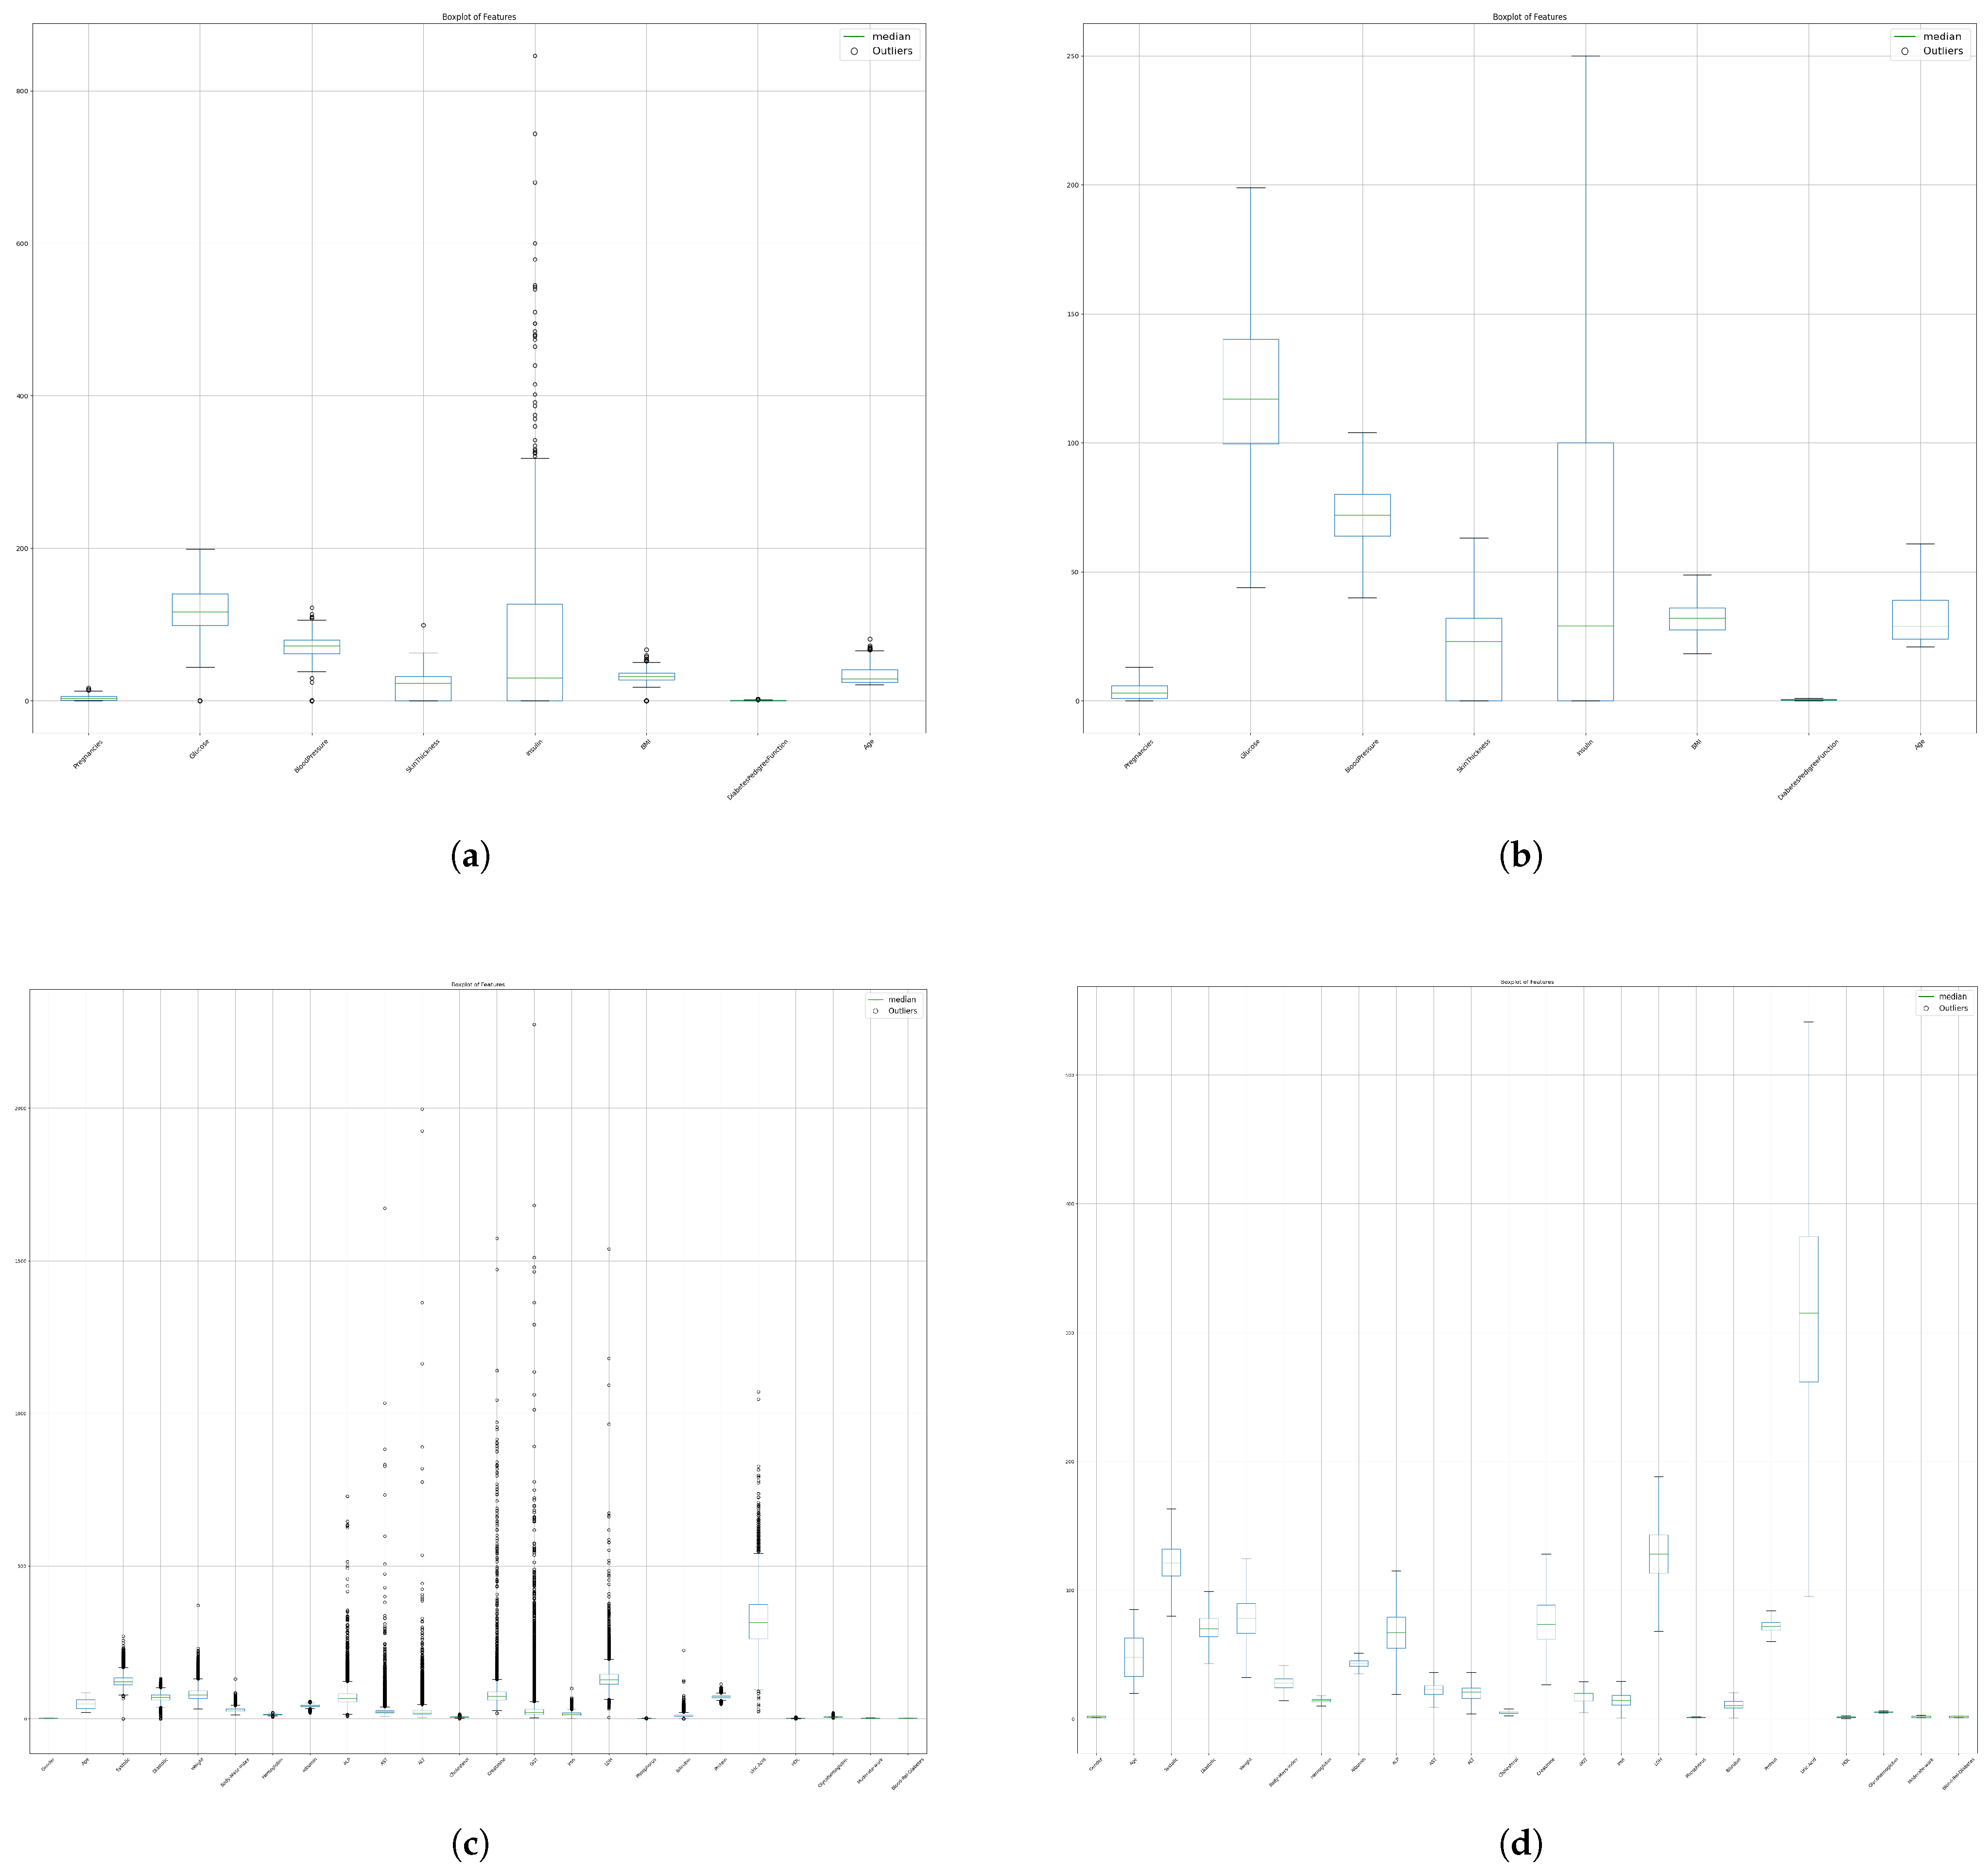
Outlier Imputation
Feature Importance Analysis
Data Standardization
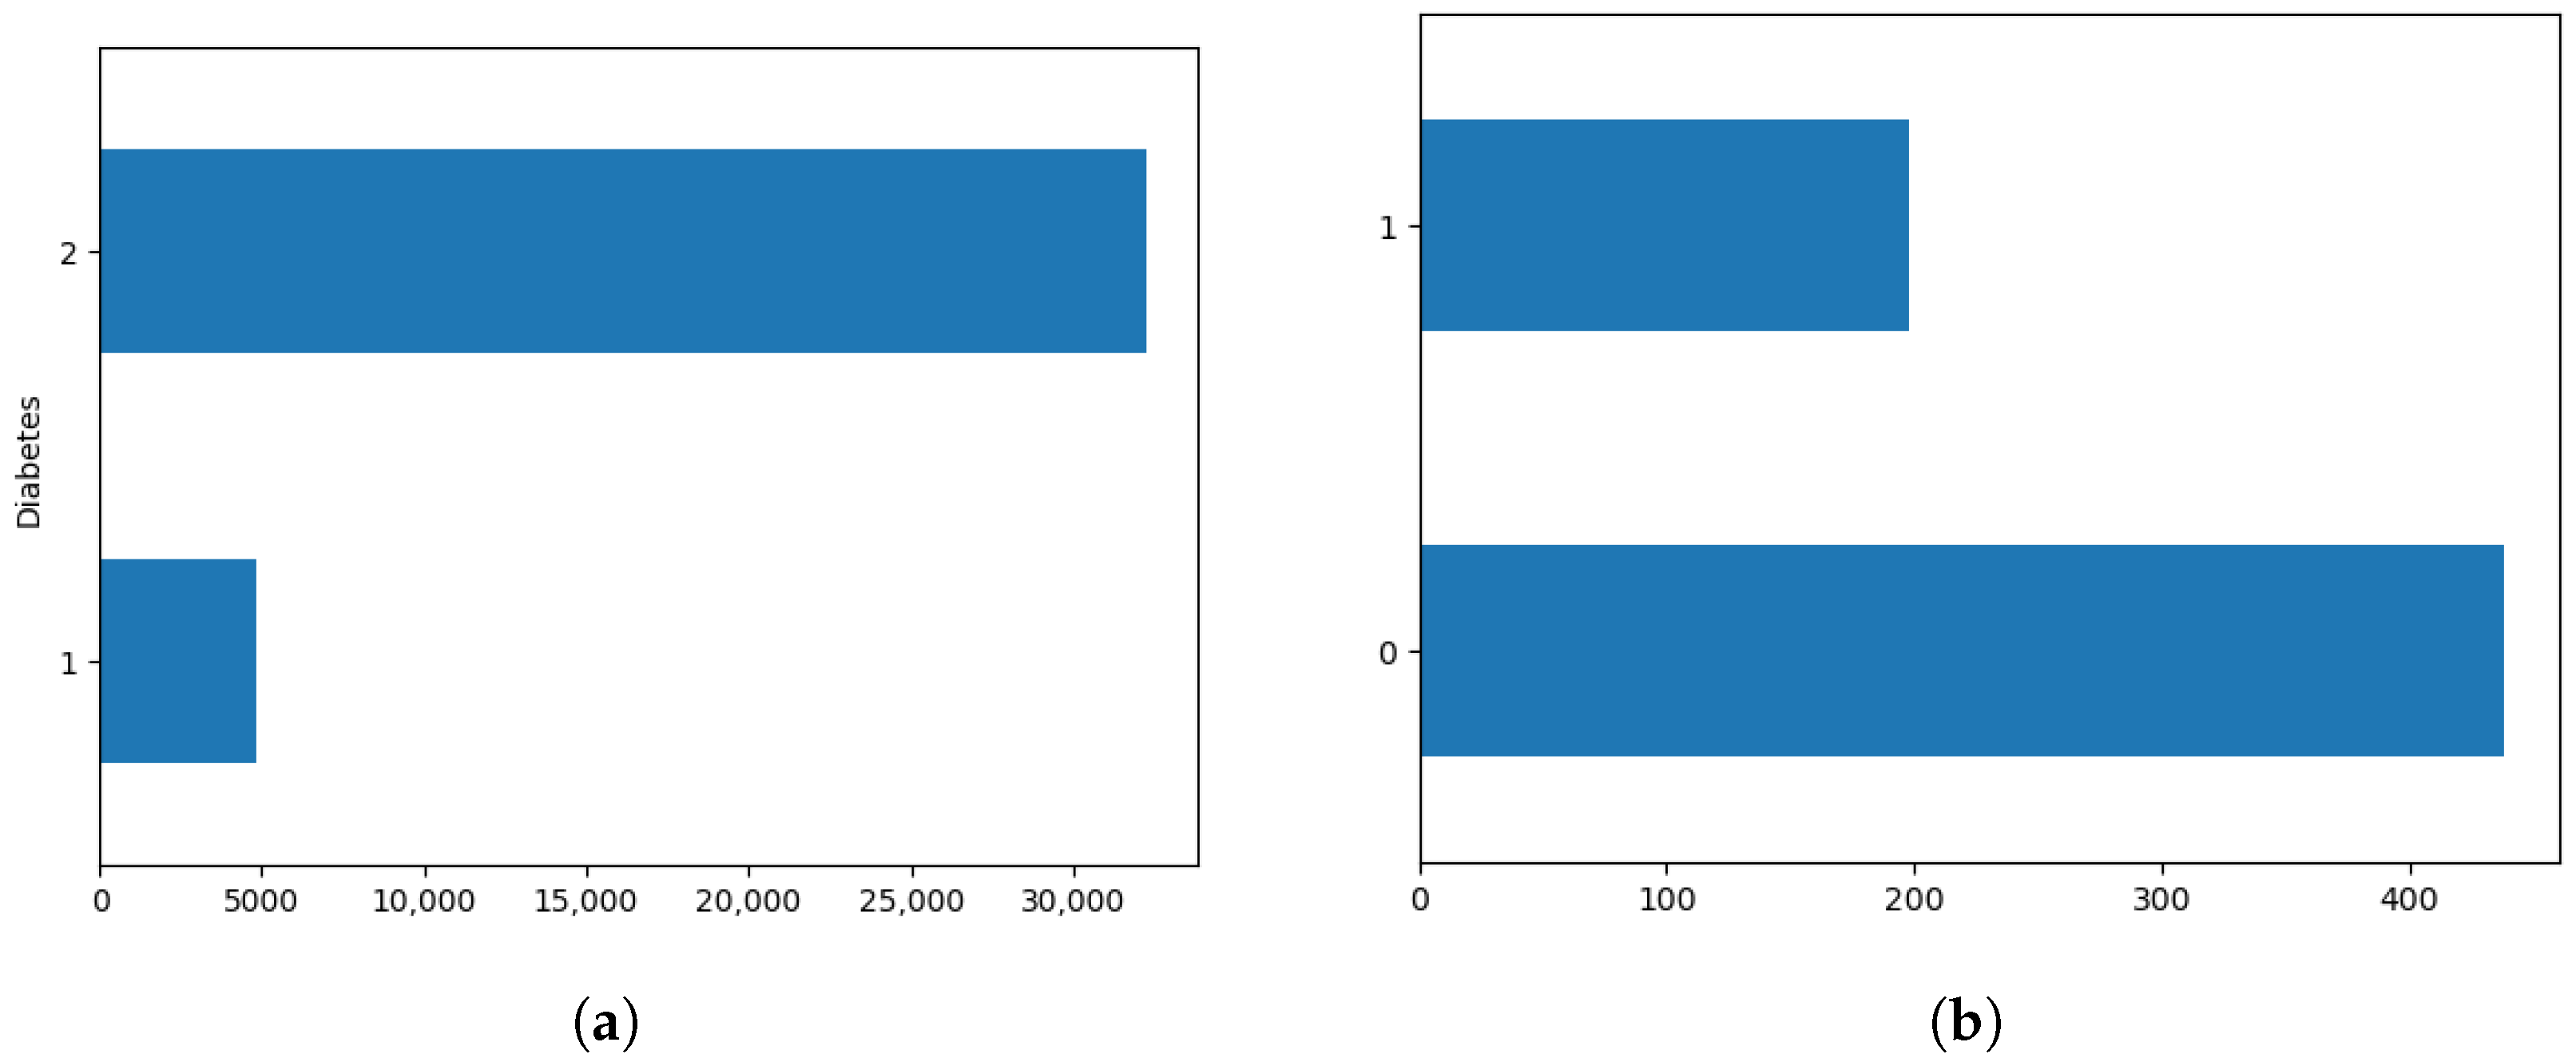
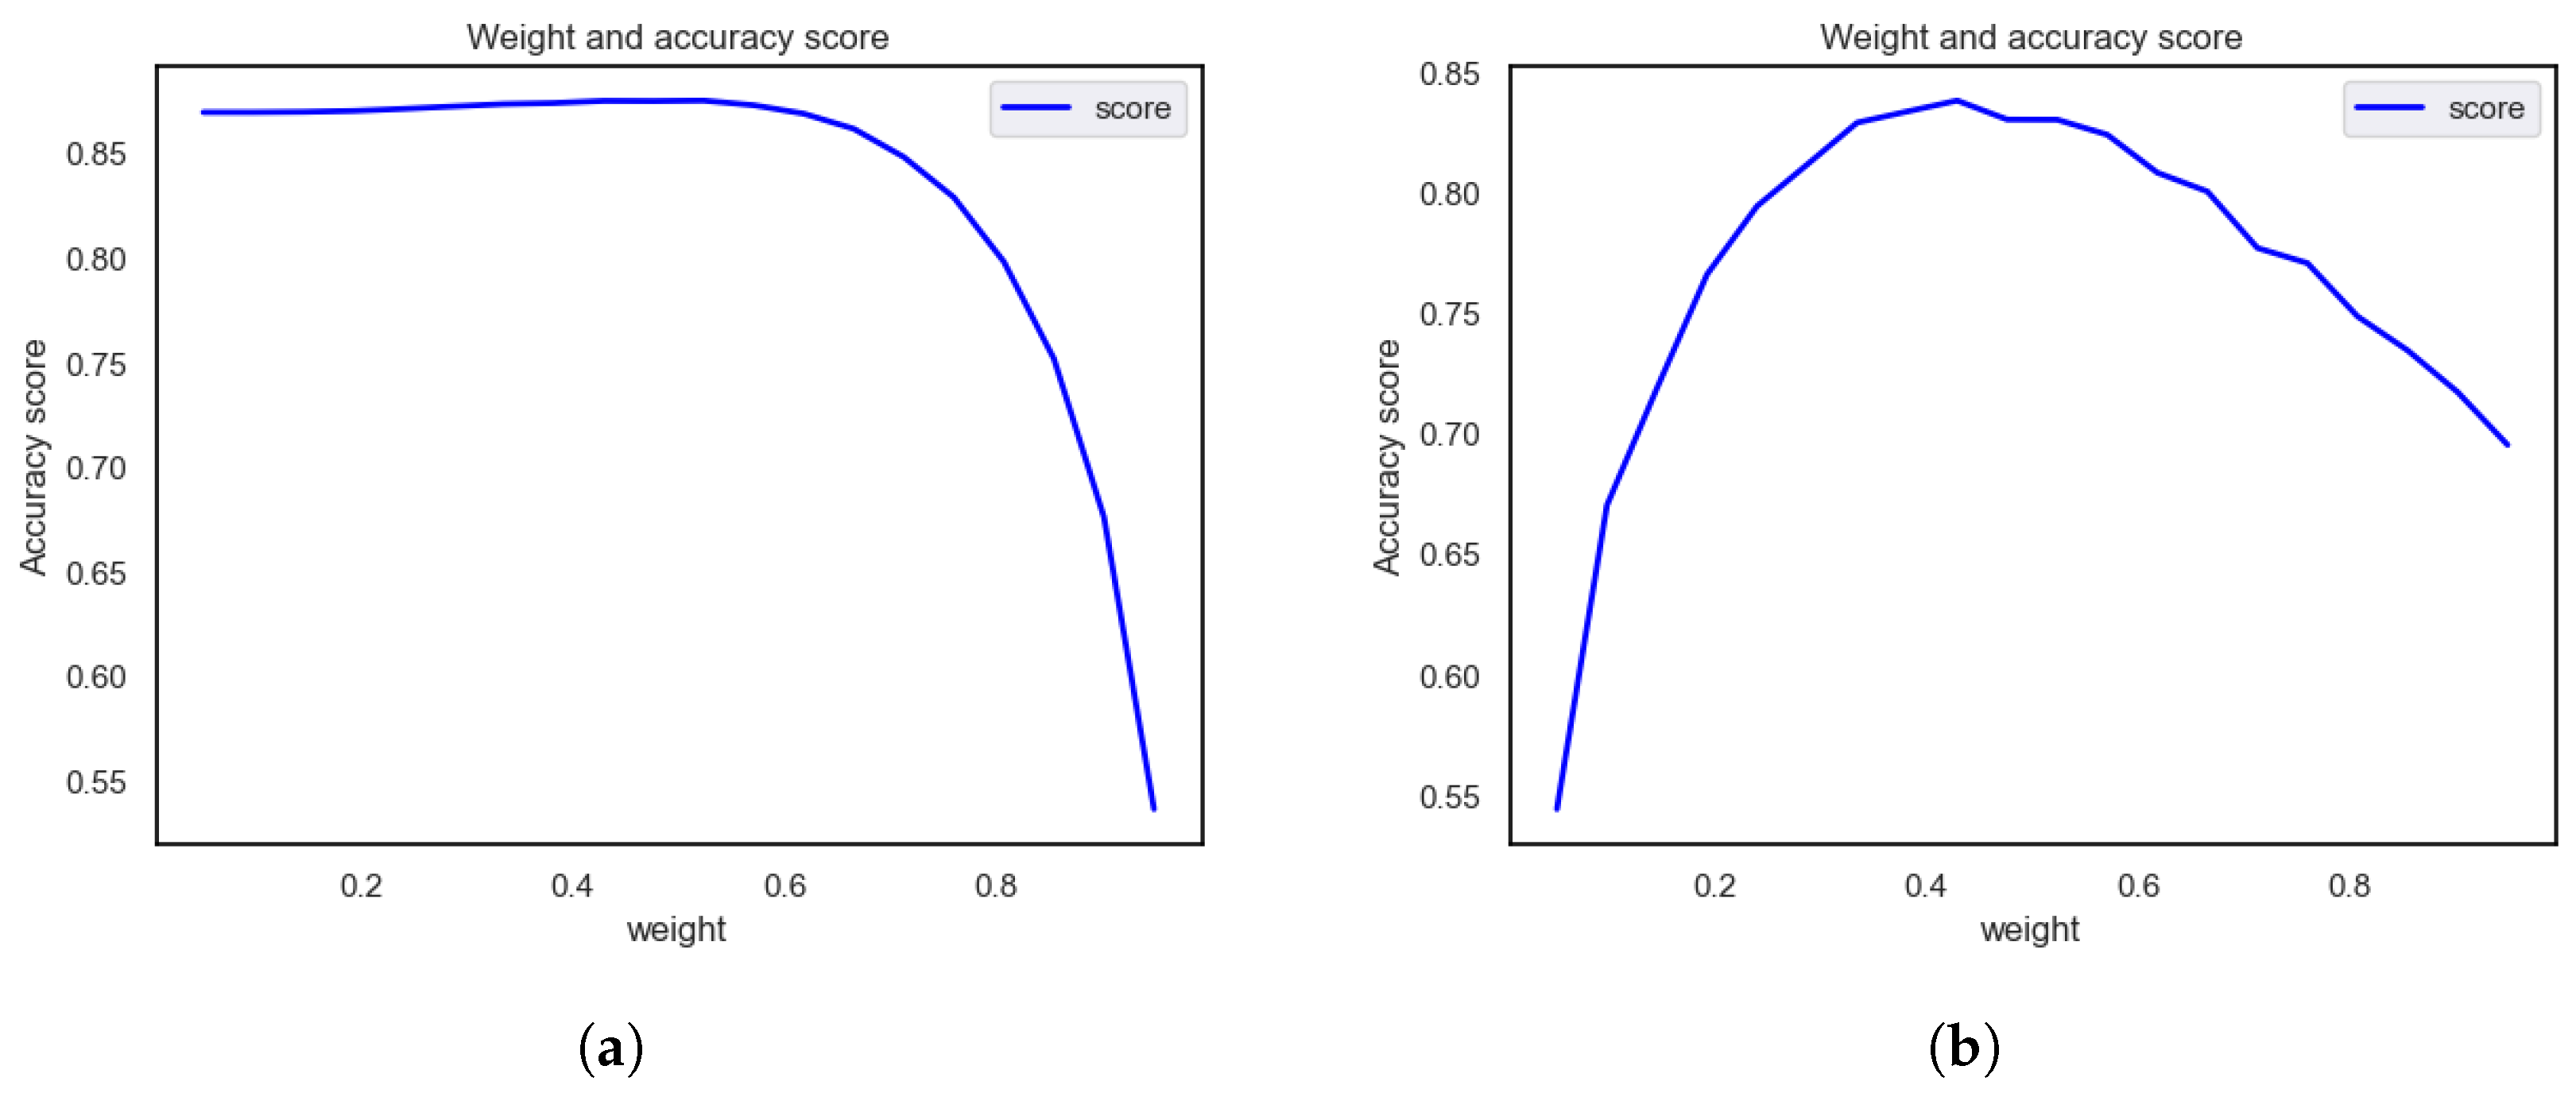
Assigning Class Weights
3.2.2. Convolutional Neural Network
3.2.3. Attention-Oriented Convolutional Neural Networks
3.2.4. Cross-Validation
3.3. Hardware Configuration and Evaluation Indicators
4. Results
4.1. Data-Preprocessing Results
4.1.1. Missing Value Padding and Outlier Imputation
4.1.2. Feature Importance Analysis Results
4.1.3. Assigning Class Weights
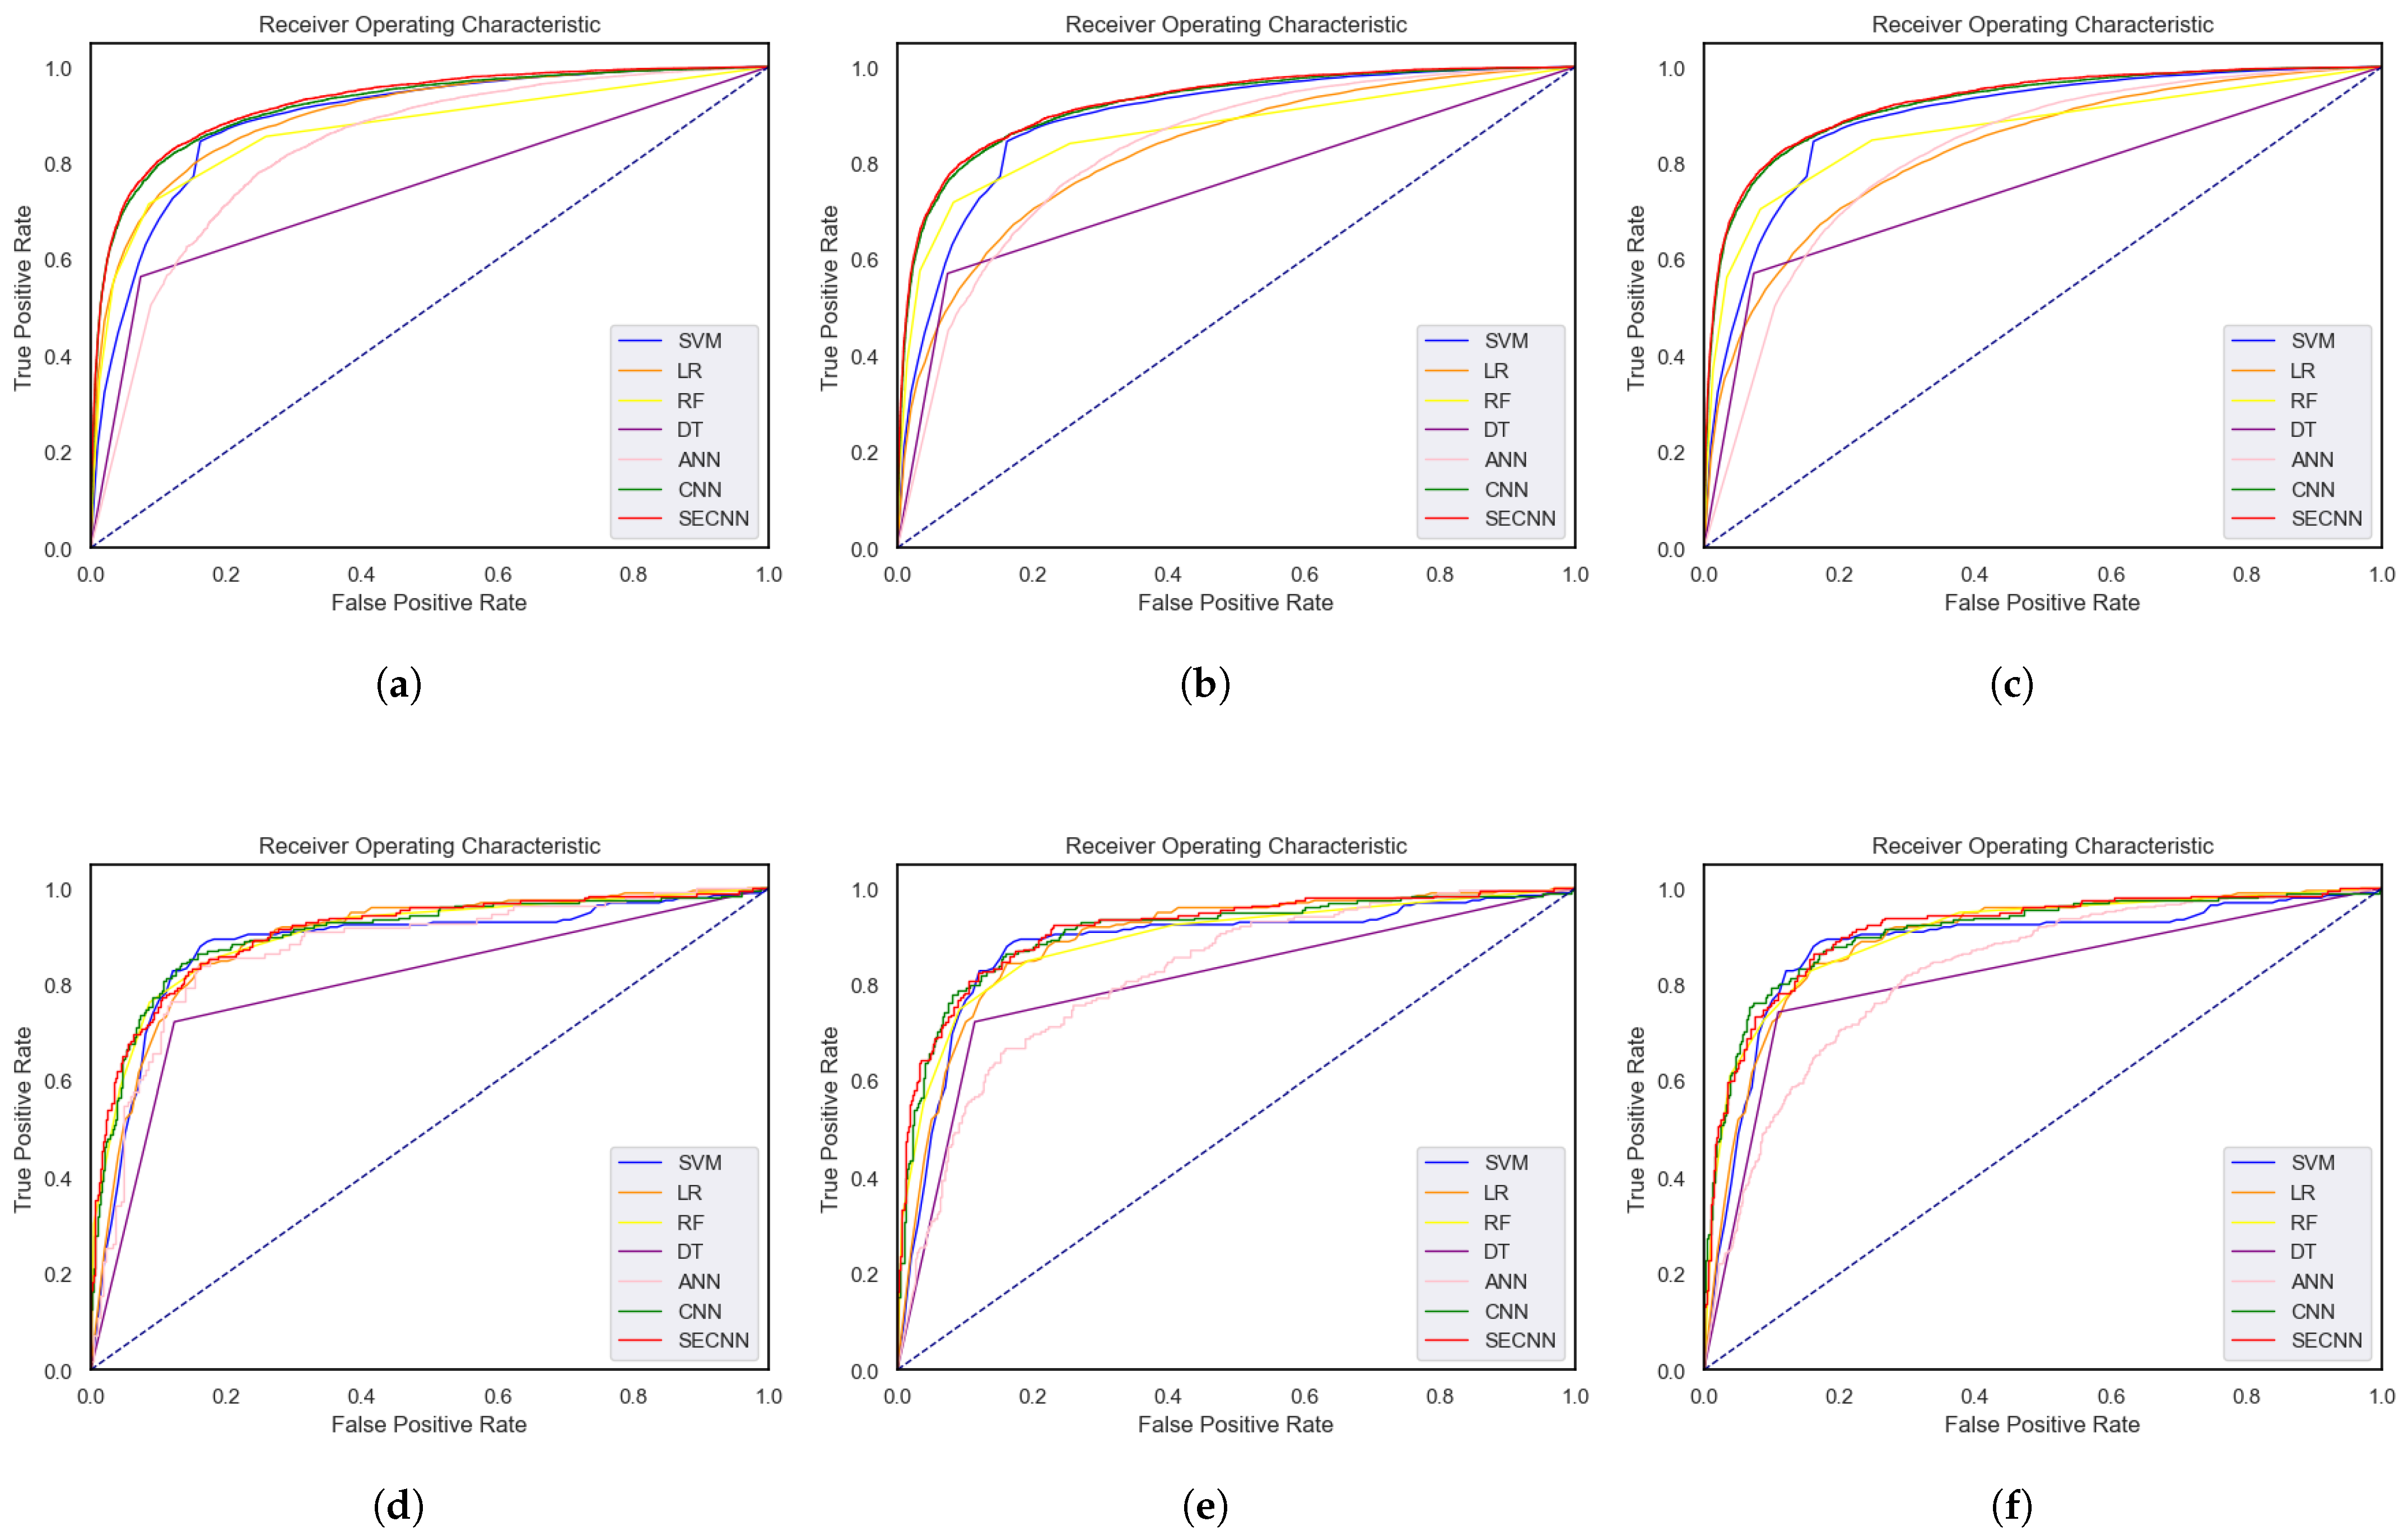
4.2. Comparative Analysis of Deep Model Performance across Datasets
4.3. Literature Review and Comparison of Results
5. Discussion
- Improved feature expression ability: The SE module enhances the model’s ability to express key features by adaptively weighting the features of different channels.
- Reduce the impact of redundant features: The SE module can automatically select and adjust the importance of channels, reduce the impact of redundant features, increase the model’s attention to key features, and improve the robustness and generalization ability of diabetes-related features.
5.1. Limitation
- Although the NHANES dataset has a larger sample size and more feature information, it does not have a subset for special groups such as children. This may result in results that are less accurate or applicable to age-specific prediction problems. Therefore, when making predictions using the NHANES dataset, one needs to carefully consider the age distribution of the sample and be careful to interpret the results as being applicable to specific age groups.
- Whether it is the PID dataset or the NHANES dataset, there are missing or incomplete data. The processing of these missing values may have a certain impact on the prediction results.
5.2. Future Work
6. Conclusions
Author Contributions
Funding
Institutional Review Board Statement
Informed Consent Statement
Data Availability Statement
Conflicts of Interest
References
- Misra, A.; Gopalan, H.; Jayawardena, R.; Hills, A.P.; Soares, M.; Reza-Albarrán, A.A.; Ramaiya, K.L. Diabetes in developing countries. J. Diabetes 2019, 11, 522–539. [Google Scholar] [CrossRef]
- Forbes, J.M.; Cooper, M.E. Mechanisms of diabetic complications. Physiol. Rev. 2013, 93, 137–188. [Google Scholar] [CrossRef]
- Care, D. Classification and diagnosis of diabetes. Diabetes Care 2017, 40, S11–S24. [Google Scholar]
- Atkinson, M.A.; Eisenbarth, G.S.; Michels, A.W. Type 1 diabetes. Lancet 2014, 383, 69–82. [Google Scholar] [CrossRef]
- Ziegler, A.G.; Nepom, G.T. Prediction and pathogenesis in type 1 diabetes. Immunity 2010, 32, 468–478. [Google Scholar] [CrossRef]
- Colman, P.G.; McNair, P.D.; Gellert, S.; Kewming, K.; Schmidli, R.S.; Steele, C.E.; Harrison, L.C. Development of autoantibodies to islet antigens during childhood: Implications for preclinical type 1 diabetes screening. Pediatr. Diabetes 2002, 3, 144–148. [Google Scholar] [CrossRef]
- Wu, J.H.; Li, J.; Wang, J.; Zhang, L.; Wang, H.D.; Wang, G.L.; Li, X.l.; Yuan, J.X. Risk prediction of type 2 diabetes in steel workers based on convolutional neural network. Neural Comput. Appl. 2020, 32, 9683–9698. [Google Scholar] [CrossRef]
- McIntyre, H.D.; Catalano, P.; Zhang, C.; Desoye, G.; Mathiesen, E.R.; Damm, P. Gestational diabetes mellitus. Nat. Rev. Dis. Prim. 2019, 5, 47. [Google Scholar] [CrossRef]
- Emerging Risk Factors Collaboration. Diabetes mellitus, fasting blood glucose concentration, and risk of vascular disease: A collaborative meta-analysis of 102 prospective studies. Lancet 2010, 375, 2215–2222. [Google Scholar] [CrossRef]
- Cho, N.H.; Shaw, J.; Karuranga, S.; Huang, Y.; da Rocha Fernandes, J.; Ohlrogge, A.; Malanda, B. IDF Diabetes Atlas: Global estimates of diabetes prevalence for 2017 and projections for 2045. Diabetes Res. Clin. Pract. 2018, 138, 271–281. [Google Scholar] [CrossRef]
- Saeedi, P.; Petersohn, I.; Salpea, P.; Malanda, B.; Karuranga, S.; Unwin, N.; Colagiuri, S.; Guariguata, L.; Motala, A.A.; Ogurtsova, K.; et al. Global and regional diabetes prevalence estimates for 2019 and projections for 2030 and 2045: Results from the International Diabetes Federation Diabetes Atlas. Diabetes Res. Clin. Pract. 2019, 157, 107843. [Google Scholar] [CrossRef]
- Mi, S.Q. Establishing and Validating of Type II Diabetes Incident Prediction Model of Chinese Adult at Individual Level; Chronic Center, Chinese Center for Disease Control and Prevention: Beijing, China, 2011. [Google Scholar]
- Basanta-Alario, M.L.; Ferri, J.; Civera, M.; Martínez-Hervás, S.; Ascaso, J.F.; Real, J.T. Differences in clinical and biological characteristics and prevalence of chronic complications related to aging in patients with type 2 diabetes. Endocrinol. Nutr. Engl. Ed. 2016, 63, 79–86. [Google Scholar] [CrossRef]
- Raz, I.; Riddle, M.C.; Rosenstock, J.; Buse, J.B.; Inzucchi, S.E.; Home, P.D.; Del Prato, S.; Ferrannini, E.; Chan, J.C.; Leiter, L.A.; et al. Personalized management of hyperglycemia in type 2 diabetes: Reflections from a Diabetes Care Editors’ Expert Forum. Diabetes Care 2013, 36, 1779–1788. [Google Scholar] [CrossRef]
- Khan, F.A.; Zeb, K.; Al-Rakhami, M.; Derhab, A.; Bukhari, S.A.C. Detection and prediction of diabetes using data mining: A comprehensive review. IEEE Access 2021, 9, 43711–43735. [Google Scholar] [CrossRef]
- Cortes, C.; Vapnik, V. Support-vector networks. Mach. Learn. 1995, 20, 273–297. [Google Scholar] [CrossRef]
- Reinhardt, A.; Hubbard, T. Using neural networks for prediction of the subcellular location of proteins. Nucleic Acids Res. 1998, 26, 2230–2236. [Google Scholar] [CrossRef]
- Kégl, B. The return of AdaBoost. MH: Multi-class Hamming trees. arXiv 2013, arXiv:1312.6086. [Google Scholar]
- Tabaei, B.P.; Herman, W.H. A multivariate logistic regression equation to screen for diabetes: Development and validation. Diabetes Care 2002, 25, 1999–2003. [Google Scholar] [CrossRef]
- Jenhani, I.; Amor, N.B.; Elouedi, Z. Decision trees as possibilistic classifiers. Int. J. Approx. Reason. 2008, 48, 784–807. [Google Scholar] [CrossRef]
- Breiman, L.; Cutler, R. Random forests machine learning. J. Clin. Microbiol. 2001, 2, 199–228. [Google Scholar]
- Maniruzzaman, M.; Rahman, M.J.; Al-MehediHasan, M.; Suri, H.S.; Abedin, M.M.; El-Baz, A.; Suri, J.S. Accurate diabetes risk stratification using machine learning: Role of missing value and outliers. J. Med. Syst. 2018, 42, 92. [Google Scholar] [CrossRef]
- Maniruzzaman, M.; Rahman, M.J.; Ahammed, B.; Abedin, M.M. Classification and prediction of diabetes disease using machine learning paradigm. Health Inf. Sci. Syst. 2020, 8, 7. [Google Scholar] [CrossRef]
- Naz, H.; Ahuja, S. Deep learning approach for diabetes prediction using PIMA Indian dataset. J. Diabetes Metab. Disord. 2020, 19, 391–403. [Google Scholar] [CrossRef]
- Hasan, K.A.; Hasan, M.A.M. Prediction of clinical risk factors of diabetes using multiple machine learning techniques resolving class imbalance. In Proceedings of the 2020 23rd International Conference on Computer and Information Technology (ICCIT), Dhaka, Bangladesh, 19–21 December 2020; pp. 1–6. [Google Scholar]
- Hasan, M.K.; Alam, M.A.; Das, D.; Hossain, E.; Hasan, M. Diabetes prediction using ensembling of different machine learning classifiers. IEEE Access 2020, 8, 76516–76531. [Google Scholar] [CrossRef]
- Sivaranjani, S.; Ananya, S.; Aravinth, J.; Karthika, R. Diabetes prediction using machine learning algorithms with feature selection and dimensionality reduction. In Proceedings of the 2021 7th International Conference on Advanced Computing and Communication Systems (ICACCS), Coimbatore, India, 19–20 March 2021; Volume 1, pp. 141–146. [Google Scholar]
- Khanam, J.J.; Foo, S.Y. A comparison of machine learning algorithms for diabetes prediction. ICT Express 2021, 7, 432–439. [Google Scholar] [CrossRef]
- Olisah, C.C.; Smith, L.; Smith, M. Diabetes mellitus prediction and diagnosis from a data preprocessing and machine learning perspective. Comput. Methods Programs Biomed. 2022, 220, 106773. [Google Scholar] [CrossRef]
- Rastogi, R.; Bansal, M. Diabetes prediction model using data mining techniques. Meas. Sens. 2023, 25, 100605. [Google Scholar] [CrossRef]
- Kumar, S.; Bhusan, B.; Singh, D.; kumar Choubey, D. Classification of diabetes using deep learning. In Proceedings of the 2020 International Conference on Communication and Signal Processing (ICCSP), Chennai, India, 28–30 July 2020; pp. 0651–0655. [Google Scholar]
- Abedini, M.; Bijari, A.; Banirostam, T. Classification of Pima Indian diabetes dataset using ensemble of decision tree, logistic regression and neural network. Int. J. Adv. Res. Comput. Commun. Eng. 2020, 9, 7–10. [Google Scholar] [CrossRef]
- Roy, K.; Ahmad, M.; Waqar, K.; Priyaah, K.; Nebhen, J.; Alshamrani, S.S.; Raza, M.A.; Ali, I. An enhanced machine learning framework for type 2 diabetes classification using imbalanced data with missing values. Complexity 2021, 2021, 9953314. [Google Scholar] [CrossRef]
- Ahmed, U.; Issa, G.F.; Khan, M.A.; Aftab, S.; Khan, M.F.; Said, R.A.; Ghazal, T.M.; Ahmad, M. Prediction of diabetes empowered with fused machine learning. IEEE Access 2022, 10, 8529–8538. [Google Scholar] [CrossRef]
- Abnoosian, K.; Farnoosh, R.; Behzadi, M.H. Prediction of diabetes disease using an ensemble of machine learning multi-classifier models. BMC Bioinform. 2023, 24, 337. [Google Scholar] [CrossRef] [PubMed]
- Dutta, A.; Batabyal, T.; Basu, M.; Acton, S.T. An efficient convolutional neural network for coronary heart disease prediction. Expert Syst. Appl. 2020, 159, 113408. [Google Scholar] [CrossRef]
- Smith, J.W.; Everhart, J.E.; Dickson, W.; Knowler, W.C.; Johannes, R.S. Using the ADAP learning algorithm to forecast the onset of diabetes mellitus. In Proceedings of the Annual Symposium on Computer Application in Medical Care; American Medical Informatics Association: Bethesda, MD, USA, 1988; p. 261. [Google Scholar]
- Lin, W.C.; Tsai, C.F. Missing value imputation: A review and analysis of the literature (2006–2017). Artif. Intell. Rev. 2020, 53, 1487–1509. [Google Scholar] [CrossRef]
- Cousineau, D.; Chartier, S. Outliers detection and treatment: A review. Int. J. Psychol. Res. 2010, 3, 58–67. [Google Scholar] [CrossRef]
- Bansal, R.; Gaur, N.; Singh, S.N. Outlier detection: Applications and techniques in data mining. In Proceedings of the 2016 6th International Conference-Cloud System and Big Data Engineering (Confluence), Noida, India, 14–15 January 2016; pp. 373–377. [Google Scholar]
- Vinutha, H.; Poornima, B.; Sagar, B. Detection of outliers using interquartile range technique from intrusion dataset. In Information and Decision Sciences: Proceedings of the 6th International Conference on FICTA; Springer: Singapore, 2018; pp. 511–518. [Google Scholar]
- Storey, J.D.; Tibshirani, R. Statistical significance for genomewide studies. Proc. Natl. Acad. Sci. USA 2003, 100, 9440–9445. [Google Scholar] [CrossRef]
- Batista, G.E.; Prati, R.C.; Monard, M.C. A study of the behavior of several methods for balancing machine learning training data. ACM SIGKDD Explor. Newsl. 2004, 6, 20–29. [Google Scholar] [CrossRef]
- Sun, Y.; Wong, A.K.; Kamel, M.S. Classification of imbalanced data: A review. Int. J. Pattern Recognit. Artif. Intell. 2009, 23, 687–719. [Google Scholar] [CrossRef]
- Weiss, G.M. Mining with rarity: A unifying framework. ACM SIGKDD Explor. Newsl. 2004, 6, 7–19. [Google Scholar] [CrossRef]
- Roshan, S.E.; Asadi, S. Improvement of Bagging performance for classification of imbalanced datasets using evolutionary multi-objective optimization. Eng. Appl. Artif. Intell. 2020, 87, 103319. [Google Scholar] [CrossRef]
- Oyedotun, O.K.; Khashman, A. Document segmentation using textural features summarization and feedforward neural network. Appl. Intell. 2016, 45, 198–212. [Google Scholar] [CrossRef]
- Konomi, M.; Sacha, G. Feedforward neural network methodology to characterize thin films by Electrostatic Force Microscopy. Ultramicroscopy 2017, 182, 243–248. [Google Scholar] [CrossRef] [PubMed]
- Wang, Y.; Li, Y.; Wang, J.; Lv, H. An optical flow estimation method based on multiscale anisotropic convolution. Appl. Intell. 2024, 54, 398–413. [Google Scholar] [CrossRef]
- Srivastava, N.; Hinton, G.; Krizhevsky, A.; Sutskever, I.; Salakhutdinov, R. Dropout: A simple way to prevent neural networks from overfitting. J. Mach. Learn. Res. 2014, 15, 1929–1958. [Google Scholar]
- Arlot, S.; Celisse, A. A survey of cross-validation procedures for model selection. Stat. Surv. 2010, 4, 40–79. [Google Scholar] [CrossRef]
- Deo, R.; Panigrahi, S. Performance assessment of machine learning based models for diabetes prediction. In Proceedings of the 2019 IEEE Healthcare Innovations and Point of Care Technologies (HI-POCT), Bethesda, MD, USA, 20–22 November 2019; pp. 147–150. [Google Scholar]


| Authors | Year | Classification | Comments |
|---|---|---|---|
| Maniruzzaman et al. [22] | 2018 | SVM, NB, LDA, LR, DT, RF, AB, GPC, QDA | RF has the best performance, with an accuracy of 92.26%. |
| Maniruzzaman et al. [23] | 2020 | NB, DT, AB, RF | The RF model is the best, with an accuracy of 94.25%. |
| Naz et al. [24] | 2020 | ANN, NB, DT, DL | The DL method has the best performance, with an accuracy of 98.07% |
| Hasan et al. [25] | 2020 | SVM, LR, DT, RF, ANN, Ensembling | RF performance is the best, with an accuracy rate of 90%. |
| Wu et al. [7] | 2020 | CNN | The accuracy rate reached 89.0%. |
| Hasan et al. [26] | 2020 | KNN, DT, AB, RF, NB, XB, Ensembling | Ensembling has the best performance, with an AUC value of 95% |
| Santosh Kumar et al. [31] | 2020 | MLFNN | The accuracy of MLFNN is 84.17% |
| Mani Abedini et al. [32] | 2020 | Ensemble model (ANN + LR + DT) | The accuracy of Ensemble model is 83% |
| Sivaranjani et al. [27] | 2021 | SVM, RF | The RF model is the best, with an accuracy of 83%. |
| Roy et al. [33] | 2021 | RF, LGBM, LR, SVM | LGBM has the best performance, with an accuracy of 86% |
| Khanam et al. [28] | 2021 | DT, KNN, RF, NB, AB, LR, SVM, NN | NN has the best performance, with an accuracy of 88.6%. |
| Olisah et al. [29] | 2022 | RF, SVM, 2GDNN | The accuracy rates of the 2GDNN model are 97.34% and 97.24% respectively. |
| Ahmed et al. [34] | 2022 | SVM, ANN, FMDP | The prediction accuracy of FMDP is 94.87% |
| Abnoosian et al. [35] | 2023 | EMLM | The accuracy rate was 97%. |
| Rastogi et al. [30] | 2023 | RF, SVM, LR, NB | LR has the best performance, with an accuracy of 82.46%. |
| No. | Variable | Describe |
|---|---|---|
| 01 | Age | Age |
| 02 | Blood-Rel-Diabetes | Is there a history of diabetes in the family? |
| 03 | Body-Mass-Index | Evaluate whether an individual’s weight is within a healthy range. |
| 04 | Systolic | Measures blood pressure when the heart contracts. |
| 05 | Weight | Reflects an individual’s weight status. |
| 06 | Albumin | a protein in the blood. |
| 07 | Glycohemoglobin | Monitor your average blood sugar levels over the past few months. |
| 08 | HDL | High density lipoprotein cholesterol. |
| 09 | Cholesterol | Fatty substances in the blood. |
| 10 | GGT | -glutamyl transferase, one of the indicators of liver function. |
| 11 | Hemoglobin | Reflects the oxygen carrying capacity of the blood. |
| 12 | Iron | Components of hemoglobin. |
| 13 | Moderate-work | Moderate intensity work. |
| 14 | ALP | Alkaline phosphatase. |
| 15 | Uric.Acid | Products of metabolism in the body. |
| 16 | Creatinine | An important indicator of kidney function. |
| 17 | Bilirubin | Indicators of liver function. |
| 18 | Diastolic | Blood pressure levels during. diastole |
| 19 | LDH | Lactate dehydrogenase, a marker of cell damage |
| 20 | ALT | Alanine aminotransferase, an indicator of liver health |
| 21 | AST | Aspartate aminotransferase |
| 22 | Gender | Gender |
| 23 | Bilirubin | Indicators of liver function. |
| 24 | Diastolic | Blood pressure levels during. Diastole. |
| 25 | Diabetes | Do you have diabetes? |
| No | Variable | Describe | Missing Values |
|---|---|---|---|
| 1 | Pregnancies | Number of pregnancies | 110 |
| 2 | Glucose | Blood glucose concentration 2 h after oral administration of glucose | 5 |
| 3 | Blood pressure | Diastolic blood pressure (mm Hg) | 35 |
| 4 | Skin thickness | Epidermal fold thickness (mm) | 227 |
| 5 | Insulin | 2-h insulin serum (mm u/mL) | 374 |
| 6 | Body mass index (BMI) | Body mass index (weight expressed in kg/height m2) | 11 |
| 7 | Diabetes pedigree function | Diabetes Spectrum Function | 0 |
| 8 | Age | Age | 0 |
| Layer Type | Configuration | Input Shape | Output Shape | Purpose |
|---|---|---|---|---|
| Input Layer | - | (None, X_scaled.shape[1], 1) | (None, X_scaled.shape[1], 1) | Receives the input feature matrix. |
| Conv1D | 32 filters, kernel size 3, activation ‘relu’ | (None, X_scaled.shape[1], 1) | (None, X_scaled.shape[1]-2, 32) | Applies convolution to extract initial features. |
| AveragePooling1D | Pool size 2 | (None, X_scaled.shape[1]-2, 32) | (None, (X_scaled.shape[1]-2)/2, 32) | Reduces feature dimensions and computational load. |
| Dropout | Rate 0.5 | (None, (X_scaled.shape[1]-2)/2, 32) | (None, (X_scaled.shape[1]-2)/2, 32) | Randomly drops units to prevent overfitting. |
| Conv1D | 64 filters, kernel size 3, activation ‘relu’ | (None, (X_scaled.shape[1]-2)/2, 32) | (None, (X_scaled.shape[1]-2)/2-2, 64) | Further extracts deeper features. |
| Dropout | Rate 0.5 | (None, (X_scaled.shape[1]-2)/2-2, 64) | (None, (X_scaled.shape[1]-2)/2-2, 64) | Another layer to prevent overfitting. |
| Flatten | - | (None, (X_scaled.shape[1]-2)/2-2, 64) | (None, ((X_scaled.shape[1]-2)/2-2)*64) | Flattens the data for dense layer processing. |
| Dense | 128 units, activation ‘relu’ | (None, ((X_scaled.shape[1]-2)/2-2)*64) | (None, 128) | A dense layer for learning complex patterns. |
| Dropout | Rate 0.5 | (None, 128) | (None, 128) | Drops units to mitigate overfitting. |
| Dense | Units = np.max(y) + 1, activation ‘softmax’ | (None, 128) | (None, np.max(y) + 1) | Output layer for classification. |
| No. | Feature | F-Score | p Value |
|---|---|---|---|
| 01 | Age | 2686.4097 | 0.0000 |
| 02 | Blood-Rel-Diabetes | 1536.7851 | 0.0000 |
| 03 | Body-Mass-Index | 1000.6701 | 0.0050 |
| 04 | Systolic | 766.3686 | 0.0299 |
| 05 | Weight | 526.9009 | 0.6242 |
| 06 | Albumin | 525.8110 | 0.1353 |
| 07 | Glycohemoglobin | 477.4174 | 0.1973 |
| 08 | HDL | 378.7503 | 0.0022 |
| 09 | Cholesterol | 334.9230 | 0.0000 |
| 10 | GGT | 305.4725 | 0.1156 |
| 11 | Hemoglobin | 270.4280 | 0.0004 |
| 12 | Iron | 211.2168 | 0.9396 |
| 13 | Moderate-work | 188.2664 | 0.1012 |
| 14 | ALP | 156.1723 | 0.3842 |
| 15 | Uric.Acid | 144.7228 | 0.3049 |
| 16 | Creatinine | 102.8804 | 0.3964 |
| 17 | Bilirubin | 80.4633 | 0.1825 |
| 18 | Diastolic | 63.3160 | 0.0000 |
| 19 | LDH | 49.8263 | 0.1427 |
| 20 | ALT | 27.6458 | 0.0309 |
| 21 | AST | 22.6823 | 0.0013 |
| 22 | Gender | 12.2195 | 0.0048 |
| 23 | Protein | 8.5813 | 0.0306 |
| 24 | Phosphorus | 0.0004 | 0.0092 |
| No. | Feature | F-Score | p Value |
|---|---|---|---|
| 1 | Insulin | 255.4176 | 0.3482 |
| 2 | Glucose | 119.7174 | 0.0003 |
| 3 | skin thickness | 79.3331 | 0.8449 |
| 4 | Age | 52.4475 | 0.0006 |
| 5 | BMI | 45.1721 | 0.0000 |
| 6 | Pregnancies | 36.1943 | 0.0713 |
| 7 | blood pressure | 20.5297 | 0.0223 |
| 8 | Diabetes pedigree function | 17.7658 | 0.0893 |
| Data | 0 | 1 |
|---|---|---|
| PID | 0.5711 | 0.4289 |
| NHANES | 0.5237 | 0.4763 |
| Model | K = 3 | K = 5 | K = 10 | ||||||||||||
|---|---|---|---|---|---|---|---|---|---|---|---|---|---|---|---|
| Precision (%) | Recall (%) | F1-Score (%) | Accuracy (%) | AUC (%) | Precision (%) | Recall (%) | F1-Score (%) | Accuracy (%) | AUC (%) | Precision (%) | Recall (%) | F1-Score (%) | Accuracy (%) | AUC (%) | |
| SVM | 87.81 | 89.12 | 86.73 | 88.12 | 89.30 | 87.81 | 89.12 | 86.73 | 89.12 | 89.30 | 87.81 | 89.12 | 86.73 | 89.12 | 90.00 |
| LR | 84.75 | 87.49 | 85.45 | 87.49 | 82.69 | 84.78 | 87.50 | 83.46 | 87.50 | 82.72 | 84.75 | 87.49 | 83.46 | 87.49 | 82.76 |
| RF | 90.58 | 91.19 | 90.77 | 91.19 | 86.84 | 90.88 | 91.45 | 91.05 | 91.32 | 86.44 | 90.93 | 91.53 | 91.09 | 91.53 | 86.63 |
| DT | 88.30 | 88.02 | 88.15 | 88.02 | 74.51 | 88.39 | 88.10 | 88.23 | 88.10 | 74.82 | 88.42 | 88.03 | 88.21 | 88.03 | 74.87 |
| ANN | 86.53 | 86.84 | 86.68 | 86.84 | 83.11 | 86.04 | 86.85 | 86.39 | 86.85 | 82.60 | 86.34 | 86.76 | 86.54 | 86.76 | 81.86 |
| CNN | 92.74 | 93.14 | 92.78 | 93.14 | 91.83 | 92.69 | 93.10 | 92.59 | 93.10 | 92.05 | 92.77 | 93.18 | 92.74 | 93.18 | 92.29 |
| SECNN | 93.70 | 94.00 | 93.69 | 94.00 | 92.58 | 93.62 | 93.91 | 93.51 | 93.91 | 92.62 | 93.85 | 94.12 | 93.78 | 94.12 | 92.79 |
| Model | K = 3 | K = 5 | K = 10 | ||||||||||||
|---|---|---|---|---|---|---|---|---|---|---|---|---|---|---|---|
| Precision (%) | Recall (%) | F1-Score (%) | Accuracy (%) | AUC (%) | Precision (%) | Recall (%) | F1-Score (%) | Accuracy (%) | AUC (%) | Precision (%) | Recall (%) | F1-Score (%) | Accuracy (%) | AUC (%) | |
| SVM | 85.93 | 85.85 | 85.89 | 85.85 | 88.14 | 75.54 | 86.91 | 80.83 | 86.91 | 88.32 | 87.61 | 87.42 | 86.88 | 87.42 | 88.95 |
| LR | 80.34 | 80.66 | 79.43 | 80.66 | 88.06 | 80.23 | 80.50 | 79.18 | 80.50 | 88.06 | 80.34 | 80.66 | 79.43 | 80.66 | 89.42 |
| RF | 84.63 | 84.91 | 84.67 | 84.91 | 89.97 | 86.79 | 86.79 | 86.79 | 86.79 | 89.05 | 87.50 | 87.58 | 87.53 | 87.58 | 90.41 |
| DT | 83.25 | 83.18 | 83.21 | 83.18 | 81.19 | 84.55 | 84.59 | 84.57 | 84.59 | 80.40 | 84.81 | 84.75 | 84.78 | 84.75 | 81.64 |
| ANN | 81.90 | 81.25 | 81.49 | 81.25 | 82.11 | 82.57 | 82.03 | 82.25 | 82.03 | 82.92 | 83.54 | 82.81 | 83.09 | 82.81 | 83.43 |
| CNN | 86.45 | 85.85 | 85.45 | 85.85 | 90.36 | 86.14 | 86.32 | 86.19 | 86.32 | 91.14 | 87.41 | 87.58 | 87.44 | 87.58 | 91.37 |
| SECNN | 87.39 | 87.42 | 87.40 | 87.42 | 90.88 | 88.60 | 88.68 | 88.63 | 88.68 | 91.60 | 89.36 | 89.47 | 89.38 | 89.47 | 91.70 |
| Dataset | Best Model | Accuracy (%) | Related Literature |
|---|---|---|---|
| RF | 90% | Hasan et al. [25] | |
| NHANES | SVM | 90.82% | Ridhi Deo et al. [52] |
| SECNN | 94.12% | this study | |
| RF | 83% | Sivaranjani S. [27] | |
| LR | 82.46% | Rastogi et al. [30] | |
| PID | NN | 88.6% | Khanam et al. [28] |
| MLFNN | 84.17% | Santosh Kumar et al. [31] | |
| SECNN | 89.47% | this study |
Disclaimer/Publisher’s Note: The statements, opinions and data contained in all publications are solely those of the individual author(s) and contributor(s) and not of MDPI and/or the editor(s). MDPI and/or the editor(s) disclaim responsibility for any injury to people or property resulting from any ideas, methods, instructions or products referred to in the content. |
© 2024 by the authors. Licensee MDPI, Basel, Switzerland. This article is an open access article distributed under the terms and conditions of the Creative Commons Attribution (CC BY) license (https://creativecommons.org/licenses/by/4.0/).
Share and Cite
Zhao, J.; Gao, H.; Yang, C.; An, T.; Kuang, Z.; Shi, L. Attention-Oriented CNN Method for Type 2 Diabetes Prediction. Appl. Sci. 2024, 14, 3989. https://doi.org/10.3390/app14103989
Zhao J, Gao H, Yang C, An T, Kuang Z, Shi L. Attention-Oriented CNN Method for Type 2 Diabetes Prediction. Applied Sciences. 2024; 14(10):3989. https://doi.org/10.3390/app14103989
Chicago/Turabian StyleZhao, Jian, Hanlin Gao, Chen Yang, Tianbo An, Zhejun Kuang, and Lijuan Shi. 2024. "Attention-Oriented CNN Method for Type 2 Diabetes Prediction" Applied Sciences 14, no. 10: 3989. https://doi.org/10.3390/app14103989
APA StyleZhao, J., Gao, H., Yang, C., An, T., Kuang, Z., & Shi, L. (2024). Attention-Oriented CNN Method for Type 2 Diabetes Prediction. Applied Sciences, 14(10), 3989. https://doi.org/10.3390/app14103989