Article

Detection of Secondary Metabolites, Proximate Composition and Bioactivity of Organic Dried Spirulina (Arthrospira platensis)

1
Department of Agriculture, Food, Environment and Forestry (DAGRI), University of Florence, 50121 Firenze, Italy
2
Department of Basic Biotechnological Sciences, Intensive and Perioperative Clinics Cattolica University of Sacro Cuore, 00168 Rome, Italy
3
Department of Ecological and Biological Sciences (DEB), Tuscia University, 01100 Viterbo, Italy
4
Department of Laboratory and Infectious Sciences, A. Gemelli University Polyclinic Foundation IRCCS, 00168 Rome, Italy
5
Department of Chemistry and Technology of Drugs, Sapienza University of Rome, 00185 Rome, Italy
*
Author to whom correspondence should be addressed.
Appl. Sci. 2024, 14(1), 67; https://doi.org/10.3390/app14010067 (registering DOI)
Submission received: 12 November 2023 / Revised: 15 December 2023 / Accepted: 18 December 2023 / Published: 20 December 2023

Abstract

:
In this work, Arthrospira platensis grown in Tuscany, Italy, was investigated using different analytical approaches to characterize its volatile and non-volatile chemical composition. The results showed the presence of a high number of volatile organic compounds (VOCs) such as hydrocarbons, furans, sulfides, alkanes, aldehydes, alcohols, ketones, esters and compounds belonging to other chemical classes such as fatty acids, alcohols and sugars. Furthermore, a proximal composition analysis was also performed to determine the protein, fat, carbohydrate and ash content. Total antioxidant capacity (TAC) determined by FRAP and ABTS•+ methods (5.96 mmol TE/g DW; 5.28 mmol Fe2+E/g DW, respectively), showed good reducing power and comparable free radical scavenging activity. The antibacterial power of spirulina-based alcoholic macerate (AM) was also evaluated against Staphylococcus aureus (ATCC 29213), Escherichia coli (ATCC 25922), Pseudomonas aeruginosa (ATCC 060127853), Enterococcus faecalis (ATCC 29211), Klebsiella pneumoniae (ATCC 700603) and Candida albicans (ATCC 24433) and the obtained data have shown that it had no effect against pathogenic bacterial strains. On the contrary, at low concentrations, AM exerted a prebiotic effect on some probiotic strains such as L. casei if treated with AM concentrations ranging from 1.56% v/v and 3.12% v/v and L. rhamnosus if treated with AM concentrations lower than 0.78% v/v. In conclusion, this study highlighted how spirulina, based on the rich composition and its antioxidant and prebiotic effect, can represent a source of beneficial substances for human health.

1. Introduction

It is now known that microalgae are able to improve the nutritional quality of foods and contribute to the improvement of human health thanks to their high content of macro and micronutrients. Among other things, they are a rich source of compounds capable of exerting biological activities. Spirulina is marketed as a “health food” in Japan, Taiwan and Mexico but has only recently gained ground in the food sector due to its peculiar flavor and aroma. Arthrospira platensis, belonging to the Oscillatoriaceae family, is a multicellular blue-green microalga that thrives in warm, alkaline, freshwater bodies. This cyanobacterium is among the edible spirulina species characterized by a high nutritional value; in fact, it contains proteins [1], polysaccharides, total lipids and nucleic acids [2]. A series of micronutrients such as vitamins [3], minerals and essential fatty acids make it suitable for a balanced diet [4]. Its use has been authorized by the FDA as a food or dietary supplement. In general, the addition of spirulina to foods and drinks can be seen as an option to improve sustenance and mass nutrition. Recently spirulina was incorporated into pasta with consequent nutritional fortification without altering the sensorial aspect [5,6,7]. After the addition of spirulina, an improvement in functional properties was also found in biscuits, smoothies and snacks [8,9,10]. In our previous work, the effects of adding spirulina to craft beer were evaluated. The results demonstrated that spirulina, in addition to modifying the content of compound esters, improved the cytoprotective properties of beer towards tBOOH-induced oxidative damage in H69 cells and reduced intracellular oxidative stress [11].
The advantage in using spirulina in the food field is also due to the fact that by requiring an alkaline pH to grow, this does not favor the growth and development of other microorganisms with toxic effects [12]. In general, in recent times, the use of supplements such as spirulina in the form of pills or capsules is preferred to be taken following addition to commercial foods and/or drinks because the consequent color change leads to greater attraction and curiosity on the part of the consumer.
Previous studies have also demonstrated a biological action of spirulina. For example, ethanolic and methanolic extracts have been shown to be effective as antifungals, and both cytotoxic and antioxidant [13,14]. Synthetic antioxidants are generally dangerous for humans if used long-term, so a natural antioxidant source that can reduce or prevent cellular damage caused by oxidative stress may be crucial for the prevention of diseases such as cancer [15]. Ability to lower cholesterol levels and modulating properties of the immune system have also been reported [16].
In light of the growing interest in this cyanobacterium and its potential uses, the aim of the present study was to further explore the chemical composition of Arthrospira platensis. For this purpose, in our investigation, more analytical techniques such as GC/MS, SPME-GC/MS and PTR-ToF-MS were used to provide a more detailed description of the compositional profile of Arthrospira platensis grown in Italy, never investigated until now. Furthermore, the assessment of its antioxidant power, antimicrobial activity, and effectiveness as a prebiotic agent was performed to better know its beneficial effects.

2. Materials and Methods

2.1. Materials

Dried biomass of organic Arthrospira platensis in the form of thin flakes was purchased by Spirulina Becagli Farm, 58100 Grosseto, Italy.
All chemicals were purchased from Sigma-Aldrich (St. Louis, MO, USA).

2.2. Solid Phase Microextraction (SPME) Sampling

To characterize the volatile fraction of spirulina, SPME technique for the sampling phase was used. Small amounts of spirulina (~4 mg) were placed into a 7 mL glass vial with polytetrafluoroethylene (PTFE)-coated silicone septum. A SPME device from Supelco (Bellefonte, PA, USA) equipped with 1 cm fiber coated with 50/30 μm DVB/CAR/PDMS (divinylbenzene/carboxen/polydimethylsiloxane) was used to optimize the extraction of the components [17]. Before use, the fiber was conditioned at 270 °C for 30 min. After the thermostating phase, the fiber was exposed to the headspace of the sample for 20 min at 50 °C to adsorb the volatiles. To desorb the components the SPME fiber was inserted in injection port at 250° in splitless mode.

2.3. GC-MS Analisys

Chromatographic analyses were performed using a gas chromatograph coupled to a Clarus 500 mass spectrometer model Perkin Elmer (Waltham, MA, USA), equipped with an FID (flame ionization detector). A Varian Factor Four VF-1 capillary column was housed in the GC oven [18]. The temperature program started from 55 °C then rose to 220 °C at 6°/min and was finally maintained at this temperature for 15 min. Hyper-pure helium was the carrier gas used at a constant rate of 1 mL/min. The operating conditions of the mass spectrometer were as follows: the energy of the electron beam was set to 70 eV (EI) in full scan mode in the range 40–550 m/z; the temperature of the ion source and connecting parts were 180 °C and 200 °C, respectively. The identification of the volatile compounds was performed first through the comparison of the mass spectra with those present in the Wiley 2.2 and Nist 11 mass spectral library database and then through the calculation of the linear retention indices (LRI) thanks to a series of alkane standards (C8–C24). The calculated LRIs were then compared with those reported in the literature. The areas of individual peaks of the FID signal were used to calculate the relative concentrations of the components compared to the total area without the use of an internal standard and any factor correction. All analyses were performed in triplicate.

2.4. GC-MS Analysis of Spirulina after the Derivatization Reaction

To describe the chemical composition of spirulina, a derivatization reaction was performed according to Taiti et al. [11]. The analysis was performed using the same apparatus GC-FID/GC-MS and the same capillary column (Varian Factor Four VF—Agilent, Santa Clara, CA, USA). The applied program temperature was as follows: 60 °C then a gradient of 7 °C/minute up to 170 °C held for 1.0 min and a gradient of 8 °C/minute up to 250 °C held constant for 25 min. Mass spectra were acquired in electron impact mode. The identification of the compounds was performed considering the percentage of similarity with the mass spectra (MS) present in the instrument library database (NIST 11). Quantification was performed as described above (Section 2.3.)

2.5. GC-MS Determination of Fatty Acids (FAs) Content

Fatty acid content was determined by GC/MS technique after lipid extraction process and synthesis of FAs methyl esters performed according to Farinon et al. [19] with slight modifications. In detail, the samples (0.5 g) were dissolved with 10 mL of chloroform/methanol (2:1 v/v). Then, 1 mL of each extract was dried with nitrogen and transmethylated with BF3, before being refluxed with methanol at 72 °C for 30 min. The extraction of the fatty acid methyl esters (FAMEs) obtained was carried out with n-hexane. The samples were then dried using nitrogen. 2 μL of the extract was injected into the column in splitless mode. The gas chromatographic conditions were as follows: the injector was set at 280 °C and the oven temperature program started from 170 °C and increased up to 260 °C with a rate of 3 °C/min and held constant for 15 min. Component identification and quantification were performed as previously described. Analyses were performed in triplicate.

2.6. Proton Transfer Reaction-Time-of-Flight-Mass Spectrometry (PTR-ToF-MS) Analysis

The headspace analysis of spirulina sample was performed with a commercial PTR-MS8000 apparatus (Ionicon Analytik GmbH, Innsbruck, Austria). Instrumental conditions were as follows: 110 °C drift tube temperature, 2.2 mbar drift pressure, 550 V drift voltage with E/N ratio of about 135 Townsend (Td). Fingerprinting of spirulina was highlighted using H3O+ as reagent ion for the proton transfer reaction. The volatile analysis was carried out by placing spirulina powder sample in a glass jar (3/4 L) airtight drum with two holes mounted on the lids. Once the spirulina (2 g) was put inside the jar, it was flushed with clean air for 2 min and then was closed and incubated for five minutes at 25 °C. Fingerprinting of spirulina was highlighted using H3O+ as reagent ion for the proton transfer reaction. Before each replicate, the headspace of empty glass jar (3/4 L) was determined for background subtraction. Thereafter headspace volatiles were measured. The acquisition rate of the ToF mass spectrometer was 1 spectrum for each second within a mass spectrum ranging up to m/z = 250. Subsequently, the spectra analysis as well as the internal calibration, noise reduction and data extraction were carried out following the procedure reported by Taiti et al. [20]. In particular, the mass peaks detected with PTR-ToF-MS were reduced by applying noise thresholds of 1 ppbv and eliminating all peaks ascribed to water chemistry or other interfering ions (e.g., oxygen, nitrogen monoxide).

2.7. Proximal Composition

Proximate composition was analyzed according to AOAC International [21] official procedures. Briefly, crude protein content was determined using the Kjeldahl method (AOAC 2001.11) (SpeedDigester K-425 and Distillation Unit K-350, BÜCHI Labortechnik, Flawil, Switzerland) considering the conversion factor of 6.25. Crude fat (AOAC 920.39) was determined using a Soxhlet Extraction System B-811 (BÜCHI Labortechnik, Flawil, Switzerland) with petroleum ether as solvent. Ash was obtained following incineration at 550 °C for 4 h (AOAC 923.03). Total carbohydrates were determined by difference (i.e., 100 − (g [protein + fat + ash] in 100 g of DW sample)). Finally, the energy content was calculated on fresh weight (FW), using the Atwater factor, as follows:
Energy value (Kcal) = (%Protein × 4) + (%Fat × 9) + (%Carbohydrate × 4).

2.8. Extraction Process for Total Antioxidant Capacity (TAC) Determination

For TAC, considering the low ability of the polar solvent EtOH in isolating the antioxidant compounds of spirulina as previously shown in the paper by Stunda-Zujeva et al. [22], MetOH 80% was chosen as polar solvent and for the first time compared to phosphate-buffered saline (PBS) to extract the lipophilic and hydrophilic component, respectively. In particular, samples were extracted according to Molinari et al. [23], for the lipophilic component. Briefly, the obtained powders were extracted overnight in the dark with a solvent consisting of methanol:water (80:20, v/v) in a ratio 1:25 (w/v). The PBS hydrophilic extraction was done maintaining the same ratios. Then, the samples were centrifuged at 5000× g (ALC PK121R centrifuge; Bodanchimica s.r.l., Cagliari, Italy) for 10 min at 4 °C. The supernatants were collected and stored at −80 °C until further processing.

2.9. Total Antioxidant Capacity (TAC) Determination

The TAC was evaluated through two different assays, the ferric reducing antioxidant power (FRAP), and 2,2′-azino-bis (3-ethyl-ben-zothiazoline-6-sulfonic acid) (ABTS•+) radical scavenging activity assay as follows.
FRAP assay resulted from the method of Benzie and Strain [24], and it was adapted for 96-well plates and an automatic reader (Infinite 2000, Tecan, Salzburg, Austria). The method is based on the reduction of the Fe3+-2,4,6-tripyr-idyl-s-triazine (TPTZ) complex to its ferrous form at a low pH. Specifically, 160 µL of FRAP assay solution (made from 20 mM ferric chloride solution, 10 mM TPTZ solution, and 0.3 M acetate buffer at pH 3.6) was prepared daily, mixed with 10 µL of the sample, standard, or blank, and dispensed into each well of a 96-well plate. After 30 min of incubation at 37 °C, the absorbance was measured at 595 nm. The results were expressed as mmol Fe2+ equivalents (E)/g.
The ABTS•+ radical scavenging activity was analyzed through the OxiSelectTM Trolox Equivalent Antioxidant Capacity (TEAC) Assay Kit (ABTS) (Cell Biolabs Inc., San Diego, CA, USA) following the manufacturer’s instruction. Specifically, samples and standards were mixed with the primed ABTS•+ probe, and antioxidants neutralized the radical ion in a concentration-dependent manner, which correlates with a proportional decrease in color intensity. The absorbance was recorded at 405 nm in an automatic reader (Infinite 2000, Tecan, Salzburg, Austria). A standard curve for Trolox was used to express the antioxidant capacity as mmol of Trolox equivalents (TE)/g of DW. Both the extracts (i.e., in MetOH 80% and PBS) were analyzed with both the above-described methods.

2.10. Alcholic Extract for Microbiological Study

To evaluate the best extract with antimicrobial activity, two alcoholic macerates (AMs) made with two different solvents (100% of ethanol or water) were obtained to evaluate the inhibitory and the cytocidal effectiveness of spirulina. Specifically, 6 g of spirulina was crushed and then macerated with a quantity of solvent equal to four times the weight of the spirulina. Samples were incubated at room temperature (RT) in dark for 10 days. After this time, the ethanol-based solution was filtered with 22 µm filters, while the water-based solution could not be processed due to the swelling of the spirulina which made the solution extremely viscous and unworkable. The ethanol extract was stored at +4 °C until use.

2.11. Bacterial Strains and Culture Media

The antibacterial effectiveness of spirulina was tested against the following: Staphylococcus aureus (ATCC 29213), Escherichia coli (ATCC 25922), Pseudomonas aeruginosa (ATCC 060127853), Enterococcus faecalis (ATCC 29211), Klebsiella pneumoniae (ATCC 700603) and Candida albicans (ATCC 24433). To evaluate the antimicrobial activity of the AM, bacteria strains were cultured in Muller Hinton broth or agar (Oxoid, Basingstoke, Hampshire, UK), while the fungal strain was in Sabouroud broth or agar (Sigma-Aldrich, Saint Louis, MO, USA). The prebiotic effectiveness was tested against the following: Saccharomyces boulardii (CBS5926), Lactobacillus casei (R0215) and Lactobacillus rhamnosus (DSM20021). To evaluate the prebiotic activity of the AM, the bacterial strains were grown in Brain Heart Infusion (BHI) broth.

2.12. Broth Micro-Dilutions Testing

The antimicrobial activity of the AM was tested by using the broth micro-dilutions (BMD) test according to the European Committee on Antimicrobial Susceptibility Testing (EUCAST) international guidelines. The activity of the AM was evaluated using broth media mentioned in the previous paragraph. We used 96-well plates to perform, in a volume of 50 μL, AM serial dilutions between 50% v/v (5 mL/L) and 1.56 v/v (0.156 mL/L). Subsequently, a suspension equal to 0,5 McFarland was adjusted in order to have a final concentration of 5 × 10⁵ CFU/mL. Then, 50 µL of this suspension was inoculated into each well. Plates were incubated overnight at 37 °C for 24 h and, after the incubation period, the minimum inhibitory concentration (MIC) values were evaluated. The MIC value is defined as the lowest concentration that completely inhibits the organism’s growth compared with the growth of the positive control (without treatment). To evaluate the minimum cytocidal concentrations (MCCs), 5 µL of the contents of each well was seeded into growth agar plate and incubated for 24 h at 37 °C for bacteria, or at 30 °C for yeast. The MCC was defined as the lowest concentration determining the death of 99.9% or more of the initial inoculum. Three different controls were included in each test: one positive, one negative, and one made with ethanol alone. All experiments were done in triplicate.

2.13. Growth Curve Testing

Serial dilutions of the AM were used to study its prebiotic effectiveness against L. rhamnosus, L. casei and Saccharomyces boulardii. Concentration between 25% v/v (2.5 mL/L) and 0.024% v/v (0.0024 mL/L) in Brain Heart Infusion (Sigma-Aldrich, Saint Louis, MO, USA) or Sabouraud broth were used for Lactobacillus spp. or yeast cultures, respectively. Tests were made in flat-bottom 96-well plates prepared as cited in paragraph 2.10. Briefly, a suspension of 0.5 McFarland was diluted in order to reach approximately 5 × 10⁵ CFU/mL in each well. Plates were incubated in a Cytation 5 Cell Imaging Multi-Mode Reader (Agilent, Santa Clara, CA, USA). The kinetics of the growth curve was obtained by measuring the OD values (ʎ = 630 nm) every 30 min. The incubation was performed at 37 °C, 5% CO2, on an orbital continuous shaker at 205 rpm. All assays were performed in triplicate, and positive and negative control were included.

2.14. Statistica Analysis

The mean and standard deviation (SD) of replicates were calculated. For TAC, statistical analysis was performed with XLSTAT 2023.1.1 (Addinsoft SARL, New York, NY, USA) software using Student’s t-test.

3. Results and Discussion

3.1. SPME-GC/MS: Chemical Volatile Composition of Spirulina

By the SPME-GC/MS technique, in the volatile fraction it was possible to identify twelve components listed in Table 1. The most abundant fraction was the hydrocarbon one with heptadecane as the main component (85.0%) followed by pentadecane (6.2%) and hexadecane (5.0%) but with a markedly lower relative percentage. Cis-geranylacetone (<0.1%) and trans-β-ionone (1.9%) were the only two terpene compounds found. Among the compounds detected in trace amounts, 2-propylfuran, a furan derivative, was also identified.
Hydrocarbons represent about half of the unsaponifiable fraction of spirulina. The presence of heptadecane (biogenic hydrocarbon) is particularly important as it is assumed to be an indicator of the cell density of cyanobacteria and green algae in the aquatic environment; in fact, it has been successfully used to reflect algal biomass in sedimentary studies [25]. An in vivo study also demonstrated the anti-inflammatory capacity of this volatile hydrocarbon thanks to its ability to modulate the activation of NF-kB [26]. A previous study also reported the presence of heptadecane as one of the main components in four different spirulina extracts from Egypt, obtained with solvents such as methanol, acetone, chloroform and petroleum ether by soaking treatment [27].
SPME-GC/MS technique has already been used successfully for the characterization of the volatile profile of dried hop leaves [28], highlighting how this analytical sampling and analysis technique is absolutely suitable for identifying a large pool of volatile metabolites emitted by natural products.

3.2. PTR-ToF-MS: Determination of Volatile Compounds from Spirulina

By the PTR analysis applied on the headspace of spirulina powders, a total of 41 tentatively identified compounds in the range of measured masses (27.022 m/z 157.129), were registered with average values above 1 ppbv. All the aroma compounds detected with their amounts (average of three replicates ± standard deviation) were reported in Table 2. Among these we found many typical class aroma compounds of microalgae such as furans, sulfides, alkanes, aldehydes, alcohols, ketones, esters and pyrazine, in agreement with many authors [29,30,31]. Overall, the signal detected at m/z 61.028 and identified as acetic acid which is a typical sour and pungent odor with low thresholds and high concentrations in many microalgae species was the most emitted compound [32]. The other higher emitted compounds were represented by methanol (m/z 33.033) which is characterized by a distinctive alcoholic odor similar to that of ethanol, acetaldehyde (m/z 45.033) which has green-like and hay-like odor notes, and propanal (m/z 59.049) with a pungent odor. All these mentioned compounds represent over 65% of the total emission (Table 2). On the contrary, all the other detected compounds show a significantly reduced emission level and often less than 1% of the total.
Among these we found signals linked to nitrogen compounds (m/z 80.050, 87.091, 95.061 and 109.076) and sulfur-containing compounds (m/z 49.011 and 91.057) that are abundant in dried seaweeds and are both related to fish odors [29,33]. In particular, sulfur compounds are associated with the aroma of marine crustaceans such as cooked shrimp/cooked seafood, marine and fishy odors, while the pyrazines tend to deliver nutty notes [34]. Among the chemical compounds with low emission rates are those linked to nitrogenous (m/z 80.050, 87.091, 95.061 and 109.076) and sulfurous ones (m/z 49.011 and 91.057) that are detected in dried seaweeds and are related to fish odors [34]. In particular, sulfur compounds have been associated with the aroma of marine crustaceans such as shrimp and cooked seafood, while pyrazines tend to provide nutty notes [34]. Also, the furans (m/z 83.083 and 97.085) which were detected in low amounts have been previously reported as characteristic aromas of microalgae [35].
PTR analysis has already been used in our previous work in order to detect the VOCs present, even in traces, in dried hop leaves [28]. Even in that case, this investigation technique proved to be particularly useful and adequate for identifying a high number of low-molecular-weight compounds characterizing the matrix under examination.

3.3. Fatty Acids Content

By GC-MS analyses of the dried spirulina extract, five fatty acids were detected and identified (Table 3). The saturated fraction (66.0%) exceeded the unsaturated one (34.0%). Palmitic acid (64.1%), linoleic acid (13.7%) and oleic acid (10.0%) were the most abundant followed by γ-linolenic (6.2%), palmitoleic (4.1%) and stearic acid (1.9%).
Our data partially agree with those of Mühling et al. [36], which reports palmitic, γ-linolenic and linoleic acids as the most abundant ones. It has also been hypothesized that fatty acid composition may be useful for differentiating different spirulina strains. Deyab et al. [37] carried out GC/MS analysis of the methanolic extract of A. platensis from Egypt and they revealed the presence of fatty acids such as hexadecanoic acid, 9,12,15-octadecadienoic methyl ester, and linolenic acid ester. Secondary phytochemical analysis carried out on the methanolic and petroleum ether extracts of spirulina from India, revealed the presence of myristic and palmitic acid and docosane 9-Octadecenal [38]. In another study, 37 varieties of spirulina available on the market and collected in different countries, such as the USA, Canada, Australia, the UK, India, New Zealand and Malaysia, were analyzed for comparative purposes, using gas chromatography and liquid chromatography to evaluate the presence of fatty acids, amino acids, sugars and polyphenols. The results demonstrated that the content of polyunsaturated fatty acids, compared to the other classes of compounds detected, was the one that varied most among the spirulina samples investigated [39].
The levels of fatty acids can be influenced by environmental factors; in fact, a previous study reported how, albeit with minimal variations, the content of fatty acids increased with increasing cultivation temperature, but the relative quantity of polyunsaturated fatty acids (PUFA) decreased [36]. Fatty acids are essential in the diet and can partially satisfy nutritional needs. Furthermore, they exert pharmacological effects and can be useful in the management of some diseases. In particular, polyunsaturated fatty acids (PUFA) play a key role in improving the immune function and reducing systemic inflammation [40].

3.4. Chemical Composition of Spirulina after the Derivatization Reaction

The GC-MS analyses conducted on the spirulina sample after derivatization allowed the identification of carbohydrates and alcohols (Table 4). Among these, the most abundant fraction was the sugar one with methyl galactoside (11.3%) and methyl-α-glucofuranoside (9.0%) being those with the highest relative percentages. Among the alcohols, sclareol (2.8%) was the most significant. Particularly interesting was the presence of glyceryl glucoside which exceeded 50%. This compound is a natural combination of glycerol and glucose. In nature it is found in various types of wine, red, rosé and white, as well as in Japanese foods [41]. It is currently used as a new molecule for hydrating ingredients; in fact, recent reports have suggested the role of glyceryl glucoside in the induction of the aquaporin-3 protein which is essential in the transport of water molecules across the skin cell membrane [42]. The beneficial effects on the skin translate into an increase in elasticity, a hydrating effect and a soothing effect against itching or burning [43].

3.5. Proximate Composition

The data found for spirulina’s proximal composition are shown in Table 5. It is well known that seaweeds, especially spirulina, typically have high protein and low lipid contents. Indeed, the protein content of the present sample was 54.84 g/100 g dw and the value is in line with the literature data [44,45]. Data in the same range as in the literature were also found for ash content, with the value of 6.99 g/100 g/dw [46]. Conversely, for the lipid content we found a lower value (0.27 g/100 g dw) in comparison to the USDA FoodData Central results (i.e., 7.72 g/100 g), although it was comparable with the results of Oliveira et al. [46], which reported a value fat content of 1.10% dry weight. Anyway, as already reported in the literature, it is known that nutritional content may depend on geographical area, year, season, and environmental conditions, as well as the food processing procedures [47].

3.6. Total Antioxidant Capacity (TAC) of Spirulina Samples Extracted with Different Solvents (PBS, MetOH 80%)

The TAC of spirulina samples was evaluated using two different extraction solutions (i.e., PBS and MetOH 80%) and two different methods based on different chemical reactions (i.e, FRAP and ABTS•+). In particular, FRAP assessed the reducing power, whereas ABTS•+ assessed the free radical scavenging activity. The data, reported in Table 6, showed that although comparable results between the two different extractions were found through FRAP analysis (although statistically higher for the extract in PBS in comparison to the MetOH 80% extract), ABTS•+ failed to find such values following lipophilic extraction in MetOH 80%. Therefore, as already reported in the literature [22], hydrophilic PBS extraction is confirmed as the most suitable for determining the TAC of spirulina samples.
Spirulina as a dietary supplement is known for its high antioxidant power [2]. Reactive oxygen species (ROS) attack and damage molecules in biological systems, causing various disorders and diseases. Therefore, considering that oxidative stress plays a key role in the evolution of many pathologies, much attention has recently been paid to natural products that are sources of molecules with high antioxidant potential such as spirulina. Several in vitro and in vivo studies have in fact demonstrated that spirulina significantly reduces oxidative stress. This antioxidant effect is mediated by many of its phytoconstituents [48].
The antioxidant activity values can vary depending on the investigated form of the spirulina (fresh or dried). In a previous comparative study, it was demonstrated that higher values were obtained starting from fresh material [49]. Exogenous factors can also induce changes in antioxidant potential. For example, it has been demonstrated that the increase in H2O2 levels, added as a supplement during the growth of algal cells, induced a significant increase in the activities of antioxidant enzymes including CAT, peroxidase (PX), SOD and ascorbate peroxidase (APx) [50]. In general, the amounts of these two enzymes increased under light stress conditions, although SOD was more sensitive to external stress than CAT [51].

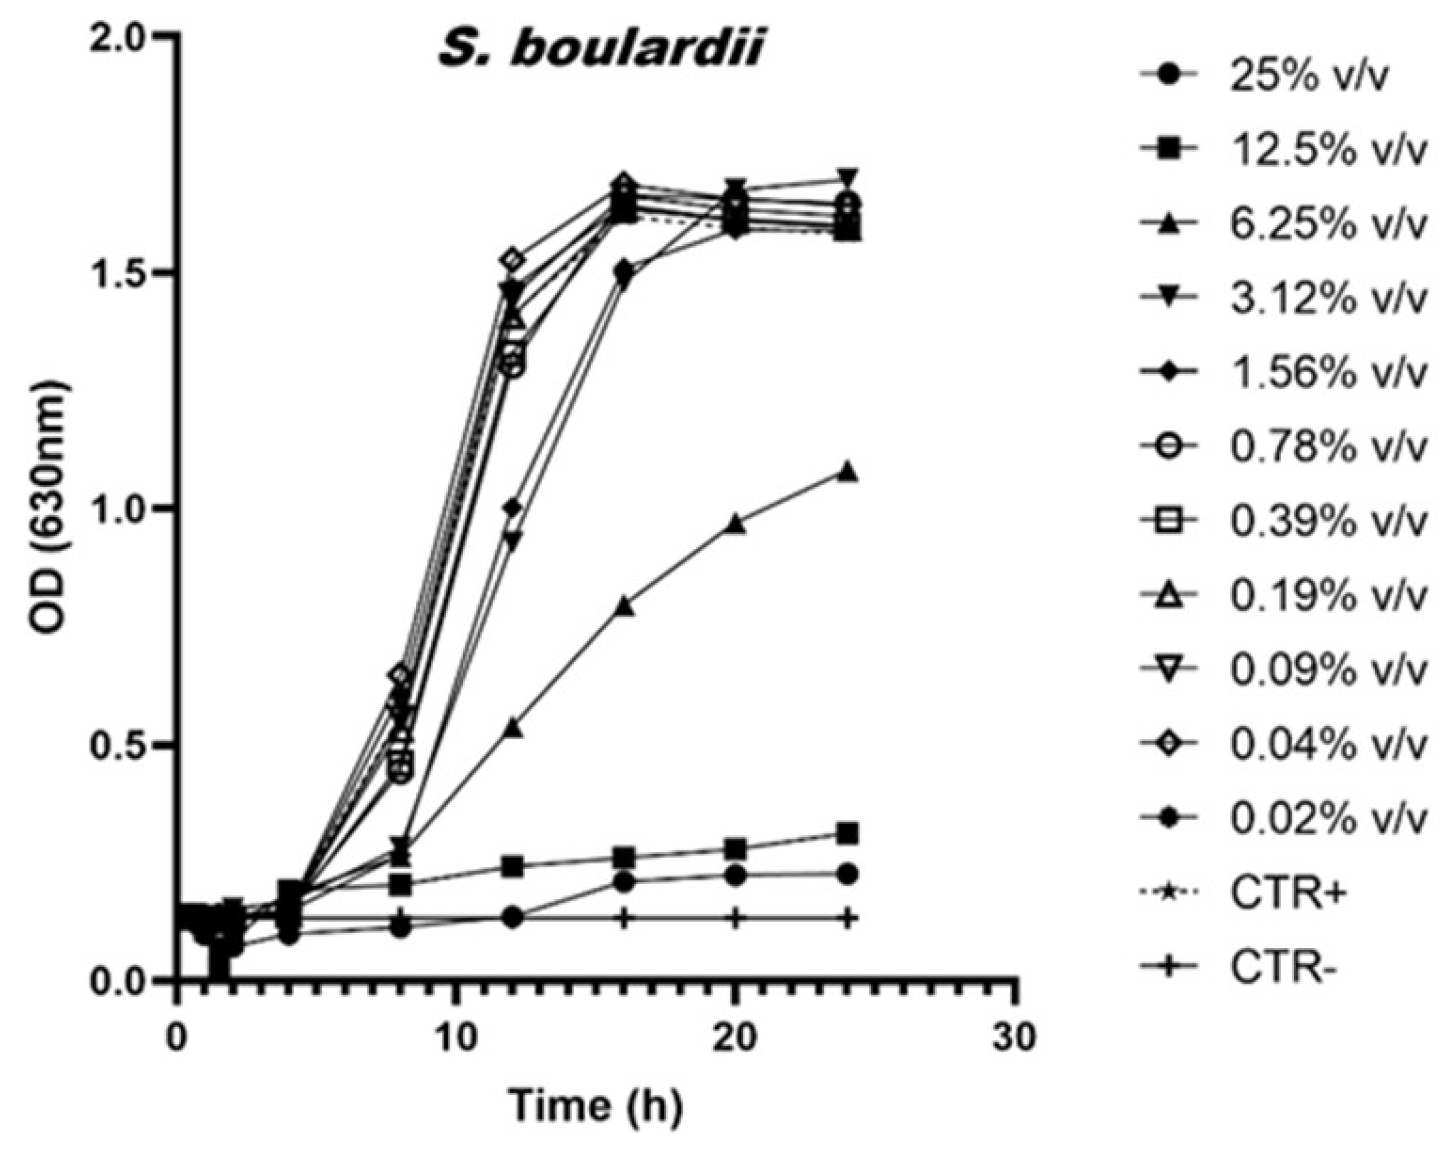
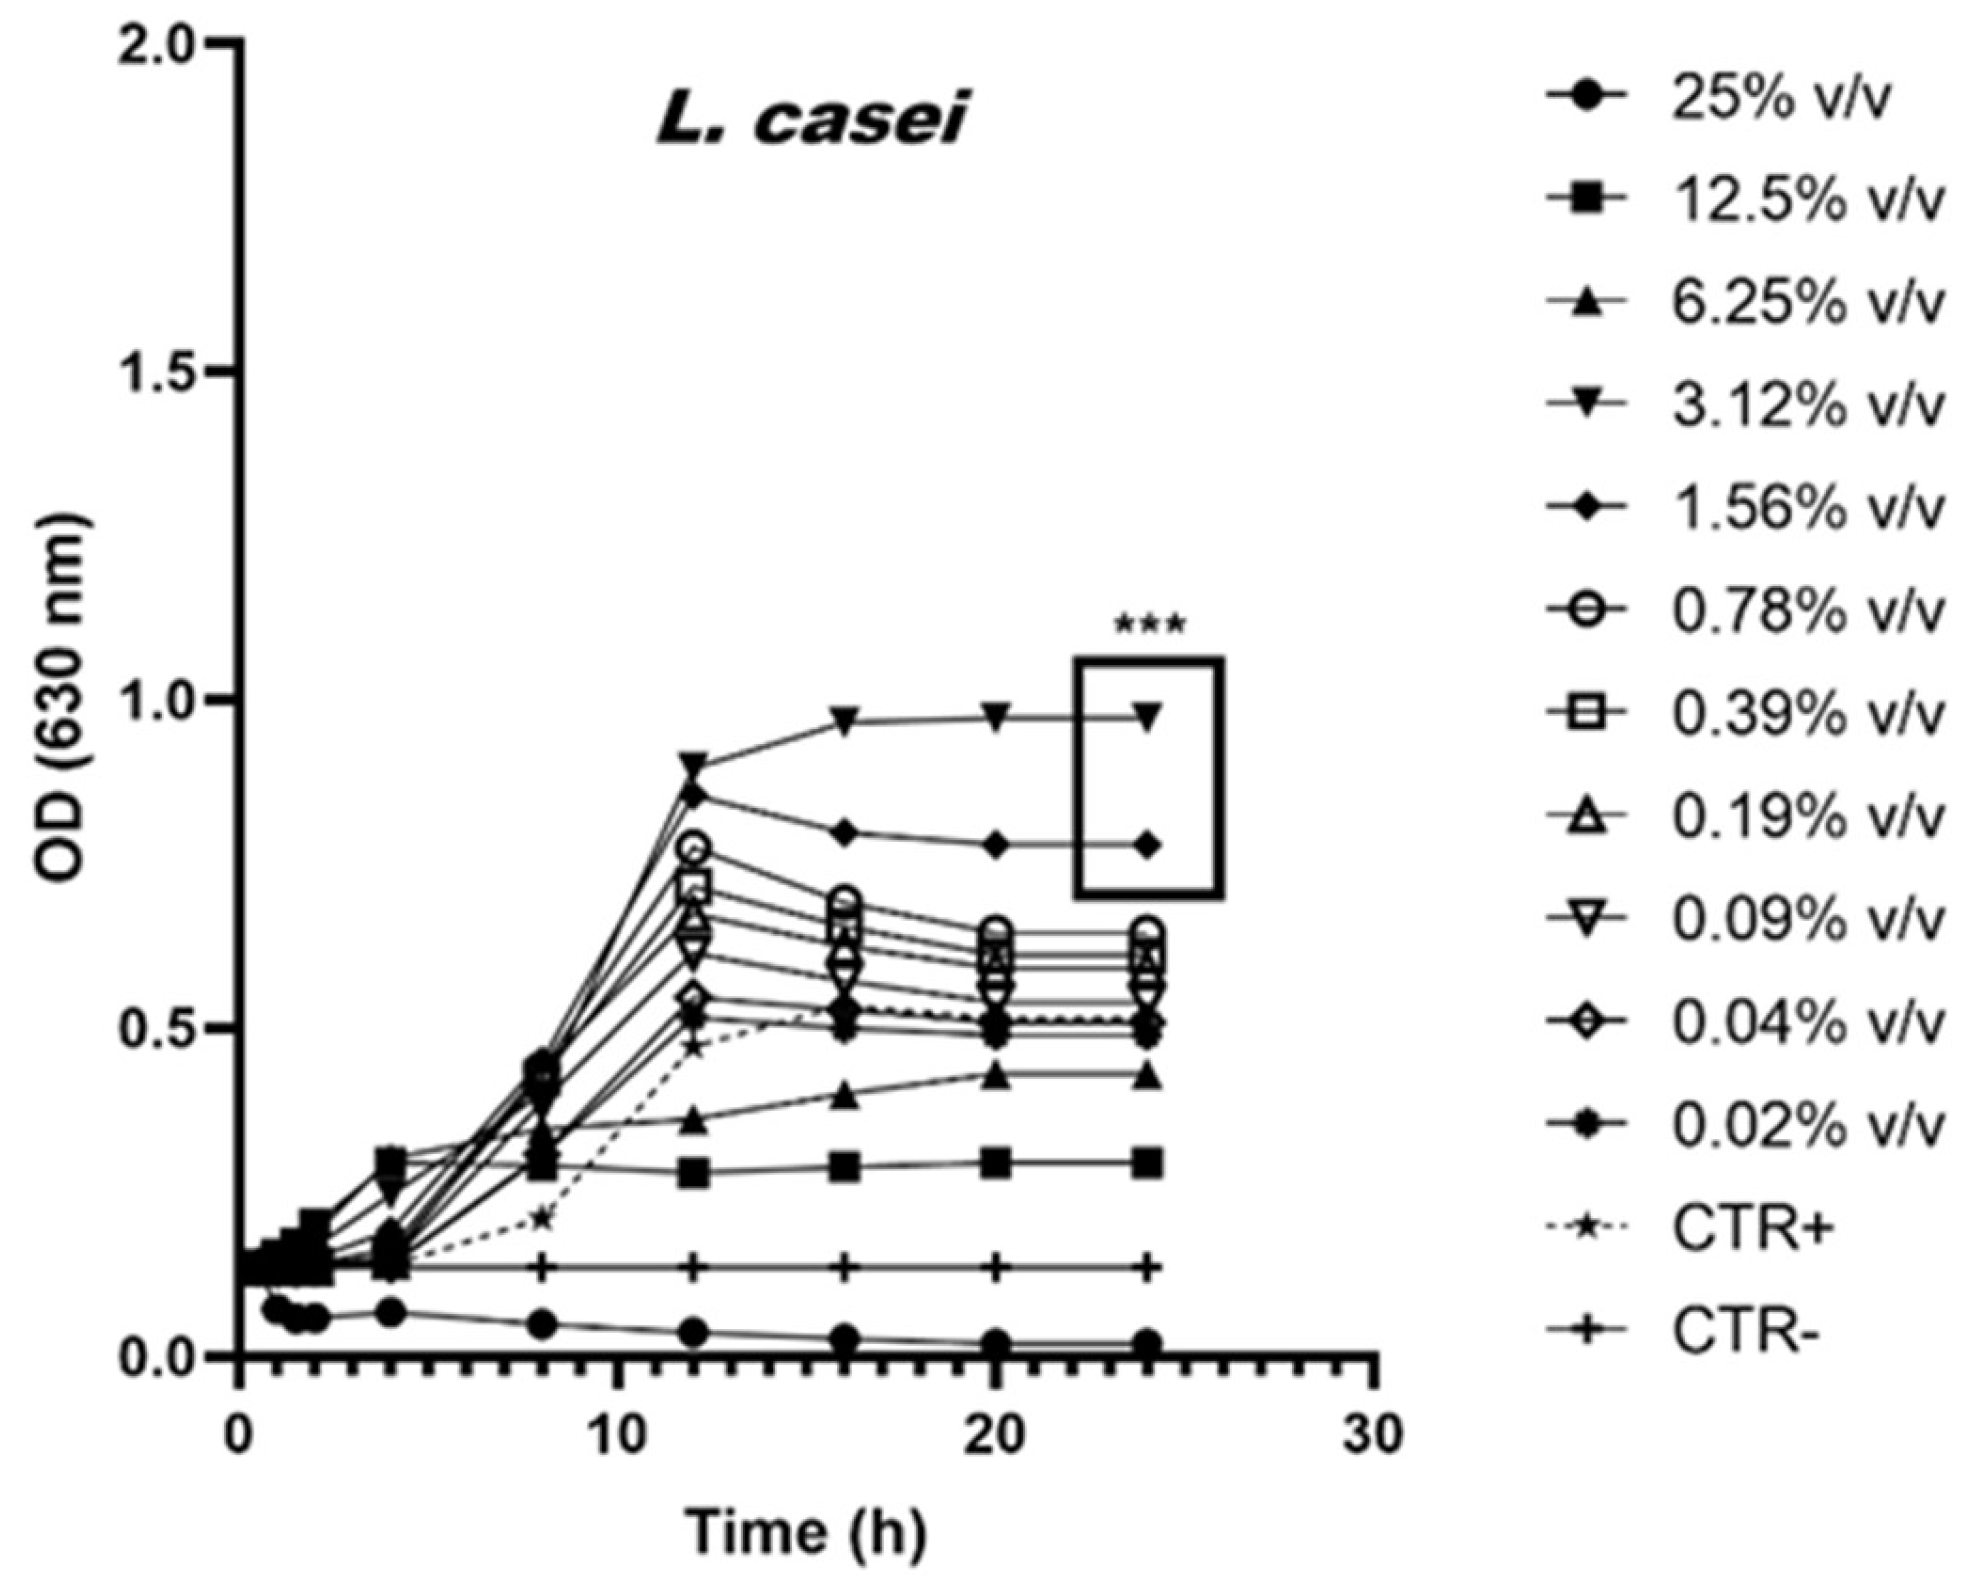
3.7. Antimicrobial Activity

The MIC and MCC values obtained with the AM or the solvent alone (EtOH) were reported in Table 7. The correspondence of the sensitivity obtained by testing the two compounds indicates that the inhibitory and cytocidal activity is given by the presence of EtOH and not by the active ingredients extracted from spirulina. The most susceptible strains were those of K. pneumonia and C. auris (MCC = 3.12% v/v), while the most resistant was that of E. faecalis (MCC = 25% v/v). To date, neither the mechanisms of action nor the active ingredients responsible for the antimicrobial activity are known in the literature.
To better illustrate the prebiotic effects induced by scalar dilutions of AM, the growth curves of the bacteria L. rhamnosus, L. casei and Saccharomyces boulardii are shown in Figure 1, Figure 2 and Figure 3.
In detail, Figure 1 illustrates the growth curves of S. boulardii in the presence of scalar dilutions of the AM. A rigorous statistical analysis reveals that concentrations below 6.25% v/v have no discernible impact on yeast growth. Conversely, treatments with concentrations equal to or exceeding 6.25% v/v significantly inhibit growth, demonstrating statistical significance at p < 0.0001.
Although L. rhamnosus shows a positive growth trend when incubated in the presence of AM concentrations lower than 0.78% v/v (Figure 2—boxed values), it also does not show statistically significant variations if compared to the positive control. On the contrary, AM concentrations greater than 12.5% v/v are toxic.
The L. casei strain has a different trend from previous strains. In fact, it is possible to identify three different activities of the various AM concentrations tested. Specifically, data show the following actions: toxic for concentrations equal to 25% v/v and 12.5% v/v, growth promoter (boxed values—p < 0.0005) for concentrations equal to 3.12% v/v and 1.56% v/v, and irrelevant for all other concentrations.
The data show that the anti-microbial activity detected against pathogenic strains is due exclusively to the ethanol content and not to the active ingredients extracted from the algae. On the contrary, some probiotic strains widely distributed on the market and used to produce functional foods, such as milks or fermented milks, are stimulated in the presence of low concentrations of this extract. At 24 h of incubation, data show an increase of 54% and 94% in the OD detected in the L. casei samples treated with concentrations equal to 1.56% v/v and 3.12% v/v, respectively. Similarly, the OD values shown by L. rhamnosus treated with AM concentrations equal to 0.78% v/v also show a growth increase of 61% with respect to the untreated control. Although further studies will be necessary to understand in detail the mechanism of action of the phytocomplex and the individual active ingredients of spirulina, the addition of AM to functional foods containing probiotics could have a prebiotic activity by facilitating the growth and beneficial effects of the microorganism when ingested through food. Finally, the AM, if integrated into milk or fermented milk-based foods, can contribute to the control of microbial growth. In fact, the growth-promoting concentrations for the probiotic strains of L. casei (<3.12% v/v and 1.56% v/v) are inhibitory against the pathogenic ones especially E. coli [52,53,54] and species belonging to the Pseudomonas genus [53,55,56], known to be able to infect milk and its derivatives.

4. Conclusions

In this study, for the first time, a multi-methodological approach was conducted to describe the chemical composition of dried spirulina flakes grown in Italy. The results highlighted the presence of a high number of low-molecular-weight molecules linked to the smell of spirulina, terpenes and biogenic hydrocarbons, both potentially bioactive, and also fatty acids, alcohols and sugars. This pool of compounds suggests how spirulina biomass can be considered a natural source of functional molecules. Furthermore, biological activity essays have demonstrated its antioxidant power and the growth-stimulating effect of some probiotic strains of spirulina-based alcoholic macerate. The collected data, which demonstrate the potential of Arthrospira platensis, can contribute to a more conscious use of this natural source of essential constituents in both the food and technological sectors.

Author Contributions

Conceptualization, S.G.; methodology, C.T., M.D.V., L.C., F.B. and S.G.; validation, C.T., M.D.V., L.C., F.B. and S.G.; formal analysis, C.T., M.D.M., L.C. and S.G.; investigation, C.T., M.D.V., M.D.M., L.C. and S.G.; resources, S.G.; data curation, C.T., M.D.V., L.C., F.B. and S.G.; writing—original draft preparation, C.T., M.D.V. and S.G.; writing—review and editing, C.T., M.D.V., L.C. and S.G.; supervision, N.M., M.S. and S.G. project administration, S.G.; funding acquisition, N.M., M.S. and S.G. All authors have read and agreed to the published version of the manuscript.

Funding

This research received no external funding.

Institutional Review Board Statement

Not applicable.

Informed Consent Statement

Not applicable.

Data Availability Statement

All data reported in this study are available within the article.

Acknowledgments

The authors are grateful to farm “Becagli”, Italy, for providing organic dried Arthrospira platensis.

Conflicts of Interest

The authors declare no conflict of interest.

References

  1. Guil-Guerrero, J.L.; Navarro-Juárez, R.; López-Martínez, J.C.; Campra-Madrid, P.; Rebolloso-Fuentes, M.M. Functional properties of the biomass of three microalgal species. J. Food Eng. 2004, 65, 511–517. [Google Scholar] [CrossRef]
  2. Wu, Q.; Liu, L.; Miron, A.; Klímová, B.; Wan, D.; Kuča, K. The antioxidant, immunomodulatory, and anti-inflammatory activities of Spirulina: An overview. Arch. Toxicol. 2016, 90, 1817–1840. [Google Scholar] [CrossRef] [PubMed]
  3. Varga, L.; Szigeti, J.; Kovacs, R.; Foldes, T.; Buti, S. Influence of a Spirulina platensis biomass on the microflora of fermented ABT milks during storage (R1). J. Dairy Sci. 2002, 85, 1031–1038. [Google Scholar] [CrossRef] [PubMed]
  4. Andrica, F.M.; Marți, T.D.; Pânzaru, I.; Coricovac, D.; Dehelean, C.; Drăgan, S. Preliminary study on the Evaluation of Spirulina on TPA induced Mouse Ear Inflammation. J. Agro Aliment. Process. Technol. 2015, 21, 268–273. [Google Scholar]
  5. Deepak Kumar, K.; Shalini Gaur, R.; Arpan, B.; Sunil, P. Nutritional, Functional, Textural and Sensory Evaluation of Spirulina Enriched Green Pasta: A Potential Dietary and Health Supplement. Foods 2022, 11, 979. [Google Scholar]
  6. De Marco, E.R.; Steffolani, M.E.; Martínez, C.S.; León, A.E. Effects of Spirulina biomass on the technological and nutritional quality of bread wheat pasta. LWT-Food Sci. Technol. 2014, 58, 102–108. [Google Scholar] [CrossRef]
  7. Pagnussatt, F.A.; Spier, F.; Bertolin, T.E.; Costa, J.A.V.; Gutkoski, L.C. Technological and nutritional assessment of dry pasta with oatmeal and the microalga Spirulina platensis. Braz. J. Food Technol. 2014, 17, 296–304. [Google Scholar] [CrossRef]
  8. Batista, A.P.; Niccolai, A.; Fradinho, P.; Fragoso, S.; Bursic, I.; Rodolfi, L.; Raymundo, A. Microalgae biomass as an alternative ingredient in cookies: Sensory, physical and chemical properties, antioxidant activity and in vitro digestibility. Algal Res. 2017, 26, 161–171. [Google Scholar] [CrossRef]
  9. Santos, T.D.; de Freitas, B.C.B.; Moreira, J.B.; Zanfonato, K.; Costa, J.A.V. Development of powdered food with the addition of Spirulina for food supplementation of the elderly population. Innov. Food Sci. Emerg. 2016, 37, 216–220. [Google Scholar] [CrossRef]
  10. Lucas, B.F.; de Morais, M.G.; Santos, T.D.; Costa, J.A.V. Spirulina for snack enrichment: Nutritional, physical and sensory evaluations. Lebensm. Wiss. Technol. 2018, 90, 270–276. [Google Scholar] [CrossRef]
  11. Taiti, C.; Stefano, G.; Percaccio, E.; Di Giacomo, S.; Iannone, M.; Marianelli, A.; Di Sotto, A.; Garzoli, S. Addition of Spirulina to Craft Beer: Evaluation of the Effects on Volatile Flavor Profile and Cytoprotective Properties. Antioxidants 2023, 12, 1021. [Google Scholar] [CrossRef] [PubMed]
  12. Soni, R.A.; Sudhakar, K.; Rana, R.S. Spirulina—From growth to nutritional product: A review. Trends Food Sci. Technol. 2017, 69, 157–171. [Google Scholar] [CrossRef]
  13. Gheda, S.; Abd El-Zaher, E.H.F.; Abou-Zeid, A.M.; Bedair, N.A.; Pereira, L. Potential Activity of Arthrospira platensis as Antioxidant, Cytotoxic and Antifungal against Some Skin Diseases: Topical Cream Application. Mar. Drugs 2023, 21, 160. [Google Scholar] [CrossRef] [PubMed]
  14. Hirata, T.; Tanaka, M.; Ooike, M.; Tsunomura, T.; Sakaguchi, M. Antioxidant activities of phycocyanobilin prepared from Spirulina platensis. J. Appl. Phycol. 2000, 12, 435–439. [Google Scholar] [CrossRef]
  15. Miranda, M.S.; Cintra, R.G.; Barros, S.B.M.; Mancini-Filho, J. Antioxidant activity of the microalga Spirulina maxima Brazilian. J. Med. Biol. Res. 1998, 31, 1075–1079. [Google Scholar] [CrossRef] [PubMed]
  16. Maddaly, R. The beneficial effects of spirulina focusing on its immunomodulatory and antioxidant properties. Nutr. Diet. Suppl. 2010, 2, 73–83. [Google Scholar] [CrossRef]
  17. Nezi, P.; Cicaloni, V.; Tinti, L.; Salvini, L.; Iannone, M.; Vitalini, S.; Garzoli, S. Metabolomic and Proteomic Profile of Dried Hop Inflorescences (Humulus lupulus L. cv. Chinook and cv. Cascade) by SPME-GC-MS and UPLC-MS-MS. Separations 2022, 9, 204. [Google Scholar] [CrossRef]
  18. Taiti, C.; Masi, E.; Cicaloni, V.; Vinciguerra, V.; Salvini, L.; Garzoli, S. SPME-GC-MS and PTR-ToF-MS Techniques for the Profiling of the Metabolomic Pattern of VOCs and GC-MS for the Determination of the Cannabinoid Content of Three Cultivars of Cannabis sativa L. Pollen. Molecules 2022, 27, 8739. [Google Scholar] [CrossRef]
  19. Farinon, B.; Costantini, L.; Molinari, R.; Di Matteo, G.; Garzoli, S.; Ferri, S.; Ceccantoni, B.; Mannina, L.; Merendino, N. Effect of Malting on Nutritional and Antioxidant Properties of the Seeds of Two Industrial Hemp (Cannabis sativa L.) Cultivars. Food Chem. 2022, 370, 131348. [Google Scholar] [CrossRef]
  20. Taiti, C.; Costa, C.; Guidi Nissim, W.; Bibbiani, S.; Azzarello, E.; Masi, E.; Pandolfi, C.; Pallottino, F.; Menesatti, P.; Mancuso, S. Assessing VOC emission by different wood cores using the PTR-ToF-MS technology. Wood Sci. Technol. 2017, 51, 273–295. [Google Scholar] [CrossRef]
  21. AOAC International. Official Methods of Analysis of AOAC International, 18th ed.; Current through Revision 1; AOAC International: Gaithersburg, MD, USA, 2006. [Google Scholar]
  22. Stunda-Zujeva, A.; Berele, M.; Lece, A.; Šķesters, A. Comparison of antioxidant activity in various spirulina containing products and factors affecting it. Sci. Rep. 2023, 13, 4529. [Google Scholar] [CrossRef] [PubMed]
  23. Molinari, R.; Costantini, L.; Timperio, A.M.; Lelli, V.; Bonafaccia, F.; Bonafaccia, G.; Merendino, N. Tartary Buckwheat Malt as Ingredient of Gluten-Free Cookies. J. Cereal Sci. 2018, 80, 37–43. [Google Scholar] [CrossRef]
  24. Benzie, I.F.; Strain, J.J. Ferric reducing/antioxidant power assay: Direct measure of total antioxidant activity of biological fluids and modified version for simultaneous measurement of total antioxidant power and ascorbic acid concentration. Methods Enzymol. 1999, 299, 15–27. [Google Scholar] [PubMed]
  25. He, Y.; Wang, T.; Xu, F. Can biogenic n-heptadecane be utilized to represent algae cell density dynamics in water environment? Evidences from field investigation and laboratory validation. Water Res. 2022, 214, 118219. [Google Scholar] [CrossRef]
  26. Kim, D.H.; Park, M.H.; Choi, Y.J.; Chung, K.W.; Park, C.H.; Jang, E.J.; An, H.J.; Yu, B.P.; Chung, H.Y. Molecular Study of Dietary Heptadecane for the AntiInflammatory Modulation of NF-kB in the Aged Kidney. PLoS ONE 2013, 8, e59316. [Google Scholar]
  27. Mohy El Din, S.M.; Hussein, M.H.; Hamouda, R.A.; Shehawy, M.A.; Abd El Maksoud, A.I. Bioactive Potentiality of Some Secondary Metabolites Extracted from Microalga Spirulina platensis. J. Chem. Pharm. Res. 2019, 11, 22–35. [Google Scholar]
  28. Taiti, C.; Di Matteo, G.; Spano, M.; Vinciguerra, V.; Masi, E.; Mannina, L.; Garzoli, S. Metabolomic Approach Based on Analytical Techniques for the Detection of Secondary Metabolites from Humulus lupulus L. Dried Leaves. Int. J. Mol. Sci. 2023, 24, 13732. [Google Scholar] [CrossRef]
  29. Van Durme, J.; Goiris, K.; De Winne, A.; De Cooman, L.; Muylaert, K. Evaluation of the volatile composition and sensory properties of five species of microalgae. J. Agric. Food Chem. 2013, 61, 10881–10890. [Google Scholar] [CrossRef]
  30. López-Pérez, O.; del Olmo, A.; Picon, A.; Nuñez, M. Volatile compounds and odour characteristics of five edible seaweeds preserved by high pressure processing: Changes during refrigerated storage. Algal Res. 2013, 53, 102137. [Google Scholar] [CrossRef]
  31. Uzlasir, T.; Isik, O.; Uslu, L.H.; Selli, S.; Kelebek, H. Impact of different salt concentrations on growth, biochemical composition and nutrition quality of Phaeodactylum tricornutum and Spirulina platensis. Food Chem. 2023, 429, 136843. [Google Scholar] [CrossRef]
  32. Gao, X.; Feng, T.; Liu, E.; Shan, P.; Zhang, Z.; Liao, L.; Ma, H. Ougan juice debittering using ultrasound-aided enzymatic hydrolysis: Impacts on aroma and taste. Food Chem. 2020, 345, 128767. [Google Scholar] [CrossRef] [PubMed]
  33. Zhou, L.; Chen, J.; Xu, J.; Li, Y.; Zhou, C.; Yan, X. Change of volatile components in six microalgae with different growth phases. J. Sci. Food Agric. 2017, 97, 761–769. [Google Scholar] [CrossRef] [PubMed]
  34. Moran, L.; Bou, G.; Aldai, N.; Ciardi, M.; Morillas-España, A.; Sánchez-Zurano, A.; Barron, L.J.R.; Lafarga, T. Characterisation of the volatile profile of microalgae and cyanobacteria using solid-phase microextraction followed by gas chromatography coupled to mass spectrometry. Sci. Rep. 2022, 12, 3661. [Google Scholar] [CrossRef] [PubMed]
  35. Milovanović, I.; Mišan, A.; Simeunović, J.; Kovač, D.; Jambrec, D.; Mandić, A. Determination of volatile organic compounds in selected strains of cyanobacteria. J. Chem. 2015, 2015, 969542. [Google Scholar] [CrossRef]
  36. Mühling, M.; Belay, A.; Whitton, B.A. Variation in fatty acid composition of Arthrospira (Spirulina) strains. J. Appl. Phycol. 2005, 17, 137–146. [Google Scholar] [CrossRef]
  37. Deyab, M.A.; El-Sheekh, M.M.; Hasan, R.S.A.; Elsadany, A.Y.; Abu Ahmed, S.E. Phytochemical Components of Two Cyanobacterial Local Strains. Sci. J. Damietta Fac. Sci. 2021, 11, 67–75. [Google Scholar] [CrossRef]
  38. Thangaraj, M.; Saravana, B.P.; Thanasekaran, J.; Joen-Rong, S.; Manubolu, M.; Pathakoti, K. Phytochemicals of algae, Arthospira platensis (spirulina) Chlorella vulgaris (chlorella) and Azolla pinnata (azolla). GSC Biol. Pharm. Sci. 2022, 19, 23–43. [Google Scholar] [CrossRef]
  39. Al-Dhabi, N.A.; Valan Arasu, M. Quantification of Phytochemicals from Commercial Spirulina Products and Their Antioxidant Activities. Evid. Based Complement. Altern. Med. 2016, 2016, 7631864. [Google Scholar] [CrossRef]
  40. Cohen, Z.; Vonshak, A.; Richmond, A. Fatty acid composition of Spirulina strains grown under various environmental conditions. Phytochemistry 1987, 26, 2255–2258. [Google Scholar] [CrossRef]
  41. Kumar, N.G.; Contaifer, D.; Madurantakam, P.; Carbone, S.; Price, E.T.; Van Tassell, B.; Brophy, D.F.; Wijesinghe, D.S. Dietary Bioactive Fatty Acids as Modulators of Immune Function: Implications on Human Health. Nutrients 2019, 11, 2974. [Google Scholar] [CrossRef]
  42. Takenaka, F.; Uchiyama, H. Synthesis of alpha-D-glucosylglycerol by alpha-glucosidase and some of its characteristics. Biosci. Biotechnol. Biochem. 2000, 64, 1821–1826. [Google Scholar] [CrossRef] [PubMed]
  43. Schrader, A.; Siefken, W.; Kueper, T.; Breitenbach, U.; Gatermann, C.; Sperling, G.; Biernoth, T.; Scherner, C.; Stäb, F.; Wenck, H.; et al. Effects of glyceryl glucoside on AQP3 expression, barrier function and hydration of human skin. Skin Pharmacol. Physiol. 2012, 25, 192–199. [Google Scholar] [CrossRef] [PubMed]
  44. Weber, T.M.; Kausch, M.; Rippke, F.; Schoerlermann, A.M.; Filbry, A. Treatment of xerosis with a topical formulation containing glyceryl glucoside, natural moisturizing factors, and ceramide. J. Clin. Aesthet. Dermatol. 2012, 5, 29–39. [Google Scholar] [PubMed]
  45. USDA. Food Data Central. 2022. Available online: https://fdc.nal.usda.gov/fdc-app.html#/food-details/170495/nutrients (accessed on 6 September 2023).
  46. Oliveira, B.C.C.; Machado, M.; Machado, S.; Costa, A.S.G.; Bessada, S.; Alves, R.C.; Oliveira, M.B.P.P. Algae Incorporation and Nutritional Improvement: The Case of a Whole-Wheat Pasta. Foods 2023, 12, 3039. [Google Scholar] [CrossRef] [PubMed]
  47. Wells, M.L.; Potin, P.; Craigie, J.S.; Raven, J.A.; Merchant, S.S.; Helliwell, K.E.; Smith, A.G.; Camire, M.E.; Brawley, S.H. Algae as Nutritional and Functional Food Sources: Revisiting Our Understanding. J. Appl. Phycol. 2017, 29, 949–982. [Google Scholar] [CrossRef] [PubMed]
  48. Upasani, C.D.; Balaraman, R. Protective effect of Spirulina on lead induced deleterious changes in the lipid peroxidation and endogenous antioxidants in rats. Phytother. Res. 2003, 17, 330–334. [Google Scholar] [CrossRef]
  49. Agustini, T.W.; Suzery, A.M.; Sutrisnanto, D.; Ma’Ruf, W.F.; Hadiyanto, H. Comparative Study of Bioactive Substances Extracted from Fresh and Dried Spirulina sp. Procedia Environ. Sci. 2015, 23, 282–289. [Google Scholar] [CrossRef]
  50. Abd El-Baky, H.H.; El Baz, F.K.; El-Baroty, G.S. Enhancement of antioxidant production in Spirulina platensis under oxidative stress. Acta Physiol. Plant 2009, 31, 623–631. [Google Scholar] [CrossRef]
  51. Qing, R.; Ye, H.; Lan, L.; Fu, H. Study of the activity of two antioxidant enzymes of Spirulina maxima under excessive light stress. J. Sichuan Univ. 2003, 40, 565–569. [Google Scholar]
  52. Bagel, A.; Sergentet, D. Shiga Toxin-Producing Escherichia coli and Milk Fat Globules. Microorganisms 2022, 10, 496. [Google Scholar] [CrossRef]
  53. Quigley, L.; O’Sullivan, O.; Stanton, C.; Beresford, T.P.; Ross, R.P.; Fitzgerald, G.F.; Cotter, P.D. The complex microbiota of raw milk. FEMS Microbiol. Rev. 2013, 37, 664–698. [Google Scholar] [CrossRef] [PubMed]
  54. Farrokh, C.; Jordan, K.; Auvray, F.; Glass, K.; Oppegaard, H.; Raynaud, S.; Thevenot, D.; Condron, R.; De, R.K.; Govaris, A.; et al. Review of Shiga-toxin-producing Escherichia coli (STEC) and their significance in dairy production. Int. J. Food Microbiol. 2013, 162, 190–212. [Google Scholar] [CrossRef] [PubMed]
  55. Li, X.; Gu, N.; Huang, T.Y.; Zhong, F.; Peng, G. Pseudomonas aeruginosa: A typical biofilm forming pathogen and an emerging but underestimated pathogen in food processing. Front. Microbiol. 2023, 25, 1114199. [Google Scholar] [CrossRef] [PubMed]
  56. Machado, S.G.; Baglinière, F.; Marchand, S.; Van Coillie, E.; Vanetti, M.C.; De Block, J.; Heyndrickx, M. The Biodiversity of the Microbiota Producing Heat-Resistant Enzymes Responsible for Spoilage in Processed Bovine Milk and Dairy Products. Front. Microbiol. 2017, 8, 302. [Google Scholar] [CrossRef]
Figure 1. Growth curves of S. boulardi in the presence of scalar dilutions of the AM. The control is indicated with the dotted line.
Applsci 14 00067 g001
Figure 2. Growth curves of L. rhamnosus in the presence of scalar dilutions of the AM. The control is indicated with the dotted line.
Applsci 14 00067 g002
Figure 3. Growth curves of L. casei in the presence of scalar dilutions of the AM. The control is indicated with the dotted line. (*** p < 0.0005).
Applsci 14 00067 g003
Table 1. Chemical composition (percentage mean values ± standard deviation) of vapor phase of spirulina.
COMPONENT 1LRI 2LRI 3Spirulina (%)
1trans-diisopropylethylene709713tr
22-propylfuran785793tr
35-heptenal, 2,6-dimethyl-10381044tr
42,5-dimethylcyclohexanol108610900.1 ± 0.02
5β-cyclocitral11901197tr
6cis-geranylacetone14311427tr
7trans-β-ionone146514601.9 ± 0.03
8pentadecane150915126.2 ± 0.06
92(4H)-benzofuranone, 5,6,7,7a-tetrahydro-4,4,7a-trimethyl-152015250.3 ± 0.02
10hexadecane160916125.0 ± 0.04
118-heptadecene167516801.4 ± 0.05
12heptadecane1709171185.0 ± 2.15
SUM 100.0
1 The components are reported according to their elution order on apolar column; 2 Linear Retention Indices measured on apolar column; 3 Linear Retention indices from literature; tr: percentage means values < 0.1.
Table 2. Headspace composition (compounds number, mass charge, chemical formula, tentative identification, average emission ± standard deviation, percentage emission for each signal detected) of spirulina powder identified by PTR-ToF-MS. Data were expressed as average of three replicates (±SD) and as % of the total emission.
Componentm/zChemical FormulaTeantative IdentificationAverageSD%
127.022C2H3+Acetylene34.998.472.33
233.033CH5O+Methanol241.5237.4716.08
341.038C3H5+Alkylic fragment63.7614.624.24
443.018C2H3O+Aldehyde fragment123.5812.598.23
545.033C2H5O+Acetaldehyde178.2637.1811.87
647.049C2H7OEthanol18.831.51.25
749.011CH5S+S Compound (methanethiol)9.480.50.63
855.054C4H7+Fragment24.352.781.62
957.069C4H9+Alcohol fragment40.329.732.68
1059.049C3H7O+Propanal142.2724.859.47
1161.028C2H5O2+Acetic acid414.3244.9227.58
1267.054C5H7+Fragment2.550.320.17
1369.069C5H9+1,3-Pentadiene14.950.971.00
1471.049C4H7O+Butenal8.630.690.57
1573.064C4H9O+Propanal, 2-methyl24.533.91.63
1675.044C3H7O2+Acetol1.60.210.11
1779.049C6H7+Benzene3.590.430.24
1880.05C5H6N+Pyrazyne6.592.240.44
1981.073C6H9+C6 fragments4.310.330.29
2083.083C5H7O+2-Methylfuran7.412.690.49
2185.06C5H9O+1-Penten-3-one/2-Pentenal4.751.950.32
2287.044C4H7O2+Diacetyl4.411.060.29
2387.091C4H11N2+Piperazine11.792.850.78
2489.059C4H9O2+Ethyl acetate/Butanoic acid4.870.760.32
2591.057C4H11S+Butanethiol5.410.960.36
2695.061C5H7N2+Pyrazine, methyl-22.143.511.47
2797.085C6H9O+Furan, 2-ethyl3.470.280.23
28103.075C5H11O2+Cyclopentanedecol1.650.450.11
29107.049C7H7O+Benzaldehyde4.480.250.30
30109.076C6H9N2+2,6-Dimethylpyrazine29.172.31.94
31111.1C8H15+1-Methylcycloheptene2.740.220.18
32113.1C6H9O2+3-methylcyclopentanedione2.350.870.16
33115.1C7H15O+Heptanal1.780.540.12
34123.105C8H11O+Dimethylphenol/Ethylphenol5.011.430.33
35125.106C8H13O+(Z)-1,5-octadien-3-one1.830.750.12
36127.111C8H15O+1,5-Octadien 3-ol2.360.950.16
37137.122C6H17O3+Unknown7.241.540.48
38139.121C9H15O+Isophorone/Furan, 2-Pentyl-8.391.480.56
39151.111C10H15O+Safranal3.570.870.24
40153.134C10H17O+B-Cyclocitral7.421.260.49
41157.129C6H20O4+Unknown1.430.380.10
Total Emission1502.10231.05100.00
Table 3. FAs content (percentage mean value ± standard deviation) of the transesterified extract, as determined by GC–MS.
COMPONENT 1LRI 2LRI 3(%)
1palmitoleic acid, C16:1n7192519304.1 ± 0.02
2palmitic acid, C16:01981197364.1 ± 1.15
3γ-linolenic acid, C18:3n6213821436.2 ± 0.03
4linoleic acid, C18:2n62155215213.7 ± 0.12
5oleic acid, C18:1n92165217110.0 ± 0.03
6stearic acid, C18:0218321781.9 ± 0.03
SUM100.0
Saturated FAs66.0
Unsaturated FAs34.0
1 The components are reported according to their elution order on apolar column (VF-1ms); 2 Linear Retention Indices measured on apolar column; 3 Linear Retention indices from literature.
Table 4. Chemical composition (percentage values) of spirulina dried flakes after derivatization, as determined by GC–MS.
Components(%)
Carbohydrates
1methyl α-glucofuranoside9.0 ± 0.05
2methyl galactoside11.3 ± 0.09
33-α-mannobiose4.2 ± 0.04
42-α-mannobiose3.2 ± 0.02
5ribofuranose2.9 ± 0.03
6trehalose1.9 ± 0.10
7glyceryl glucoside55.5 ± 0.21
Alcohols
8sclareol2.8 ± 0.05
9gycerol0.5 ± 0.02
10adipol 2EH1.2 ± 0.06
Table 5. Proximal composition (g/100 g dry weight).
Protein 1FatCarbohydrate 2Ashkcal/100 g dwkJ/100 g dw
54.84 ± 0.130.27 ± 0.0137.906.99 ± 0.009373.391562.29
Data are means ± standard deviation of two (n = 2) replicates; 1 Conversion factor: 6.25. 2 As difference (i.e., 100 − (g [protein +fat + ash] in 100 g of dry weight sample)).
Table 6. TAC values.
ABTS•+
mmol TE/g DW
FRAP
mmol Fe2+E/g DW
PBS5.96 ± 0.13 a5.28 ± 0.29 a
MetOH 80%0.92 ± 0.05 b4.34 ± 0.30 b
FRAP: ferric reducing antioxidant power. ABTS•+: radical scavenging activity assays. TE: Trolox equivalent. Data are means ± standard deviation of three (n = 3) replicates. Means with different letters in the same column are significantly different (Student t-test, p < 0.05).
Table 7. MIC and MCC values.
MIC 1 (% v/v)MCC 2 (% v/v)
Bacterial StrainAMEtOHAMEtOH
S. aureus3.123.1212.512.5
E. coli1.561.566.256.25
P. aeruginosa3.123.126.256.25
K. pneumoniae0.780.783.123.12
E. faecalis1.563.122525
C. albicans1.561.563.123.12
1 Minimal Inhibitory Concentration, 2 Minimal Cytocidal Concentration.
Disclaimer/Publisher’s Note: The statements, opinions and data contained in all publications are solely those of the individual author(s) and contributor(s) and not of MDPI and/or the editor(s). MDPI and/or the editor(s) disclaim responsibility for any injury to people or property resulting from any ideas, methods, instructions or products referred to in the content.

