Article

Study of Modified Primary Compression Index Tests and a Regression Model for Municipal Solid Waste Considering the Temperature Effect

1
Key Laboratory of Ministry of Education for Geomechanics and Embankment Engineering, Hohai University, Nanjing 210024, China
2
Geotechnical Engineering Research Institute, Hohai University, Nanjing 210024, China
*
Author to whom correspondence should be addressed.
Appl. Sci. 2024, 14(1), 348; https://doi.org/10.3390/app14010348
Submission received: 24 November 2023 / Revised: 15 December 2023 / Accepted: 25 December 2023 / Published: 29 December 2023

Abstract

:
The modified primary compression index (MPCI) of municipal solid waste (MSW) is an important parameter for describing the primary consolidation settlement of MSW. It is beneficial to calculate the settlement and storage capacity of landfills accurately by calculating the MPCI of MSW correctly. This article studies the primary consolidation compression characteristics and influencing factors of MSW through a consolidation experiment considering temperature control. The experimental results show that the MPCI increases with an increase in temperature, decreases with an increase in dry weight, increases with an increase in water content, and increases with an increase in organic matter content. According to the above findings, an MPCI regression fitting model was established. The reliability and accuracy of the model was validated by the experimental results of the indoor bioreactor test considering temperature control.

1. Introduction

The settlement of municipal solid waste (MSW) is an important issue that needs to be considered carefully during the design, construction, and operation of sanitary landfills, as excessive settlement of MSW affects the storage capacity and safe operation of the landfill [1,2]. The settlement of MSW includes three parts: primary compression settlement, secondary compression settlement, and degradation settlement. Primary compression settlement accounts for a large proportion of the total settlement, especially before the closure of the landfill [3,4]. Consequently, studying the law of MSW settlement and calculating the primary compression settlement are important for predicting the total settlement of the landfill accurately.
Domestic and overseas researchers have conducted plenty of research works on the law of MSW primary compression settlement. The MPCI (modified primary compression index), which is related to the dry weight, sample composition, pore ratio, moisture content, and size, is an important parameter that describes the primary compression characteristics of MSW. The MPCI decreases with an increase in dry weight, increases with an increase in water content, and increases with an increase in organic matter content [5,6,7,8]. While little research has been conducted on the influence of temperature on MSW primary compression, it can be concluded that temperature has a significant impact on the primary compression of soil based on the existing literature [9,10,11,12]. MSW contains kitchen, plastic, fabric, paper, and rubber matter and other components which are more sensitive to temperature compared to soil. Therefore, the primary compression of MSW will be affected by temperature, and studying the effect of temperature on MSW primary compression is greatly significant.
Therefore, it is important to predict landfill settlement accurately and estimate landfill storage capacity correctly by studying the influence of parameters such as temperature, moisture content, dry weight, and composition on the MPCI. Currently, there is little research on how these parameters, especially the temperature, affect the MPCI. Some researchers have established a multi-parameter model to predict the MPCI through indoor experiments [13], but they did not consider the impact of temperature, and the prediction effect needs to be improved.
Accordingly, the main contributions of this article are as follows: (1) we conducted an MSW consolidation test considering temperature control and degradation inhibition to obtain the MPCI of the samples; (2) analyzed the effect of parameters such as temperature, dry weight, organic matter content, and moisture content on the MPCI according to the results of the test and literature to create an MPCI regression model; (3) and validated the reliability and accuracy of the model with the results of an indoor bioreactor test considering temperature control.

2. Equipment, Materials, and Methods

2.1. Equipment

The equipment used in this test is a consolidation instrument with a temperature-controlling device installed, as shown in Figure 1. The equipment consists of two parts: a consolidation instrument and a temperature-controlling device.
The consolidation instrument includes a consolidation container, pressure equipment, and deformation measurement equipment. The consolidation container consists of a cutting ring, retaining ring, permeable stone, and top cap. The load application method used was lever-type loading, and the loading ratio was 1:24. The pressure range was 0~400 kPa. The cutting ring used is 61.8 mm in diameter and 20 mm in height. The mechanical dial gauge used to read the strain of the sample has a maximum range of 10 mm and accuracy of 0.01 mm.
The temperature-controlling device includes a temperature controller, temperature control room, heating belt, and temperature sensor. The consolidation container of the consolidation instrument was placed in a temperature control room, and a heating belt was densely wrapped around external surface of the temperature control room. We formed a miniature water bath in the temperature control room by adding water into the room through the water inlet to heat the samples stably.
As shown in Figure 2, the sample room of the bioreactor is made of organic glass and is 57.2 cm in diameter and 200 cm in height. The layered settlement of the sample could be read by the surveyor’s rod on the outer wall of the organic glass sample room. A 10 cm thick gravel layer was arranged on the pressure-bearing bottom plate, which was chosen to be a perforated plate to drain leachate. The top of the sample was mechanically loaded with an accuracy of 0.1 kPa. The outer wall of the sample room was densely wrapped with the heating belt to control the boundary temperature during testing.
The functions of the device are as follows:
  • This device can provide a stable boundary temperature for the sample through the temperature control device.
  • The device can simulate the stress and settlement of MSW at different depths by applying different loads, and the load is stable and controllable.
  • This device can collect leachate and gas during the experiment through the leachate collection system and gas collection system. At the same time, water or leachate can be reinjected through the reinjection port.
  • This device can detect the pore gas pressure, pore water pressure, and temperature during the experiment due to installed observation instruments such as pore pressure sensors, thermometers, and a tensiometer.

2.2. Materials

The composition of MSW is very complex, and there is no standard ratio. As shown in Table 1, Chinese MSW has a relatively high content of kitchen matter, similarly to developing countries such as India and Brazil, and the paper content is lower than that in the MSW of developed countries such as France, Japan, and America. The reason for this difference is that each country has different levels of economic development, different living habits, and different legal provisions. In European and American countries, kitchen matter is generally first crushed by household shredders and then discharged into urban sewage systems through household sewage pipes, which do not enter the landfill system. European and American countries consume nearly half of the world’s paper, accounting for about 10% of the world’s population. Therefore, in Europe and America, the proportion of kitchen is smaller and the proportion of paper matter is relatively larger in MSW landfills; this characteristic is most typical in the United States.
The moisture content and the free water level of landfills in China are generally higher than those of European and American countries. The reason for this is that due to the imperfect design and construction of the leachate drainage system in existing landfills in China, there is a considerable proportion of pipeline blockage. Therefore, a high kitchen matter proportion, a high moisture content, and a small paper matter proportion are considered to make up typical Chinese MSW.
The test samples used wheat bran to represent the kitchen component in MSW considering the convenience and comparability of results based on existing research results. Organic matter contents of 30%, 60%, and 80% were determined for the three proportions, that is, low-organic-matter-content MSW (L-MSW), medium-organic-matter-content MSW (M-MSW), and high-organic-matter-content MSW (H-MSW). The sample proportions are shown in Table 2.
Each sample was manually crushed to a particle size of ≤5 mm. First, the mass of each proportion was weighed according to the calculation results based on the sample parameters; second, the samples were filled into the cutting ring using the layered compaction method; third, filter paper and permeable stone were placed on the upper and lower layers of the sample after filling; and finally, we put all of this into a stacked saturator and placed the stacked saturator into the vacuum saturator to induce saturation, which lasted 12 h. SOPP (Sodium orthophenylphenoxide, C12H9NaO) solution has the best inhibiting degradation effect when the mass ratio is 6%, according to the conclusion of our research group, so the saturated water and added water of the samples in the test included SOPP solution with a 6% mass ratio. The sample will be placed into the consolidation instrument when sample preparation are completed. The temperature controller was activated, with the temperature set to the predetermined temperature, and the sample was preheated for 48 h under the predetermined temperature after adding SOPP solution to the temperature control room. The initial states of L-MSW, M-MSW, and H-MSW are shown in Table 3.

2.3. Method

The test consisted of a total of 9 groups: 3 organic content groups with controlled temperatures of 20 °C, 30 °C, and 40 °C. During the test, the load was applied step by step with values of 25 kPa, 50 kPa, 100 kPa, 200 kPa, and 400 kPa. According to existing research, the duration of MSW primary consolidation compression in consolidation tests is 8 h [22], so each level of loading time was 8 h in the test. The value of the dial gauge was regularly read to record the settlement after the test started.
The calculation formula for MPCI ( C c ) is as follows:
C c = ε p l o g σ v
where ε p is the primary compression strain of MSW and σ v is vertical stress.
The primary and secondary compression processes of soil complied with the first-order rate equation curve and semi-logarithmic curve, respectively, so we can fit the primary and secondary compression of soil using a semi-logarithmic curve and a first-order rate equation curve (FORE), respectively. The intersection of the two curves is the boundary between the primary compression and the secondary compression; the abscissa of this point is the duration of primary compression and the ordinate of this point is primary compression strain [23]. This method was applied to determine the settlement stage of MSW and achieved ideal results [13].
This article uses the first-order rate equation curve and the semi-logarithmic curve to find the primary and secondary compression boundary points of MSW and to determine the duration of primary compression ( t E O P ) and primary compression strain ( ε E O P ), which are shown in Figure 3.

3. Experimental Results and Discussion

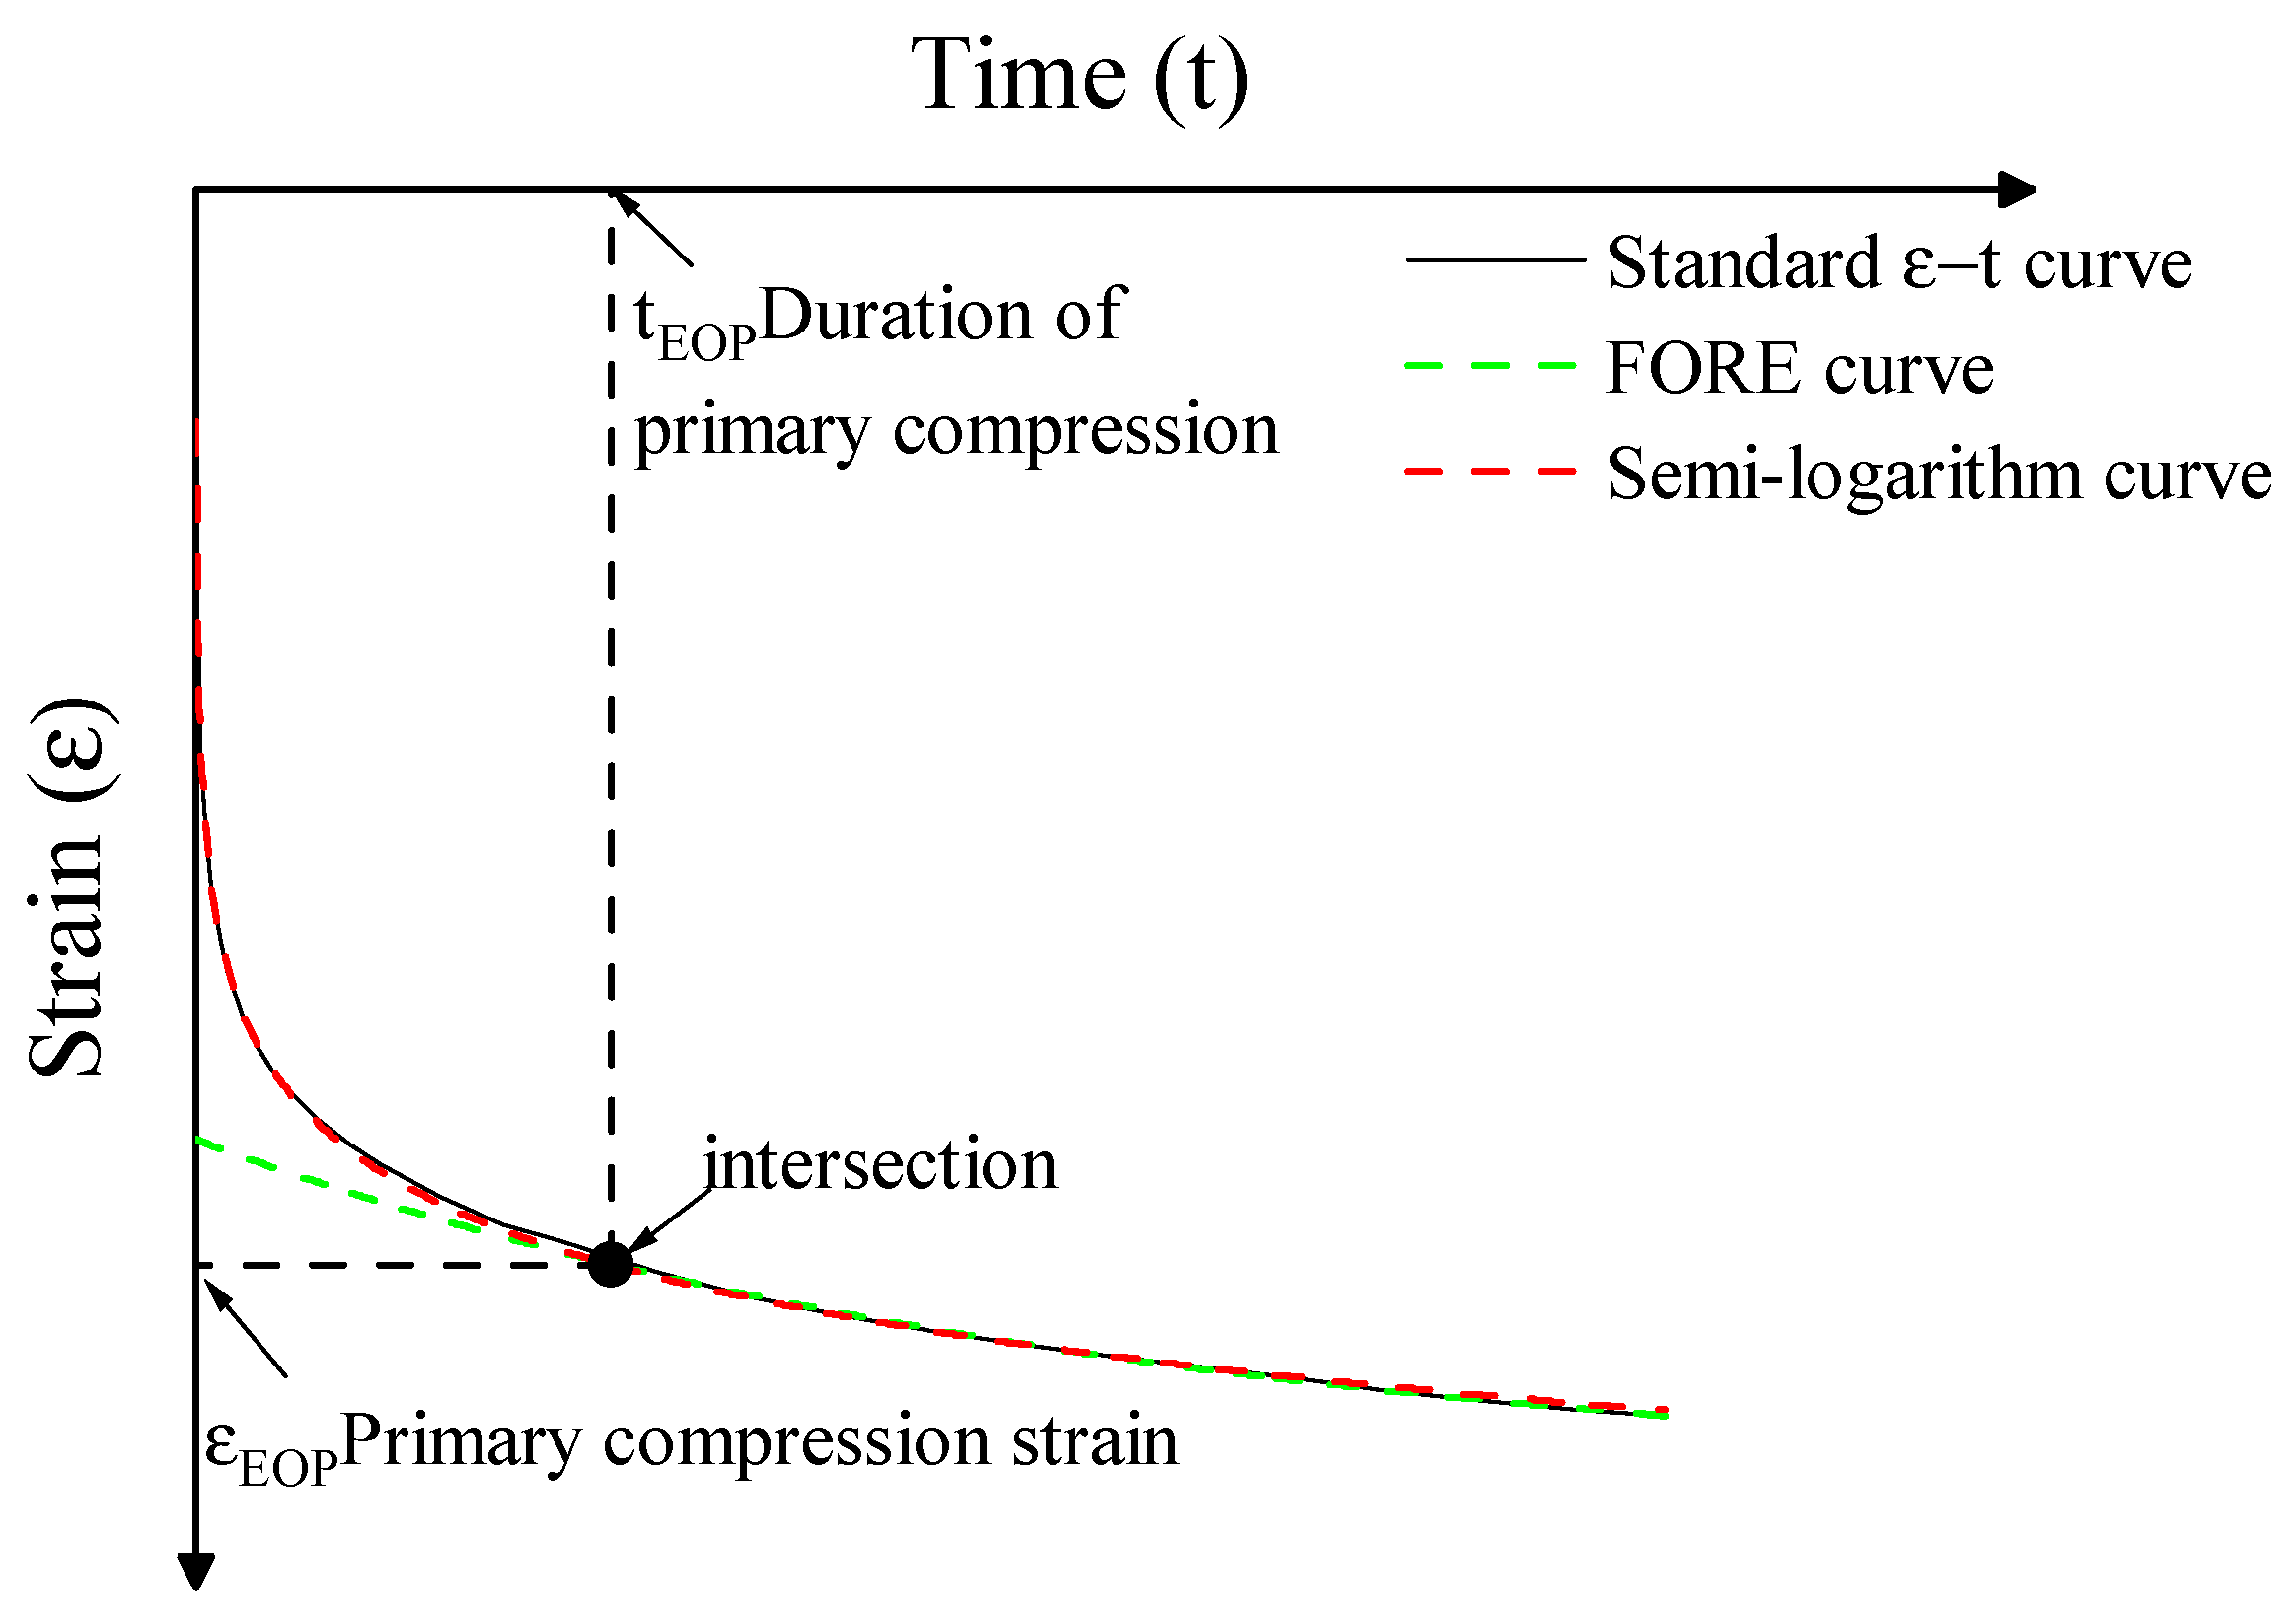
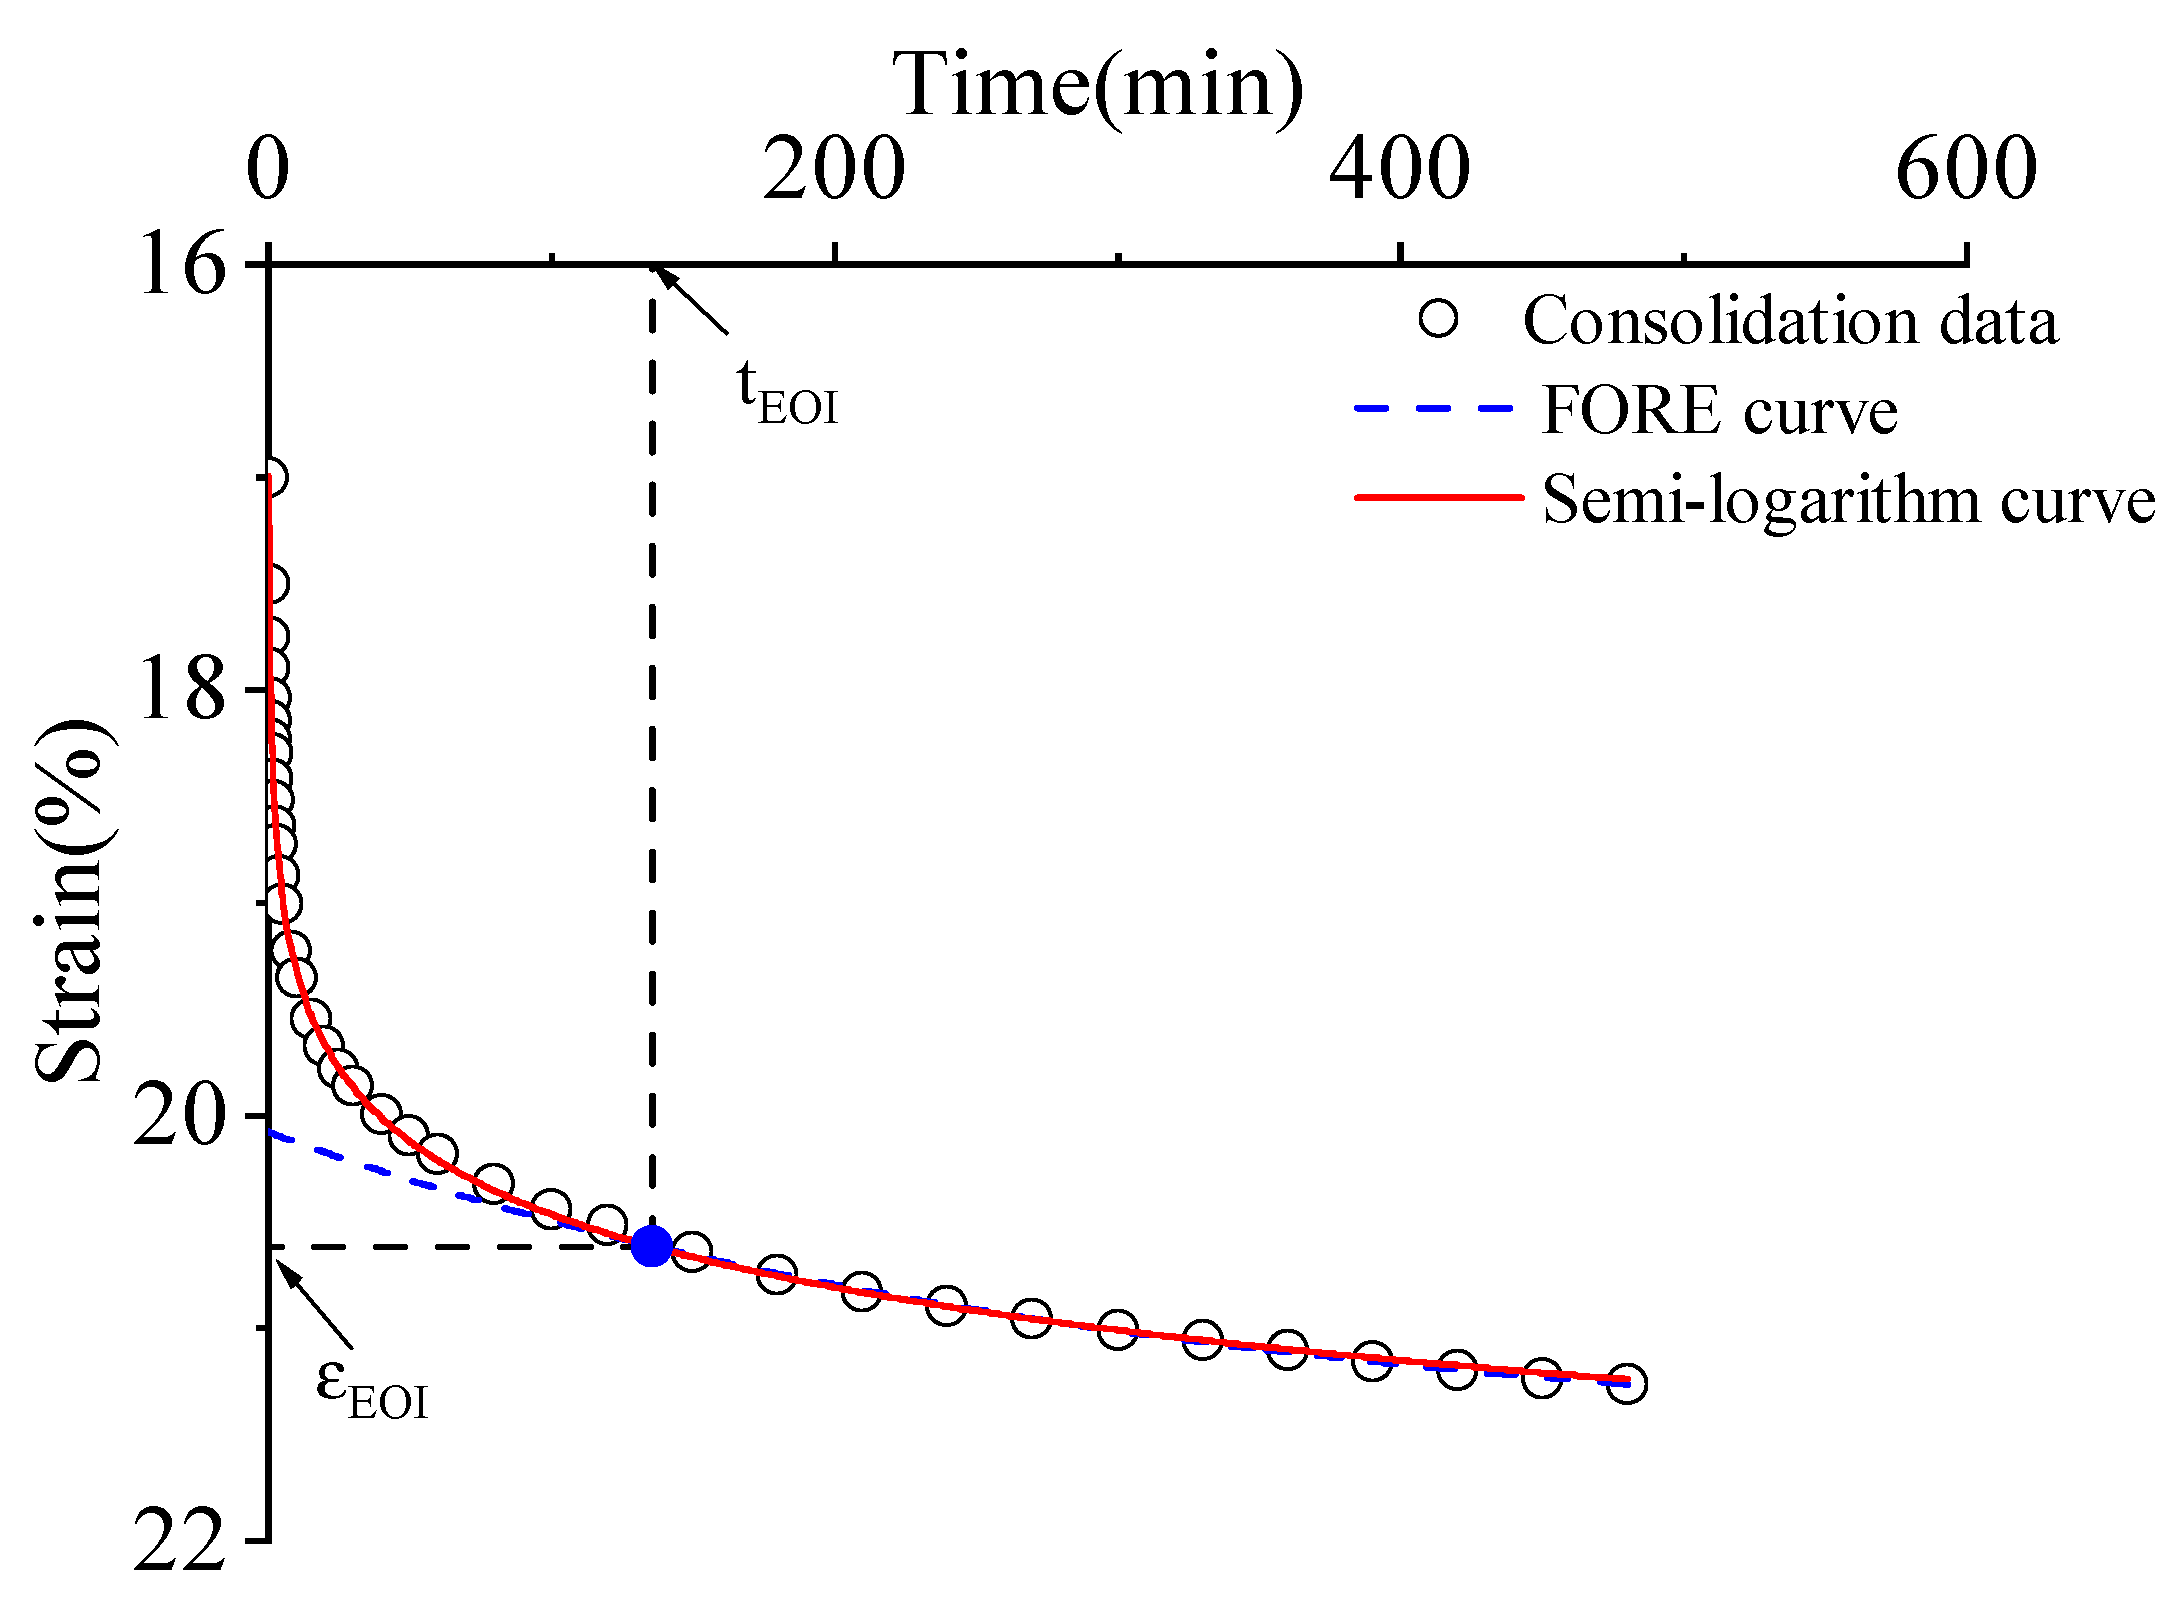
3.1. Determining the End Time of Primary Consolidation

Figure 4 shows the process of determining the end time of primary consolidation for M-MSW under 30 °C and 100 kPa stress. We can fit the primary and secondary compression of MSW using the semi-logarithmic curve, indicated by the red solid line, and the first-order rate equation curve (FORE), indicated by blue dashed line, respectively, in the figure. The intersection of the two curves is the boundary between the primary compression and the secondary compression; the abscissa of this point is the duration of primary compression and the ordinate of this point is the primary compression strain, which was 130.86 min and 20.598%, respectively.

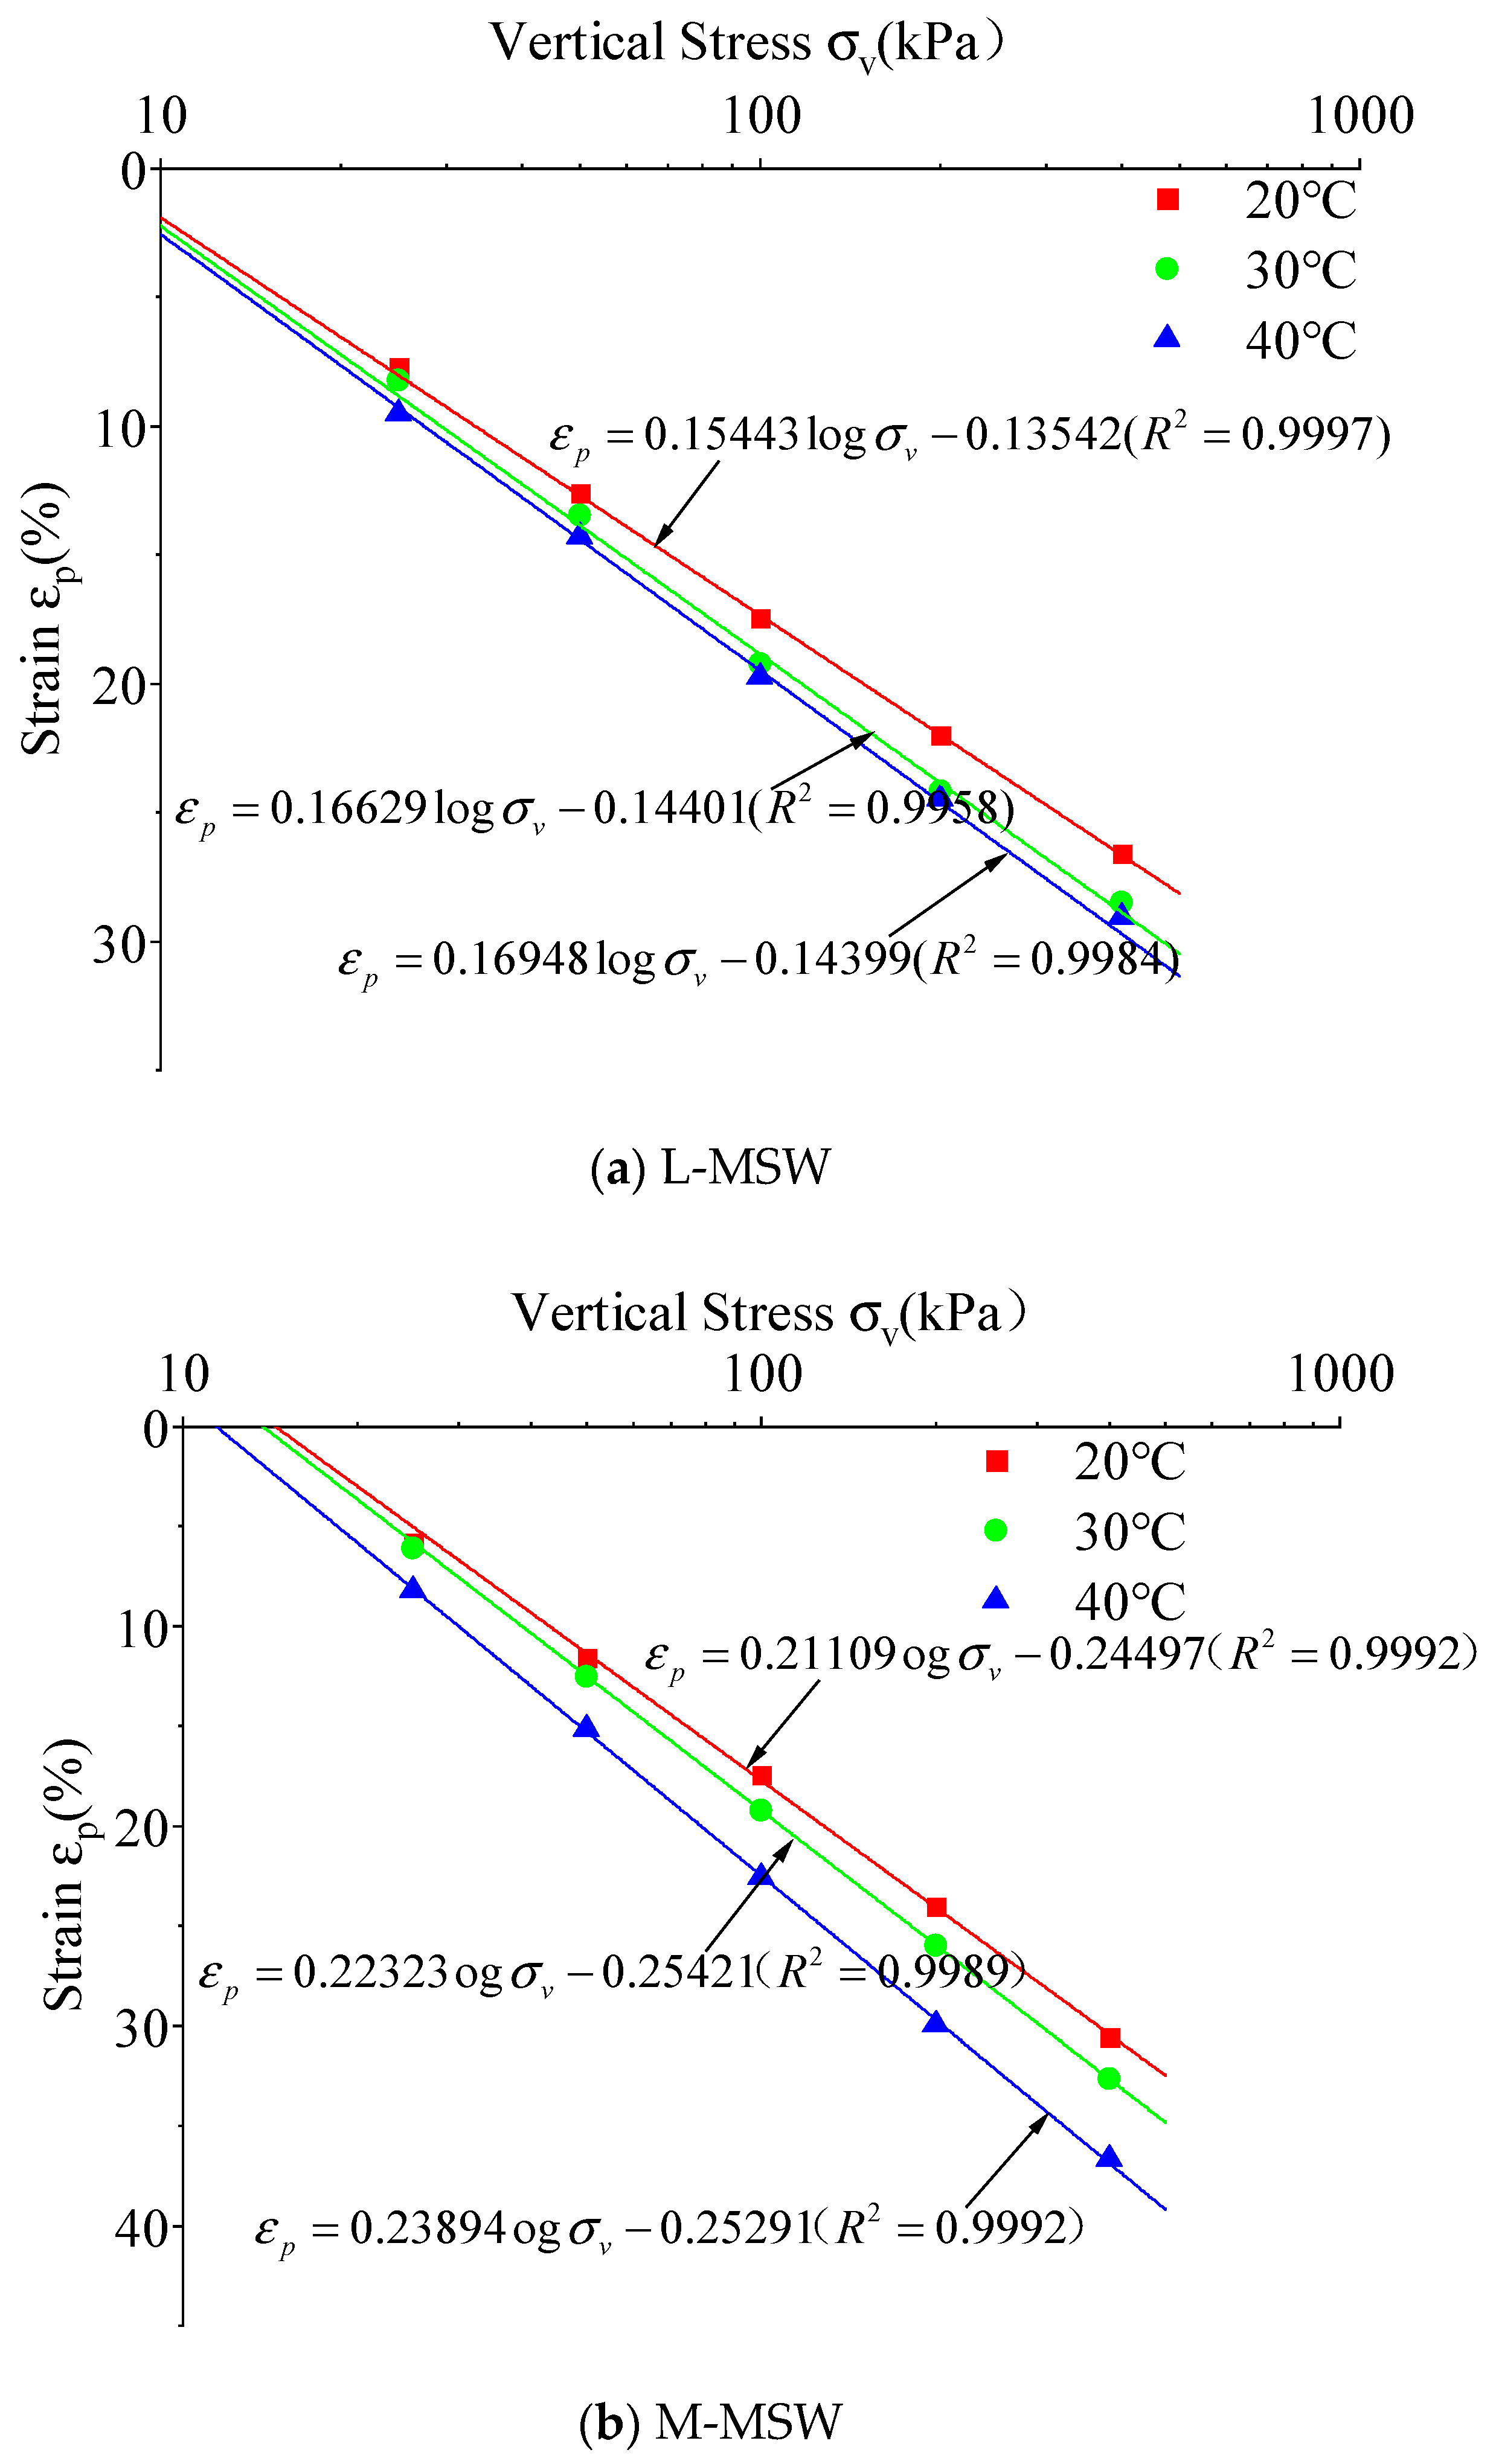
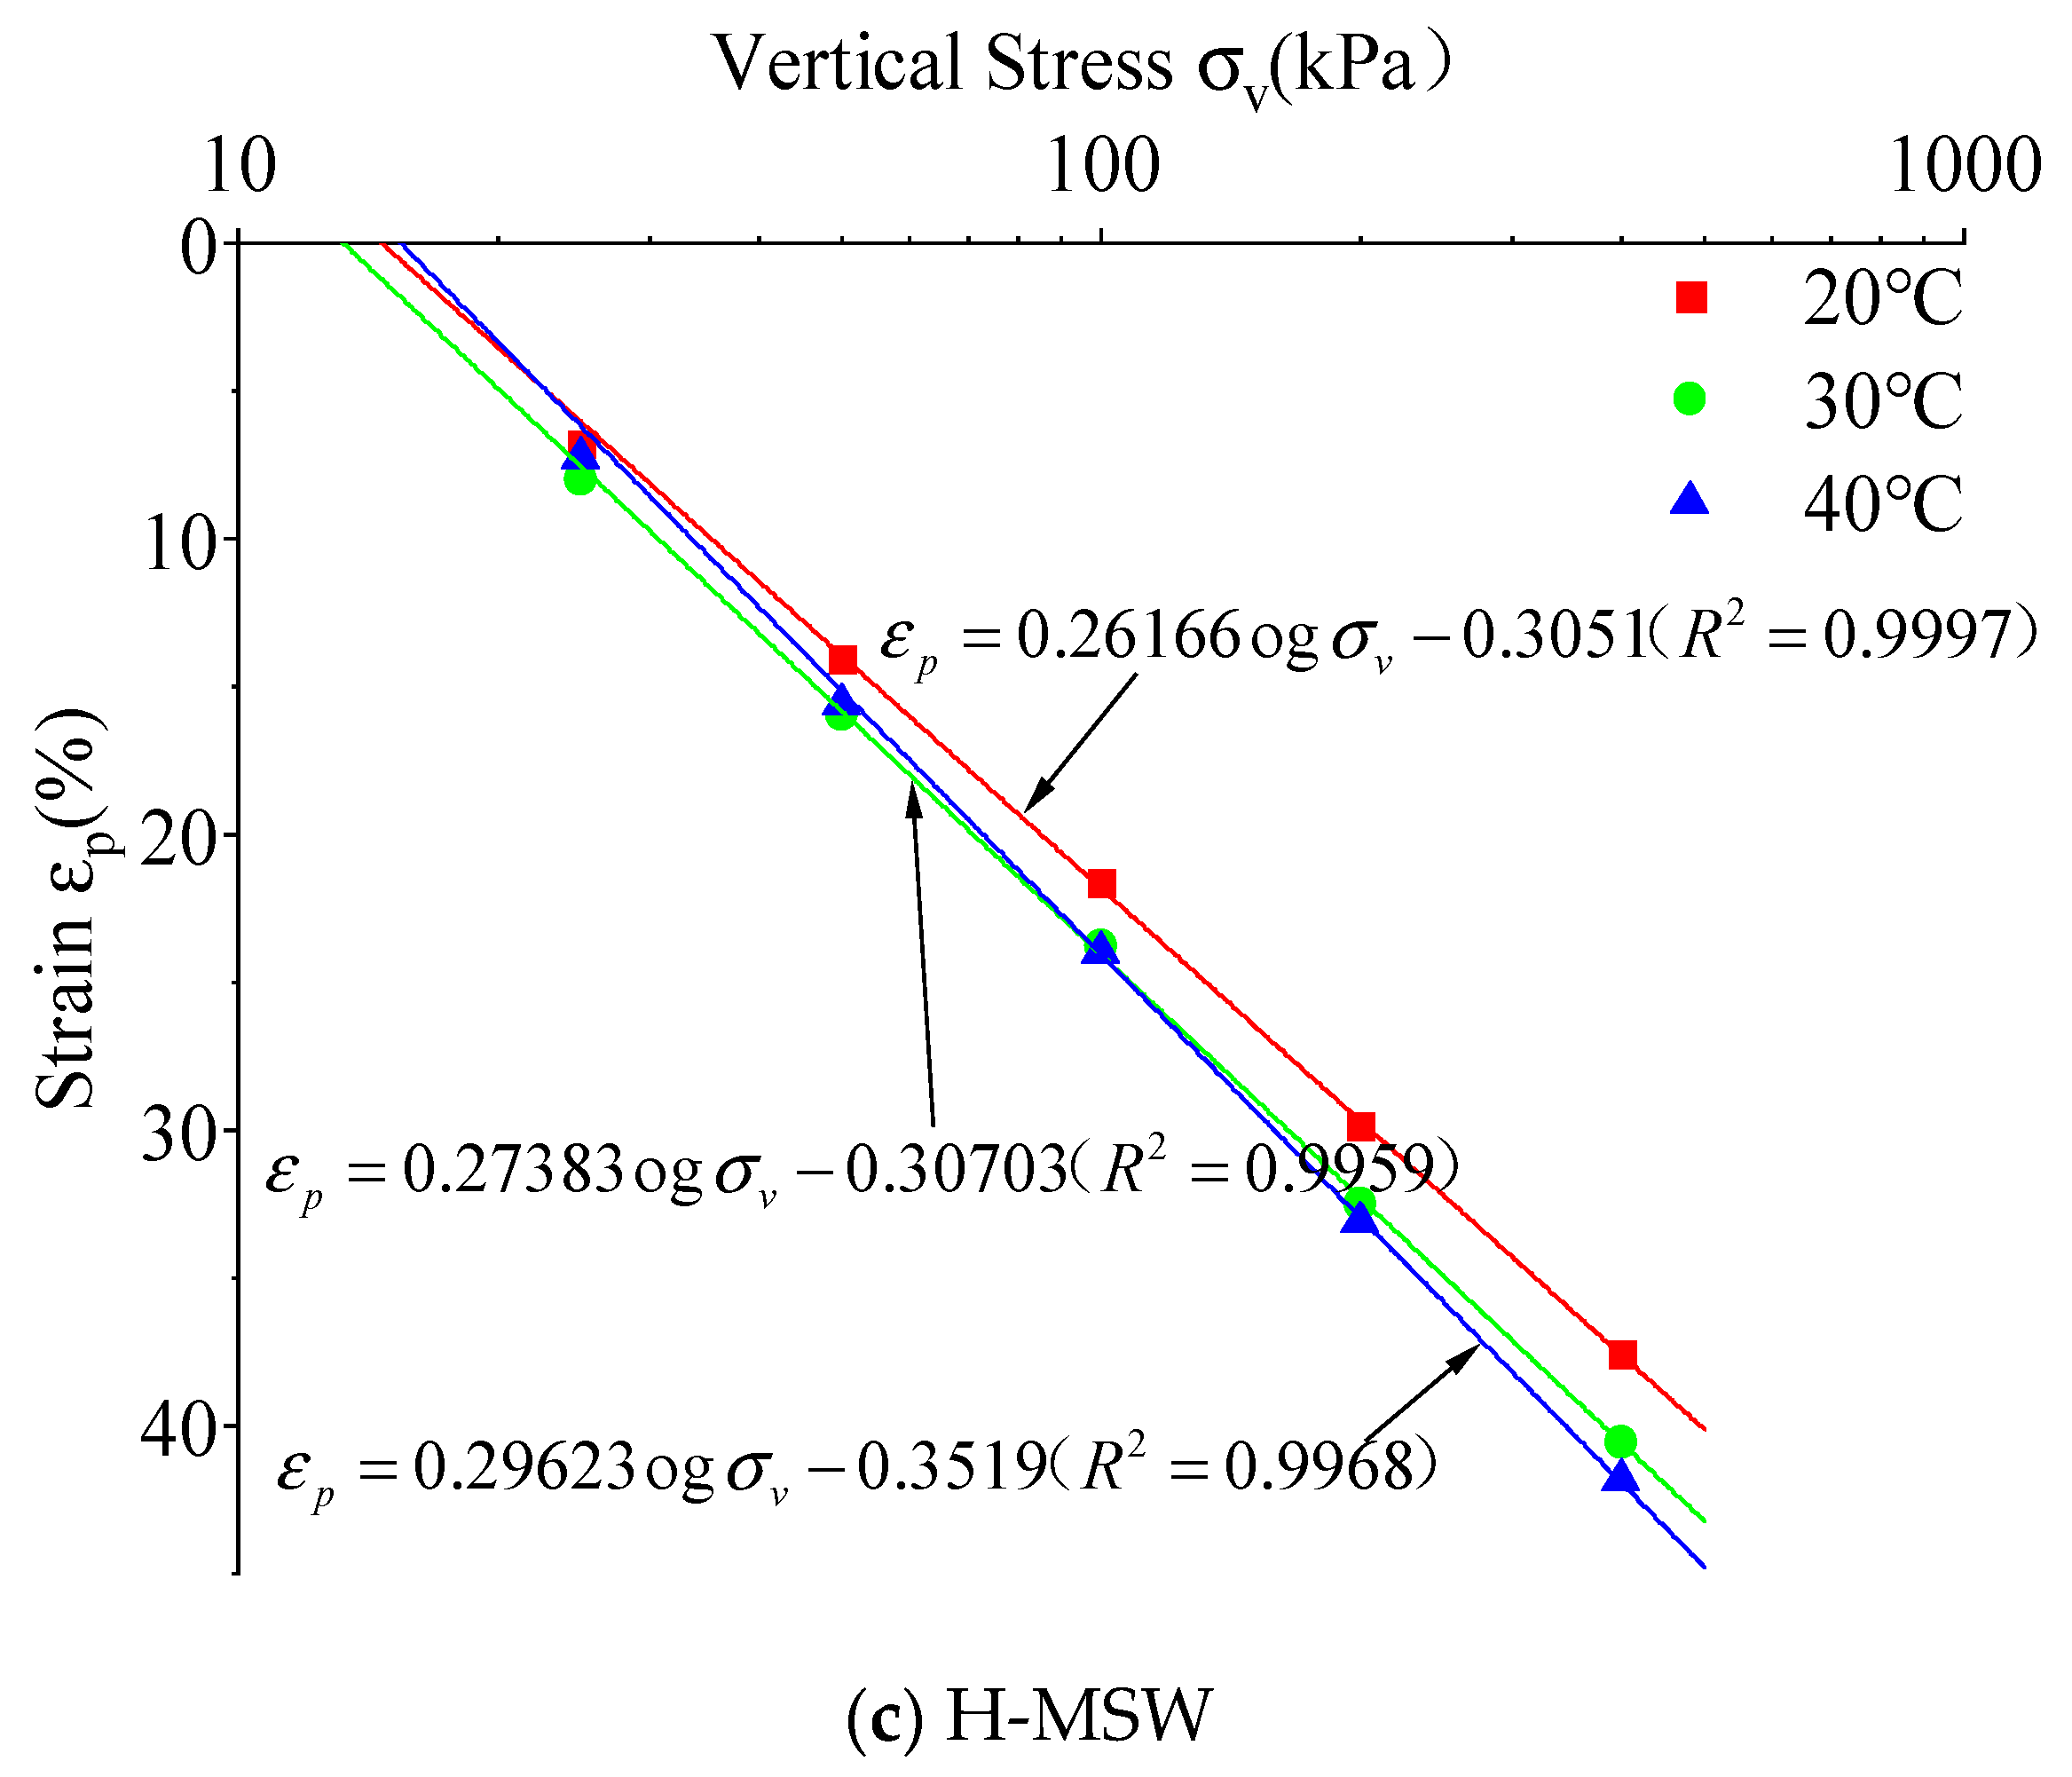
3.2. Analysis Results of Consolidation Test

Figure 5 shows the curves between the primary compression strain ε p and stress σ v of L-MSW, M-MSW, and H-MSW specimens under different temperatures. Here, you can see that the primary compression strain and logarithm of stress exhibited a linear relationship under different temperatures in each group of samples. As the stress on the specimens increased from 25 kPa to 400 kPa with temperatures of 20 °C, 30 °C, and 40 °C, the primary compression strain of L-MSW increased from 7.691%, 8.219%, and 9.539% to 26.584%, 28.517%, and 29.086%. The primary compression strain of M-MSW increased from 5.8%, 6.2%, and 8.218% to 30.557%, 32.638%, and 36.648%. The primary compression strain of H-MSW increased from 6.785%, 8.009%, and 7.254% to 37.558%, 40.553%, and 41.826%. The MPCI of each sample could be obtained by linear fitting of the settlement data. At temperatures of 20 °C, 30 °C, and 40 °C, the MPCIs of L-MSW were 0.15443, 0.16629, and 0.16948; The MPCIs of M-MSW were 0.21109, 0.22323, and 0.23894, and the MPCIs of H-MSW were 0.26166, 0.27383, and 0.29623. The fitting degree of the curve was 0.9958~0.9997, and the results are good.

3.3. The Influence of MSW Characteristics on the MPCI

(1) The Influence of Temperature on the MPCI
Figure 6 shows the change rule of the modified primary compression index ( C c ) with the change in temperature ( T ): C c shows an upward trend as T rises. When the temperature increased from 20 °C to 40 °C, C c had an increase of 6.6% from 0.135 to 0.144 in L-MSW; the fitting equation is C c = 0.00045 T + 0.1275 and the fitting degree is R 2 = 0.75. When the temperature increased from 20 °C to 40 °C, C c had an increase of 13.27% from 0.211 to 0.239 in M-MSW; the fitting equation is C c = 0.00175 T + 0.2245 and the fitting degree is R 2 = 0.9784. When the temperature increased from 20 °C to 40 °C, C c had an increase of 13.41% from 0.261 to 0.29 in H-MSW; the fitting equation is C c = 0.0014 T + 0.182 and the fitting degree is R 2 = 0.9932. The MPCI ( C c ) of MSW with the same organic matter content ( O W ) increased when the temperature increased. Under the same variables, the increase rate of the MPCI is faster when the organic matter content is higher. Thus, it could be seen that the MPCI is more sensitive to temperature changes than organic matter content changes.
The influence of temperature on MSW compression is as follows: the sensitivity of organic matter particles to temperature was higher than that of inorganic matter particles, and the particles of MSW showed obvious softening characteristics when the temperature increased, so an increase in temperature will increase the settlement of MSW.
(2) The Influence of Dry Unit Weight on the MPCI
Figure 7 shows the change rule of the MPCI ( C c ) with a change in dry unit weight ( γ d ) at different temperatures. C c showed a negative correlation with γ d ; that is, as γ d increased, C c decreased when the other variables were the same. As the dry unit weight increased from 4.704 kN/m3 to 6.586 kN/m3, C c decreased from 0.235 to 0.167 when the temperature was 20 °C; the fitting equation is C c = −0.036 γ d + 0.408 and the fitting degree is R 2 = 0.9948. As the dry unit weight increased from 4.704 kN/m3 to 6.586 kN/m3, C c decreased from 0.247 to 0.18 when the temperature was 30 °C; the fitting equation is C c = −0.0358 γ d + 0.417 and the fitting degree is R 2 = 0.9956. As the dry unit weight increased from 4.704 kN/m3 to 6.586 kN/m3, C c decreased from 259 to 0.194 when the temperature was 40 °C; the fitting equation is C c = −0.0349 γ d + 0.426 and the fitting degree is R 2 = 0.9956. From Figure 6, it can be seen that the MPCI trend lines of samples with different dry unit weights and at different temperatures are parallel to each other; that is, as γ d changed, the trends of C c remained relatively similar under different temperatures. There was a significant linear relationship between the MPCI and the dry unit weight.
The mechanisms by which dry unit weight affects the MPCI are as follows: 1. The greater the dry unit weight of the sample, the less the proportion of light components in the sample and the greater the proportion of heavy components, resulting in a lower compressibility of MSW. 2. The greater the dry unit weight of the sample, the smaller the void ratio and the lower the compressibility of MSW.
(3) The Influence of Organic Matter Content on the MPCI
Figure 8 shows the change rule of the MPCI with a change in organic matter content ( O W ) at different temperatures. C c increased with the increase in O W under different temperatures when the other variables were the same. As O W increased from 30% to 80%, C c increased from 0.167 to 0.235 when the temperature was 20 °C; the fitting equation is C c = 0.00137 O W + 0.127 and the fitting degree is R 2 = 0.9972. As O W increased from 30% to 80%, C c increased from 0.18 to 0.247 when the temperature was 30 °C; the fitting equation is C c = 0.00135 O W + 0.141 and the fitting degree is R 2 = 0.9977. As O W increased from 30% to 80%, C c increased from 0.194 to 0.259 when the temperature was 40 °C; the fitting equation is C c = 0.00132 O W + 0.156 and the fitting degree is R 2 = 0.9893.
The influence of O W on the MPCI is as follows: the number of compressible particles in MSW increases as the organic matter content increases; thus, the compressibility of MSW is enhanced.
(4) The Influence of moisture content on a wet basis according to the MPCI
Figure 9 shows the change rule of the MPCI ( C c ) for moisture content on a wet basis ( ω w ) at different temperatures. C c increased with the increase in ω w at different temperatures when the other variables were the same. As ω w increased from 51.64% to 59.61%, C c increased from 0.154 to 0.162 when the temperature was 20 °C; the fitting equation is C c = 0.0134 ω w − 0.53726 and the fitting degree is R 2 = 0.9877. As ω w increased from 51.64% to 59.61%, C c increased from 0.166 to 0.274 when the temperature was 30 °C; the fitting equation is C c = 0.01344 ω w − 0.52526 and the fitting degree is R 2 = 0.9891. As ω w increased from 51.64% to 59.61%, C c increased from 0.169 to 0.296 when the temperature was 40 °C; the fitting equation is C c = 0.01574 ω w − 0.64628 and the fitting degree is R 2 = 0.9929.
The influence of ω w on the MPCI is as follows: 1. Water can soften some components of MSW to increase the compressibility of MSW. 2. Water can allow the skeleton particles of MSW to move easier, which provides a certain degree of lubrication between skeleton particles.
Above all, temperature ( T ), dry unit weight ( γ d ), organic matter content ( O W ), and moisture content ( ω w ) all have an impact on the Modified Primary Compression Index ( C c ) of MSW. The higher the temperature ( T ), the smaller the dry unit weight ( γ d ), the higher the organic matter content ( O W ), the higher the moisture content on a wet basis, and the greater the Modified Primary Compression Index (MPCI) of MSW. Therefore, this article establishes a regression model that considers the influence of multiple factors to describe the change rule of the MSW MPCI.

4. Modified Primary Compression Index Model

4.1. Model Creation

The assumptions of the model in this article are as follows: (1) the Modified Primary Compression Index (MPCI) of MSW is mainly influenced by four factors: dry unit weight ( γ d ), organic matter content ( O W ), moisture content on a wet basis ( ω w ), and temperature ( T ); (2) the dry unit weight, organic matter content, moisture content on a wet basis, and temperature are independent and do not affect each other; (3) and the product of exponential operation on the four parameters above is linearly related to the Modified Primary Compression Index.
Based on the assumptions above, the dimensionless factor called the waste compressibility index (WCI), which is used to represent the comprehensive effect of four parameters (dry unit weight, organic matter content, moisture content on a wet basis, and temperature) above, is adopted. The expression of the model is as follows:
C c = a · W C I + b W C I = ω w m · γ d γ w n · O W k · T T 0 i
where ω w is moisture content on a wet basis (%); γ w is the weight of water, which is taken as 10 kN/m3; γ d is dry unit weight (kN/m3); O W is organic matter content (%); T is the initial temperature of MSW, which is taken as 20 °C; and a , b , m , n , k , and l are the parameters of the model.
Regression fitting analysis was conducted based on the summary of the literature presented in Table 4 and the results of the consolidation test considering the temperature effects in this article. The parameters a , b , m , n , k , and l in the model were determined to be 0.133, −0.107, 0.951, 0.664, 0.227, and 0.078, respectively.
The model of the MPCI can be expressed as follows:
C c = 0.227 · ω w 0.133 · γ d γ w 0.107 · O W 0.951 · T T 0 0.664 + 0.078
The fitting results of the MPCI model of the test and the literature are shown in Figure 10. In the figure, the two dashed lines have the same regression coefficients for the regression line and correspond to ±2SD ( σ ) from the regression line. It can be seen that for the given WCI, C c can be calculated to be ±0.0719. The regression of C c and the WCI include all the data, and the fitting degree of the model ( R 2 ) is 0.6554 in the figure. The results of the test are distributed near the curve which reflect that this model has a good fitting effect.

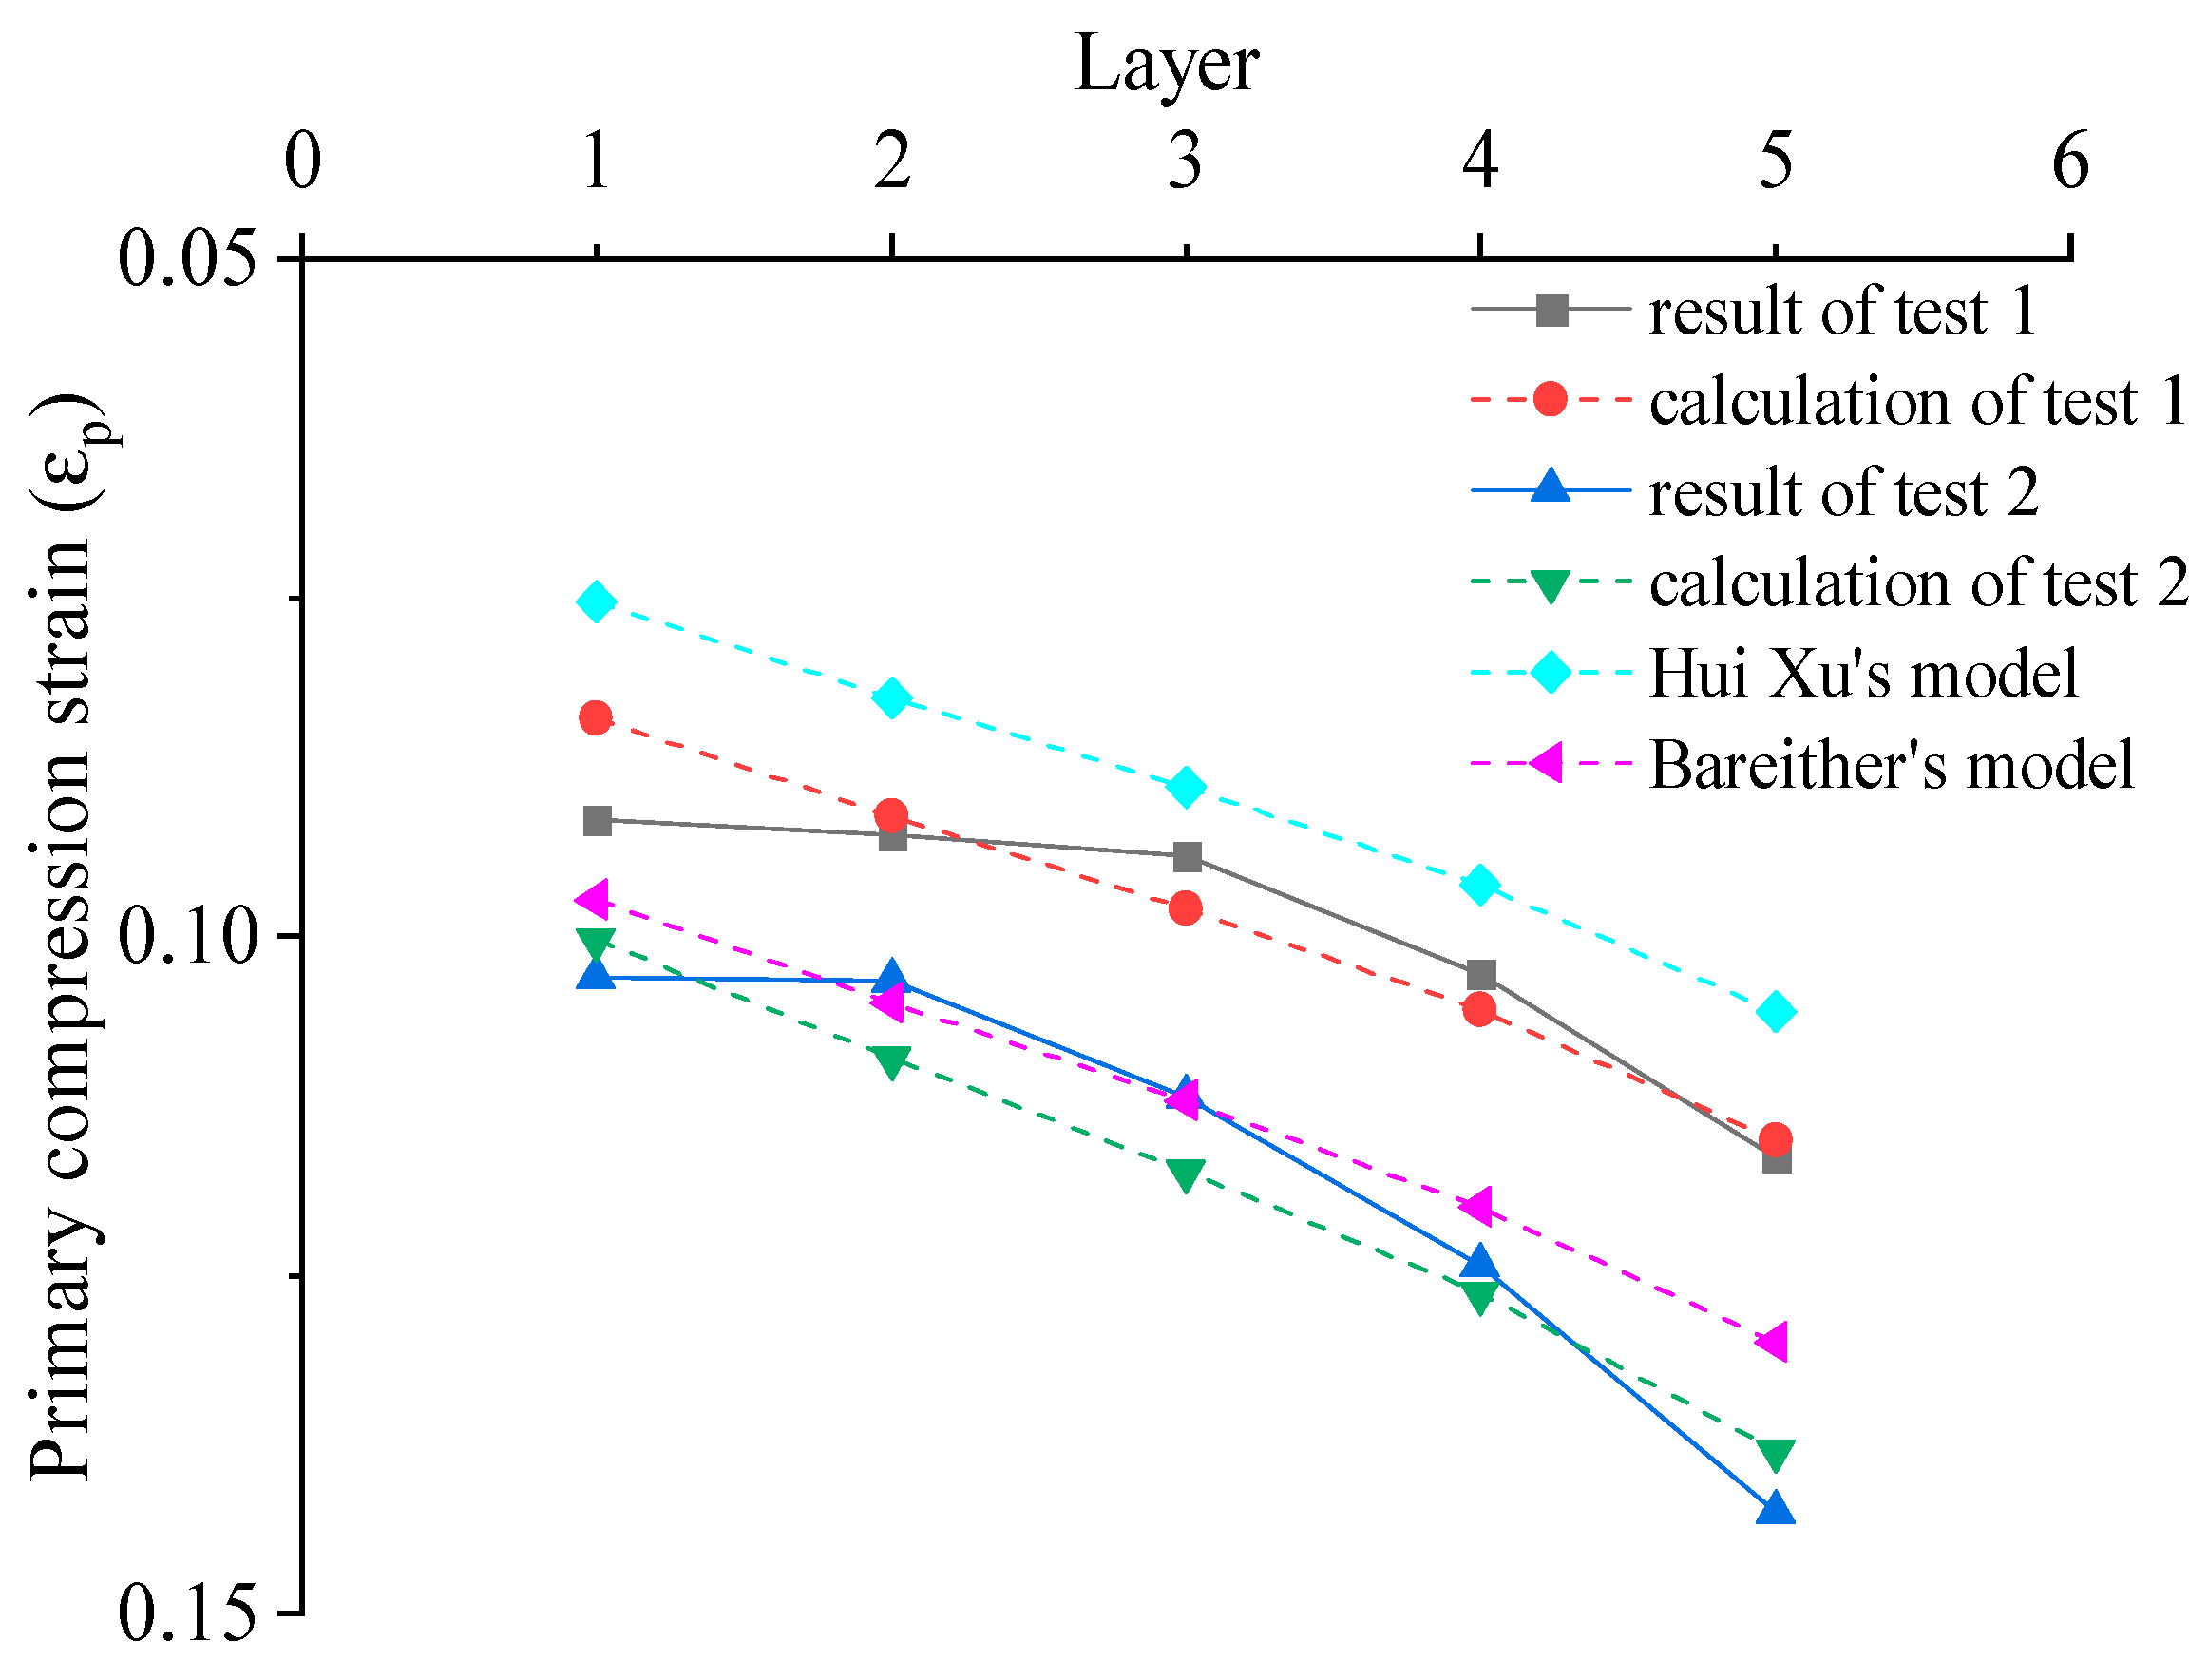
4.2. Model Validation

A bioreactor test considering the temperature effect was used for model validation. There was no degradation inhibition treatment in the test, so it was necessary to consider the influence of degradation on settlement. For the method of degradation settlement calculation, we adopted a method from the literature [34]. The sample was divided into five layers, each 24 cm in height. The schematic of the test is shown in Figure 11, and the initial parameters of the test are shown in Table 5.
The settlement achieved in the test is shown in Figure 12. The settlement and duration of primary compression in each layer of the samples was determined by the method in Section 2.3 of this article. The end times of primary compression in test 1 and test 2 were 7.11 d and 9.69 d; thus, temperature has an important impact on the settlement and duration of the primary compression in MSW.
The comparisons between the settlement calculated by the model in this article and the results of tests are shown in Figure 13. Comparing the calculation results of this article’s model with those of Xu Hui’s model [24] and Bareither’s model [13], it was found that neither Xu Hui’s model nor Bareither’s model can reflect the differences in MSW primary compression under different temperature conditions. It has been proven that the MPCI model in this article is relatively reliable and that the calculation results of the model and tests results align well. There was a little deviation between the test results and the calculation results of the model; as shown in the figure, the deviations between test 1 and test 2 were 8.17% and 2.72% in the first layer, 1.54% and 5.3% in the second layer, 4.04% and 4.66% in the third layer, 2.47% and 1.61% in the fourth layer, and 1.15% and 3.21% in the top layer, and the overall deviation was less than 5%. The reason for the deviation is that when the volume of the MSW sample increased, the non-uniformity became more apparent compared to the small sample.

5. Conclusions

  • Through temperature-controlled consolidation tests, it has been proven that temperature has an impact on MSW primary compression consolidation. As the temperature increased, MSW primary compression consolidation increased.
  • This article determined that the modification primary compression index (MPCI) of high-organic-matter-content waste (H-MSW), moderate-organic-matter-content waste (M-MSW), and low-organic-content-waste (L-MSW) was 0.26166~0.29623, 0.21109~0.23894, and 0.15443~0.16948 using a consolidation test considering the temperature effect; the MPCI increased with the increase in temperature, organic matter content, and dry unit weight and the decrease in moisture content on a wet basis.
  • A modified primary compression index calculation model was created considering temperature, organic matter content, moisture content on a wet basis, and the dry unit weight of MSW according to the results of the consolidation test and fitting model using data from the literature.
  • The effectiveness of the model was verified by comparing the results of the bioreactor test considering the temperature effect and the calculation results of the model.
  • The calculation results of the model indicate that errors in the results will occur if a single modified primary compression index (MPCI) is used to calculate the settlement of a landfill according to the technical specifications. As the size increased, the non-uniformity became more apparent. The calculated values in the middle of the sample were greater than the measured values, while the calculated values at the top and bottom were smaller than the measured values. Therefore, the variation in the MSW modified primary compression index (MPCI) with depth should be considered, which will help guide the accurate processing of landfills and design storage capacity.

Author Contributions

Conceptualization, Y.Z.; methodology, Y.Z.; validation, Y.Z.; resources, X.W.; writing—original draft preparation, Y.Z.; writing—review and editing, X.W. and Y.Y. All authors have read and agreed to the published version of the manuscript.

Funding

This research was funded by the National Natural Science Foundation of China: 41372268.

Institutional Review Board Statement

Not applicable.

Informed Consent Statement

Not applicable.

Data Availability Statement

The data presented in this study are available on request from the corresponding author. The data are not publicly available due to privacy.

Conflicts of Interest

The authors declare no conflicts of interest.

References

  1. Liu, J.Y.; Xu, D.M.; Zhao, Y.C. Research on Settlement of municipal refuse Landfill. Soil Environ. Sci. 2002, 11, 111–115. [Google Scholar]
  2. Yin, Y.; Li, B.; Wang, W.; Zhan, L. Mechanism of the December 2015 catastrophic landslide at the Shenzhen landfill and controlling geotechnical risks of urbanization. Engineering 2016, 2, 230–249. [Google Scholar] [CrossRef]
  3. Qian, X.-D.; Guo, Z.-P. Engineering properties of municipal solid waste. Chin. J. Geotech. Eng. 1998, 20, 4–9. [Google Scholar]
  4. Bjarngard, A.B.; Edgers, L. Settlement of municipal solid waste landfills. In Proceedings of the 13th Annual Madison Waste Conference; University of Wisconsin: Madison, WI, USA, 1990; pp. 192–205. [Google Scholar]
  5. Vilar, O.M.; Carvalho, M.F. Mechanical properties of municipal solid waste. J. Test. Eval. 2004, 32, 438–449. [Google Scholar] [CrossRef]
  6. Landva, A.O.; Valsangkar, A.J.; Pelkey, S.G. Lateral earth pressure at rest and compressibility of municipal solid. Can. Geotech. J. 2000, 37, 1157–1165. [Google Scholar] [CrossRef]
  7. Liu, R.; Shi, J.-Y.; Peng, G.-X. Study on the deformation characteristics of interior refuse test. J. Yangzhou Univ. (Nat. Sci. Ed.) 2003, 6, 51–55. [Google Scholar]
  8. Hossian, M.S.; Gabr, M.A.; Barlaz, M.A. Relationship of compressibility parameters to municipal solid waste decomposition. J. Geotech. Geoenviron. Eng. 2003, 129, 1151–1158. [Google Scholar] [CrossRef]
  9. Indrawan, I.G.; Rahardjo, H.; Leong, E.C.; Tan, P.Y.; Fong, Y.K.; Sim, E.K. Field instrumentation for monitoring of water, heat, and gas transfers through unsaturated soils. Eng. Geol. 2012, 151, 24–36. [Google Scholar] [CrossRef]
  10. Badv, K.; Faridfard, M.R. Laboratory determination of water retention and diffusion coefficient in unsaturated sand. Water Air Soil Pollut. 2005, 161, 25–38. [Google Scholar] [CrossRef]
  11. Campanella, R.G.; Mitchell, J.K. Influence of temperature variations on soil behaviour. J. Geotech. Eng. Div. 1968, 94, 709–734. [Google Scholar]
  12. Abuel-Naga, H.M.; Bergado, D.T.; Bouazza, A. Thermally induced volume change and excess pore water pressure of soft Bangkok clay. Eng. Geol. 2007, 89, 144–154. [Google Scholar] [CrossRef]
  13. Bareither, C.A.; Benson, C.H.; Edil, T.B. Compression behavior of municipalsolid waste: Immediate compression. J. Geotech. Geoenviron. Eng. 2012, 138, 1047–1062. [Google Scholar] [CrossRef]
  14. Li, Z.S.; Yang, L.; Qu, X.Y.; Sui, Y.M. Municipal solid waste management in Beijing City. Waste Manag. 2009, 29, 2596–2599. [Google Scholar] [PubMed]
  15. Hong, R.J.; Wang, G.F.; Guo, R.Z.; Cheng, X.; Liu, Q.; Zhang, P.J.; Qian, G.R. Life cycle assessment of BMT-based integrated municipal solid waste management: Case study in Pudong, China. Resour. Conserv. Recycl. 2006, 49, 129–146. [Google Scholar] [CrossRef]
  16. Jiang, J.G.; Lou, Z.Y.; Ng, S.; Ciren, L.; Ji, D. The current municipal solid waste management situation in Tibet. Waste Manag. 2009, 29, 1186–1191. [Google Scholar] [CrossRef] [PubMed]
  17. Yuan, H.; Wang, L.; Su, F.; Hu, G. Urban solid waste management in chongqing: Challenge and opportunities. Waste Manag. 2006, 26, 1052–1062. [Google Scholar]
  18. Sharholy, M.; Ahmad, K.; Mahmood, G.; Trivedi, R.C. Municipal solid waste management in Indian cities—A review. Waste Manag. 2008, 28, 459–467. [Google Scholar] [CrossRef]
  19. Machado, S.L.; Karimpour-Fard, M.; Shariatmadari, N.; Carvalho, M.F.; do Nascimento, J.C. Evaluation of the geotechnical properties of MSW in two Brazilian landfills. Waste Manag. 2010, 30, 2579–2591. [Google Scholar] [CrossRef]
  20. Environment Data: Compendium 2005; Organization for Economic Cooperation and Development (OECD): Paris, France, 2005.
  21. Francois, V.; Feuillade, G.; Matejka, G.; Lagier, T.; Skhiri, N. Leachate recirculation effects on waste degradation: Study on columns. Waste Manag. 2007, 27, 1259–1272. [Google Scholar] [CrossRef]
  22. Shi, J.Y.; Qian, X.D.; Liu, X.D.; Sun, L.; Liao, Z.Q. The behavior of compression and degradation for municipal solid waste and combined settlement calculation method. Waste Manag. 2016, 55, 154–164. [Google Scholar] [CrossRef]
  23. Handy, R.L. First-order rate equations in geotechnical engineering. J. Geotech. Geoenviron. Eng. 2002, 128, 416–425. [Google Scholar] [CrossRef]
  24. Xu, H.; Zhu, G.; Zhang, Z.Y.; Zhan, L.T.; Chen, Y.M. Experimental study on the primary compression behavior of municipal solid waste and a model of modified primary compression index. Chin. J. Rock Mech. Eng. 2019, 38, 1271–1283. [Google Scholar]
  25. Liu, X.-D.; Shi, J.-Y.; Hu, Y.-D. Coupled mechanical-gas settlement model and calculation for MSW by considering biodegradation. Chin. J. Geotech. Eng. 2011, 33, 693–699. [Google Scholar]
  26. Liao, Z.-Q.; Shi, J.-Y.; Mao, J. Experimental study and mechanism analysis of primary compression index of MSW. J. Hohai Univ. (Nat. Sci.) 2007, 35, 326–329. [Google Scholar]
  27. Reddy, K.R.; Hettiarachchi, H.; Parakalla, N.S.; Gangathulasi, J.; Bogner, J.E. Geotechnical properties of fresh municipal solid waste at Orchard Hills Landfill, USA. Waste Manag. 2009, 29, 952–959. [Google Scholar] [CrossRef] [PubMed]
  28. Swati, M.; Joseph, K. Settlement analysis of fresh and partially stabilised municipal solid waste in simulated controlled dumps and bioreactor landfills. Waste Manag. 2008, 28, 1355–1363. [Google Scholar] [CrossRef] [PubMed]
  29. Olivier, F.; Gourc, J.P. Hydro-mechanical behavior of municipal solid waste subject to leachate recirculation in a large-scale compression reactor cell. Waste Manag. 2007, 27, 44–58. [Google Scholar] [CrossRef]
  30. Stolze, G.; Gourc, J.P.; Oxarango, L. Characterization of the physic-mechanical parameters of MSW. Waste Manag. 2010, 30, 1439–1449. [Google Scholar]
  31. Chen, Y.M.; Zhan, T.L.; Wei, H.Y.; Ke, H. Aging and compressibility of municipal solid wastes. Waste Manag. 2009, 29, 86–95. [Google Scholar] [CrossRef]
  32. Priyankara, N.H.; Fernando, K.A.S.N.; Alagiyawanna, A.M.N. Compressibility Characteristics of Open Dumped Municipal Solid Waste in the Dry Zone of Sri Lanka. Engineering 2022, 3, 11–20. [Google Scholar] [CrossRef]
  33. Balasooriya, B.L.C.B.; Priyankara, N.H.; Alagiyawanna, A.M.N.; Dayanthi, W.K.C.N.; Koide, T.; Kawamoto, K. Waste Amount and Composition Survey (WACS) in Galle and Hambantota Municipal Councils. In Proceedings of the International Symposium on Advances in Civil and Environmental Engineering Practices for Sustainable Development (ACEPS), Galle, Sri Lanka, 9 March 2015; pp. 240–247. [Google Scholar]
  34. Chen, J.-D.; Shi, J.-Y.; Fang, Y.-F. Degradation law of municipal solid waste and settlement calculation of landfills. J. Hohai Univ. (Nat. Sci.) 2006, 36, 680–682. [Google Scholar]
Figure 1. Schematic of the consolidation instrument with temperature control.
Applsci 14 00348 g001
Figure 2. Bioreactor device. In (a): 1. Sample room; 2. Pressure transmission top plate; 3. Column; 4. Fixed pulley; 5. Moving pulley; 6. Weights; 7. Sample cover; 8. Pressure transmission bottom plate; 9. Loading rod head; 10. Loading rod; 11. Pressure-bearing top plate; 12. Pressure-bearing bottom plate; 13. Gas collection pipe; 14. Leachate recirculation port; 15. Exhaust port; 16. Leachate collection pipe; 17. Load sensor; 18. Gas meter; 19. Leachate collection tank; 20. Gas collection porous pipe; 21. Sealing ring; 22. Heating belt; 23. Temperature controller.
Applsci 14 00348 g002aApplsci 14 00348 g002b
Figure 3. Method for determining ε E O P and t E O P .
Applsci 14 00348 g003
Figure 4. Consolidation curve of M-MSW under 30 °C and 100 kPa stress.
Applsci 14 00348 g004
Figure 5. MSW primary compression strain and vertical stress under different temperatures.
Applsci 14 00348 g005aApplsci 14 00348 g005b
Figure 6. Change rule of MPCI for different organic matter contents at different temperatures.
Applsci 14 00348 g006
Figure 7. Change rule of MPCI for different dry unit weights at different temperatures.
Applsci 14 00348 g007
Figure 8. Change rule of MPCI for organic matter content at different temperatures.
Applsci 14 00348 g008
Figure 9. Change rule of MPCI for moisture content on a wet basis at different temperatures.
Applsci 14 00348 g009
Figure 10. Relationship between the MPCI and WCI in MSW.
Applsci 14 00348 g010
Figure 11. Schematic of the bioreactor test considering temperature effect.
Applsci 14 00348 g011
Figure 12. Layered settlement over time in test 1 and test 2.
Applsci 14 00348 g012
Figure 13. Calculation and results of test 1 and test 2.
Applsci 14 00348 g013
Table 1. Proportion of MSW in different areas.
KitchenPaperFabricPlasticGlassMetalOtherMoisture Content
Beijing [14]63.411.072.4612. 71.760.278.3440~60
Shanghai [15]66.74.461.819.982.720.274.0745~66
Guangzhou [16]58.16.34.814.520.613.750~70
Chongqing [17]59.210.16.115.73.41.14.444~62
India [18]41.85.73.54.72.11.940.340~60
Brazil [19]42.919.74.518.71.71.511.050
America [20]25344.712.05.08.211.115~40
Japan [20]3433.62.313.4538.738
France [21]28.626.85.711.113.14.110.639.5
Table 2. Proportions of different organic matter content samples.
SampleOrganic
Matter
Content
OrganicInorganic
Wheat BranPaperSawdustPlasticFabricSand
L-MSW30%15%5%2.5%5%2.5%70%
M-MSW60%30%10%5%10%5%40%
H-MSW80%50%12.5%7.5%7.5%2.5%20%
Table 3. Initial states of the samples.
SampleOrganic Matter
Content
Dry Unit Weight
(kN/m3)
Moisture Content on a Wet BasisVoid Ratio
L-MSW30%6.58651.64%2.0
M-MSW60%5.48856.62%2.0
H-MSW80%4.70459.61%2.0
Table 4. Summary of the literature on MPCI and parameters in MSW.
ReferenceAge t
(°C)
Size
(cm)
C c ω w γ d O W
Xu [24]fresh20 5000.38170.22.4484.45
5000.32362.312.8783.1
fresh20 300.31468.83.0283.15
0.22957.393.8557.45
0.17553.14.3318.5
Liu [25]fresh20 6.180.28737.57.6152.5
0.19437.57.6152.5
0.17837.57.6126.25
0.16437.57.6126.25
Bareither [13]fresh20 6.40.09123.845.632.6
100.18723.845.71
30.50.16223.845.61
30.50.23623.845.82
20 6.40.11522.487.9954.35
100.18822.488.12
30.50.25121.948.38
30.50.23421.948.53
20 6.40.09322.34.3710.95
100.21522.34.26
30.50.2122.34.47
30.50.2822.34.3
Mild degradation20 30.50.18331.696.6248.3
30.50.23531.696.77
Moderate degradation20 30.50.17335.696.4221.2
30.50.25735.696.63
Severe degradation20 30.50.19338.616.5217.3
30.50.23438.616.37
Liao [26]fresh35 6.180.29323.075.3352.5
0.29633.335.3352.5
0.29341.185.3352.5
0.28156.95.3352.5
Reddy [27]fresh25 6.30.3353.75.2260
0.2453.74.960
0.2153.75.4460
0.31953.74.6260
Swati [28]fresh25 1300.633622.7752
1300.374582.7452
1300.155285.6430
1300.026276.0230
1300.053286.0130
Hossian [8]fresh35 6.350.1655 54.61
0.2555 45.86
0.3755 40.55
0.3555 42.39
0.1655 55.01
0.1655 46.51
0.2055 45.59
0.2555 35.04
Olivier [29]fresh30–34 1000.27130.264.1761.9
0.22033.864.4161.9
Stolze [30]fresh25 2700.26918.44.0273.05
0.28831.514.0373.05
0.2837.774.0773.05
0.2741.964.3173.05
0.33342.863.9973.05
0.32244.813.9973.05
0.37347.563.8773.05
0.32250.454.0873.05
0.29654.133.9473.05
0.28853.814.2173.05
Chen [31]fresh30 8.10.15238.697.52425.2
0.25237.115.85831.15
0.10352.615.00834.7
190.20444.414.39264.9
0.31549.83.26364.9
Priyankara and Balasooriya [32,33]fresh20 200.117.710.5447.04
0.1136.27.08847.04
0.0928.349.23747.04
0.0837.438.56647.04
0.128.946.51647.04
0.131.997.40647.04
Table 5. Initial parameters for bioreactor testing.
ParameterTest 1Test 2
Temperature (°C)2540
Vertical stress (kPa)42.442.4
Organic matter content (%)6060
Initial density (g/cm3)0.9760.985
Dry unit weight (kN/m3)6.566.6
Moisture content (%)32.932.9
Void ratio2.02.0
Wet mass (kg)237.3237.3
Sample height (cm)123.6122.5
A0.06450.0649
B20.21135.05
Disclaimer/Publisher’s Note: The statements, opinions and data contained in all publications are solely those of the individual author(s) and contributor(s) and not of MDPI and/or the editor(s). MDPI and/or the editor(s) disclaim responsibility for any injury to people or property resulting from any ideas, methods, instructions or products referred to in the content.

