1. Introduction
Forests play an indispensable role in global ecosystems, offering vital services such as oxygen production, air purification, soil and water conservation, climate regulation, carbon cycling, and the preservation of biodiversity, in addition to providing habitats for numerous species [
1,
2]. In recent years, the prevalence of extreme fire weather has increased worldwide due to global warming and prolonged fire seasons, leading to an expansion in both the extent and average duration of forest fires across many regions, thereby altering the structure and diversity of forest ecosystems. These fires also pose serious threats to human life, regional economies, and environmental health [
3,
4,
5,
6,
7,
8]. Between 2001 and 2021, forest cover loss due to wildfires reached 1.19 million hectares globally, with China experiencing a loss of 893,000 hectares within this twenty-year period. From 2003 to 2018, China witnessed 111,446 forest fires, affecting an area of 3.2895 million hectares and an annual average burned area of 205,600 hectares [
9]. These figures underscore the global concern for forest fire prediction and prevention. Therefore, understanding the factors influencing forest fire occurrences is crucial for fire prevention, suppression, forest conservation, and resource allocation. Additionally, the ability to predict the number of fires and the extent of burned areas is essential to avert many accidents and mitigate the destructive consequences of fires.
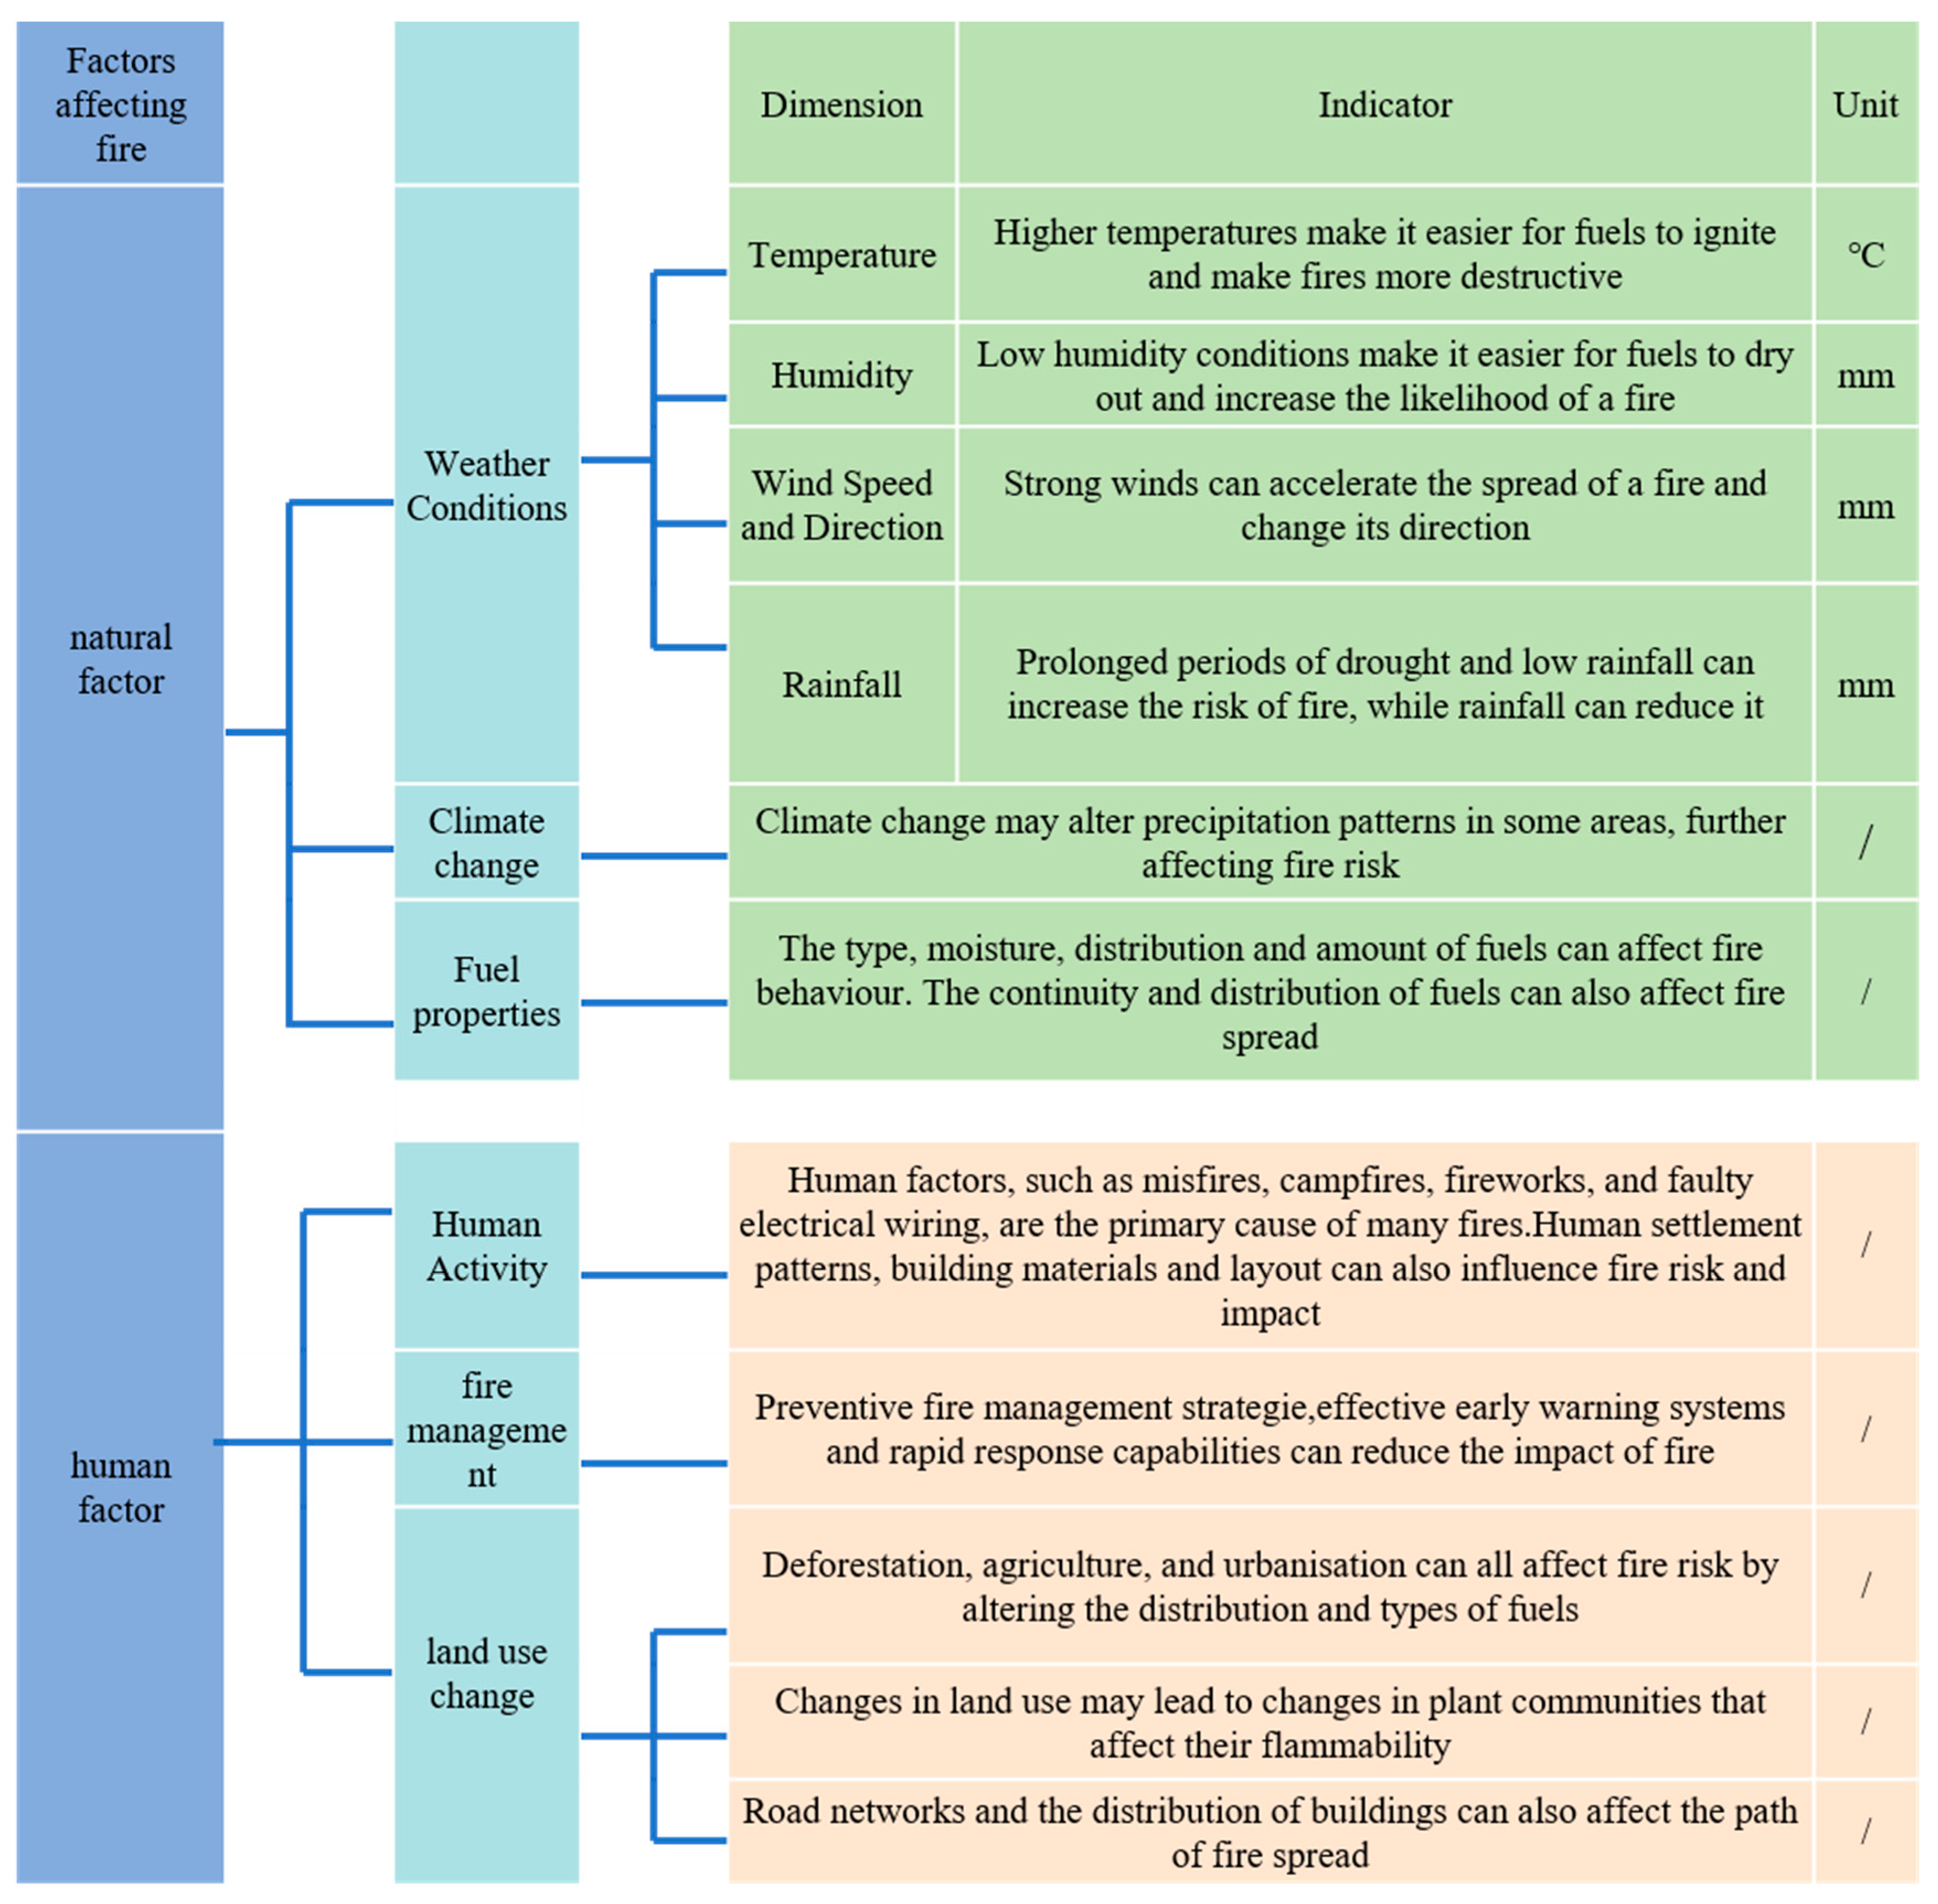
To achieve this goal, we conducted predictive analyses of forest fires. Forest fire prediction is not merely a short-term forecasting challenge but a complex task involving comprehensive analysis across multiple disciplines, scales, and technologies. As
Figure 1 illustrates, fire occurrence is influenced by various factors. Natural factors include weather conditions, climate change, and fuel characteristics [
10,
11,
12]. Rising temperatures facilitate easier ignition of fuel, leading to more intense fires. In conditions of low humidity, fuels dry out more easily, increasing fire likelihood. Strong winds can rapidly spread fires and alter their paths. Prolonged droughts and reduced rainfall heighten fire risks, while sufficient rainfall reduces them. These climatic changes also alter regional precipitation patterns, profoundly impacting fire risks.
Human factors encompass human activities, fire management, and land-use changes [
13,
14,
15,
16]. Human activities, such as accidental fires, campfires, and fireworks, are major causes of many wildfires. Implementing fire management strategies can help mitigate the impact of fires. Furthermore, deforestation, agriculture, and urbanization alter fuel distribution and types, thereby affecting fire risks. Land-use changes can lead to shifts in plant communities, affecting the combustibility of materials. Additionally, the layout of urban road networks and buildings also influences the spread of fires.
This paper collects forest fire and meteorological data from Yunnan Province, constructs stepwise regression and ARIMA models, and analyzes factors like fire frequency, fire area, average temperature, annual rainfall, humidity, and wind speed from 1991 to 2021. Through time series and multivariate analyses, we comprehensively understand forest fire dynamics, which is crucial for fire prediction and fire management. This study innovates in the field of forest fire prediction, combining traditional stepwise regression analysis with modern time series analysis techniques, not only enhancing prediction accuracy but also providing new perspectives and tools for fire strategies and forest management.
2. Literature Review
The establishment of forest fire prediction models enables us to estimate the likelihood of forest fires and manage the areas at risk. Scholars have made substantial contributions to the field of fire prediction modeling. Jesus and colleagues have demonstrated the significance of using the ARIMA (Autoregressive Integrated Moving Average) model, combined with remote sensing technology and climate data, to analyze and predict the risk of forest fires in the Atlantic Forest, underscoring its importance for managing forest fire risks and its potential application in environmental protection and disaster prevention [
17]. Slavia and others [
18] have utilized the ARIMA model to forecast forest fire hotspots, emphasizing the importance of accurate predictions in fire prevention and emergency management and providing a practical case study for using time series analysis for prediction. Ma and colleagues [
19] have adjusted and optimized the parameters of the Seasonal ARIMA (SARIMA) model based on historical fire records, demonstrating how to more accurately predict the frequency of future fires and effectively identify high-risk periods, thereby contributing to improved disaster prevention and emergency preparedness. BAĞCI [
20] used the ARIMA method to model the area burned by forest fires in Turkey, evaluating the model’s effectiveness through Ljung–Box statistics, residual analysis, and cross-validation, forecasting the area affected by forest fires over the next three years.
Kolanek and others [
21], through correlation analysis and regression models, found that the impact of most analyzed variables on forest fires varied within their study region during 2007–2017. Abdi and colleagues [
22] demonstrated the effective application of GIS in fire management, damage assessment, and predicting future fires using stepwise and logistic regression to identify fire-related factors. Bai et al. [
23] used forest fire data and corresponding meteorological data from 2000–2013 in Dali State, employing logistic regression as a single model and stepwise regression to select the final variables for parameter fitting, finding that the Bayesian averaging model outperformed the binomial logistic regression model in terms of fit and predictive accuracy.
In summary, while most research in forest fire prediction models has employed traditional analytical models, the ARIMA model boasts unique advantages in processing time series data and is particularly suited for analyzing and predicting events with strong temporal dependence. Time series analysis can reveal the cycles and trends of forest fire occurrences, which is crucial for understanding and predicting fires. However, the ARIMA model also has its limitations, requiring stationarity in the time series and being based on linear relationships, which may not fully capture the complex nonlinear dynamics present in forest fire data. Forest fires result from a complex interplay of factors, and the stepwise regression model can effectively select the most significant variables, providing an efficient analytical method for the multifaceted nature of forest fires. Given that fires are likely primarily influenced by climate change, the stepwise regression model can effectively identify the variables that pose the greatest risk to fire occurrence.
This article reviews various studies on forest fire prediction models, analyzing the strengths and limitations of current methodologies. Building on existing research, we have identified a gap in the in-depth analysis of fire behavior under specific climatic conditions. Our study aims to fill this gap, examining the efficacy and limitations of different models when addressing the same issue. This can facilitate model optimization and provide a more comprehensive and diversified perspective for forest fire prediction through these two models.
3. Modeling and Data Sources
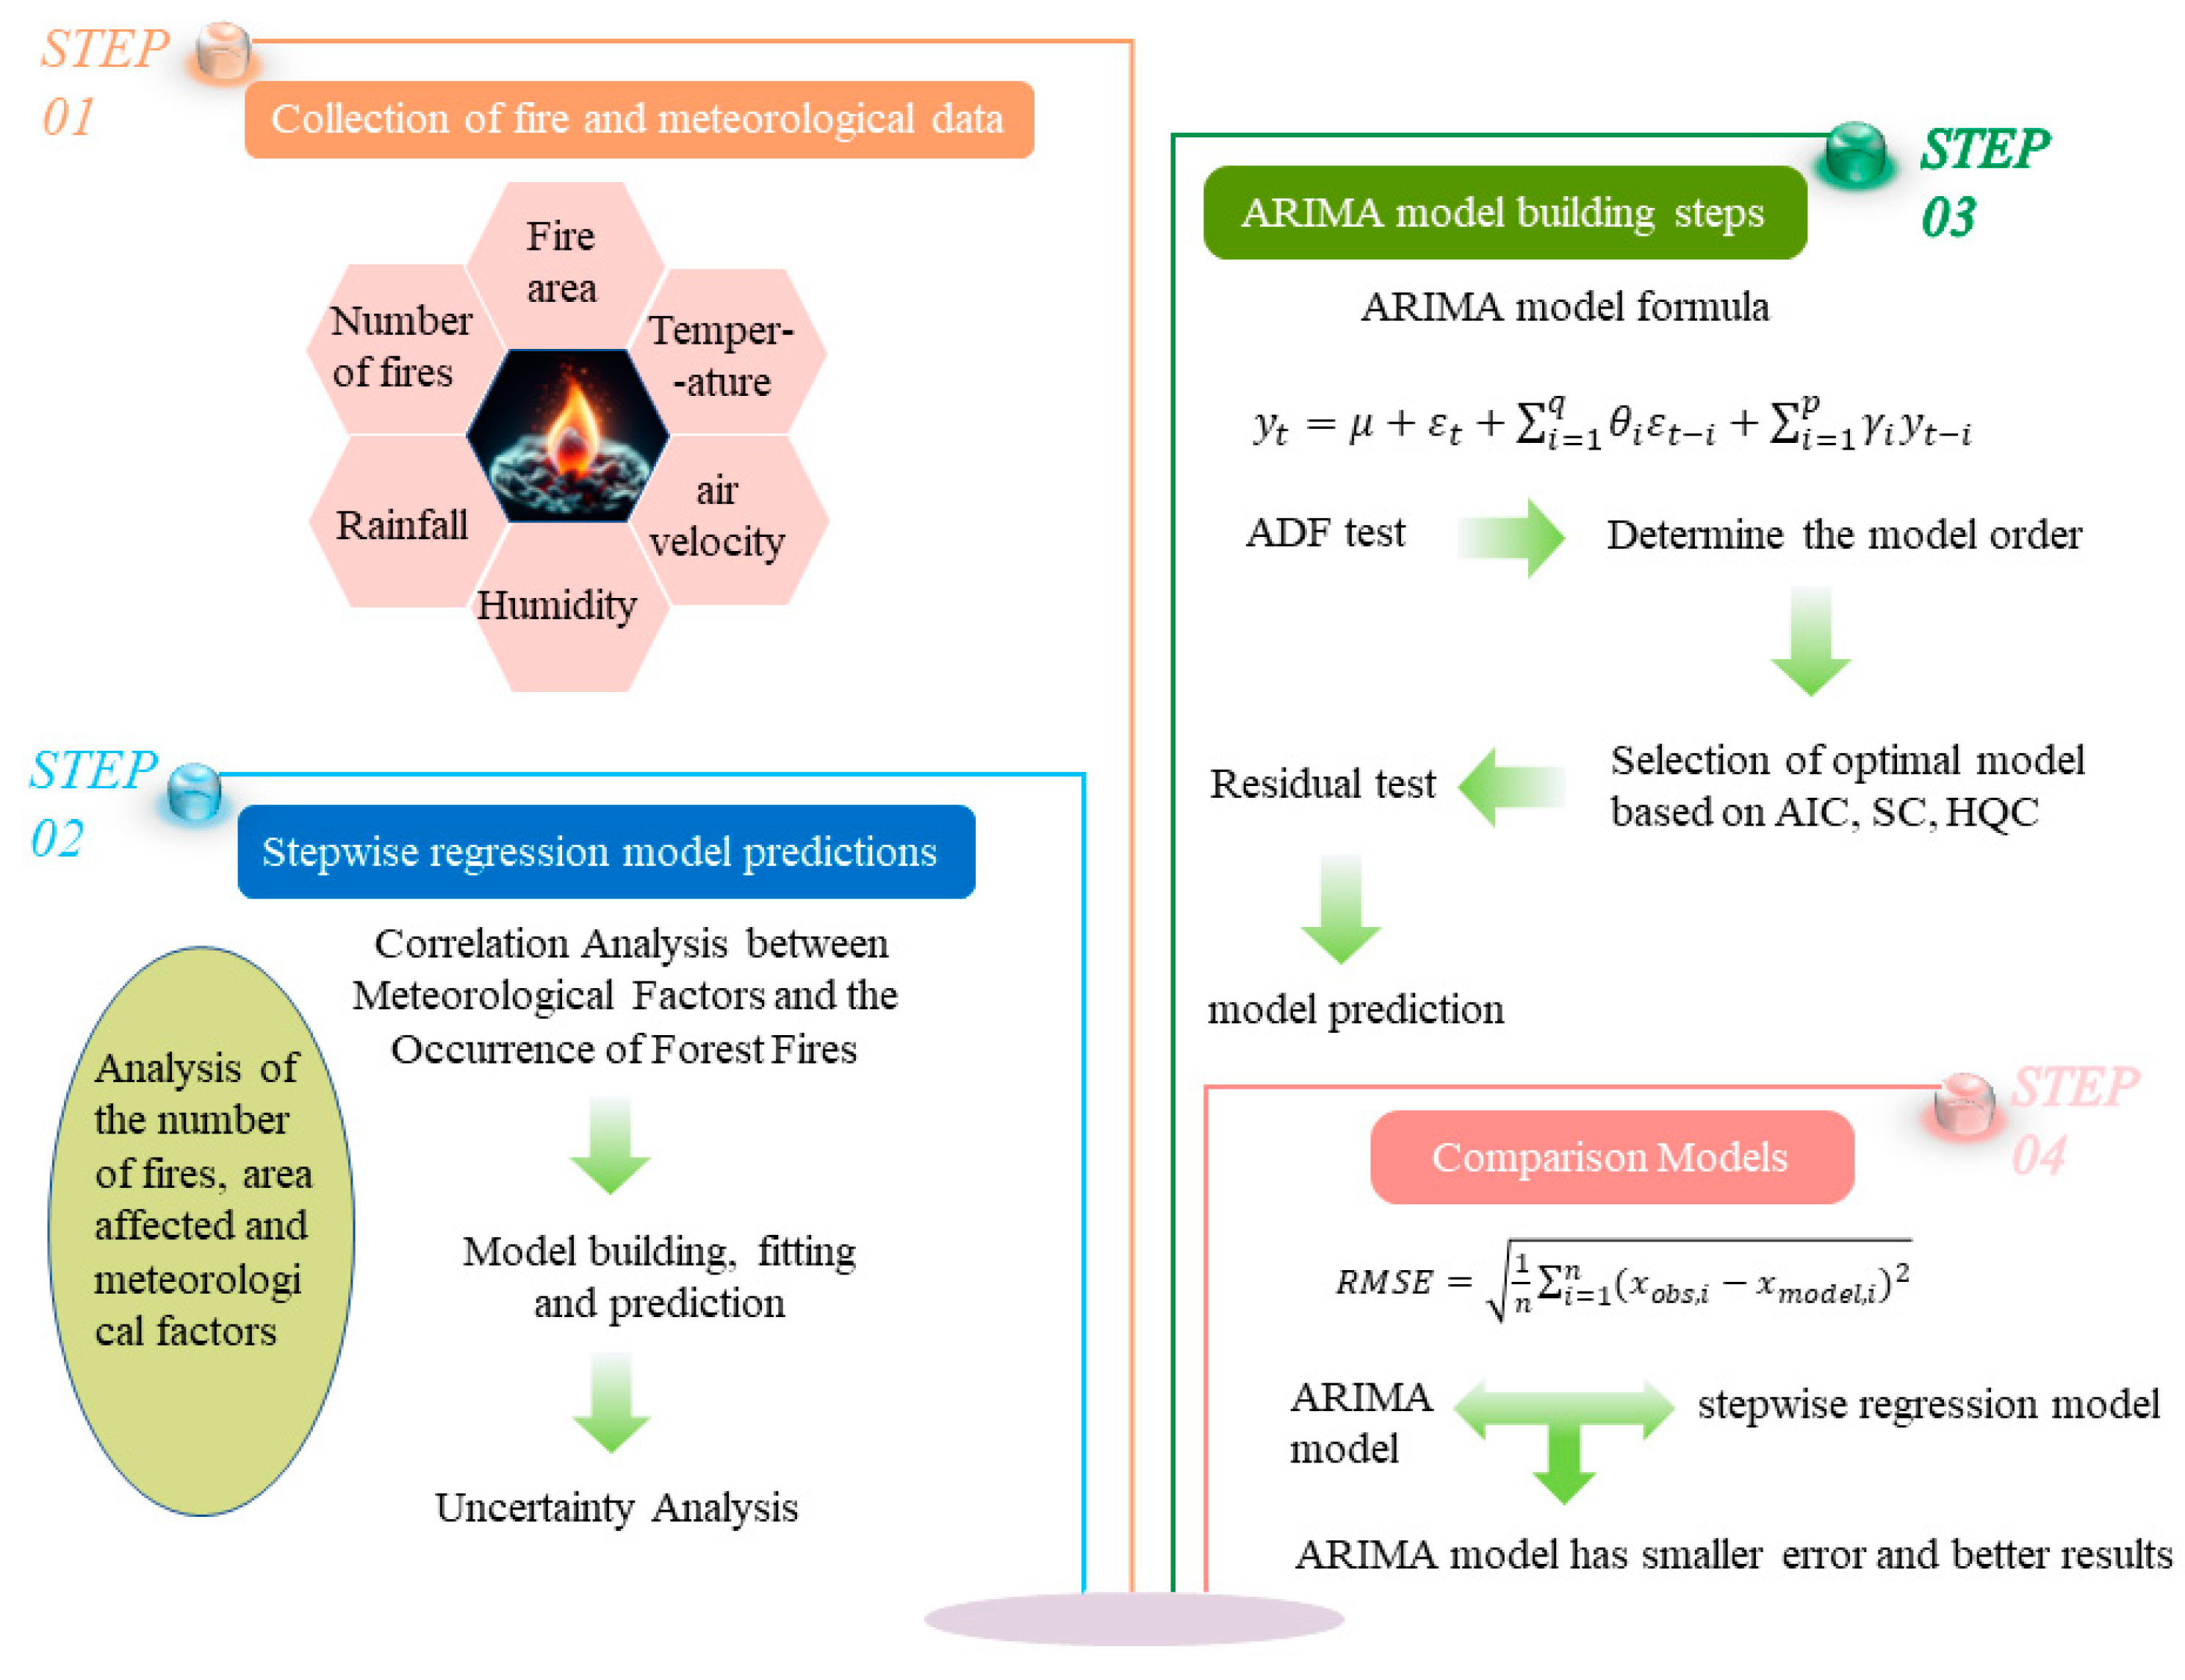
The research framework of this study, as illustrated in
Figure 2, begins with the collection of fire incident data and meteorological factors. This is followed by a detailed analysis of the relationship between fire data and meteorological factors, with a focus on the correlation between meteorological factors and the occurrence of forest fires. Upon establishing this correlation, a stepwise regression model is constructed, thoroughly fitted, and predicted. The model is validated through uncertainty analysis to enhance the reliability of the research. The third step involves building an ARIMA model based on fire frequency and affected area data, confirming the model order through ADF testing, selecting the optimal model according to AIC, SC, and HQC criteria, and conducting fire prediction after passing the residual test. Finally, the stepwise regression model and ARIMA model are compared using the RMSE mean square error test, with results indicating the ARIMA model’s superior performance in fire prediction.
3.1. Models
3.1.1. Stepwise Regression Model
The Stepwise Regression Model (SRM) is an efficient statistical method predominantly used for selecting the most influential predictive variables from a large pool of potential predictors, while concurrently eliminating those with minimal predictive impact. This approach, through an automated variable selection process, significantly streamlines the construction of linear regression models, making it particularly apt for handling complex and high-dimensional datasets [
24]. Beyond its widespread application in forest fire prediction, the practicality and methodological rigor of the SRM have been corroborated in various research domains. For instance, studies by Mir Aftab Hussain Talpur and colleagues, conducted in the context of travel impedance analysis, have explored the adaptability and effectiveness of the SRM across diverse research fields. Such interdisciplinary references not only validate our choice of this method but also enhance our understanding of the application value of the SRM in environmental science and statistical research [
25].
The stepwise regression model is shown in Equation (1):
is the dependent variable,
is the intercept, the expected value of when all explanatory variables are zero,
, , , … are the coefficients of the explanatory variables, indicating the expected change in per unit change in the variable.
is the error term, representing random variation not explained by the model.
Factor Selection: Climatic factors play a pivotal role in the causation of forest fires. Elevated temperatures dry out forest vegetation, increasing flammability and thereby the risk of fires. Increased rainfall inhibits the occurrence and spread of fires. Prolonged rainfall deficiency leads to low water content in vegetation and soil, raising the likelihood of fires. Higher wind speeds facilitate the spread of flames, accelerating fire propagation. Variability in wind direction and strong winds exacerbate the difficulty and risk of fire control. Under low humidity conditions, vegetation and surface materials are more combustible, raising the fire hazard. Diurnal variations in humidity significantly affect fire occurrences, with higher nighttime humidity reducing fire risk and vice versa. Temperature, rainfall, wind speed, and humidity significantly influence the incidence and spread of forest fires through various mechanisms [
26]. Understanding these effects is crucial for forest fire prevention and the formulation of effective forest management and emergency response strategies.
3.1.2. ARIMA Model
The ARIMA (Autoregressive Integrated Moving Average) model, an extension of the ARMA (Autoregressive Moving Average) model, is esteemed for its robust mathematical foundation and efficient implementation, making it a principal choice in time series analysis [
27,
28,
29]. It addresses non-stationary time series data through differencing, converting it into a stationary series. The ARIMA model’s utility is particularly evident in forest fire forecasting due to the temporal nature of forest fire occurrences. It assists in predicting the frequency of future forest fires, which is vital for planning and prevention measures.
The AR model represents future values as a linear combination of past observations and current disturbances. The AR model [
30] is presented in Equation (2):
where
represents the observation,
is a constant term,
denotes the order of the AR model,
is the autocorrelation coefficient, and
is the error term.
The MA model [
31] accumulates the error terms of the autoregressive model and is given in Equation (3):
where
represents the observation,
is a constant term,
denotes the order of the MA model,
is the moving average coefficient, and
is the error term.
Thus, the ARIMA model [
32] is formulated as in Equation (4):
- (1)
ADF Test
Prior to conducting time series analysis on the frequency of forest fires in Yunnan Province from 1991 to 2021, it is a prerequisite to employ the ADF (Augmented Dickey–Fuller) test to verify the stationarity of the series [
33] (
https://en.wikipedia.org/wiki/Augmented_Dickey–Fuller_test, accessed on 1 November 2023). Establishing an ARIMA model for the time series is contingent upon passing the ADF test. Should the
p-value from the ADF test exceed 0.05, the null hypothesis is accepted, necessitating a first-order differencing of the data.
- (2)
Model Identification
In time series analysis, accurate model identification is crucial for the construction of the ARIMA model. This process involves the selection of the order of the autoregressive (AR) terms, the degree of differencing (I), and the order of the moving average (MA) terms. These parameters collectively determine the structure of the model and its predictive accuracy. Appropriate orders allow the model to capture the statistical characteristics of the data, such as trends, seasonality, and cycles, while inappropriate orders may lead to loss of information or overfitting.
According to the research by Wang X [
34], the optimal order of the ARIMA model is ascertained by analyzing the plots of the autocorrelation function (ACF) and the partial autocorrelation function (PACF), as demonstrated in
Table 1, and by selecting the model with the minimum values of AIC, SC, and HQC. This method effectively identifies the time series correlations and seasonal features, selecting the model and lag order that best align with the data characteristics, thus providing a solid foundation for precise forecasting.
3.2. Model Evaluation and Validation
3.2.1. R2 Test of the Model
In model validation, the coefficient of determination, R
2, serves as a pivotal metric to quantify the explanatory power of the model’s independent variables over the variation in the dependent variable. Ranging between 0 and 1, values of R
2 approaching 1 generally indicate a higher degree of model fit, reflecting superior fit quality. Moreover, as an evaluative standard, R
2 aids in comparing the accuracy of different models, thereby providing a scientific basis for model selection [
35]. A high R
2 value signifies that the model has effectively captured the intrinsic variability of the data, suggesting potential model efficacy. However, R
2 alone does not determine predictive ability, and high values might suggest overfitting. Hence, it is typically used in conjunction with other metrics (such as adjusted R
2, AIC, BIC, etc.) to comprehensively evaluate model performance.
3.2.2. t-Test of the Model
The
t-test plays a crucial role in model assessment, and it is primarily used to determine the statistical significance of individual model coefficients, assessing whether a variable significantly affects the dependent variable in a statistical context [
36]. This method not only identifies key parameters but also quantifies the specific impact of each variable on the model by calculating
t-values. If all variables of a model pass the
t-test, it significantly enhances the overall credibility of the model, indicating that the statistical parameter estimates are reliable. On an application level, significant results from the
t-test can assist decision-makers in identifying key influencing factors. However, the sensitivity of the
t-test is dependent on sample size and only assesses variables individually, not accounting for potential interactions between variables, marking its limitations. By conducting a comprehensive assessment of the model, integrating the coefficient of determination (R
2) and residual analysis with the
t-test, the accuracy and effectiveness of the predictive model can be ensured, thereby strengthening the model’s credibility.
3.2.3. Uncertainty Analysis
In this study, the stepwise regression model was employed to identify key meteorological factors influencing the occurrence and affected area of forest fires in Yunnan Province. To ensure the model’s reliability, a comprehensive analysis of the uncertainty in model parameters and input data was conducted. Initially, a bootstrapping approach with 1000 resamples was used to evaluate the model coefficients, calculating their standard errors and 95% confidence intervals from these empirical distributions to ensure the stability of the model parameters. Subsequently, the uncertainty in model predictions was assessed by estimating the 95% confidence intervals of the predicted values, using standard error and residual distribution analysis [
37].
3.2.4. RMSE Test
The root mean square error (RMSE), as per Pham B T, et al. [
38], was utilized to determine the percentage error between observed and actual values, as shown in Equation (5). The RMSE formula, an essential tool in model evaluation, compares observed values with predicted ones to ascertain the model’s accuracy. This metric elucidates the model’s performance in terms of prediction accuracy.
where
is the actual observed value, and
is the predicted value by the model.
In this study, the utilized stepwise regression and ARIMA models demonstrated efficiency and accuracy in forest fire prediction. The stepwise regression model effectively identified key meteorological factors, streamlining the model construction process, while the ARIMA model enhanced time series analysis, improving the accuracy of future event predictions. The integration of these two models in this research proved effective in understanding and predicting forest fire dynamics, offering new perspectives and tools for future research and practical applications.
3.3. Data Source
3.3.1. Study Area
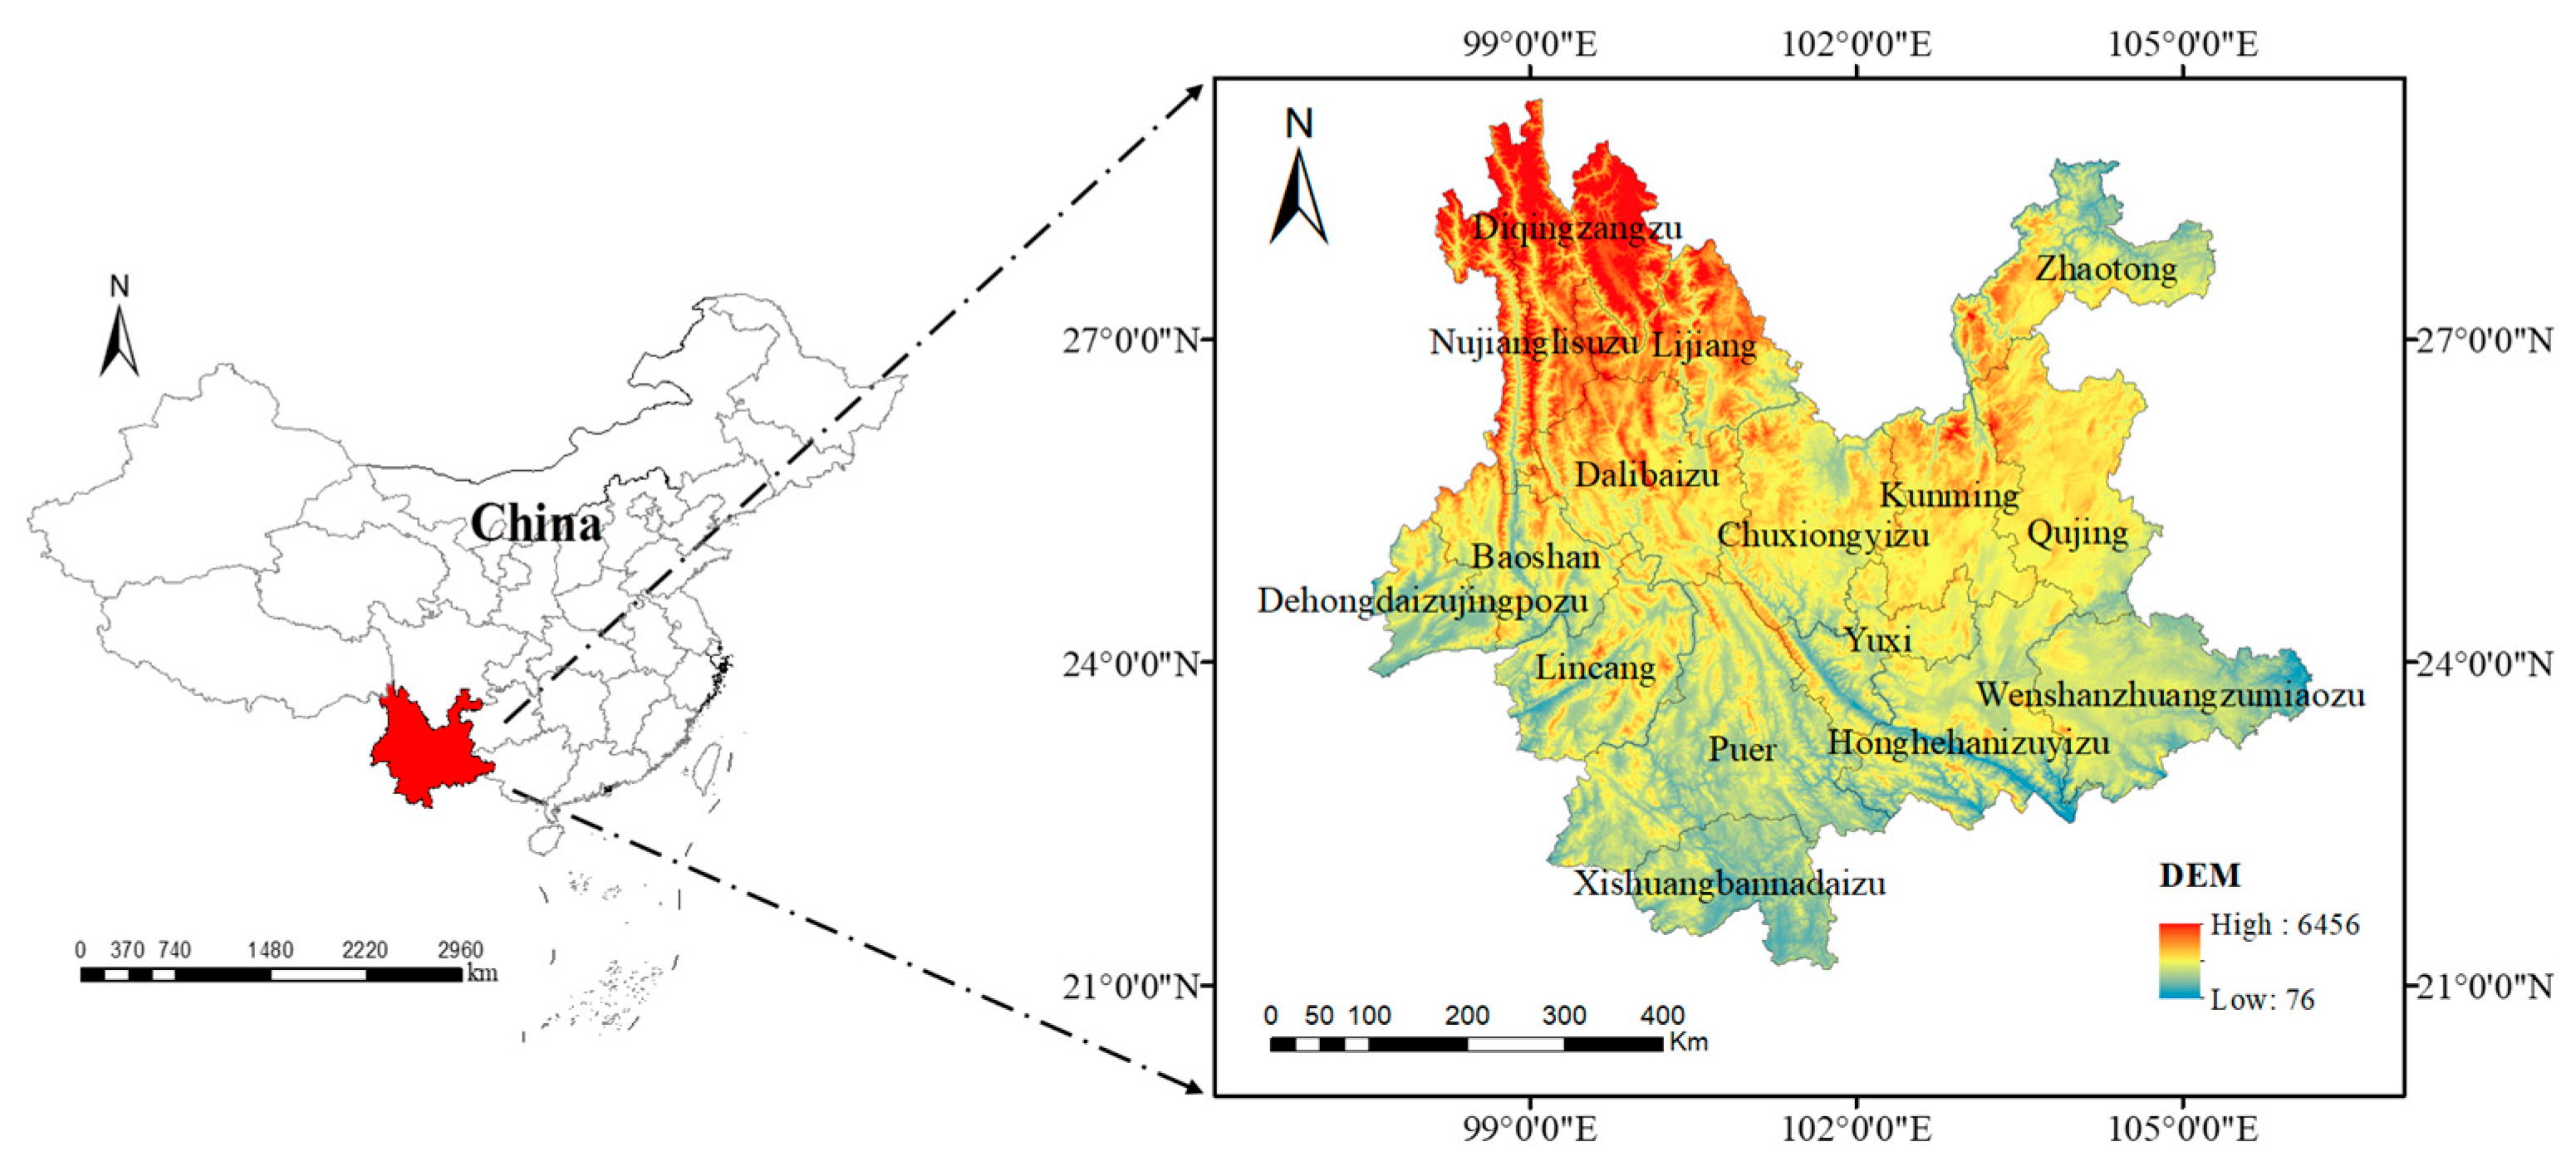
As shown in
Figure 3, Yunnan Province, located in the southwest frontier of China, spans from 21°8′32″ N to 29°15′8″ N latitude and from 97°31′39″ E to 106°11′47″ E longitude. The province stretches approximately 865 km east-west and about 990 km north-south, covering an area of around 394,000 square kilometers. This accounts for 4.11% of China’s total area, ranking it eighth among all provinces. Yunnan is characterized by its subtropical highland monsoon climate, distinguished by small annual but large diurnal temperature variations and a clear distinction between the dry and wet seasons. Average temperatures in July range from 20 °C to 23 °C, while in January, they range from 7 °C to 11 °C [
39].
Yunnan has always been a focal point for forest fire prevention in China due to its challenging fire prevention situation. It is one of the provinces richest in forest resources in the country, boasting the third-largest forested area in China, accounting for 10% of the national forest area, approximately 2273 hectares. The province has a high forest coverage rate of 59.30% and a greening rate of 67.82%. The total standing volume of live trees is about 1.913 billion cubic meters, with forest reserves estimated at 1.895 billion cubic meters. Due to lower rainfall during the dry season (November to April), which accounts for only 15% of the annual rainfall, Yunnan is a high-incidence area for forest fires and has been designated as a national key fire prevention region [
40].
3.3.2. Data Source
The data on the number and area of forest fires in Yunnan Province from 1991 to 2021 were obtained from the “Yunnan Disaster Reduction Yearbook” and the official website of the Yunnan Provincial Forestry Bureau [
41] (
http://lcj.yn.gov.cn/, accessed on 1 November 2023). The related meteorological data, including annual average temperature, relative humidity, annual average rainfall, and average wind speed, were sourced from the National Meteorological Science Data Center, encompassing 17 meteorological stations across Yunnan Province. For missing parts in the dataset, long-term average values from these meteorological stations were used as substitutes. These long-term averages, derived from multi-year observational data, effectively reflect the typical climatic conditions of the region and are considered reliable representations of the climatic characteristics.
The forest fire and meteorological data collected for this study, spanning from 1991 to 2021 in Yunnan Province, form the foundation for our analysis. The collection and processing of these data, including the treatment of missing data, ensured comprehensive and accurate analysis. These datasets not only supported the construction and validation of the stepwise regression and ARIMA models but also provided valuable insights into the historical patterns and trends of forest fires in Yunnan Province.
4. Results and Analysis
4.1. Analysis of Meteorological Factors on Historical Forest Fire Occurrences
4.1.1. Trends in Historical Forest Fire Occurrences and Affected Areas
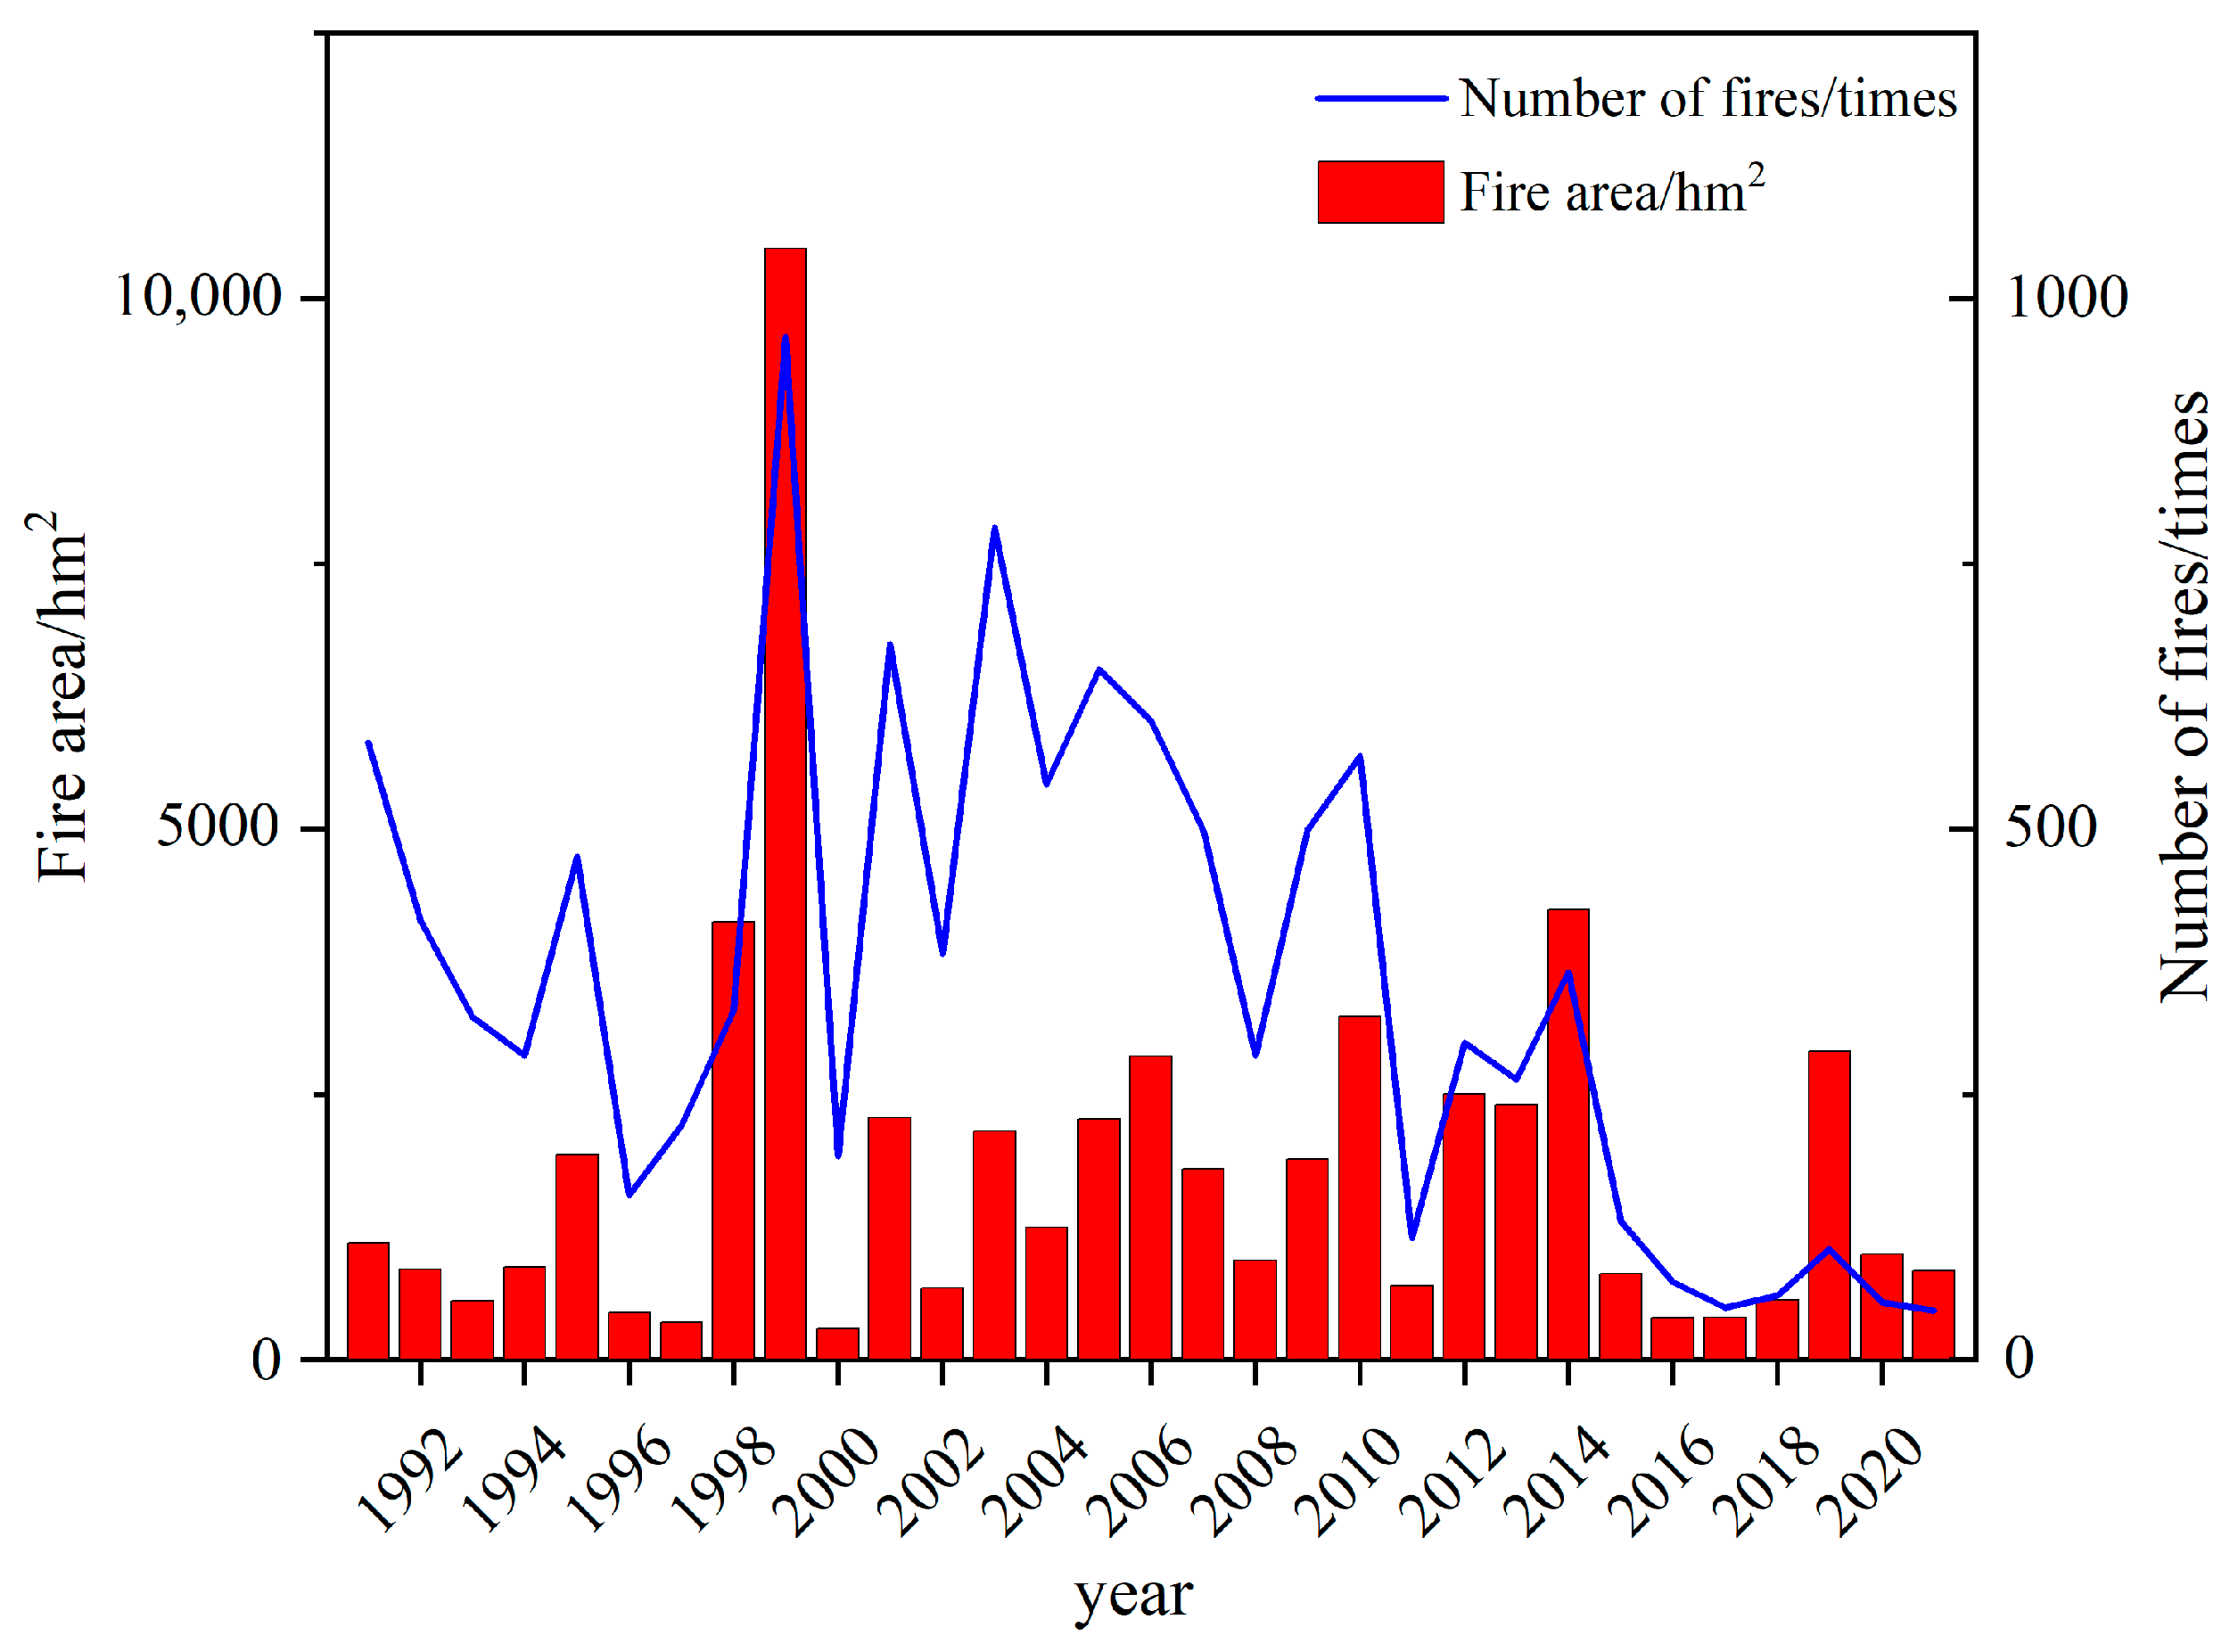
As shown in
Figure 4, between 1991 and 2021, Yunnan Province experienced a total of 10,986 forest fires, affecting an area of approximately 57,000 hectares. From 1991 to 1997, the frequency and scale of the fires were relatively stable. However, in 1999, due to extreme drought, insufficient fire prevention awareness, and outdated equipment, the fires were particularly severe. The period from 1998 to 2000 experienced extreme drought conditions, significantly increasing the likelihood of forest fires. Such extreme weather conditions could lead to atypically high peaks in fire occurrences [
42]. From 2014 to 2018, the implementation of innovative fire regulations and enhanced monitoring and prevention measures effectively reduced the number and scale of fires in Yunnan Province [
43,
44].
In the spring and early summer of 2019, Yunnan experienced a historically rare seasonal drought, resulting in rapid fire spread and significant ecological damage [
45]. Research indicates that in 2019, Yunnan was undergoing a warm and dry climatic trend, making the region more susceptible to droughts, with annual average precipitation decreasing by about 15 mm every decade and average temperatures rising approximately 0.19 °C per decade [
46]. Compared to the drought in 2009–2010, the 2019 drought had a more significant impact on water resource storage in the southern regions of the province. The area became prone to drought even under higher rainfall conditions [
47].
4.1.2. Analysis of Temperature’s Impact on Forest Fires
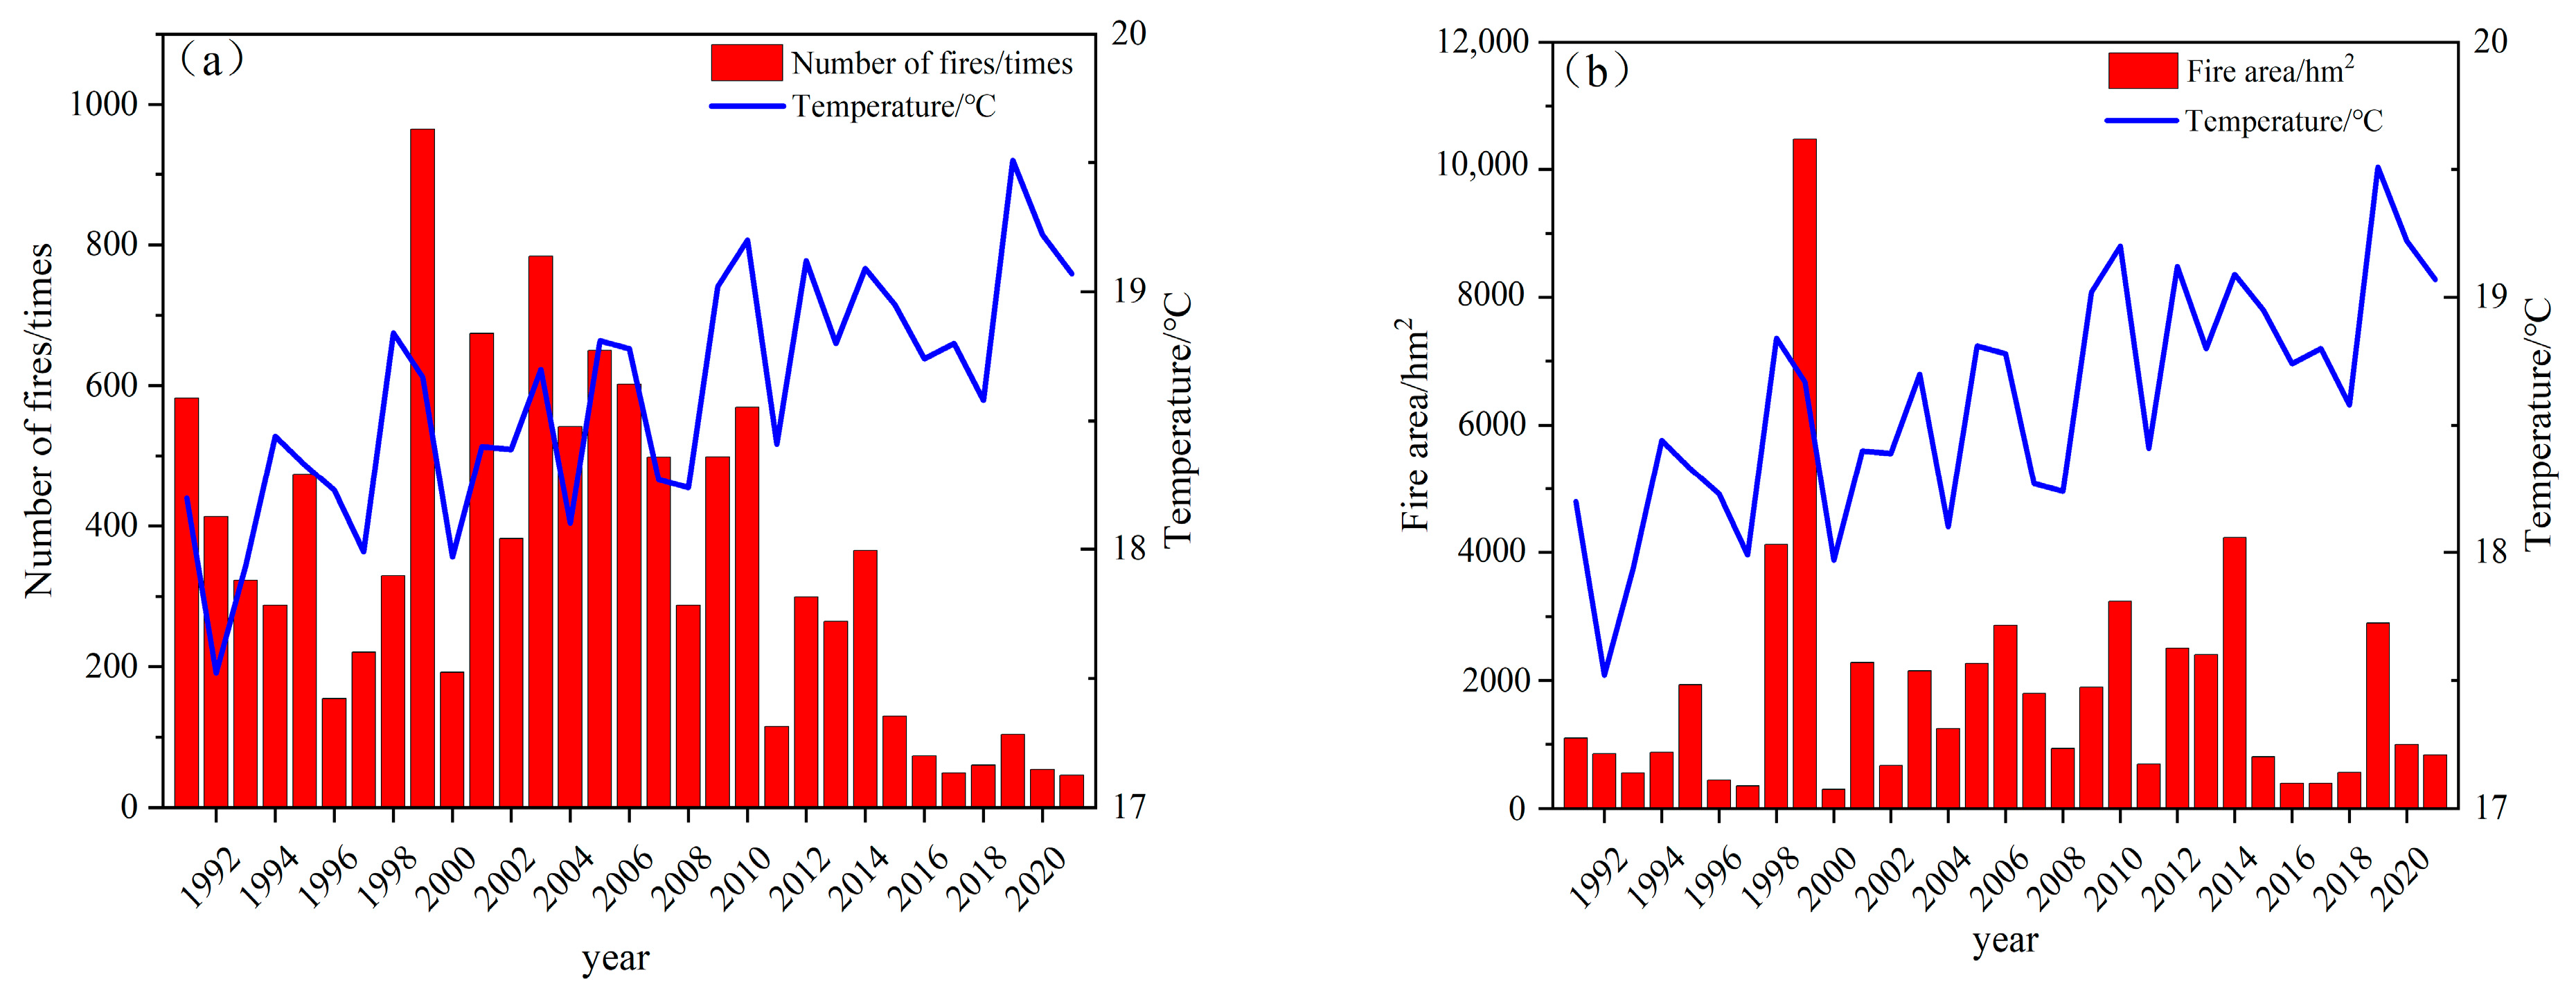
In examining the temporal dynamics of forest fires from 1991 to 2020,
Figure 5a,b reveal a positive correlation between the number of fires and the total affected area with annual temperature. Notably, peak occurrences and areas affected by forest fires were particularly pronounced in 1991, 1999, 2001, and 2003, corresponding to periods of rising temperatures. This suggests that increasing temperatures may amplify both the likelihood and extent of forest fires. The upward trend in annual temperatures highlights the potential impact of climate on forest fire behavior, underscoring the importance of incorporating temperature into fire risk assessment models [
48,
49].
4.1.3. Analysis of Annual Precipitation’s Impact on Forest Fires
Figure 5c,d demonstrate the correlation between annual average precipitation and the frequency and area affected by forest fires in Yunnan Province from 1991 to 2021. The analysis indicates that in years such as 1992, 1997, 2004, and 2010, a higher number of fires and larger affected areas were closely related to lower annual average precipitation, suggesting that reduced rainfall is a key climatic factor in escalating forest fire risk. The decrease in precipitation is not only linked to an increase in the frequency of fires but also significantly correlates with the expansion and severity of fires. These findings emphasize the importance of including annual average precipitation as a key variable in forest fire risk assessment and early warning systems to enhance the accuracy of forest fire predictions [
50]. In formulating policies and management measures, the potential impact of reduced rainfall due to climate change on fire risk should also be considered to develop effective adaptive management strategies.
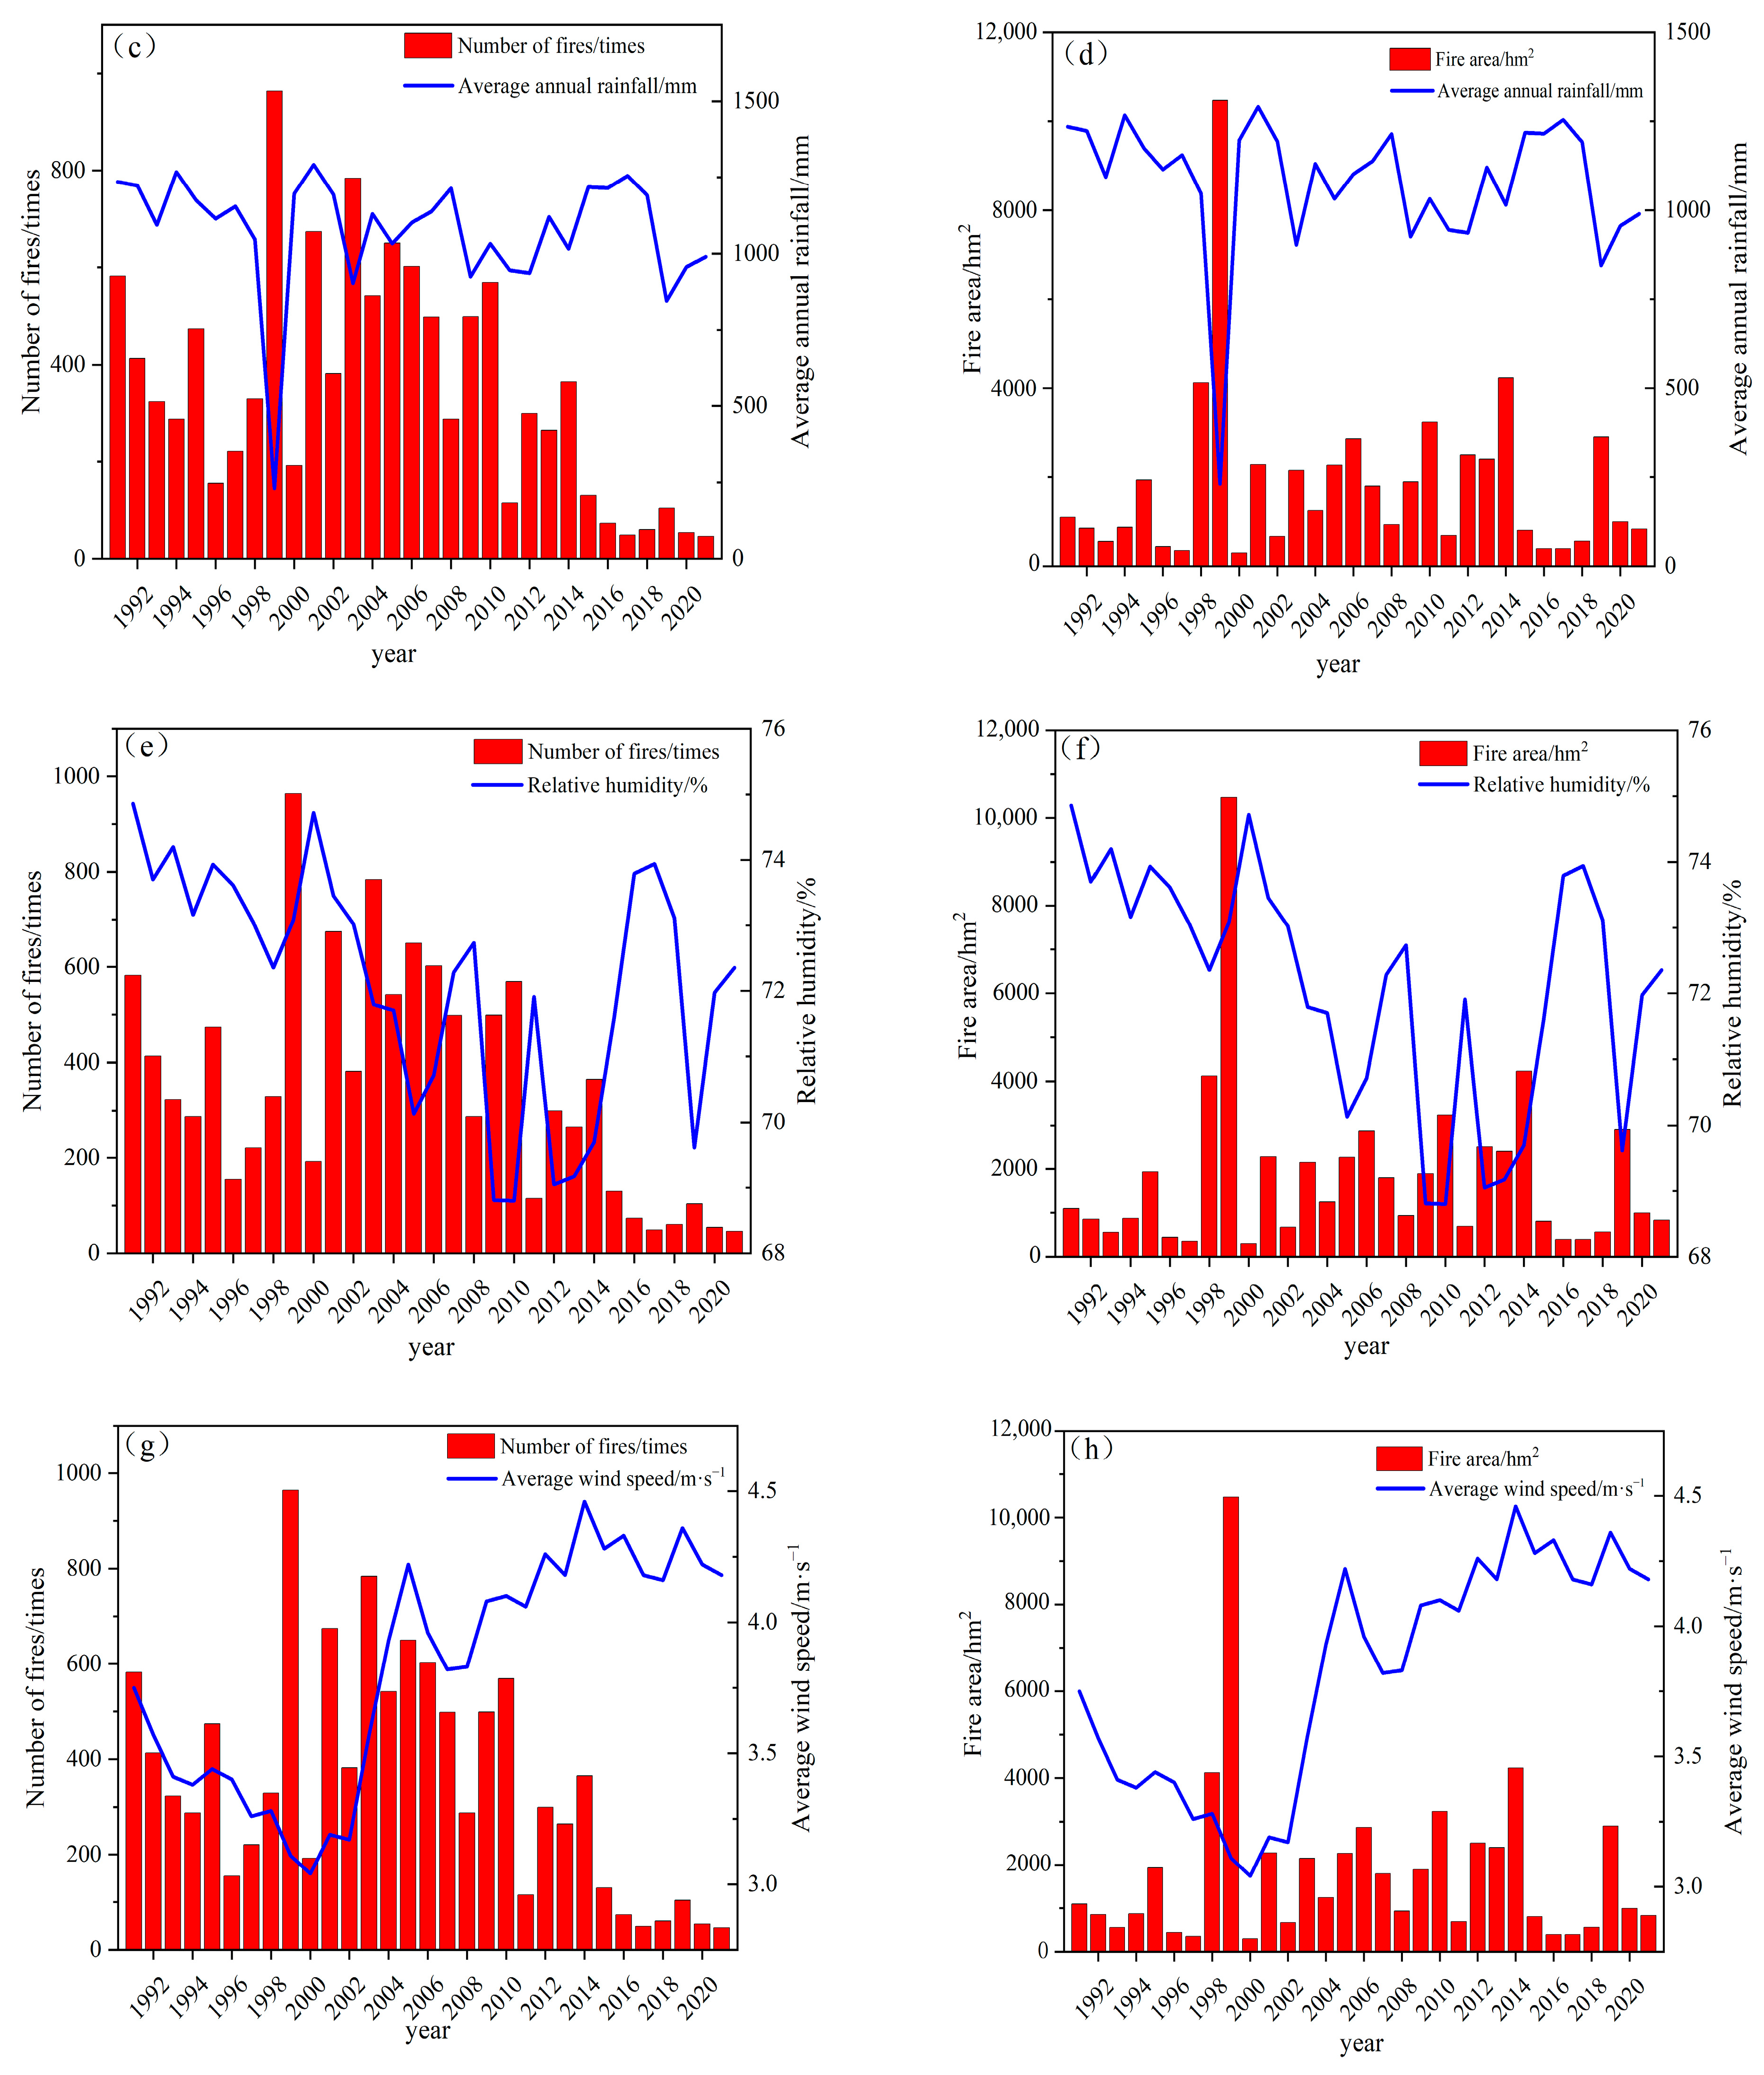
4.1.4. Impact of Average Humidity on Forest Fires
Figure 5e displays the variation in the number of annual forest fires in Yunnan Province from 1991 to 2021 under different relative humidity conditions. It was observed that in years such as 1997, 1999, 2004, and 2010, the frequency of forest fires showed a significant negative correlation with lower relative humidity, indicating that reduced humidity levels may lead to more frequent fires. Similarly,
Figure 5f reflects that in the aforementioned years, the areas affected by fires expanded with the decrease in relative humidity, highlighting the impact of dry conditions on increasing the scale and intensity of fires. A comprehensive analysis indicates a significant negative correlation between the rate and severity of forest fires in Yunnan Province and relative humidity, especially in years with the most notable number of fires and affected areas. This phenomenon underscores the critical role of relative humidity in forest fire prevention and risk assessment [
51]. Therefore, in forest management strategies, meteorological factors like relative humidity should be integrated to optimize fire risk assessment models, enabling the formulation of more precise and effective prevention and control measures.
4.1.5. Impact of Wind Speed on Forest Fires
Between 1991 and 2021, the occurrence and affected areas of forest fires in Yunnan Province were correlated with average wind speed.
Figure 5g shows that the number of fires peaked in 1997, 2004, and 2010, coinciding with higher average wind speeds in these years, suggesting that increased wind speeds may have facilitated the occurrence and spread of fires. The trend of the affected area increasing with wind speed, as shown in
Figure 5h, further confirms the influence of wind speed on the propagation of fires. In particular, in years with significant fire occurrences and affected areas, the characteristic of higher wind speeds is evident. This finding emphasizes the role of wind speed in the dynamics of forest fires, which is crucial for risk assessment and prevention strategies for forest fires [
52]. Future research should delve deeper into the intrinsic mechanisms of the relationship between wind speed and forest fires and consider climate factors like wind speed in predictive models.
4.2. Stepwise Regression Model
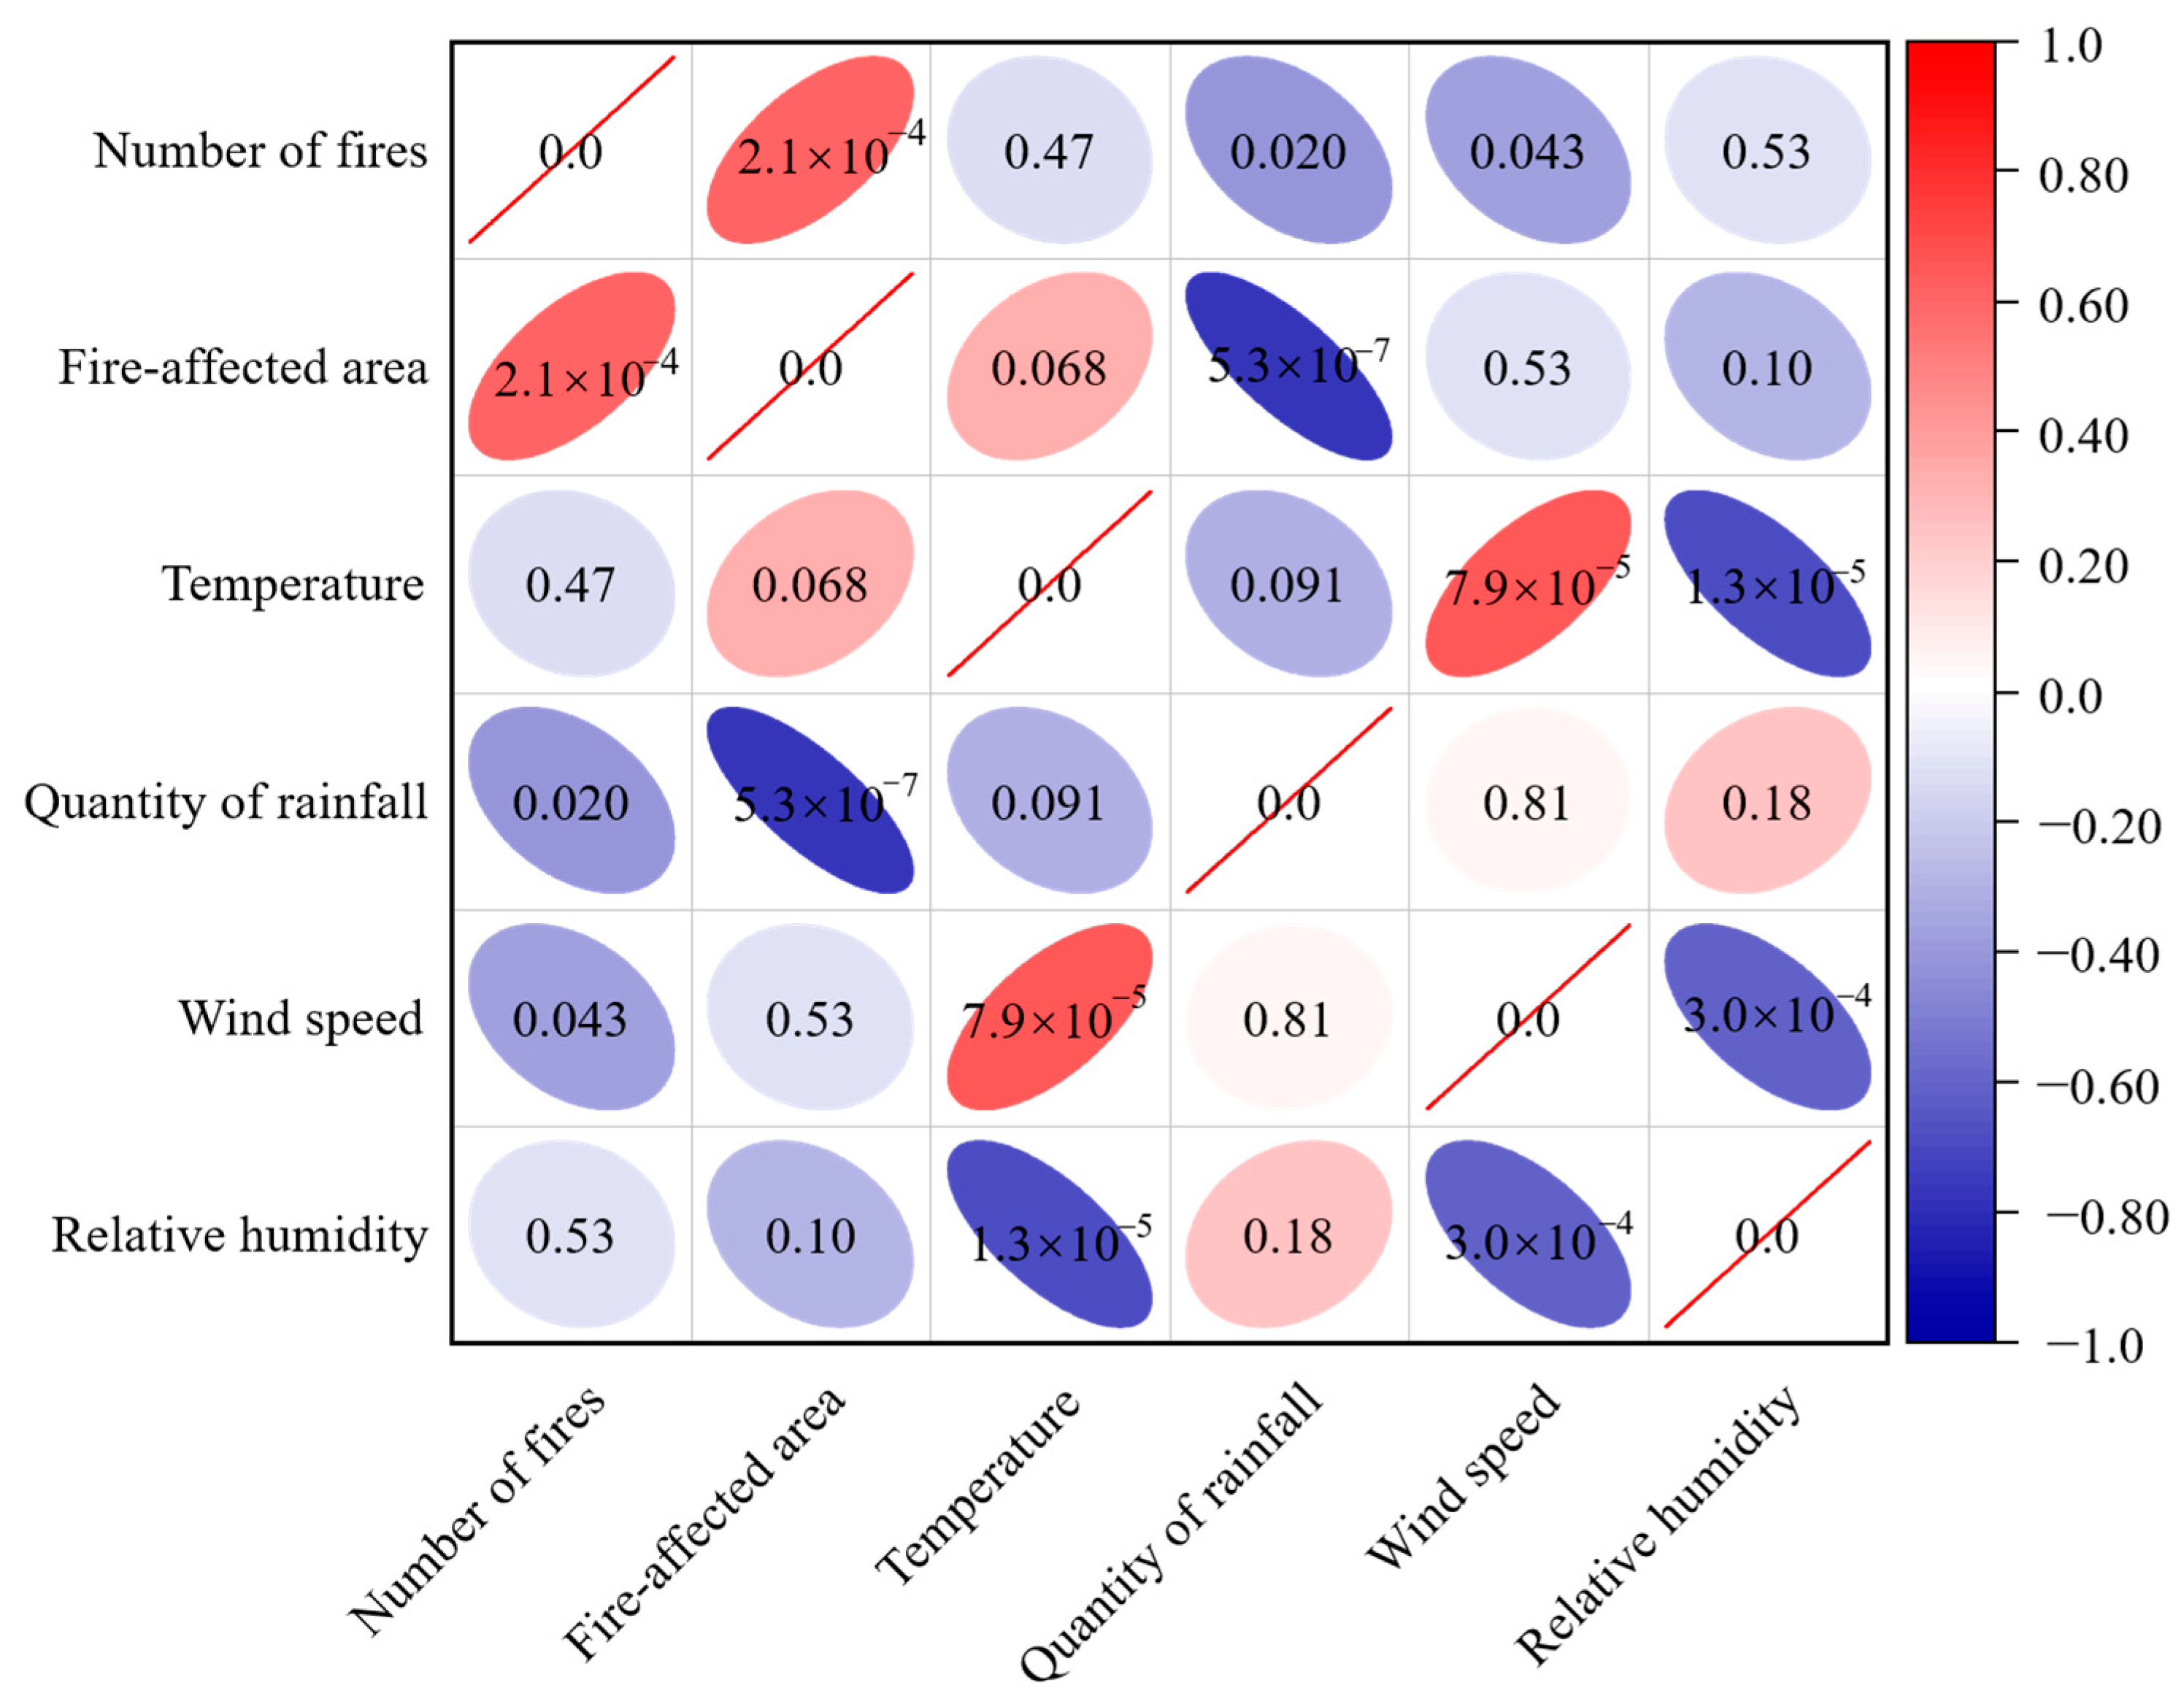
4.2.1. Correlation Analysis between Meteorological Factors and the Occurrence of Forest Fires
Meteorological factors play a crucial role in determining the occurrence of forest fires [
53,
54]. As illustrated in
Figure 6, there is a significant negative correlation between the annual average rainfall and wind speed and the frequency of forest fires in Yunnan Province (
p < 0.01). Similarly, a notable negative correlation exists between annual average rainfall and the area affected by fires. In contrast, there is no direct correlation between the annual average temperature and humidity and the occurrence and spread of forest fires.
This can be attributed to the significant diurnal temperature variations and humidity fluctuations in Yunnan. With July’s highest temperatures ranging from 19 °C to 22 °C and January’s lowest temperatures remaining above 6 °C to 8 °C, the province experiences an annual temperature fluctuation of about 10 °C to 12 °C. This indicates that the average temperature and relative humidity in the province do not directly affect the rate of forest fires and fire damage area [
55].
4.2.2. Model Fitting and Prediction
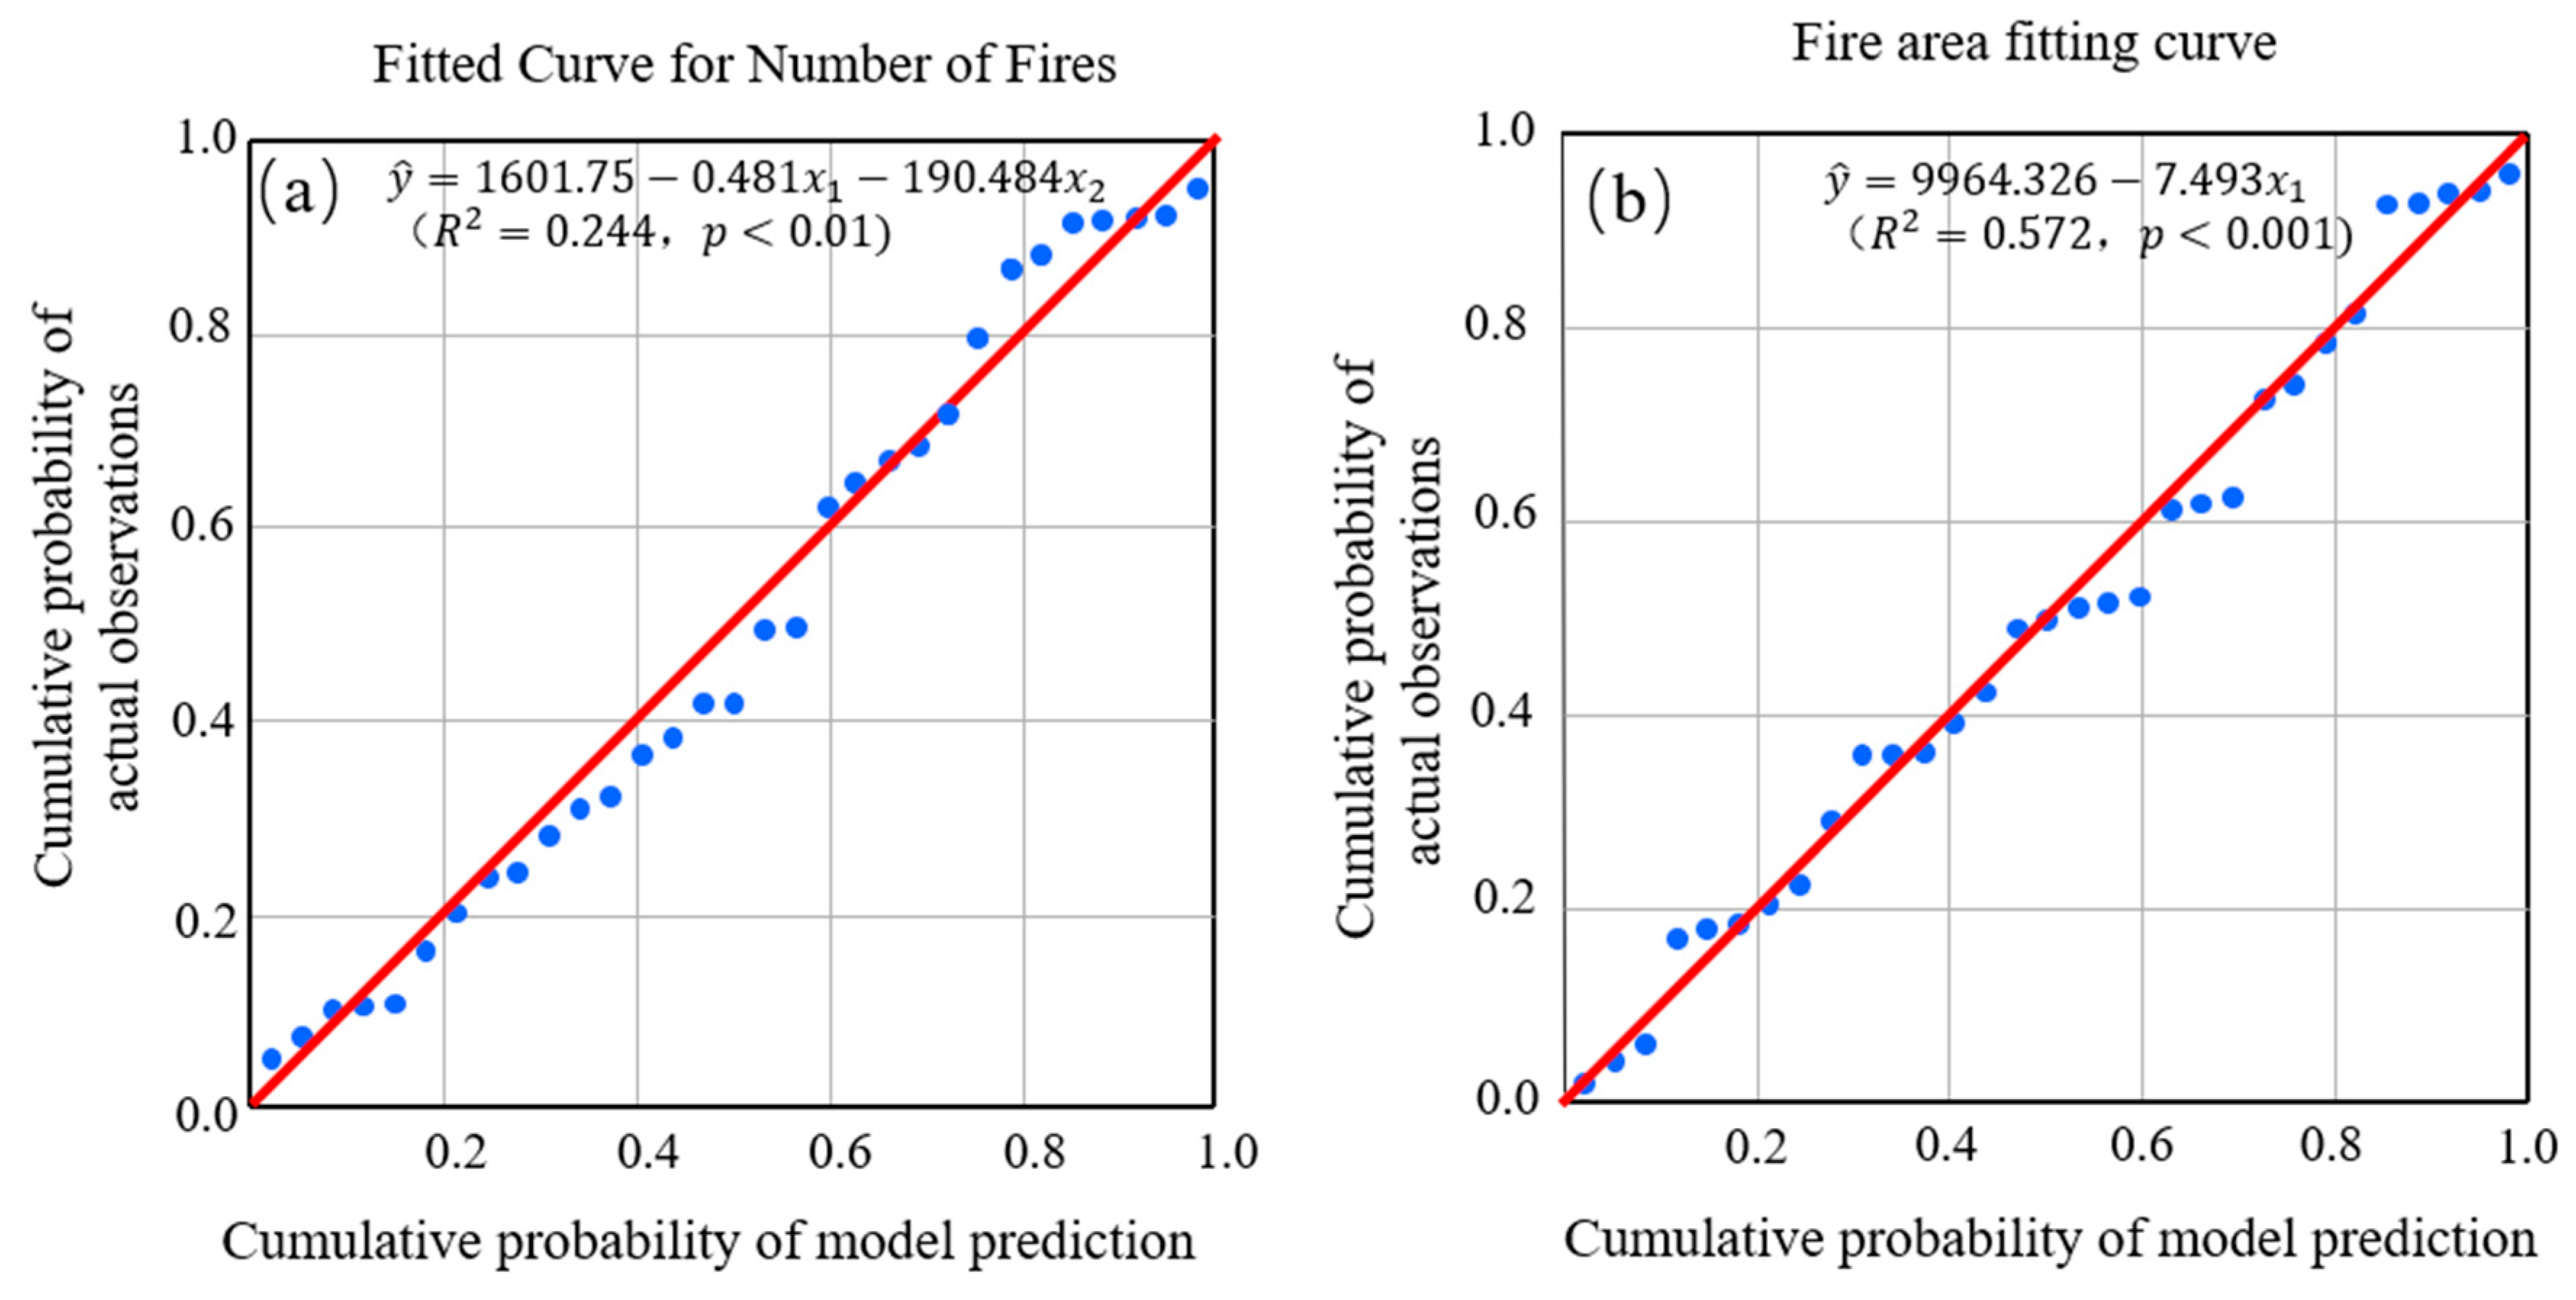
Based on the significant impact of annual average rainfall and average wind speed on the frequency of fires, as well as the particularly notable impact of annual average rainfall on the area affected by fires, a stepwise regression equation model was developed to precisely fit the relationship between these meteorological variables and fire characteristics. As illustrated in
Figure 7 and
Table 2,
Figure 7a displays the fitted curve for the number of fires:
(where
represents annual relative humidity, where
represents annual average rainfall) with an
of 0.244 and
p = 0.008 < 0.01.
Figure 7b presents the fitted curve for the area affected by fires:
(with
and
). The closer the data points cluster near the diagonal line, the higher the concordance between the model predictions and actual observations. These analytical results quantify the impact of meteorological factors on fire characteristics, thereby enhancing our understanding in this domain.
In this regression analysis, the results of the model, as shown in
Table 3, reveal significant correlations between varying levels of rainfall, wind speed, and the number and area of forest fires. Positive coefficients indicate a direct correlation between the independent and dependent variables, whereas negative coefficients reflect an inverse relationship. The standard error measures the precision of the estimates. The
p-values of all coefficients (all at 0.000) are statistically significant, providing a robust foundation for further predictive analysis and theoretical inferences.
After conducting a paired T-test between the actual and predicted values, as presented in
Table 4, we obtained a T-value of 0.000 and a
p-value of 1.000, which is greater than 0.01. This result indicates no significant difference between the actual and predicted values, confirming the high accuracy of the model. Root mean square error (RMSE) tests, based on the fitting equation, revealed that the RMSE for the number of fires was 200 occurrences, while the RMSE for the area affected by the fires was 1130 hectares.
4.2.3. Uncertainty Analysis
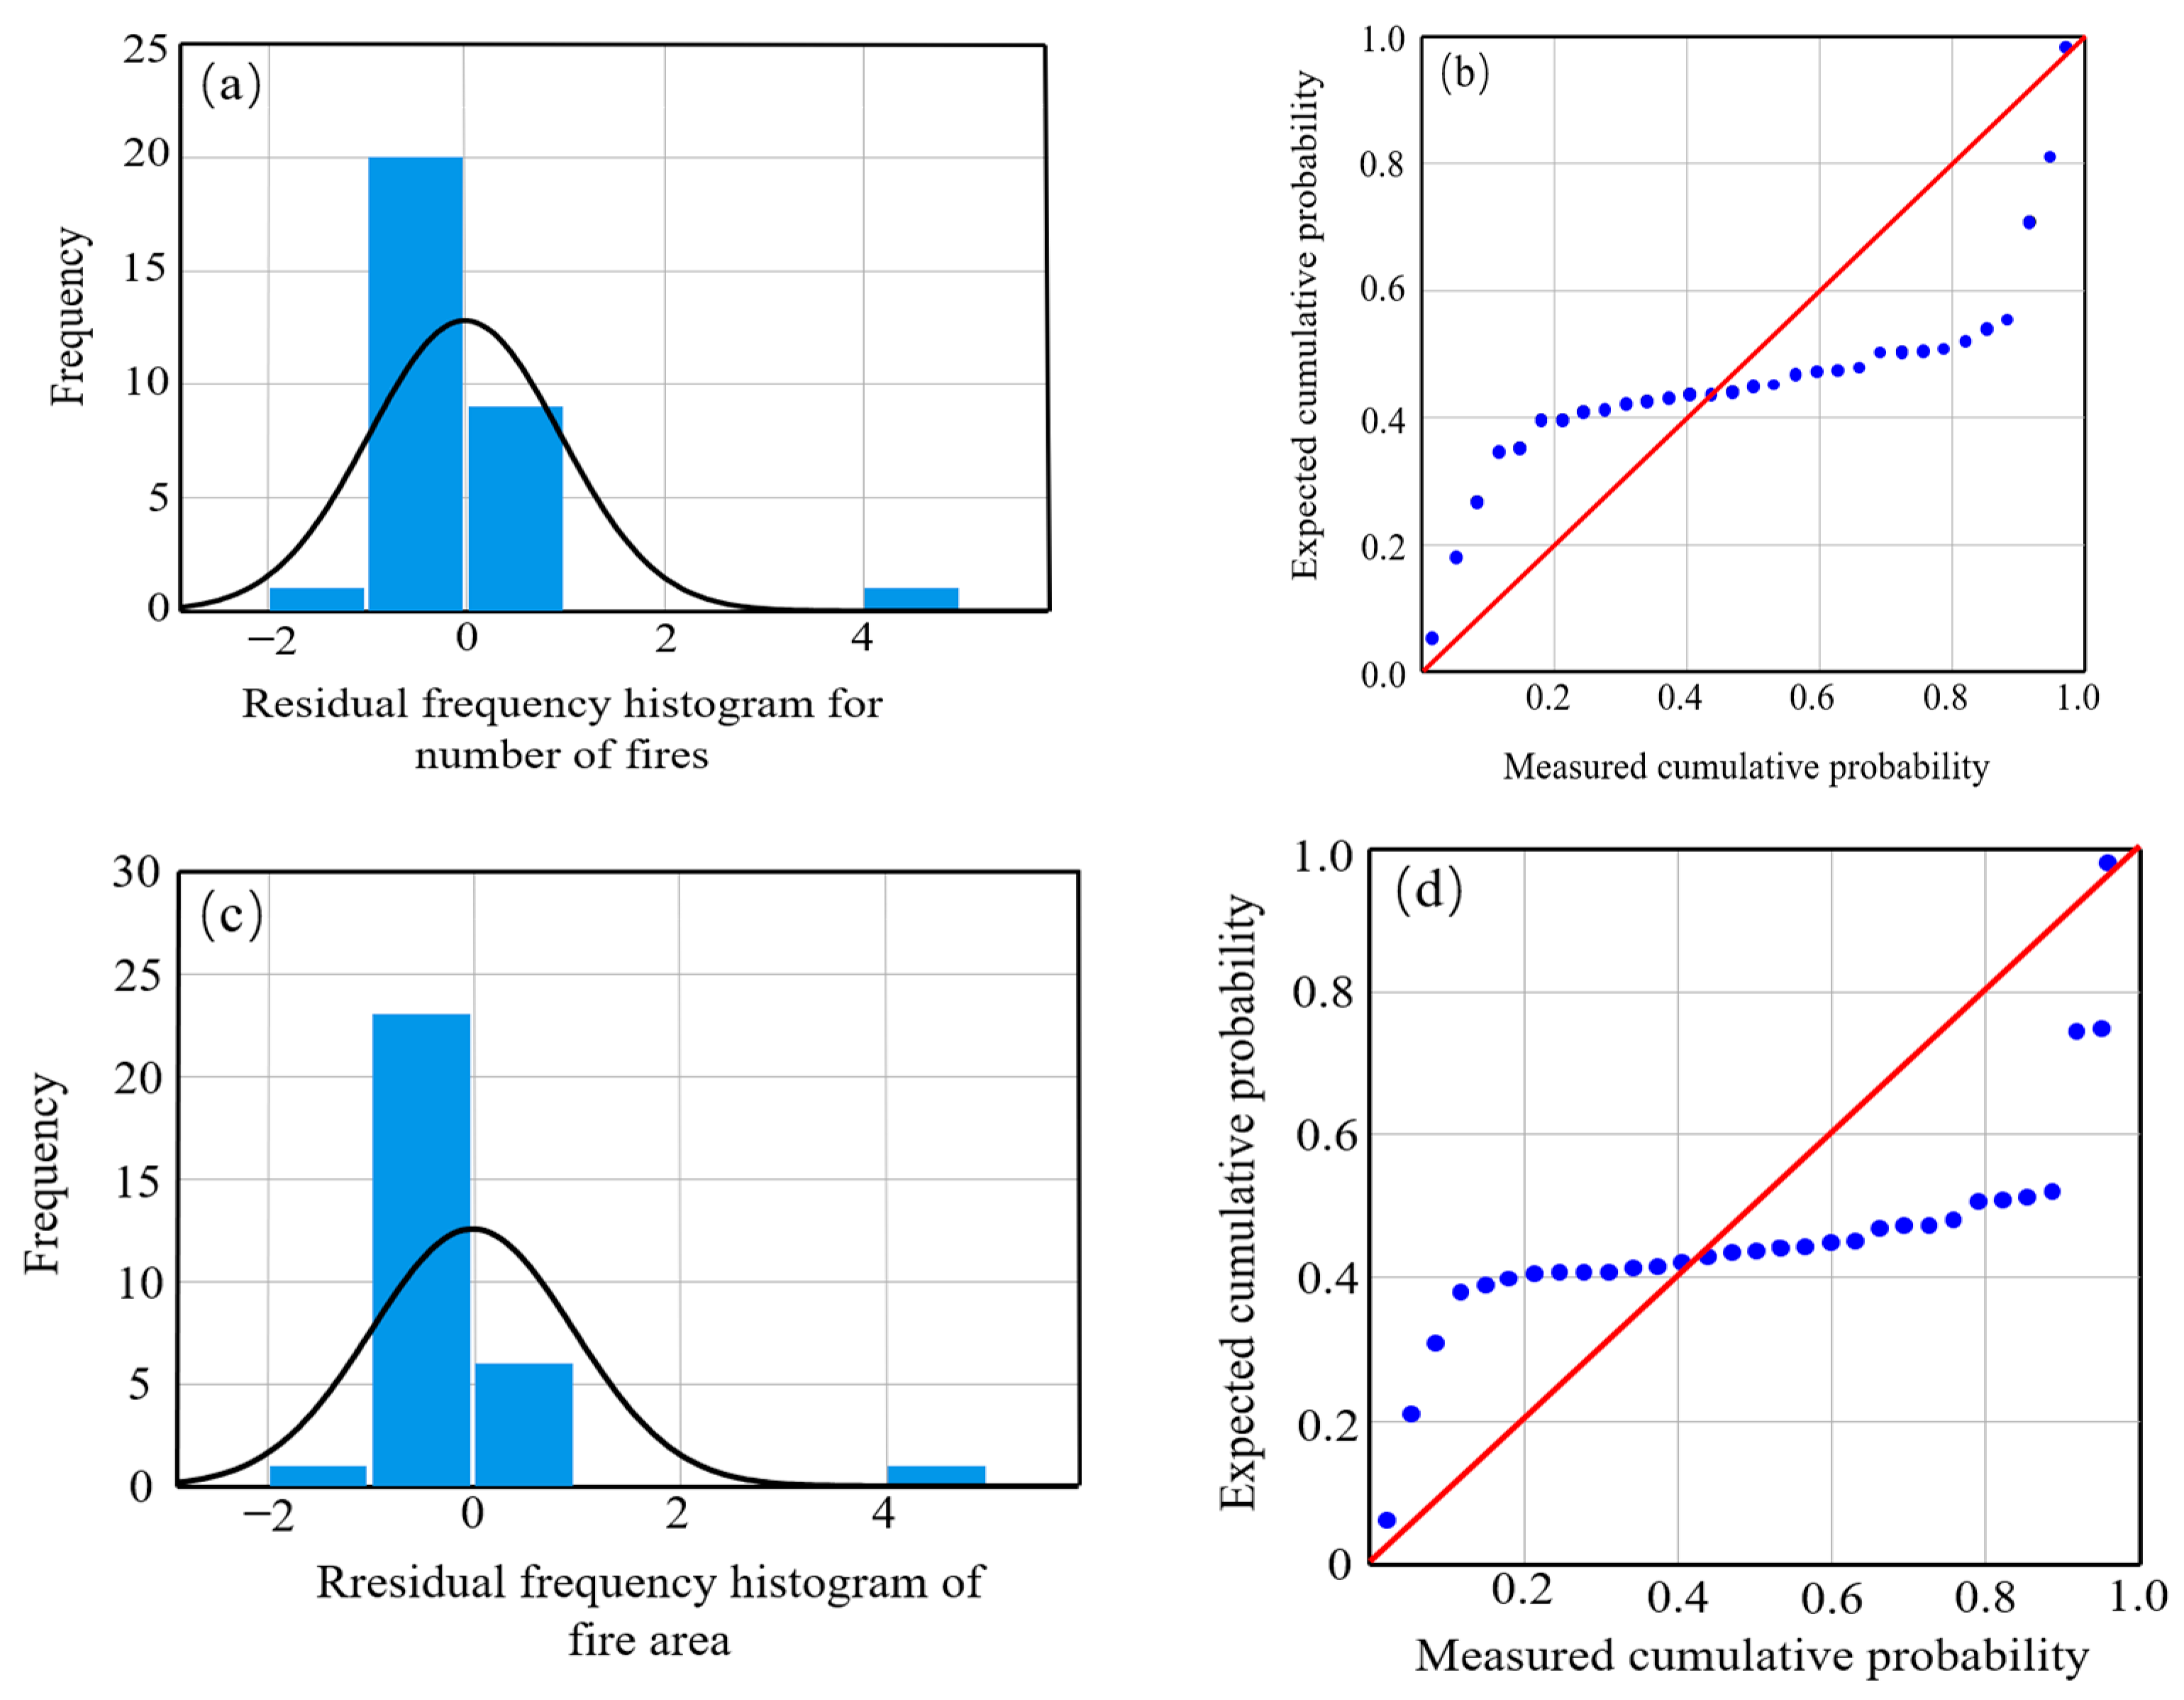
An analysis of the model’s effectiveness was conducted, as illustrated in
Figure 8. Residual analysis revealed slight deviations; however, the distribution of residuals was largely consistent with the theoretical normal distribution. This consistency supports the validity of the model.
4.3. Analysis of ARIMA Model Construction and Prediction Results
4.3.1. ADF Test
For the data on the number of forest fires in Yunnan Province from 1991 to 2021, the Augmented Dickey–Fuller (ADF) unit root test was employed to verify their stationarity. Given the absence of a distinct trend in the original data, the ADF test, including only the intercept term, was conducted. Detailed results of this test are presented in
Table 5.
In the ADF test, the
p value was 0.5336, which is greater than 0.05. This suggests that at the 95% significance level, the null hypothesis is accepted, pointing to non-stationarity in the data. Given the visible non-stationarity in the forest fire data, a first-order differencing was applied, with the results detailed in
Table 6.
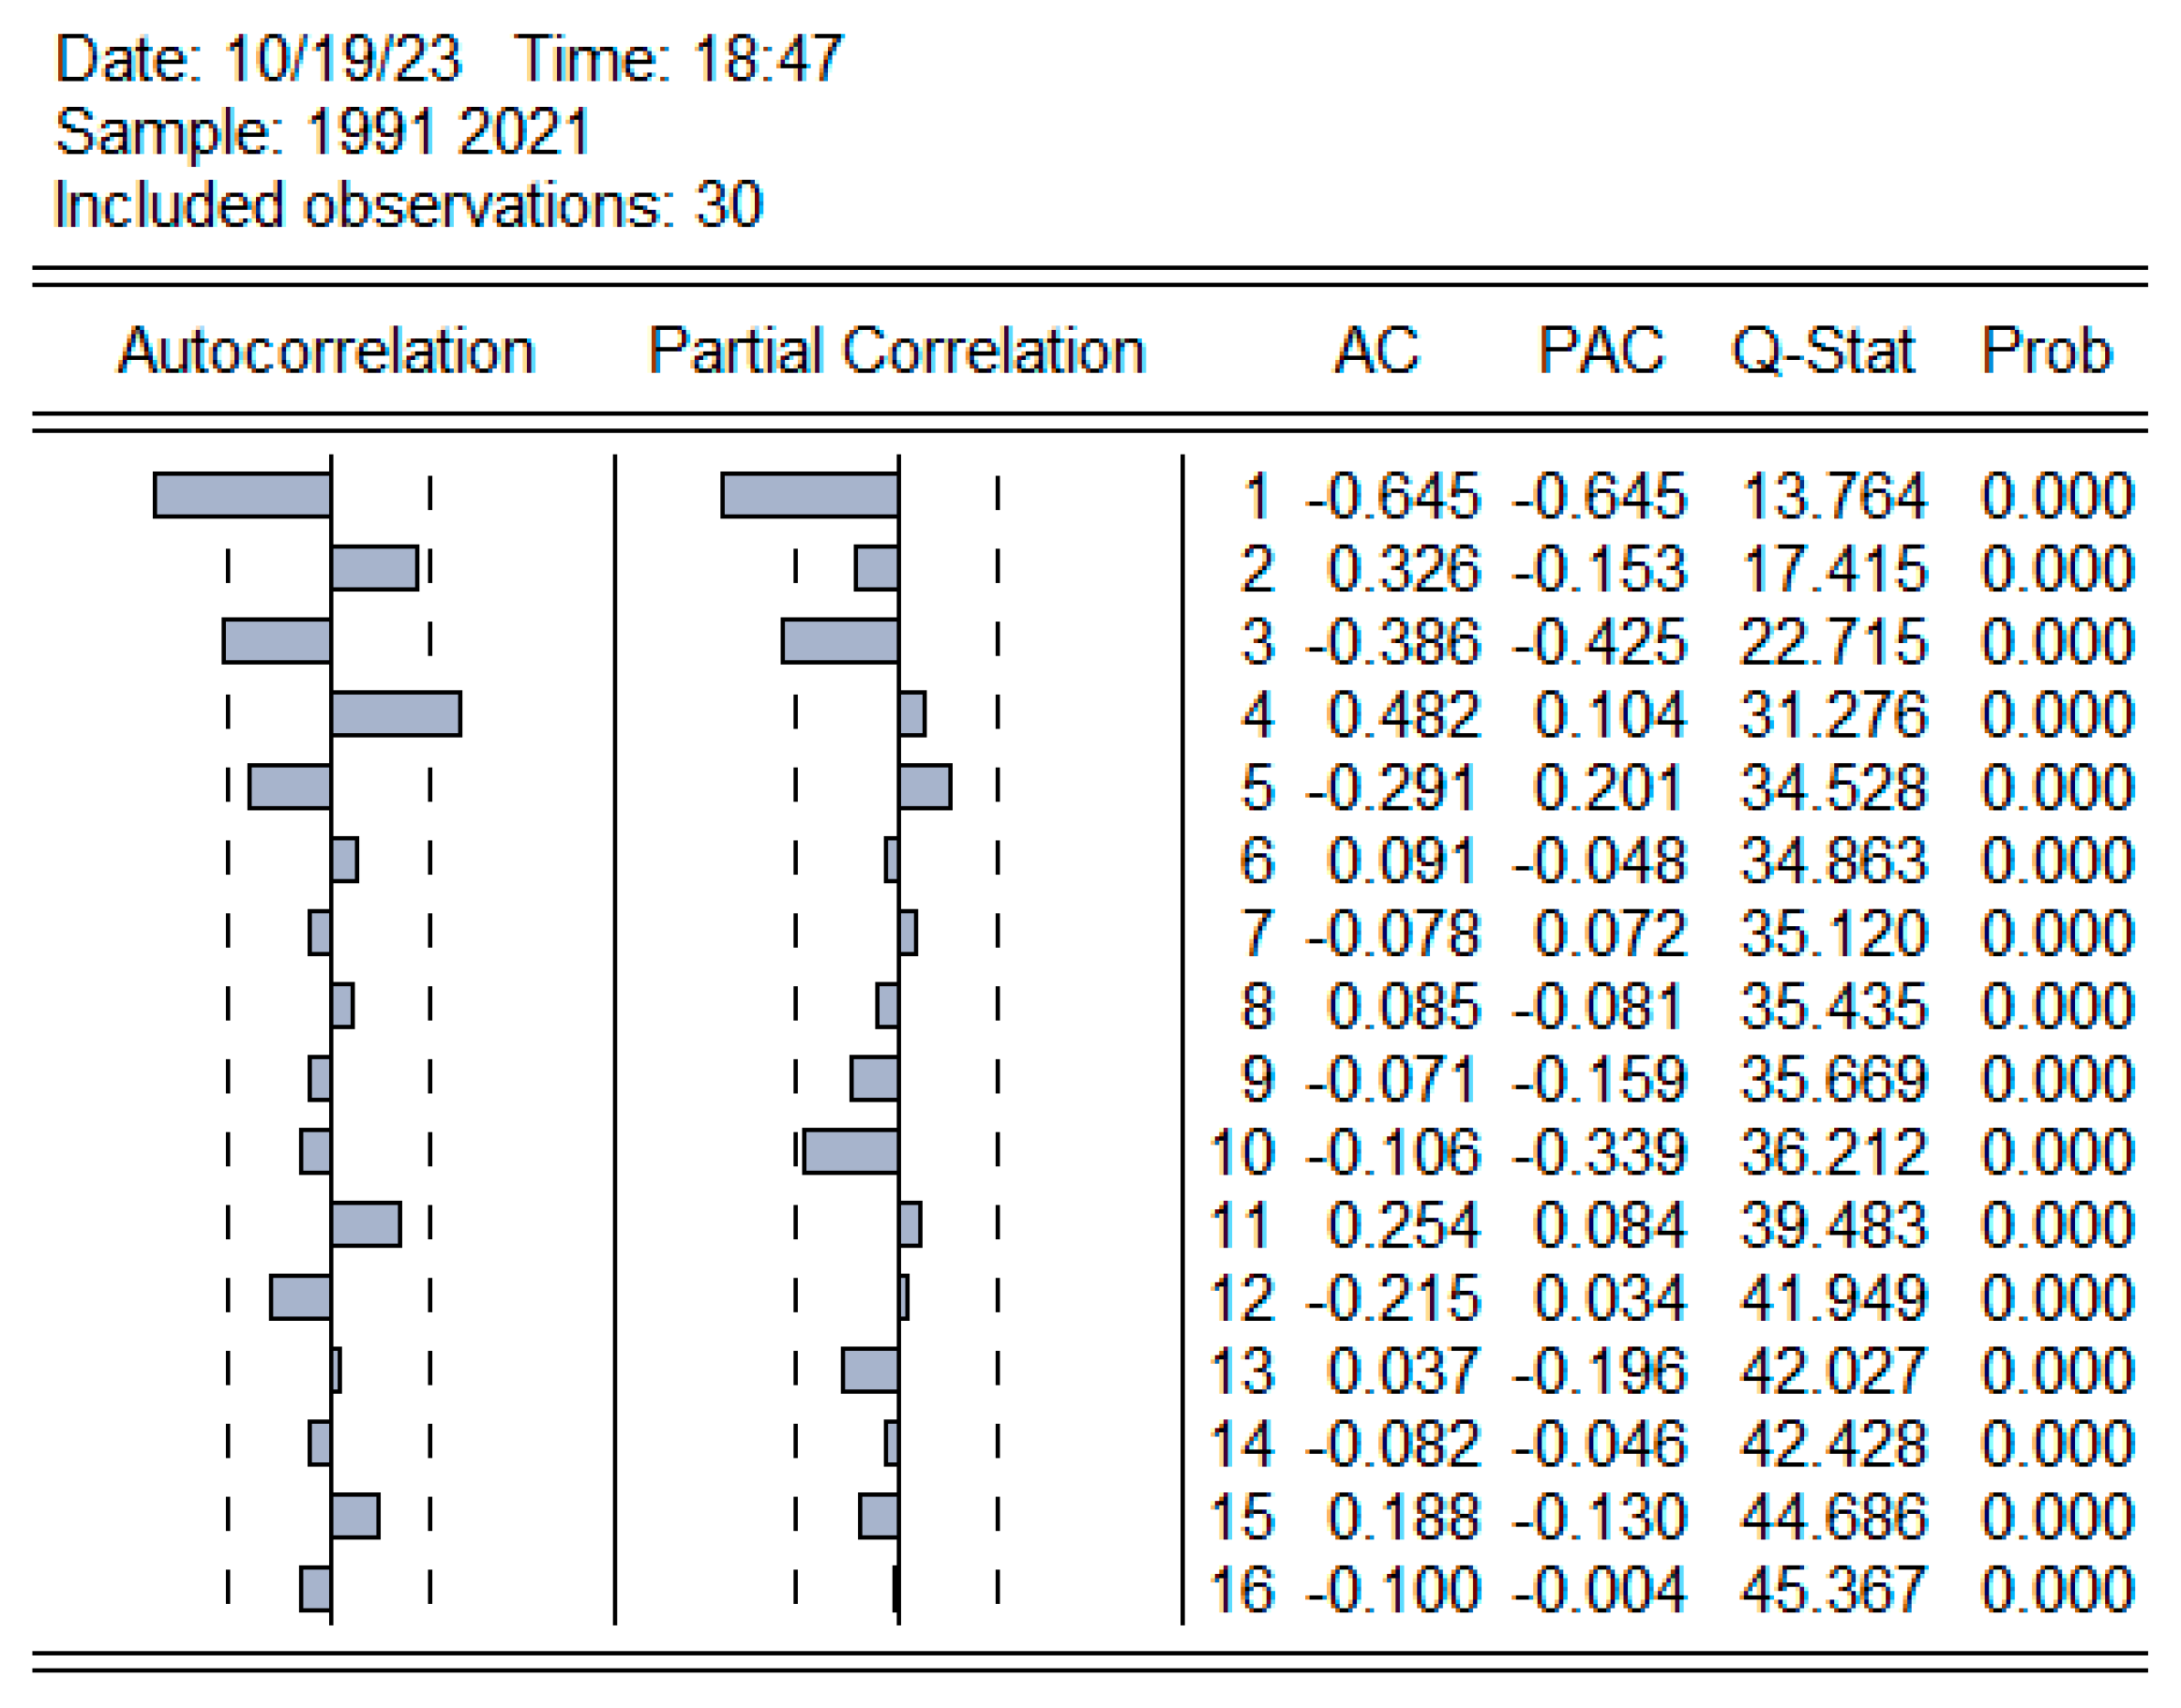
Table 6 presents the results of the Augmented Dickey–Fuller (ADF) test for the first-differenced data. As indicated in the table, the
p-value is 0.000, which is less than 0.05. This signifies that the data on forest fire occurrences, after the first-order differencing, are stationary and have passed the significance test. Utilizing the Q-statistic test [
56] and employing EViews 8.0 software, the autocorrelation and partial autocorrelation plots were obtained, as shown in
Figure 9.
4.3.2. Model Order Determination
The order of the ARIMA model was determined by observing the autocorrelation and partial autocorrelation plots, selecting an appropriate model and lag order for estimation.
Figure 9 shows that the autocorrelation coefficients are significantly non-zero at lag 4. Considering subjectivity, the range for q was set between one and five. The partial autocorrelation coefficients also appeared significantly non-zero after lag 3, setting the range for p between one and four. Due to the uncertainty in the number of forest fires, modeling was complex. To identify the best model, multiple ARIMA (p, d, q) models were established, and their test results are listed in
Table 7. In selecting the model, criteria such as R
2, AIC, SC, HQC, and the standard error of regression were considered [
57]. Lower AIC, SC, and HQC values, along with a larger residual, typically indicate a more optimal ARIMA model.
Although the Akaike Information Criterion (AIC), Schwarz Criterion (SC), and Hannan–Quinn Criterion (HQC) are commonly used for model order selection, their minimum values are not the sole criteria for determining the optimal model [
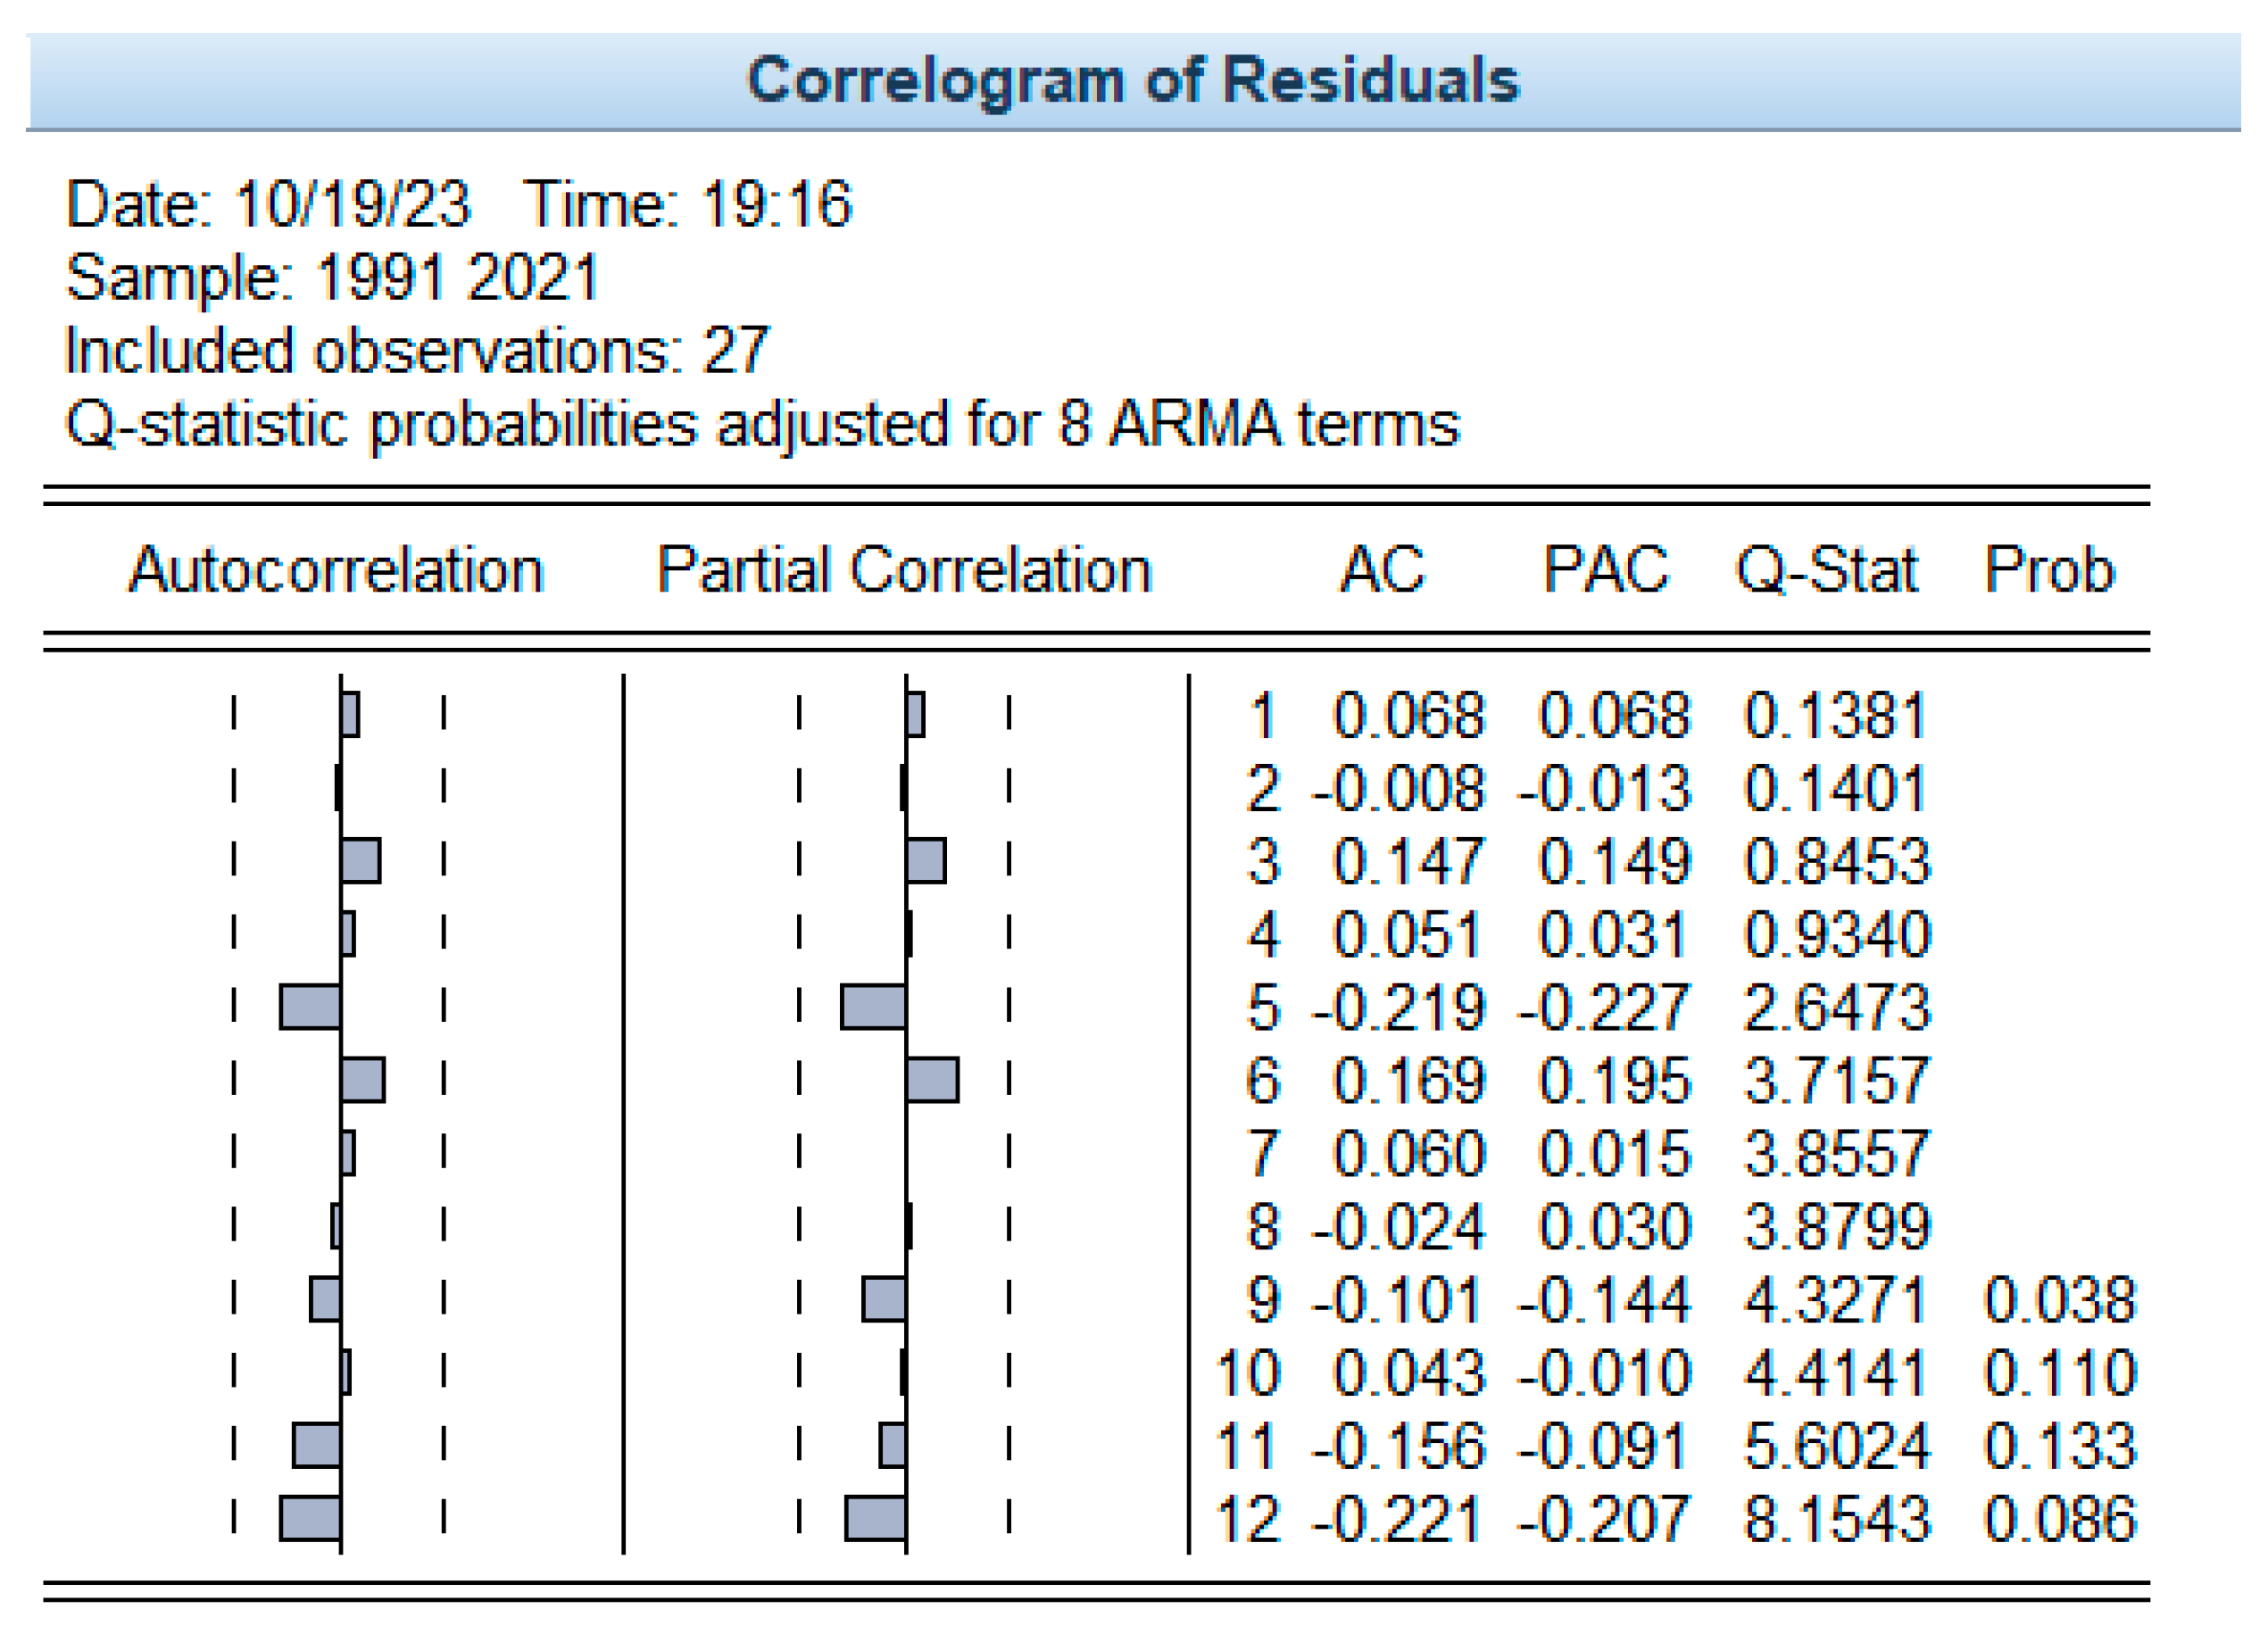
58]. In this study, we initially selected the ARIMA model with the lowest AIC, SC, and HQC values and conducted a randomness test on the estimated residuals of this model. If the model passed this test, it was considered optimal. If not, the model with the next lowest AIC, SC, and HQC values was considered, and this iterative process continued until the best model was identified. The residuals of the fitted ARIMA (3,1,5) model were subjected to a white noise test. The autocorrelation and partial autocorrelation plots of the residual series are shown in
Figure 10, indicating that the residuals are white noise, which validates the effectiveness of this model.
Table 8 presents the estimation results of the ARIMA (3,1,5) model.
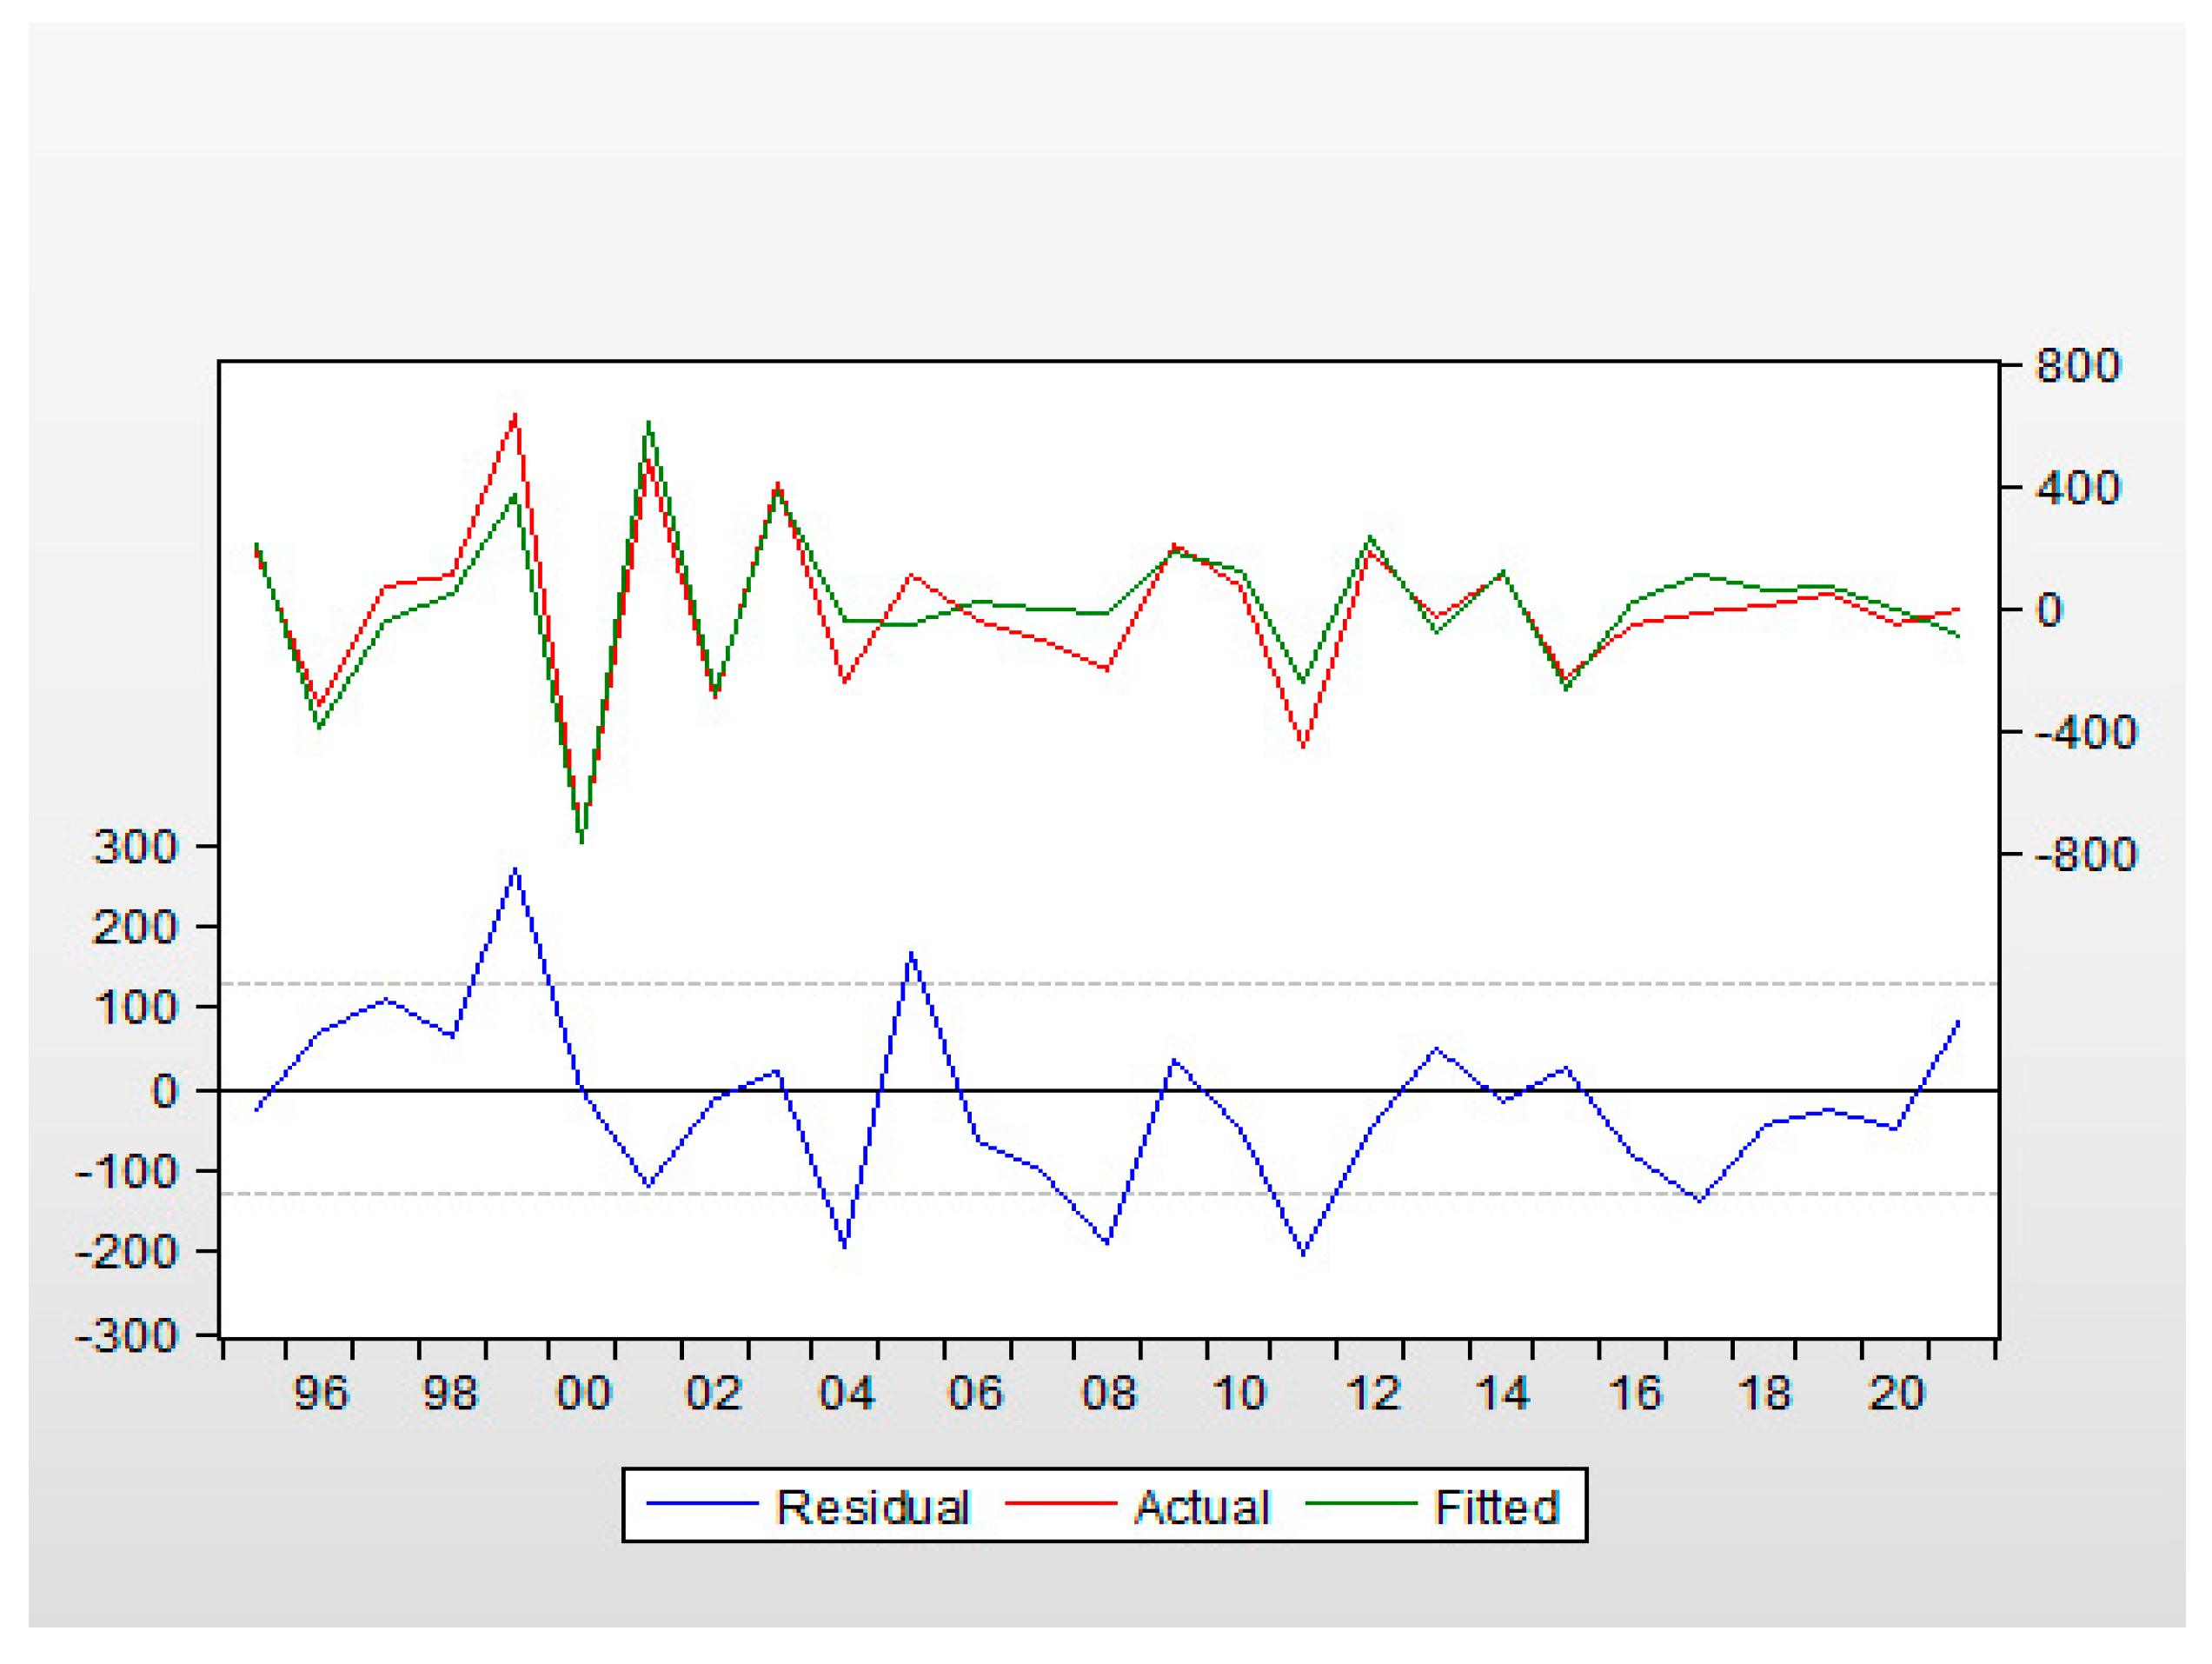
The ARIMA (3,1,5) model was selected as the final model for fitting the forest fire occurrence data. The results are presented in
Figure 11, where the actual data are depicted with a solid red line, and the fitted data are shown with a solid blue line. The upper and lower dashed lines correspond to the fitted values and residuals of the model, respectively.
4.3.3. Prediction Results
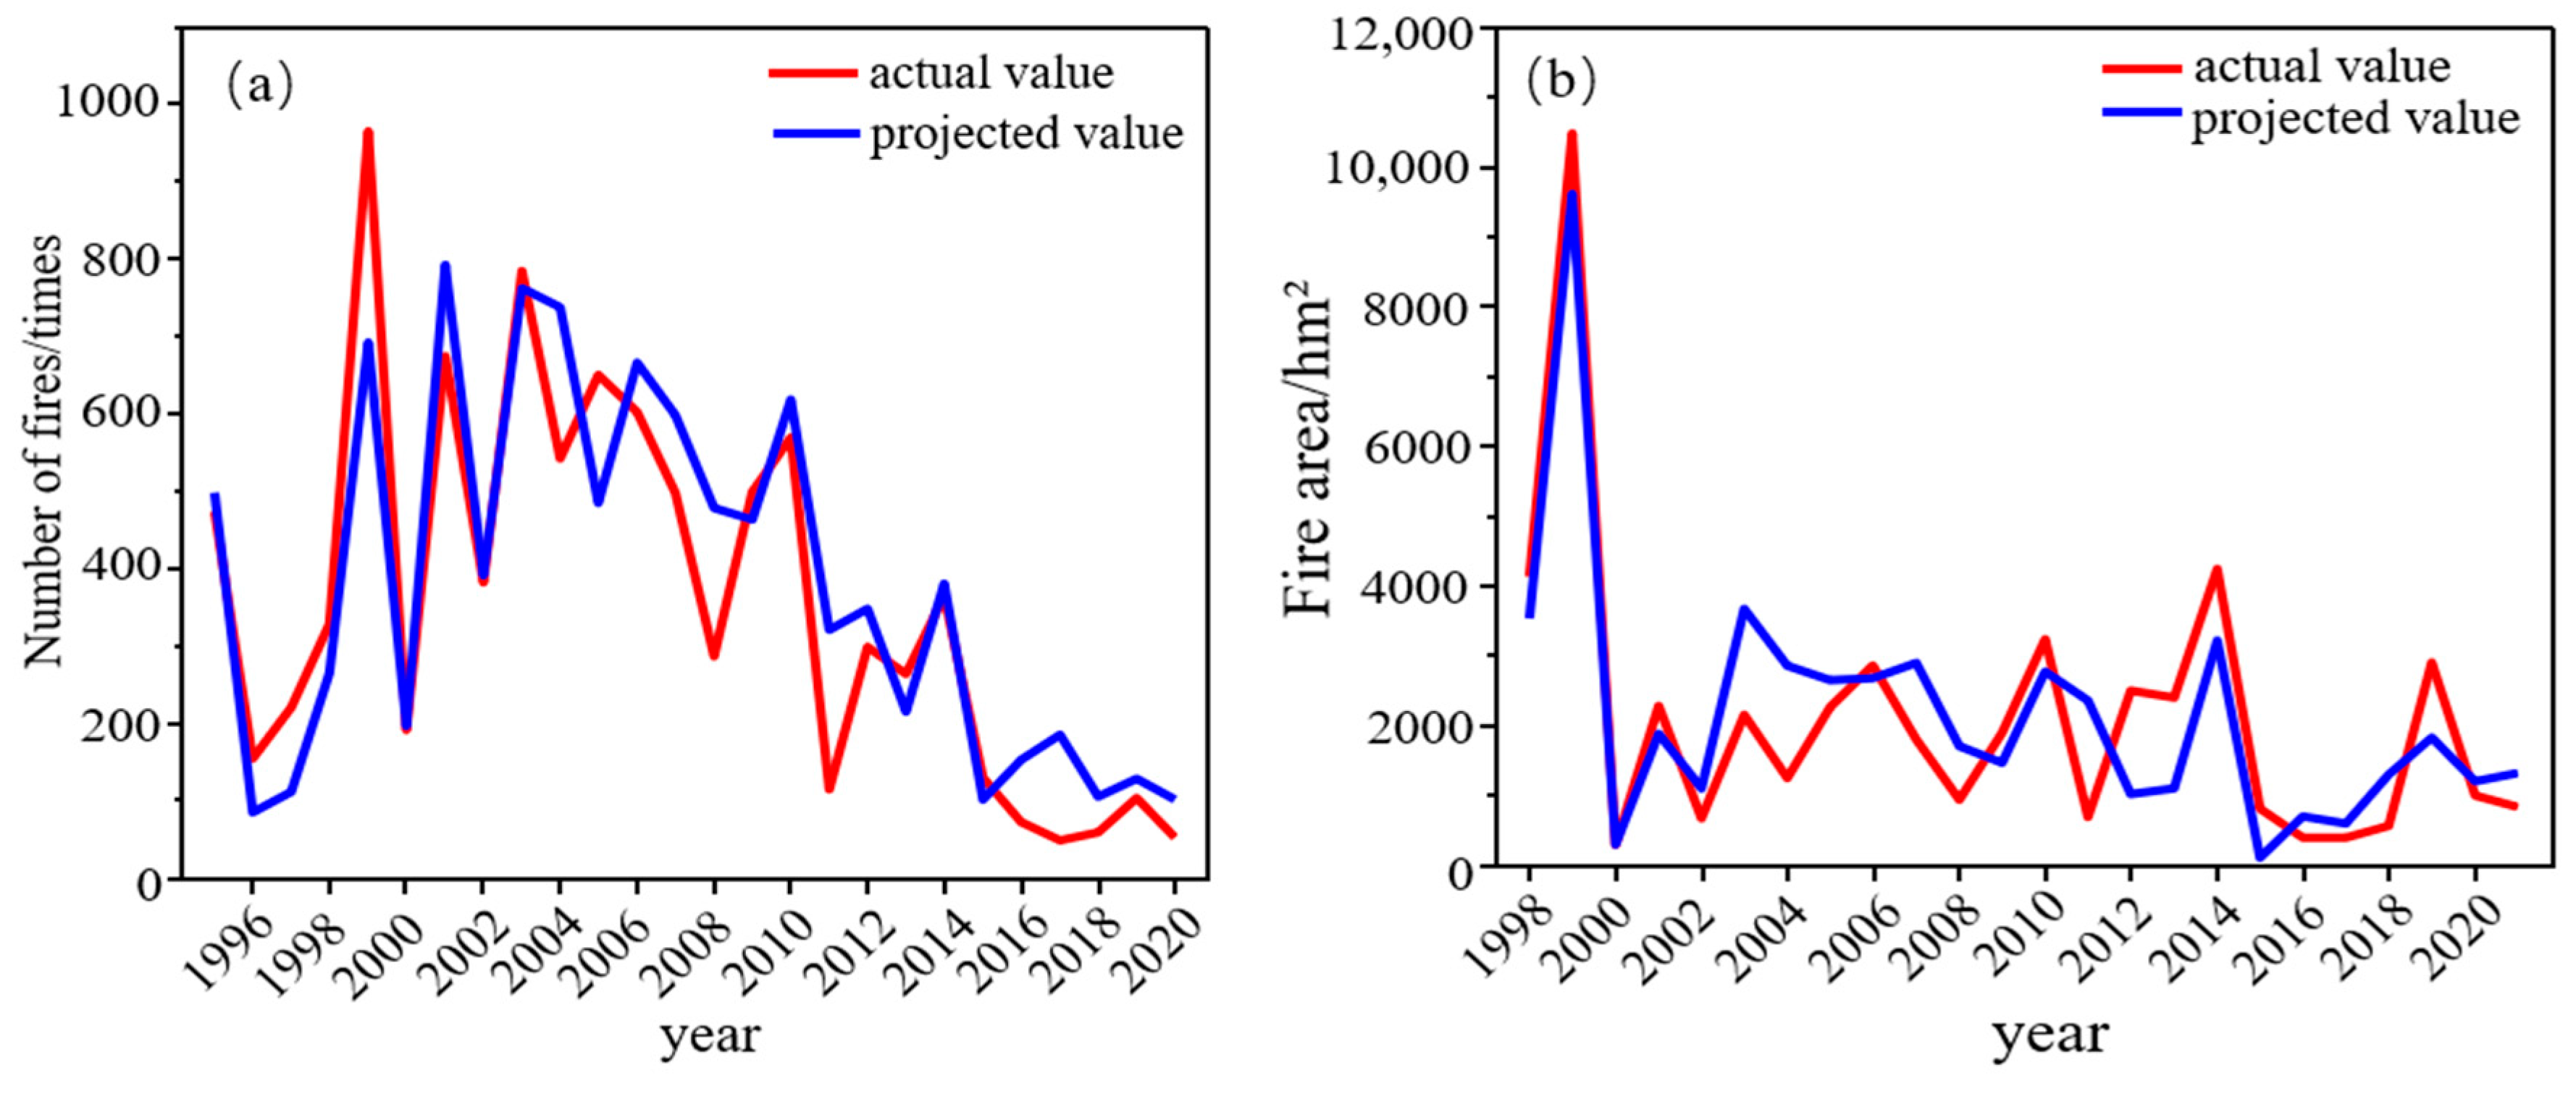
Using the static rolling forecast approach, predictions were made for the area affected by forest fires in Yunnan Province, as illustrated in
Figure 12a,b. Significant deviations between the predicted values and actual data were observed in 1999, 2008, 2011, and 2017, while the predictions from 1995 to 1998 and 2000 to 2007 showed a higher degree of conformity with the actual situation. Despite discrepancies in the predicted areas affected by fires in 2003, 2008, 2011, and 2019, the predictions for other years demonstrated high accuracy. The root mean square error (RMSE) for the number of fires was 109, and the affected area was 890 hectares, indicating an average deviation of 87 occurrences and 890 hectares between the predicted and actual values. Given that the areas affected by forest fires are influenced by multiple factors such as climate change, topography, human activities, land management strategies, and local government fire prevention measures, the ARIMA model used in this study has shown its potent potential and applicability in multivariate predictions.
To enhance the accuracy of the forecasts, the static forecasting method for rolling prediction was utilized via the software EViews 8.0 [
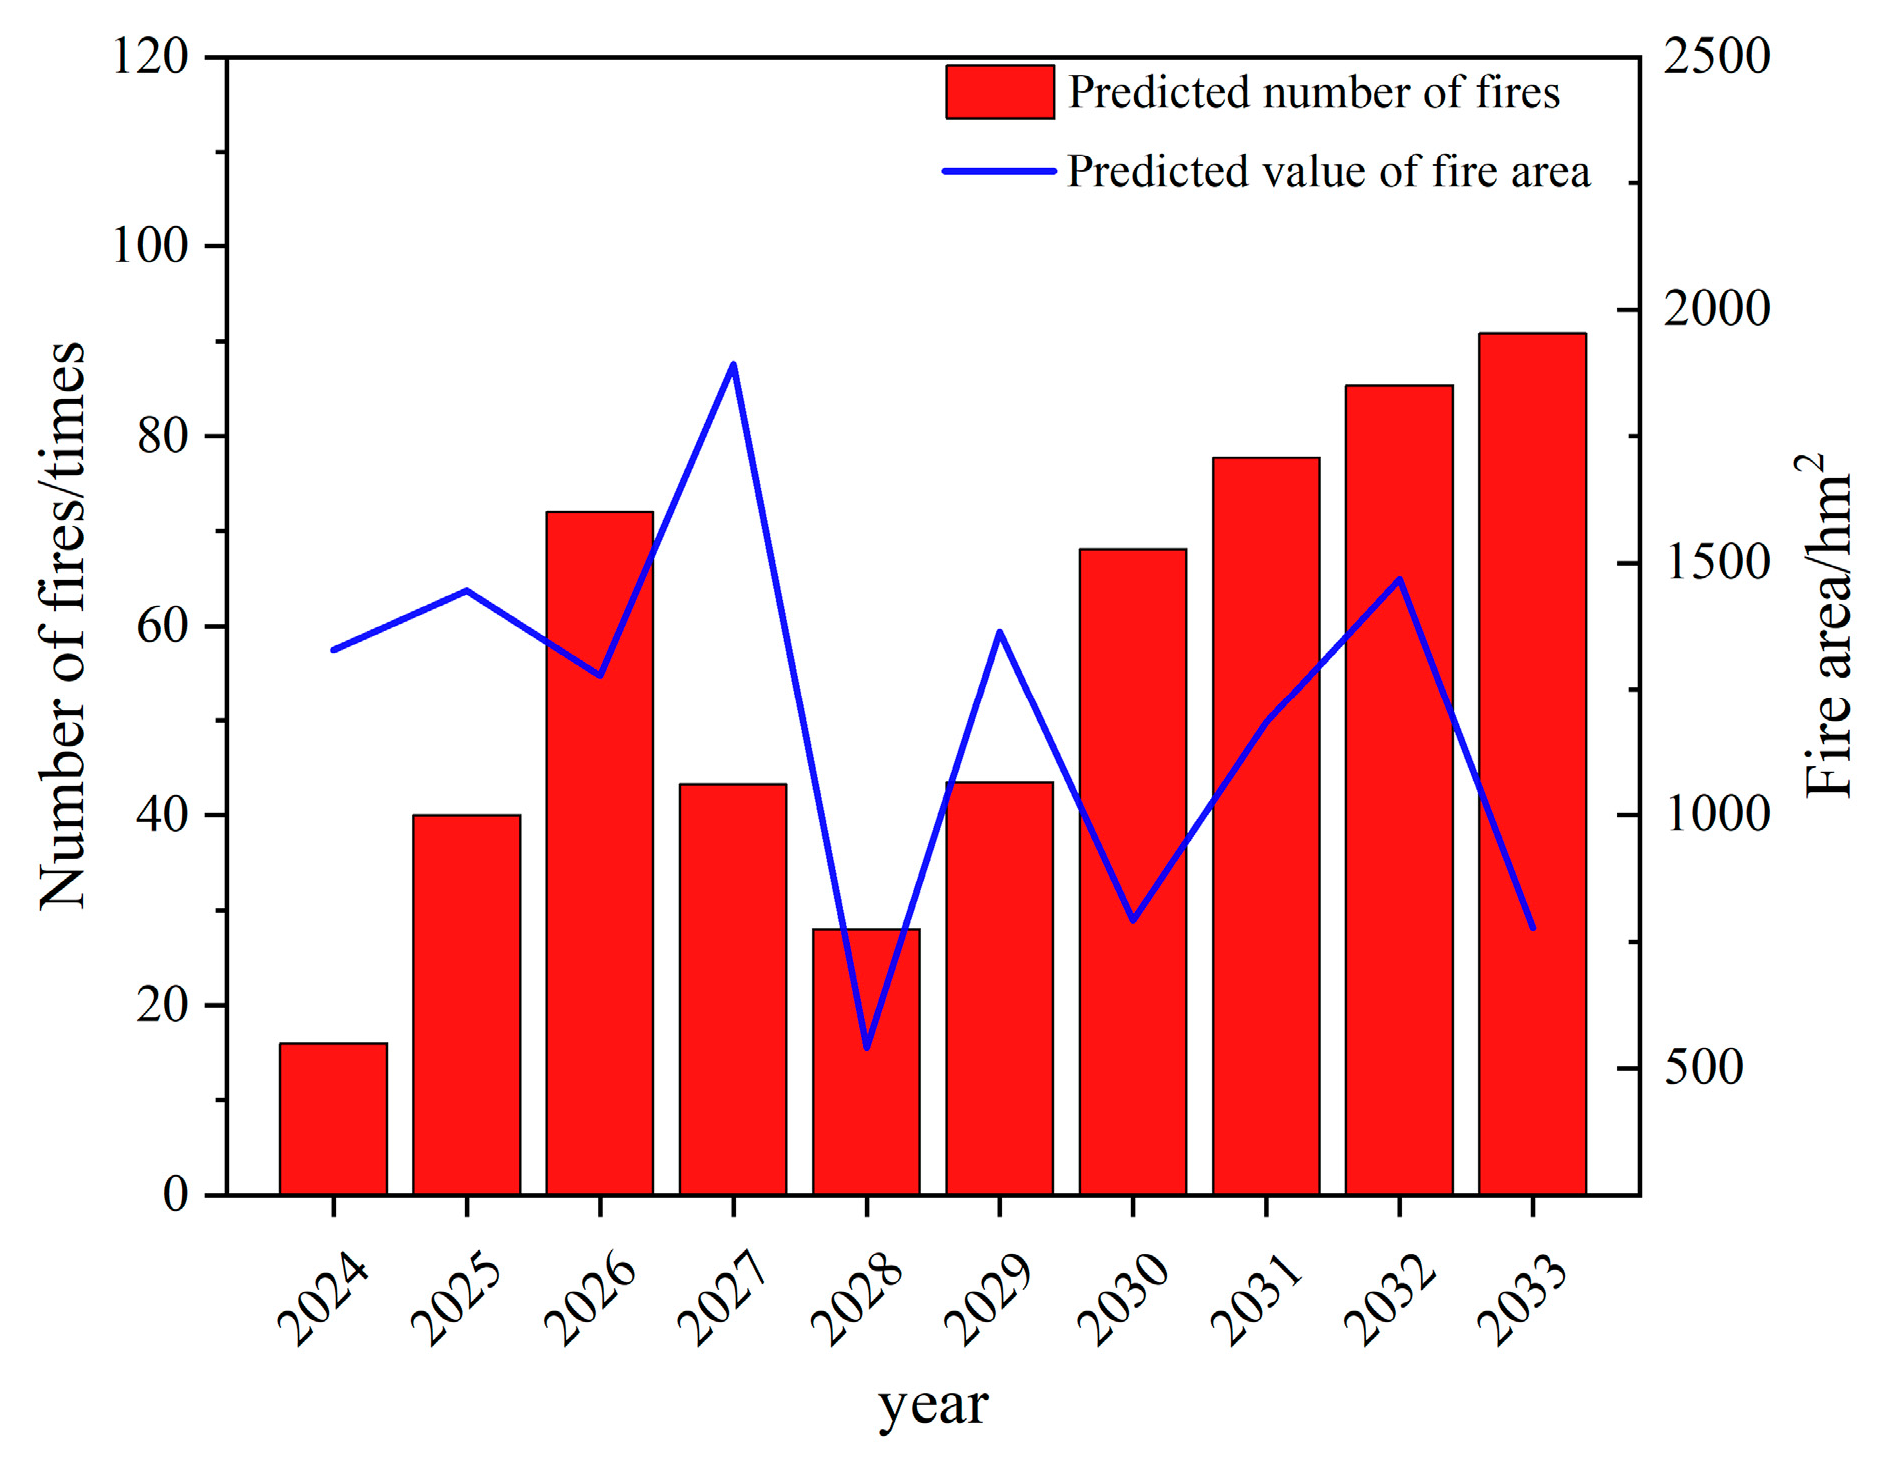
59], generating predictions for the number of forest fires and affected areas from 2022 to 2033. The results are depicted in
Figure 13. The figure reveals that the predicted number of forest fires during 2024–2033 fluctuates significantly, with the years 2026 and 2030–2033 showing relatively higher frequencies of fires. In contrast, the predicted area affected by fires demonstrates an overall trend of increasing and decreasing, particularly from 2028 to 2033, where the rate of increase in the affected area becomes more pronounced.
4.4. Recommendations
Given the close correlation between historical forest fire frequency and affected area with climatic factors like temperature, rainfall, wind speed, and humidity, especially under extreme drought conditions in 1998–2000 and 2019 leading to significant ecological losses, it is recommended to enhance resource allocation and fire prevention measures during years of deteriorating climate conditions. The stepwise regression model analysis highlights the importance of annual rainfall and wind speed on fire risk, emphasizing the need to strengthen meteorological monitoring and early warning systems. ARIMA model predictions indicate the necessity for enhanced monitoring and emergency preparedness in high-risk areas for potential major fires in 2026 and 2029–2033; for frequent smaller fires anticipated in 2024–2025, improving firefighting efficiency and preventive measures is crucial. Ongoing use of the ARIMA model for regular predictions and further research into the relationship between wind speed and fire spread is essential for more scientific fire management.
4.5. Research Contributions
The novel approach of combining ARIMA and stepwise regression models for forest fire prediction offers a fresh perspective in environmental modeling. This contributes significantly to forest fire prediction methodologies and provides a scientific basis for future fire prevention and response strategies. The outcomes are practically significant for government agencies, researchers, and students, guiding decision-makers in resource allocation and risk management. Moreover, the research methods and findings can serve as teaching cases in environmental science and forest management courses, enhancing scientific understanding of forest fire dynamics and the impact of climatic variables, offering crucial insights for comprehensive fire management strategies and adapting to climate change challenges.
4.6. Research Implications
This study, integrating ARIMA and stepwise regression models, introduces an innovative method for forest fire prediction, significantly enhancing response accuracy for governments and environmental management agencies. Its findings are crucial in devising forest fire prevention strategies under specific climatic conditions, providing scientific support for forest management and emergency preparedness in Yunnan Province and similar regions. Furthermore, this research contributes to understanding the global impact of climate change on forest fire trends, offering significant insights for the environmental science field and natural disaster management, while also serving as a reference for policy formulation and global forest fire management, aiding in the improvement of management strategies and emergency responses in fire-prone areas.
5. Conclusions
By analyzing forest fire and meteorological data from 1991 to 2021 in Yunnan Province and employing stepwise regression and ARIMA models, the influence of meteorological factors on fire occurrence was revealed, and predictions were made. The results indicate a stable trend of fires from 1991 to 1997, followed by frequent occurrences from 1998 to 2010. From 2014 to 2021, effective government strategies significantly reduced the number and scale of fires. Rainfall showed a negative correlation with fires, while wind speed exhibited a positive correlation.
The ARIMA model predicts an initial increase, then a decrease, and again an increase in fires from 2022 to 2033, with significant fluctuations in the number of fires, especially in 2027 and 2033. The predicted area affected by fires is expected to grow more notably from 2028 onwards. This study achieved its goal of enhancing understanding and prediction of forest fire trends, contributing significantly to forest fire prediction methodologies and providing a scientific basis for future fire prevention and response strategies, as well as informed decision-making for resource allocation and risk management. However, the study’s limitation lies in its reliance on historical data analysis, not accounting for potential impacts of future climate change on fire patterns.
Author Contributions
Investigation, Y.S. and C.F.; data curation, C.F. and S.Y.; writing—original draft preparation, Y.S. and C.F.; writing—review and editing, Y.S. and C.F.; All authors have read and agreed to the published version of the manuscript.
Funding
This research received no external funding.
Institutional Review Board Statement
Not applicable.
Informed Consent Statement
Not applicable.
Data Availability Statement
The data presented in this study are available on request from the corresponding author. The data are not publicly available due to reasons related to sensitivity and confidentiality.
Acknowledgments
This research was partially supported by the Training Plan for Young Backbone. Teachers in Colleges and Universities in Henan Province (2019GGJS098, and 2020GGJS098).
Conflicts of Interest
The authors declare no conflicts of interest.
References
- Mengist, W.; Soromessa, T. Assessment of forest ecosystem service research trends and methodological approaches at global level: A meta-analysis. Environ. Syst. Res 2019, 8, 22. [Google Scholar] [CrossRef]
- Piao, S.; Huang, M.; Zhuo, L.; Wang, X.; Ciais, P.; Canadell, J.G.; Kai, W.; Bastos, A.; Friedlingstein, P.; Houghton, R.A. Lower land-use emissions responsible for increased net land carbon sink during the slow warming period. Nat. Geosci. 2018, 11, 739–743. [Google Scholar] [CrossRef]
- Zhang, Y.; Qin, D.; Yuan, W.; Jia, B. Historical trends of forest fires and carbon emissions in China from 1988 to 2012. J. Geophys. Res. Biogeosci. 2016, 121, 2506–2517. [Google Scholar] [CrossRef]
- Mahalingam, S.; Deep, M.S.; Krishna, K.S. Wireless Sensor Based Forest Fire Early Detection with Online Remote Monitoring. Int. J. Eng. Adv. Technol. 2021, 10, 143–145. [Google Scholar] [CrossRef]
- Hantson, S.; Pueyo, S.; Chuvieco, E. Global fire size distribution: From power law to log-normal. Int. J. Wildland Fire 2016, 25, 403–412. [Google Scholar] [CrossRef]
- Clarke, H.; Nolan, R.H.; De Dios, V.R.; Bradstock, R.; Griebel, A.; Khanal, S.; Boer, M.M. Forest fire threatens global carbon sinks and population centres under rising atmospheric water demand. Nat. Commun. 2022, 13, 7161. [Google Scholar] [CrossRef] [PubMed]
- Sorge, S.; Mann, C.; Schleyer, C.; Loft, L.; Spacek, M.; Hernández-Morcillo, M.; Kluvankova, T. Understanding dynamics of forest ecosystem services governance: A socio-ecological-technical-analytical framework. Ecosyst. Serv. 2022, 55, 101427. [Google Scholar] [CrossRef]
- Hantson, S.; Pueyo, S.; Chuvieco, E. Global fire size distribution is driven by human impact and climate. Glob. Ecol. Biogeogr. 2015, 24, 77–86. [Google Scholar] [CrossRef]
- Zeng, X.; Yang, J.; Li, S. Spatial and temporal distribution patterns of forest fires in China from 2003–2018. For. Surv. Plan 2021, 46, 53–58+168. [Google Scholar] [CrossRef]
- Richardson, D.; Black, A.S.; Irving, D.; Matear, R.J.; Monselesan, D.P.; Risbey, J.S.; Squire, D.T.; Tozer, C.R. Global increase in wildfire potential from compound fire weather and drought. Npj Clim. Atmos. Sci. 2022, 5, 23. [Google Scholar] [CrossRef]
- Pais, C.; Gonzalez-Olabarria, J.R.; Moudio, P.G.; Garcia-Gonzalo, J.; González, M.C.; Shen, Z.J.M. Global scale coupling of pyromes and fire regimes. Commun. Earth. Environ. 2023, 4, 267. [Google Scholar] [CrossRef]
- Senande-Rivera, M.; Insua-Costa, D.; Miguez-Macho, G. Spatial and temporal expansion of global wildland fire activity in response to climate change. Nat. Commun. 2022, 13, 1208. [Google Scholar] [CrossRef] [PubMed]
- Butsic, V.; Kelly, M.; Moritz, M.A. Land use and wildfire: A review of local interactions and teleconnections. Land 2015, 4, 140–156. [Google Scholar] [CrossRef]
- Braun, A.C.; Faßnacht, F.; Valencia, D.; Sepulveda, M. Consequences of land-use change and the wildfire disaster of 2017 for the central Chilean biodiversity hotspot. Reg. Environ. Chang. 2021, 21, 37. [Google Scholar] [CrossRef]
- Tangney, R.; Paroissien, R.; Le Breton, T.D.; Thomsen, A.; Doyle, C.A.T.; Ondik, M.; Miller, R.G.; Miller, B.P.; Ooi, M.K.J. Success of post-fire plant recovery strategies varies with shifting fire seasonality. Commun. Earth Environ. 2022, 3, 126. [Google Scholar] [CrossRef]
- Harvey, B.J. Human-caused climate change is now a key driver of forest fire activity in the western United States. Proc. Natl. Acad. Sci. USA 2016, 113, 11649–11650. [Google Scholar] [CrossRef]
- De Jesus, C.S.L.; Delgado, R.C.; Wanderley, H.S.; Teodoro, P.E.; Pereira, M.G.; Lima, M.; Ávila Rodrigues, R.D.; Silva Junior, C.A.D. Fire risk associated with landscape changes, climatic events and remote sensing in the Atlantic Forest using ARIMA model. Remote Sens. Appl. Soc. Environ. 2022, 26, 100761. [Google Scholar] [CrossRef]
- Slavia, A.P.; Sutoyo, E.; Witarsyah, D. Hotspots forecasting using autoregressive integrated moving average (ARIMA) for detecting forest fires. In Proceedings of the 2019 IEEE International Conference on Internet of Things and Intelligence System (IoTaIS), Bali, Indonesia, 5–7 November 2019; pp. 92–97. [Google Scholar]
- Ma, S.; Liu, Q.; Zhang, Y. A prediction method of fire frequency: Based on the optimization of SARIMA model. PLoS ONE 2021, 16, e0255857. [Google Scholar] [CrossRef]
- Bağci, K. Prediction of Türkiye’s Burned Forest Areas Using ARIMA Model. Fırat Üniv. Sos. Bil. Derg. 2023, 33, 347–355. [Google Scholar] [CrossRef]
- Kolanek, A.; Szymanowski, M.; Raczyk, A. Human Activity Affects Forest Fires: The Impact of Anthropogenic Factors on the Density of Forest Fires in Poland. Forests 2021, 12, 728. [Google Scholar] [CrossRef]
- Abdi, O.; Kamkar, B.; Shirvani, Z.; Teixeira da Silva, J.A.; Buchroithner, M.F. Spatial-Statistical Analysis of Factors Determining Forest Fires: A Case Study from Golestan, Northeast Iran. Geomat. Nat. Hazards Risk 2018, 9, 267–280. [Google Scholar] [CrossRef]
- Haifeng, B.; Xiaodong, L.; Shukui, N.; Yadong, H. Construction of Forest Fire Prediction Model Based on Bayesian Model Averaging Method: Taking Dali Prefecture, Yunnan Province of Southwestern China as an Example. Beijing Linye Daxue Xuebao 2021, 43, 44–52. [Google Scholar] [CrossRef]
- Tariq, A.; Shu, H.; Siddiqui, S.; Mousa, B.G.; Munir, L.; Nasri, A.; Waqas, H.; Lu, L.; Baqa, M.F. Forest Fire Monitoring Using Spatial-Statistical and Geo-Spatial Analysis of Factors Determining Forest Fire in Margalla Hills, Islamabad, Pakistan. Geomat. Nat. Hazards Risk 2021, 12, 1212–1233. [Google Scholar] [CrossRef]
- Talpur, M.A.H.; Khahro, S.H.; Ali, T.H.; Waseem, H.B.; Napiah, M. Computing travel impendences using trip generation regression model: A phenomenon of travel decision-making process of rural households. Environ. Dev. Sustain. 2023, 25, 5973–5996. [Google Scholar] [CrossRef]
- Heidari, H.; Arabi, M.; Warziniack, T. Effects of Climate Change on Natural-Caused Fire Activity in Western US National Forests. Atmosphere 2021, 12, 981. [Google Scholar] [CrossRef]
- Zhu, L.; Fan, Q.; Wang, Y. MODWT-ARMA Model for Time Series Prediction. Appl. Math. Modell. 2014, 38, 1859–1865. [Google Scholar] [CrossRef]
- Wang, Z.Y. Prediction and Analysis of Fire Rescue Times Based on ARMA Model. Acad. J. Comput. Inf. Sci. 2021, 4, 12–15. [Google Scholar] [CrossRef]
- Yuanzhi, N.; Jie, Z.; Ming, L.; Yuming, B. Forecasting the Environment Changes with the ARMA Model for Application to an Oil Tank Fire Hazard. In Proceedings of the 2015 AASRI International Conference on Circuits and Systems (CAS 2015), Paris, France, 9–10 August 2015; pp. 1–5. [Google Scholar] [CrossRef]
- Kadir, E.A.; Dayana, N.E.; Rosa, S.L.; Othman, M.; Saian, R. Prediction of Hotspots in Riau Province, Indonesia Using the Autoregressive Integrated Moving Average (ARIMA) Model. SAR J. 2020, 3, 101–110. [Google Scholar] [CrossRef]
- Heng, W.; Liyan, Z.; Zhijun, L.; Lei, K.; Xiaoyang, G.; Feng, Z. A Study of Regularity and Prediction Model for Forest Fire in China. World For. Res. 2018, 31, 64–70. [Google Scholar]
- Kale, M.P.; Mishra, A.; Pardeshi, S.; Ghosh, S.; Pai, D.S.; Roy, P.S. Forecasting Wildfires in Major Forest Types of India. Front. For. Glob. Chang. 2022, 5, 882685. [Google Scholar] [CrossRef]
- Augmented Dickey–Fuller Test. Available online: https://en.wikipedia.org/wiki/Augmented_Dickey–Fuller_test (accessed on 1 November 2023).
- Wang, X. Research on the Prediction of Per Capita Coal Consumption Based on the ARIMA–BP Combined Model. Energy Rep. 2022, 8, 285–294. [Google Scholar] [CrossRef]
- Owusu-Ansah, D.; Tinoco, J.; Correia, A.A.S.; Oliveira, P.J.V. Prediction of Elastic Modulus for Fibre-Reinforced Soil-Cement Mixtures: A Machine Learning Approach. Appl. Sci. 2022, 12, 8540. [Google Scholar] [CrossRef]
- Vinod, H.D. Kernel Regression Coefficients for Practical Significance. J. Risk Financ. Manag. 2022, 15, 32. [Google Scholar] [CrossRef]
- Li, W.; Xu, Q.; Yi, J.; Liu, J. Predictive Model of Spatial Scale of Forest Fire Driving Factors: A Case Study of Yunnan Province, China. Sci. Rep. 2022, 12, 19029. [Google Scholar] [CrossRef] [PubMed]
- Pham, B.T.; Jaafari, A.; Avand, M.; Al-Ansari, M.; Du, T.D.; Yen, H.P.H.; Phong, T.V.; Nguyen, D.H.; Le, H.V.; Mafi-Gholami, D.; et al. Performance Evaluation of Machine Learning Methods for Forest Fire Modeling and Prediction. Symmetry 2020, 12, 1022. [Google Scholar] [CrossRef]
- Deng, X.; Zhang, Z.; Zhao, F.; Zhu, Z.; Wang, Q. Evaluation of the Regional Climate Model for the Forest Area of Yunnan in China. Front. For. Glob. Chang. 2023, 5, 1073554. [Google Scholar] [CrossRef]
- Wei, J.; Li, Z.; Wang, H.; Wang, Q.; Shu, L.; Yang, Y.; Gao, Z. Study on the Spatio-Temporal Aggregation of Forest Fires in Yunnan Province. Xiaofang Kexue Yu Jishu 2020, 39, 1425. [Google Scholar]
- Yunnan Province Forestry Department. Available online: http://lcj.yn.gov.cn (accessed on 1 November 2023).
- Cui, L.; Luo, C.; Yao, C.; Zou, Z.; Wu, G.; Li, Q.; Wang, X. The influence of climate change on forest fires in Yunnan province, Southwest China detected by GRACE satellites. Remote Sens. 2022, 14, 712. [Google Scholar] [CrossRef]
- Wang, H.; Jin, B.; Zhang, K.; Aktar, S.; Song, Z. Effectiveness in Mitigating Forest Fire Ignition Sources: A Statistical Study Based on Fire Occurrence Data in China. Fire 2022, 5, 215. [Google Scholar] [CrossRef]
- Zhang, J.; Chen, C.; Zhang, Y.; Wu, C. Study on the Impact of Forest Fire Prevention Policy on the Health of Forest Resources. Appl. Math. Nonlinear Sci. 2023, 8, 2147–2156. [Google Scholar] [CrossRef]
- Ding, T.; Gao, H. The Record-Breaking Extreme Drought in Yunnan Province, Southwest China During Spring-Early Summer of 2019 and Possible Causes. J. Meteorol. Res. 2020, 34, 997–1012. [Google Scholar] [CrossRef]
- Li, Y.; Wang, Z.; Zhang, Y.; Li, Y.; Huang, W. Drought Variability at Various Timescales Over Yunnan Province, China: 1961–2015. Theor. Appl. Climatol. 2019, 138, 743–757. [Google Scholar] [CrossRef]
- Su, G.; Zhan, W. Abnormal Depletion of Terrestrial Water Storage and Crustal Uplift Owing to the 2019 Drought in Yunnan, China. Geophys. J. Int. 2022, 231, 108–117. [Google Scholar] [CrossRef]
- Zhang, F.; Zhang, B.; Luo, J.; Liu, H.; Deng, Q.; Wang, L.; Zuo, Z. Forest Fire Driving Factors and Fire Risk Zoning Based on an Optimal Parameter Logistic Regression Model: A Case Study of the Liangshan Yi Autonomous Prefecture, China. Fire 2023, 6, 336. [Google Scholar] [CrossRef]
- Angra, D.; Sapountzaki, K. Climate Change Affecting Forest Fire and Flood Risk—Facts, Predictions, and Perceptions in Central and South Greece. Sustainability 2022, 14, 13395. [Google Scholar] [CrossRef]
- Naderpour, M.; Rizeei, H.M.; Ramezani, F. Forest Fire Risk Prediction: A Spatial Deep Neural Network-Based Framework. Remote Sens. 2021, 13, 2513. [Google Scholar] [CrossRef]
- Chen, J.; Yang, Y.; Peng, L.; Chen, L.; Ge, X. Knowledge Graph Representation Learning-Based Forest Fire Prediction. Remote Sens. 2022, 14, 4391. [Google Scholar] [CrossRef]
- Lin, X.; Li, Z.; Chen, W.; Sun, X.; Gao, D. Forest Fire Prediction Based on Long-and Short-Term Time-Series Network. Forests 2023, 14, 778. [Google Scholar] [CrossRef]
- Chen, F.; Niu, S.; Tong, X.; Zhao, J.; Sun, Y.; He, T. The Impact of Precipitation Regimes on Forest Fires in Yunnan Province, Southwest China. Sci. World J. 2014, 2014, 326782. [Google Scholar] [CrossRef]
- Sun, L.; Xu, C.; He, Y.; Zhao, Y.; Xu, Y.; Rui, X.; Xu, H. Adaptive forest fire spread simulation algorithm based on cellular automata. Forests. 2021, 12, 1431. [Google Scholar] [CrossRef]
- Shi, H.; Chen, J. Characteristics of Climate Change and Its Relationship with Land Use/Cover Change in Yunnan Province, China. Int. J. Climatol. 2018, 38, 2520–2537. [Google Scholar] [CrossRef]
- Liu, M.D.; Ding, L.; Bai, Y.L. Application of Hybrid Model Based on Empirical Mode Decomposition, Novel Recurrent Neural Networks and the ARIMA to Wind Speed Prediction. Energy Convers. Manag. 2021, 233, 113917. [Google Scholar] [CrossRef]
- Ma, L.; Hu, C.; Lin, R.; Han, Y. ARIMA Model Forecast Based on EViews Software. IOP Conf. Ser. Earth Environ. Sci. 2018, 208, 012017. [Google Scholar] [CrossRef]
- Sovilj, D.; Björk, K.M.; Lendasse, A. Comparison of Combining Methods Using Extreme Learning Machines Under Small Sample Scenario. Neurocomputing 2016, 174, 4–17. [Google Scholar] [CrossRef]
- Mustapa, F.H.; Ismail, M.T. Modelling and Forecasting S&P 500 Stock Prices Using Hybrid ARIMA-GARCH Model. J. Phys. Conf. Ser. 2019, 1366, 012130. [Google Scholar] [CrossRef]
Figure 1.
Map of fire influencing factors.
Figure 1.
Map of fire influencing factors.
Figure 2.
Research framework.
Figure 2.
Research framework.
Figure 3.
Location of Yunnan Province (YN) in China.
Figure 3.
Location of Yunnan Province (YN) in China.
Figure 4.
Relationship between the number of forest fires and the area affected.
Figure 4.
Relationship between the number of forest fires and the area affected.
Figure 5.
(a) Number of fires versus temperature; (b) affected area versus temperature; (c) number of fires versus precipitation; (d) affected area versus rainfall; (e) number of forest fires versus relative humidity; (f) affected area versus relative humidity; (g) number of forest fires versus wind speed; (h) affected area versus wind speed.
Figure 6.
Correlation between number of fires, fire area, and meteorological factors. Note: Red means positive correlation, blue means negative correlation, and “0” means no correlation.
Figure 6.
Correlation between number of fires, fire area, and meteorological factors. Note: Red means positive correlation, blue means negative correlation, and “0” means no correlation.
Figure 7.
(a) Fitted curve for number of fires; (b) fitted curve for fire area. Note: The red line represents the fitted curve and the blue dots represent the actual data.
Figure 7.
(a) Fitted curve for number of fires; (b) fitted curve for fire area. Note: The red line represents the fitted curve and the blue dots represent the actual data.
Figure 8.
(a) Residual frequency histogram for number of fires; (b) Normal Q–Q (Quantile–Quantile); plot; (c) Residual frequency histogram of fire area; (d) Normal Q–Q (Quantile–Quantile) plot. Note: The red line represents the theoretical distribution line of expectation and the blue dots are the actual observed results.
Figure 9.
Autocorrelation and partial autocorrelation plots.
Figure 9.
Autocorrelation and partial autocorrelation plots.
Figure 10.
Plot of residual series autocorrelation and partial autocorrelation functions.
Figure 10.
Plot of residual series autocorrelation and partial autocorrelation functions.
Figure 11.
Residual sequence correlation test.
Figure 11.
Residual sequence correlation test.
Figure 12.
(a) Actual and predicted number of fires; (b) actual and predicted fire area.
Figure 12.
(a) Actual and predicted number of fires; (b) actual and predicted fire area.
Figure 13.
Projected number of fires and area of fires, 2022–2033.
Figure 13.
Projected number of fires and area of fires, 2022–2033.
Table 1.
Model characteristics.
Table 1.
Model characteristics.
| Model | Autocorrelation Function | Partial Autocorrelation Function |
|---|
| AR (p) | tail dragging | P-step cut-off tail |
| MA (q) | q-step cut-off tail | trailing tail |
| ARMA (p,q) | tail trailing | trailing |
Table 2.
Stepwise regression fitting results.
Table 2.
Stepwise regression fitting results.
| Model Number | Implicit Variable | Introducing Variable | R2 | Significance |
|---|
| 1 | Number of fires | Average annual rainfall, average wind speed | 0.244 | 0.008 |
| 2 | Fire area | Average annual rainfall | 0.572 | 0.00 |
Table 3.
Parameter values of forest fire occurrence model in Yunnan Province.
Table 3.
Parameter values of forest fire occurrence model in Yunnan Province.
| Model Number | Independent
Variable | Ratio | Standard Error | Significance |
|---|
| 1 | Constant | 1601.75 | 383.98 | 0.000 |
| Average annual rainfall | −0.481 | 0.191 | 0.018 |
| Average wind speed | −190.484 | 86.744 | 0.037 |
| 2 | Constant | 9964.326 | 1288.626 | 0.000 |
| Average annual rainfall | −7.493 | 1.170 | 0.000 |
Table 4.
Paired t-test for true and predicted value samples.
Table 4.
Paired t-test for true and predicted value samples.
| Real-Predicted | T | Relevance | Significance |
|---|
| Number of fires real-predicted | −0.095 | 0.532 | 0.000 |
| Real value of area affected by fire-predicted value | −0.264 | 0.809 | 0.002 |
Table 5.
ADF unit root test.
Table 5.
ADF unit root test.
| p-Value | t-Statistic | Test Key Values at 10% Level of Significance | Test Key Values at 5% Level of Significance | Test of Key Values at 1% Level of Significance |
|---|
| 0.5336 | −1.471280 | −2.622989 | −2.967767 | −3.679322 |
Table 6.
ADF unit root test (first-order difference).
Table 6.
ADF unit root test (first-order difference).
| p-Value | t-Statistic | Test Key Values at 10% Level of Significance | Test Key Values at 5% Level of Significance | Test of Key Values at 1% Level of Significance |
|---|
| 0.000 | −5.889008 | −2.627420 | −2.976263 | −3.699871 |
Table 7.
ARIMA model test results.
Table 7.
ARIMA model test results.
| (p,d,q) | AIC | SC | HQC | Adjusted R-Squared | S.E. of Regression |
|---|
| (1,1,1) | 13.53940 | 13.63369 | 13.56893 | 0.453248 | 203.8786 |
| (1,1,2) | 13.31108 | 13.45252 | 13.35537 | 0.578236 | 179.0653 |
| (1,1,3) | 12.96592 | 13.15451 | 13.02499 | 0.710097 | 148.4578 |
| (1,1,4) | 13.33599 | 13.57173 | 13.40982 | 0.591917 | 176.1372 |
| (1,1,5) | 13.40452 | 13.68741 | 13.49312 | 0.574360 | 179.8863 |
| (2,1,1) | 13.62994 | 13.77268 | 13.67358 | 0.440748 | 209.6740 |
| (2,1,2) | 13.42280 | 13.61312 | 13.48099 | 0.559083 | 186.1740 |
| (2,1,3) | 13.31421 | 13.55210 | 13.38694 | 0.615712 | 173.8079 |
| (2,1,4) | 13.08547 | 13.37095 | 13.17275 | 0.702421 | 152.9473 |
| (2,1,5) | 13.34588 | 13.67894 | 13.44770 | 0.623401 | 172.0602 |
| (3,1,1) | 13.58022 | 13.77220 | 13.63731 | 0.505039 | 200.9782 |
| (3,1,2) | 13.29464 | 13.53461 | 13.36600 | 0.638857 | 171.6736 |
| (3,1,3) | 13.36663 | 13.65460 | 13.45226 | 0.622447 | 175.5305 |
| (3,1,4) | 13.17323 | 13.50919 | 13.27313 | 0.696608 | 157.3498 |
| (3,1,5) | 12.79705 | 13.18101 | 12.91122 | 0.796418 | 128.8941 |
| (4,1,1) | 13.67274 | 13.91469 | 13.74241 | 0.486292 | 206.8332 |
| (4,1,2) | 13.31952 | 13.60985 | 13.40312 | 0.649172 | 170.9264 |
| (4,1,3) | 13.67903 | 14.01774 | 13.77656 | 0.510113 | 201.9808 |
| (4,1,4) | 12.93370 | 13.32081 | 13.04517 | 0.772763 | 137.5630 |
| (4,1,5) | 12.98354 | 13.41903 | 13.10894 | 0.765825 | 139.6470 |
Table 8.
Parametric results of ARIMA (3,1,5) model.
Table 8.
Parametric results of ARIMA (3,1,5) model.
| Variable | Coefficient | Std. Error | t-Statistic | Prob |
|---|
| AR(1) | −1.235444 | 0.171205 | −7.216162 | 0.0000 |
| AR(2) | −0.498097 | 0.269856 | −1.845786 | 0.0806 |
| AR(3) | −0.036110 | 0.168062 | −0.214864 | 0.8322 |
| MA(1) | 0.519134 | 0.105983 | 4.898262 | 0.0001 |
| MA(2) | −0.434994 | 0.110360 | −3.941593 | 0.0009 |
| MA(3) | −0.445270 | 0.107620 | −4.137436 | 0.0006 |
| MA(4) | 0.457297 | 0.087562 | 5.222544 | 0.0000 |
| MA(5) | 0.947795 | 0.058639 | 16.16312 | 0.0000 |
| R-squared | 0.851229 | Mean dependent var | −9.000000 |
| Adjusted R-squared | 0.796418 | S.D. dependent var | 291.3324 |
| S.E. of regression | 128.8941 | Akaike info criterion | 12.38147 |
| Sum squared resid | 315660.2 | Schwarz criterion | 12.76858 |
| Log likelihood | −164.7602 | Hannan–Quinn criter | 12.49294 |
| Durbin–Watson stat | 1.392144 | Durbin–Watson stat | 1.392144 |
| Disclaimer/Publisher’s Note: The statements, opinions and data contained in all publications are solely those of the individual author(s) and contributor(s) and not of MDPI and/or the editor(s). MDPI and/or the editor(s) disclaim responsibility for any injury to people or property resulting from any ideas, methods, instructions or products referred to in the content. |
© 2023 by the authors. Licensee MDPI, Basel, Switzerland. This article is an open access article distributed under the terms and conditions of the Creative Commons Attribution (CC BY) license (https://creativecommons.org/licenses/by/4.0/).


