


Interpretable Single-dimension Outlier Detection (ISOD): An Unsupervised Outlier Detection Method Based on Quantiles and Skewness Coefficients

Abstract
:1. Introduction
2. Related Works
2.1. Supervised Methods
2.2. Semi-Supervised Methods
2.3. Unsupervised Methods
2.4. Self-Supervised Methods
3. Proposed Algorithm
3.1. Preliminaries
3.1.1. Quantiles
3.1.2. Skewness Coefficient
3.2. Definition of Outlier Detection
3.3. The Proposed ISOD Algorithm
3.3.1. Construct the Empirical Cumulative Distribution Function
3.3.2. Compute the Quantiles
3.3.3. Compute the Skewness Coefficient
3.3.4. Obtain the Outlier Scores
3.3.5. Pseudocode of ISOD
| Algorithm 1: ISOD |
| Input: features Output: |
| 1. for each dimension : |
| 2. calculate the quantile of each data in this dimension |
| 3. calculate the skewness coefficient for each dimension: |
| 4.end for |
| 5.for each data : |
| 6. calculate the anomaly score for each dimension when when |
| 7. calculate outlier score for : |
| 8.end for |
| 9.Return while . |
3.4. Properties of ISOD
3.4.1. Time Complexity Analysis
3.4.2. Interpretability
3.4.3. Sensitivity Analysis
3.4.4. Hyperparameter-Free and Unsupervised
4. Experimental Results and Discussion
4.1. Performance Evaluation Metrics
4.1.1. ROC (Receiver Operating Characteristic)
4.1.2. AP (Average Precision)
4.2. Experimental Settings
4.2.1. Experimental Environment and Baselines
4.2.2. Dataset
4.3. Experimental Results
4.3.1. Analysis of Experimental Results
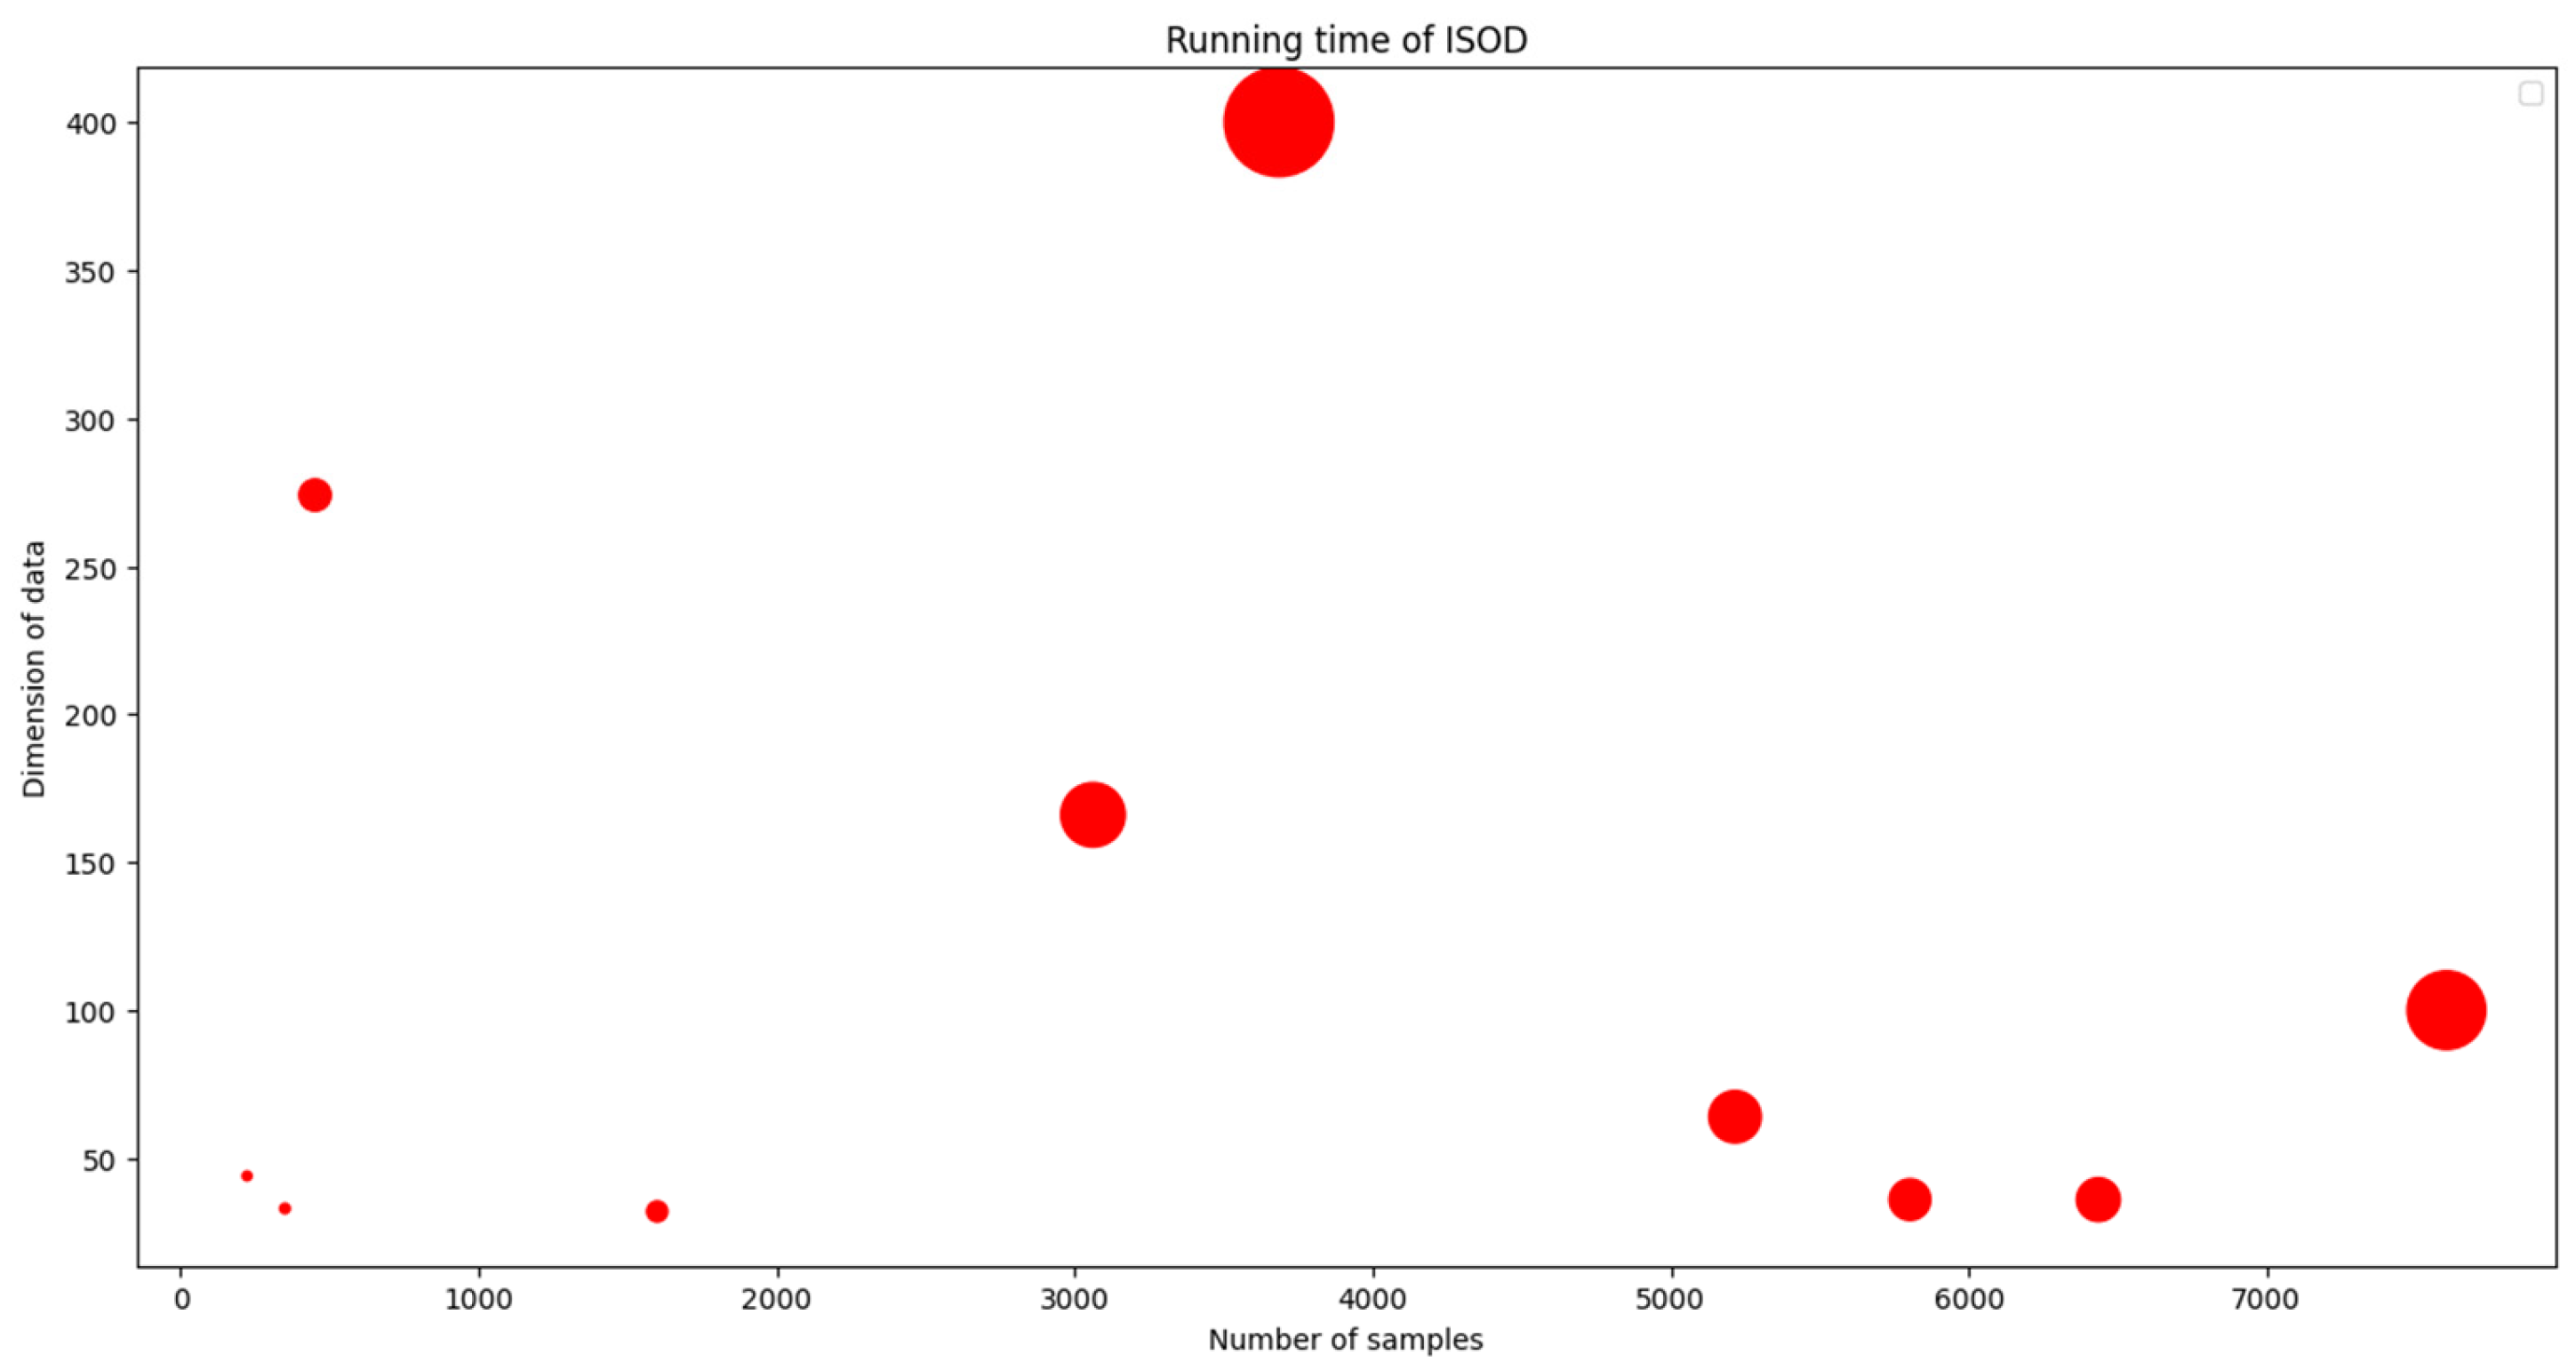
4.3.2. Additional Experimental Results and Analysis of Running Time
5. Conclusions
Author Contributions
Funding
Institutional Review Board Statement
Informed Consent Statement
Data Availability Statement
Conflicts of Interest
References
- Aggarwal, C.C.; Aggarwal, C.C. An Introduction to Outlier Analysis; Springer: Berlin/Heidelberg, Germany, 2017. [Google Scholar]
- Chandola, V.; Banerjee, A.; Kumar, V. Anomaly detection: A survey. ACM Comput. Surv. (CSUR) 2009, 41, 1–58. [Google Scholar] [CrossRef]
- Ntroumpogiannis, A.; Giannoulis, M.; Myrtakis, N.; Christophides, V.; Simon, E.; Tsamardinos, I. A meta-level analysis of online anomaly detectors. Vldb J. 2023, 32, 845–886. [Google Scholar] [CrossRef]
- Wang, Z.; Shao, L.; Cheng, K.; Liu, Y.; Jiang, J.; Nie, Y.; Li, X.; Kuang, X. ICDF: Intrusion collaborative detection framework based on confidence. Int. J. Intell. Syst. 2022, 37, 7180–7199. [Google Scholar] [CrossRef]
- Heigl, M.; Weigelt, E.; Urmann, A.; Fiala, D.; Schramm, M. Exploiting the Outcome of Outlier Detection for Novel Attack Pattern Recognition on Streaming Data. Electronics 2021, 10, 2160. [Google Scholar] [CrossRef]
- Zhang, H.; Zhao, S.; Liu, R.; Wang, W.; Hong, Y.; Hu, R. Automatic Traffic Anomaly Detection on the Road Network with Spatial-Temporal Graph Neural Network Representation Learning. Wirel. Commun. Mob. Comput. 2022, 2022, 4222827. [Google Scholar] [CrossRef]
- Fournier, N.; Farid, Y.Z.; Patire, A. Erroneous High Occupancy Vehicle Lane Data: Detecting Misconfigured Traffic Sensors With Machine Learning. Transp. Res. Rec. 2022, 2677, 1593–1610. [Google Scholar] [CrossRef]
- Dixit, P.; Bhattacharya, P.; Tanwar, S.; Gupta, R. Anomaly detection in autonomous electric vehicles using AI techniques: A comprehensive survey. Expert Syst. 2022, 39, e12754. [Google Scholar] [CrossRef]
- Watts, J.; van Wyk, F.; Rezaei, S.; Wang, Y.; Masoud, N.; Khojandi, A. A Dynamic Deep Reinforcement Learning-Bayesian Framework for Anomaly Detection. IEEE Trans. Intell. Transp. Syst. 2022, 23, 22884–22894. [Google Scholar] [CrossRef]
- Mansour, R.F.; Escorcia-Gutierrez, J.; Gamarra, M.; Villanueva, J.A.; Leal, N. Intelligent video anomaly detection and classification using faster RCNN with deep reinforcement learning model. Image Vis. Comput. 2021, 112, 104229. [Google Scholar] [CrossRef]
- Zhao, Y.; Deng, B.; Shen, C.; Liu, Y.; Lu, H.; Hua, X.-S. Spatio-Temporal AutoEncoder for Video Anomaly Detection. In Proceedings of the 25th ACM International Conference on Multimedia (MM), Comp Hist Museum, Mountain View, CA, USA, 23–27 October 2017; pp. 1933–1941. [Google Scholar]
- Dang, T.T.; Ngan, H.E.T.; Liu, W. Distance-Based k-Nearest Neighbors Outlier Detection Method in Large-Scale Traffic Data. In Proceedings of the IEEE International Conference on Digital Signal Processing (DSP), Singapore, 21–24 July 2015; pp. 507–510. [Google Scholar]
- Wang, H.; Wang, W.; Liu, Y.; Alidaee, B. Integrating Machine Learning Algorithms With Quantum Annealing Solvers for Online Fraud Detection. IEEE Access 2022, 10, 75908–75917. [Google Scholar] [CrossRef]
- Bhattacharjee, P.; Garg, A.; Mitra, P. KAGO: An approximate adaptive grid-based outlier detection approach using kernel density estimate. Pattern Anal. Appl. 2021, 24, 1825–1846. [Google Scholar] [CrossRef]
- Zhang, Y.-L.; Zhou, J.; Zheng, W.; Feng, J.; Li, L.; Liu, Z.; Li, M.; Zhang, Z.; Chen, C.; Li, X.; et al. Distributed Deep Forest and its Application to Automatic Detection of Cash-Out Fraud. ACM Trans. Intell. Syst. Technol. 2019, 10, 1–19. [Google Scholar] [CrossRef]
- Chaudhry, H.N.; Javed, Y.; Kulsoom, F.; Mehmood, Z.; Khan, Z.I.; Shoaib, U.; Janjua, S.H. Sentiment Analysis of before and after Elections: Twitter Data of U.S. Election 2020. Electronics 2021, 10, 2082. [Google Scholar] [CrossRef]
- Chalapathy, R.; Toth, E.; Chawla, S. Group Anomaly Detection Using Deep Generative Models. In Proceedings of the European Conference on Machine Learning and Principles and Practice of Knowledge Discovery in Databases (ECML PKDD), Dublin, Ireland, 10–14 September 2020; pp. 173–189. [Google Scholar]
- Chenaghlou, M.; Moshtaghi, M.; Leckie, C.; Salehi, M. Online Clustering for Evolving Data Streams with Online Anomaly Detection. In Proceedings of the 22nd Pacific-Asia Conference on Knowledge Discovery and Data Mining (PAKDD), Melbourne, Australia, 3–6 June 2018; pp. 506–519. [Google Scholar]
- Sharma, V.; Kumar, R.; Cheng, W.-H.; Atiquzzaman, M.; Srinivasan, K.; Zomaya, A.Y. NHAD: Neuro-Fuzzy Based Horizontal Anomaly Detection in Online Social Networks. IEEE Trans. Knowl. Data Eng. 2018, 30, 2171–2184. [Google Scholar] [CrossRef]
- Souiden, I.; Omri, M.N.; Brahmi, Z. A survey of outlier detection in high dimensional data streams. Comput. Sci. Rev. 2022, 44, 100463. [Google Scholar] [CrossRef]
- Pei, Y.; Zaïane, O. A Synthetic Data Generator for Clustering and Outlier Analysis. 2006. Available online: https://era.library.ualberta.ca/items/63beb6a7-cc50-4ffd-990b-64723b1e4bf9 (accessed on 20 October 2023).
- Sikder, M.N.K.; Batarseh, F.A. Outlier detection using AI: A survey. In AI Assurance; Elsevier: Amsterdam, The Netherlands, 2023; pp. 231–291. [Google Scholar]
- Chatterjee, A.; Ahmed, B.S. IoT anomaly detection methods and applications: A survey. Internet Things 2022, 19, 100568. [Google Scholar] [CrossRef]
- Pang, G.; Shen, C.; Cao, L.; Hengel, A.V.D. Deep Learning for Anomaly Detection. ACM Comput. Surv. 2021, 54, 1–38. [Google Scholar] [CrossRef]
- Boukerche, A.; Zheng, L.; Alfandi, O. Outlier Detection: Methods, Models, and Classification. ACM Comput. Surv. 2020, 53, 1–37. [Google Scholar] [CrossRef]
- Samudra, S.; Barbosh, M.; Sadhu, A. Machine Learning-Assisted Improved Anomaly Detection for Structural Health Monitoring. Sensors 2023, 23, 3365. [Google Scholar] [CrossRef]
- Qiu, J.; Shi, H.; Hu, Y.; Yu, Z. Enhancing Anomaly Detection Models for Industrial Applications through SVM-Based False Positive Classification. Appl. Sci. 2023, 13, 12655. [Google Scholar] [CrossRef]
- Kerboua, A.; Kelaiaia, R. Fault Diagnosis in an Asynchronous Motor Using Three-Dimensional Convolutional Neural Network. Arab. J. Sci. Eng. 2023, 1–19. [Google Scholar] [CrossRef]
- Jiang, J.; Zhu, J.; Bilal, M.; Cui, Y.; Kumar, N.; Dou, R.; Su, F.; Xu, X. Masked swin transformer unet for industrial anomaly detection. IEEE Trans. Ind. Inform. 2022, 19, 2200–2209. [Google Scholar] [CrossRef]
- Drost, B.; Ulrich, M.; Bergmann, P.; Hartinger, P.; Steger, C. Introducing mvtec itodd-a dataset for 3d object recognition in industry. In Proceedings of the IEEE International Conference on Computer Vision Workshops, Venice, Italy, 22–29 October 2017; pp. 2200–2208. [Google Scholar]
- Park, C.H. A Comparative Study for Outlier Detection Methods in High Dimensional Text Data. J. Artif. Intell. Soft Comput. Res. 2023, 13, 5–17. [Google Scholar] [CrossRef]
- Sunny, J.S.; Patro, C.P.K.; Karnani, K.; Pingle, S.C.; Lin, F.; Anekoji, M.; Jones, L.D.; Kesari, S.; Ashili, S. Anomaly Detection Framework for Wearables Data: A Perspective Review on Data Concepts, Data Analysis Algorithms and Prospects. Sensors 2022, 22, 756. [Google Scholar] [CrossRef] [PubMed]
- Liu, F.T.; Ting, K.M.; Zhou, Z.-H. Isolation Forest. In Proceedings of the 8th IEEE International Conference on Data Mining, Pisa, Italy, 15–19 December 2008; pp. 413–422. [Google Scholar]
- Staffini, A.; Svensson, T.; Chung, U.-I.; Svensson, A.K. A Disentangled VAE-BiLSTM Model for Heart Rate Anomaly Detection. Bioengineering 2023, 10, 683. [Google Scholar] [CrossRef] [PubMed]
- Sun, Z.; Peng, Q.; Mou, X.; Bashir, M.F. Generic and scalable periodicity adaptation framework for time-series anomaly detection. Multimed. Tools Appl. 2023, 82, 2731–2748. [Google Scholar] [CrossRef]
- Huang, Y.; Liu, W.; Li, S.; Guo, Y.; Chen, W. A Novel Unsupervised Outlier Detection Algorithm Based on Mutual Information and Reduced Spectral Clustering. Electronics 2023, 12, 4864. [Google Scholar] [CrossRef]
- Mozaffari, M.; Doshi, K.; Yilmaz, Y. Self-Supervised Learning for Online Anomaly Detection in High-Dimensional Data Streams. Electronics 2023, 12, 1971. [Google Scholar] [CrossRef]
- Liu, Y.; Zhou, S.; Wan, Z.; Qiu, Z.; Zhao, L.; Pang, K.; Li, C.; Yin, Z. A Self-Supervised Anomaly Detector of Fruits Based on Hyperspectral Imaging. Foods 2023, 12, 2669. [Google Scholar] [CrossRef]
- Zhang, X.; Mu, J.; Zhang, X.; Liu, H.; Zong, L.; Li, Y. Deep anomaly detection with self-supervised learning and adversarial training. Pattern Recognit. 2022, 121, 108234. [Google Scholar] [CrossRef]
- Hojjati, H.; Ho, T.K.K.; Armanfard, N. Self-Supervised Anomaly Detection: A Survey and Outlook. arXiv 2022, arXiv:2205.05173. [Google Scholar]
- Liu, K.; Fu, Y.; Wang, P.; Wu, L.; Bo, R.; Li, X. Automating feature subspace exploration via multi-agent reinforcement learning. In Proceedings of the 25th ACM SIGKDD International Conference on Knowledge Discovery & Data Mining, Anchorage, AK, USA, 4–8 August 2019; pp. 207–215. [Google Scholar]
- Ramaswamy, S.; Rastogi, R.; Shim, K. Efficient algorithms for mining outliers from large data sets. In Proceedings of the 2000 ACM SIGMOD International Conference on Management of Data, Dallas, TX, USA, 16–18 May 2000; pp. 427–438. [Google Scholar]
- Breunig, M.M.; Kriegel, H.P.; Ng, R.T.; Sander, J. LOF: Identifying density-based local outliers. Sigmod Rec. 2000, 29, 93–104. [Google Scholar] [CrossRef]
- He, Z.; Xu, X.; Deng, S. Discovering cluster-based local outliers. Pattern Recognit. Lett. 2003, 24, 1641–1650. [Google Scholar] [CrossRef]
- Zhao, Y.; Nasrullah, Z.; Hryniewicki, M.K.; Li, Z. LSCP: Locally selective combination in parallel outlier ensembles. In Proceedings of the 2019 SIAM International Conference on Data Mining, Calgary, AB, Canada, 2–4 May 2019; pp. 585–593. [Google Scholar]
- Scholkopf, B.; Williamson, R.; Smola, A.; Shawe-Taylor, J.; Platt, J. Support vector method for novelty detection. Adv. Neural Inf. Process. Syst. 2000, 12, 582–588. [Google Scholar]
- Xu, H.; Pang, G.; Wang, Y.; Wang, Y. Deep isolation forest for anomaly detection. IEEE Trans. Knowl. Data Eng. 2023, 35, 12591–12604. [Google Scholar] [CrossRef]
- Akcay, S.; Atapour-Abarghouei, A.; Breckon, T.P. GANomaly: Semi-supervised Anomaly Detection via Adversarial Training. In Proceedings of the 14th Asian Conference on Computer Vision (ACCV), Perth, Australia, 2–6 December 2018; pp. 622–637. [Google Scholar]

| Dataset | Number of Samples | Number of Dimensions | Outliers (%) |
|---|---|---|---|
| Musk | 3062 | 166 | 97 (3.2%) |
| Satimage-2 | 5803 | 36 | 71 (1.2%) |
| Letter Recognition | 1600 | 32 | 100 (6.25%) |
| Speech | 3686 | 400 | 61 (1.65%) |
| Satellite | 6435 | 36 | 2036 (32%) |
| Arrhythmia | 452 | 274 | 66 (15%) |
| Ionosphere | 351 | 33 | 126 (36%) |
| Mnist | 7603 | 100 | 700 (9.2%) |
| Optdigits | 5216 | 64 | 150 (3%) |
| Heart | 224 | 44 | 10 (4.4%) |
| Dataset | KNN | LOF | IForst | CBLOF | LSCP | OCSVM | DIF | GANomaly | ISOD |
|---|---|---|---|---|---|---|---|---|---|
| Musk | 0.73 | 0.86 | 0.709 | 0.755 | 0.472 | 0.111 | 0.874 | 0.248 | 0.956 |
| Satimage-2 | 0.144 | 0.19 | 0.557 | 0.28 | 0.77 | 0.274 | 0.535 | 0.929 | 0.775 |
| Letter Recognition | 0.364 | 0.121 | 0.105 | 0.202 | 0.2 | 0.323 | 0.486 | 0.152 | 0.797 |
| Speech | 0.755 | 0.406 | 0.278 | 0.918 | 0.981 | 0.58 | 0.736 | 0.692 | 0.833 |
| Satellite | 0.625 | 0.393 | 0.475 | 0.664 | 0.837 | 0.593 | 0.22 | 0.58 | 0.9 |
| Arrhythmia | 0.769 | 0.433 | 0.168 | 0.798 | 0.297 | 0.171 | 0.91 | 0.324 | 0.538 |
| Ionosphere | 0.238 | 0.846 | 0.272 | 0.343 | 0.605 | 0.867 | 0.127 | 0.165 | 0.912 |
| Mnist | 0.476 | 0.454 | 0.115 | 0.369 | 0.418 | 0.904 | 0.787 | 0.603 | 0.808 |
| Optdigits | 0.794 | 0.478 | 0.798 | 0.518 | 0.264 | 0.896 | 0.924 | 0.67 | 0.747 |
| Heart | 0.705 | 0.331 | 0.488 | 0.115 | 0.311 | 0.56 | 0.355 | 0.429 | 0.863 |
| Average ROC | 0.56 | 0.451 | 0.397 | 0.496 | 0.516 | 0.528 | 0.545 | 0.479 | 0.813 |
| Dataset | KNN | LOF | IForst | CBLOF | LSCP | OCSVM | DIF | GANomaly | ISOD |
|---|---|---|---|---|---|---|---|---|---|
| Musk | 0.589 | 0.756 | 0.115 | 0.397 | 0.432 | 0.143 | 0.272 | 0.66 | 0.814 |
| Satimage-2 | 0.188 | 0.321 | 0.786 | 0.146 | 0.154 | 0.315 | 0.494 | 0.807 | 0.856 |
| Letter Recognition | 0.257 | 0.474 | 0.948 | 0.52 | 0.964 | 0.885 | 0.802 | 0.345 | 0.754 |
| Speech | 0.536 | 0.214 | 0.195 | 0.138 | 0.32 | 0.164 | 0.349 | 0.822 | 0.996 |
| Satellite | 0.281 | 0.794 | 0.321 | 0.204 | 0.633 | 0.737 | 0.962 | 0.888 | 0.887 |
| Arrhythmia | 0.207 | 0.103 | 0.612 | 0.534 | 0.407 | 0.338 | 0.422 | 0.551 | 0.663 |
| Ionosphere | 0.929 | 0.985 | 0.979 | 0.138 | 0.827 | 0.88 | 0.715 | 0.741 | 0.566 |
| Mnist | 0.744 | 0.271 | 0.679 | 0.592 | 0.604 | 0.274 | 0.433 | 0.605 | 0.392 |
| Optdigits | 0.264 | 0.656 | 0.359 | 0.221 | 0.394 | 0.261 | 0.553 | 0.112 | 0.776 |
| Heart | 0.439 | 0.511 | 0.32 | 0.734 | 0.208 | 0.387 | 0.796 | 0.794 | 0.8 |
| Average ROC | 0.443 | 0.509 | 0.531 | 0.362 | 0.494 | 0.438 | 0.58 | 0.632 | 0.75 |
Disclaimer/Publisher’s Note: The statements, opinions and data contained in all publications are solely those of the individual author(s) and contributor(s) and not of MDPI and/or the editor(s). MDPI and/or the editor(s) disclaim responsibility for any injury to people or property resulting from any ideas, methods, instructions or products referred to in the content. |
© 2023 by the authors. Licensee MDPI, Basel, Switzerland. This article is an open access article distributed under the terms and conditions of the Creative Commons Attribution (CC BY) license (https://creativecommons.org/licenses/by/4.0/).
Share and Cite
Huang, Y.; Liu, W.; Li, S.; Guo, Y.; Chen, W. Interpretable Single-dimension Outlier Detection (ISOD): An Unsupervised Outlier Detection Method Based on Quantiles and Skewness Coefficients. Appl. Sci. 2024, 14, 136. https://doi.org/10.3390/app14010136
Huang Y, Liu W, Li S, Guo Y, Chen W. Interpretable Single-dimension Outlier Detection (ISOD): An Unsupervised Outlier Detection Method Based on Quantiles and Skewness Coefficients. Applied Sciences. 2024; 14(1):136. https://doi.org/10.3390/app14010136
Chicago/Turabian StyleHuang, Yuehua, Wenfen Liu, Song Li, Ying Guo, and Wen Chen. 2024. "Interpretable Single-dimension Outlier Detection (ISOD): An Unsupervised Outlier Detection Method Based on Quantiles and Skewness Coefficients" Applied Sciences 14, no. 1: 136. https://doi.org/10.3390/app14010136
APA StyleHuang, Y., Liu, W., Li, S., Guo, Y., & Chen, W. (2024). Interpretable Single-dimension Outlier Detection (ISOD): An Unsupervised Outlier Detection Method Based on Quantiles and Skewness Coefficients. Applied Sciences, 14(1), 136. https://doi.org/10.3390/app14010136