Abstract
The evaluation of surface quality after milling still represents a challenge due to the stratified structure of wood. In this paper, the surface quality of beech wood obtained by profile milling was analyzed differentiating between tool marks, fuzzy grain, and accidental surface gaps overlapped onto the deep anatomical cavities. The samples were milled at two rotation speeds, 3308 rpm (n1) and 6594 rpm (n2), and two feed speeds of 6.53 m/min (vf1) and 23.74 m/min (vf2). After the samples were cut, approximately 600 m of beech wood were further processed before measuring the surface quality again. The surface waviness measured by Wa increased more than double when the feed speed increased from vf1 to vf2. Rk increased with the feed speed (with the feed per tooth, fz, for a constant n, respectively) for n2 by a significant 57%. An increase in the rotation speed from n1 to n2 has reduced Rk, but the effect was not significant. The processing quality, Rk, measured at different depths did not differ statistically, in spite of the local differences in the cutting speed. The moment of measuring the surface roughness, such as immediately after sharpening or after a working period, influenced the surface quality. After the tool processed 600 m of beech material, the surface quality improved by 30%. The statistical analysis showed that the most important factor affecting the surface quality was the feed speed (implicitly fz, for constant n and number of cutters).
1. Introduction
The assessment of the surface quality following wood processing is very important in order to establish the impact of various processing parameters combinations [1,2,3]. The optimization of milling operations by considering the surface quality will reduce the amount of further sanding and can contribute to a reduction in the finishing costs. Therefore, it is important to find a combination of processing parameters suitable for a minimum surface roughness. Furthermore, the surface roughness of wood is very complex and represents a superposition of morphological features, such as waviness, raised fibers, tool marks, wood anatomical voids, as well as possible processing surface defects, such as material detached from the surface [4,5,6,7,8,9]. In this respect, the most used roughness parameters such as Ra or Rz are not enough to give a complete picture of the origin of the different irregularities present on a processed surface.
According to the studies performed by Gawroński [10], Sutcu [11], and Koc et al. [12], the cutting parameters affect the surface roughness of beech wood. The study performed by Gürgen et al. [13] on Pinus sylvestris after CNC milling showed that the surface roughness decreased with increasing rotation speed and decreased with decreasing the feed speed for all machining parameters. The evaluation of surface roughness for different depths of cut revealed that the maximum surface roughness value was registered for the highest depth of cut. Jiang et al. [14] have found that the cutting speed has not significantly influenced the surface roughness of walnut processed by straight-tooth milling, but the depth of cut was significant. Costes and Larricq [15] stated that the quality of beech, when routed on a CNC machine, improves with an increase in the cutting speed. Piernik et al. [16] concluded that an increase in the feed speed and the chip thickness increases the surface roughness of beech milled by CNC, while the cutting speed had no effect on surface roughness, but just on the cutting power.
Most researchers have used Ra and Rz [11,12,13,17,18,19] to assess the quality of wood after milling, but these parameters do not consider the nature of wood irregularities and include the inherent wood anatomical gaps in the evaluation. The roughness parameters Ra and Rz decreased with a lower feed rate and a higher spindle speed in a study by Kok et al. [12] on beech (Fagus orientalis), Ayous (Triplochiton Scleroxylon), and MDF processed by CNC. Similarly, in another study of Rabiei and Yaghoubi [18], the surface roughness evaluated by Ra decreased with increasing the spindle speed and decreasing the feed rate as well as the depth of cut when beech wood was milled on a CNC machine. However, these two parameters employed by the researchers are not sufficient to correctly interpret the quality of wood and wood-based surfaces, which means that they must be evaluated together with other roughness parameters [7].
Kilic et al. [20] evaluated the effect of milling on the surface roughness of beech and aspen wood. On the basis of statistical analysis, they found no significant difference between the surface roughness determined on the tangential and radial surfaces. They observed that a number of roughness parameters, such as Ra, Rz, Rk, Rpk, and Rvk roughness are useful, to be used together, to evaluate the surface quality of wood.
Magoss [21] studied the influence of the wear of the cutting edges on the surface roughness for several species (oak, larch, beech, and pine wood) processed on CNC milling machines. The experimental results showed that the Rk parameter, which measures the core roughness and is the closest approximation of the tool marks, may be an important indicator of the tool edge wear. In the case of beech wood, the Rk value after milling with a blunt tool was approximately twice the value of milling with a sharp tool.
Gurău et al. [22] investigated the surface roughness of larch wood (Larix decidua Mill.) cut through by laser and CNC routing at different feed speeds, by parameters Ra, Rp, Rv, Rsk, Wa, Pa, Pt and the Abbot-curve parameters, Rk, Rpk, and Rvk, in order to find a more comprehensive understanding of the effect of processing on wood surface topography.
Learning from the above studies, it can be concluded that a complex surface such as that of wood requires a larger set of roughness parameters capable of differentiating between the various layers of irregularities present on a processed surface.
Therefore, this study uses a comprehensive set of standard parameters for surface characterization, such as Ra, Rv, Rsk, and Wa [23], and the Abbot curve parameters, Rk, Rpk, Rvk, A1, and A2 [24]. These parameters allow the analysis of surface quality on stratified levels of irregularities differentiating between tool marks, fuzzy grain, and accidental surface gaps overlapping onto the deep anatomical cavities of the wood, such as pores from earlywood. Such analysis will provide a more in-depth understanding and quantification of the tool interaction with the wood material and will help for a reliable selection of the most appropriate processing parameters. Furthermore, in a calculation of those parameters, a robust Gaussian regression filter tested and found suitable for wood was used in order to avoid the bias caused by the simple Gaussian filter contained in the majority of measuring instruments [9,25].
2. Materials and Methods
2.1. Wood Samples
Beech wood (Fagus sylvatica L.), with a mean density of 745 kg/m3 and 7% moisture content, was processed by profiled milling in two processing passes in order to obtain profiles with 16 mm maximum depth (Figure 1).
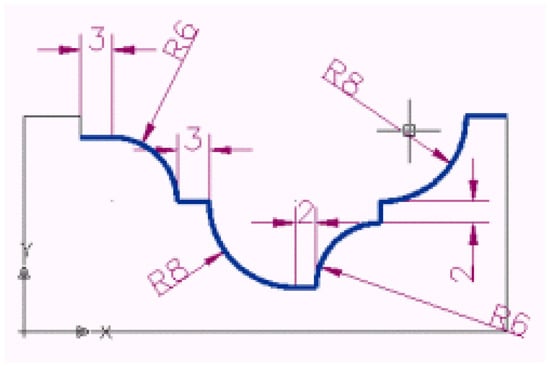
Figure 1.
The samples’ profile.
The milling was carried out on 1000 mm × 50 mm × 20 mm strips, along the grain direction, by using various cutting parameter combinations, which will be further detailed.
2.2. Processing by Profiled Milling
A vertical milling machine was used to process the beech strips with a profile cutterhead made of C45 steel [26], with 4 new and sharp cutters, made of C120 steel [27] (Figure 2). The dimensions and geometry of the cutting tool and the cutters are presented in Table 1 and Table 2, respectively.
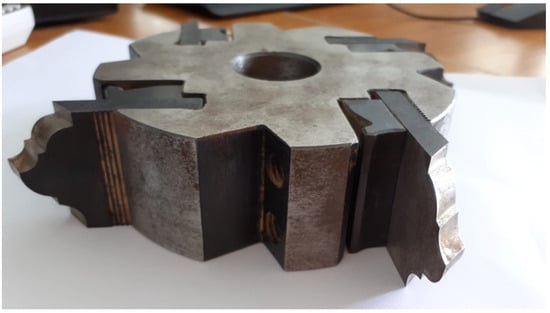
Figure 2.
The profile cutterhead used in the milling process.

Table 1.
Geometric parameters of the cutterhead.
Table 2.
The dimensions of the cutters.
The profiled milling was performed with two rotation speeds, such as 3308 rpm (n1) and 6594 rpm (n2), and two feed speeds, 6.53 m/min (vf1) and 23.74 m/min (vf2), respectively. The cutting parameters combinations were n1−vf1, n1−vf2, n2−vf1, and n2−vf2. This provided a first set of samples. A second set of samples was prepared by using the same cutting parameter combinations, but after the tool milled 600 m of beech wood. The intention was to observe the impact of the cutting distance, as it further shows the influence of the cutting tool wear [28] on the surface quality, when the same working variables are used.
The strips of each cutting case combination were further shortened to 60 mm × 50 mm × 20 mm specimens available for inspection. The samples were labeled to identify their cutting parameters combination. Three samples were selected from the first set of data (sharpened tool) and two samples from the second set of data (after tool has cut 600 m), for each rotation speed and feed speed combination (n1−vf1, n1−vf2, n2−vf1, and n2−vf2), for both tool conditions: sharpened and after 600 m cutting distance. This meant 20 processed samples were available for the surface quality measurement.
Table 3 summarizes the machining parameters used during the milling experiments with indication of the local cutting speed and feed per tooth values in 4 regions/profile depths, marked in Figure 3, and in which the surface quality was further checked.
Table 3.
The machining parameters.
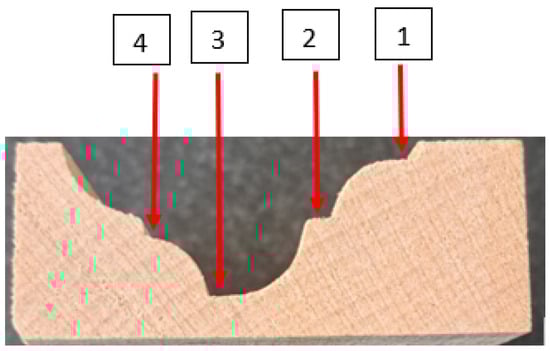
Figure 3.
Sample cross-section with four zones of linear measurement.
From Table 3, note that the fz is directly influenced by the feed speed vf for a constant n and for the same number of cutters (a single type of tool was used in this research). Another notable observation is that the cutting speed, vc, differs very slightly with the local tool diameter (depth of cut, respectively), for a given rotation speed, n. Therefore, the interpretation of the results will be mainly focused on variations in vf, respectively, n.
2.3. Roughness Measurement
The surface morphology of the beech samples was measured with MarSurf XT20 equipment manufactured by MAHR Gottingen GMBH, Göttingen, Germany (Figure 4a). It used an MFW 250 scanning head with a tracing arm in the range of ±750 µm, and a stylus with 2 µm tip radius and 90° tip angle, as shown in Figure 4b.
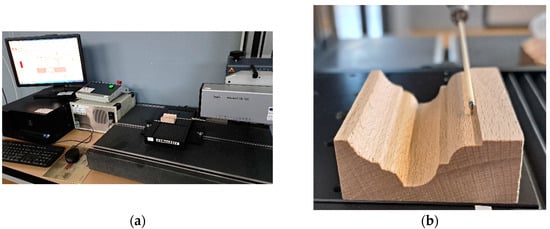
Figure 4.
Measurements of surface morphology. (a) MarSurf XT20 profilometer and data acquisition; (b) linear surface scanning by stylus (zone 1 in Figure 3).
For measuring the beech milled profiles, only the straight zones were considered, as marked by red arrows in Figure 3. The depth for the marked points were 2 mm for point 1, 8 mm for point 2, 16 mm for point 3, and 10 mm for point 4. This decision was drawn from the requirement that the stylus remains normal in relation to the processed surface. Further studies will take into consideration the possibility of measuring round profiles as well, by using adequate supports. Four profiles, 30 mm long, were measured from the numbered zones (Figure 3) along the milling direction with a speed of 0.5 mm/s, a scanning force of 0.7 mN, and a resolution of 5 µm. This meant 4 profiles were taken from each sample. In case of the first set of samples, there were 12 profiles for one parameters combination. For all 4 parameter combinations (ex. n1−vf1; n1−vf2; etc.), the total number of measurements reached 48. Similarly, for the second set of samples, there were 32 measurements.
Data acquired were further processed with MARWIN XR20 software provided together with the measuring equipment. Data evaluation began with removing any unwanted form errors, followed by a procedure of filtering with a robust Gaussian regression filter, contained in ISO/TS 16610-31 [25]. This filter was tested and it was recommended for wood surfaces because it reduces the distortions associated with deep grouped valleys in the profiles and it is more reliable in comparison with a simple Gaussian filter, common in most measuring instruments [9,29,30,31,32]. In this way, the measured data were separated by filtering the wavelengths of irregularities in waviness profiles and roughness profiles, corresponding to W parameters for the longest wavelengths, while R parameters evaluated the shortest wavelengths. The cut-off length used for filtering was 2.5 mm, recommended for wood surfaces [30,32]. After filtering, a number of useful parameters were calculated, such as Ra (arithmetic mean deviation of the roughness profile), Rv (the largest absolute profile valley depth), Rsk (skewness of the profile), and Wa (arithmetic mean deviation of the waviness profile) according to ISO 4287 [23]. In addition, Rk (the core roughness depth), Rpk (the reduced peak height), Rvk (the reduced valley depth), A1 (peak area in µm2/mm), and A2 (valley area in µm2/mm) were employed according to ISO 13565-2 [24].
The parameters from ISO 13565-2 [24] are particularly useful to characterize the stratified structure of a processed surface. Compared with other parameters, Rk depends the least on the wood anatomical structure and measures the height of the core roughness, the region defined by the highest concentration of data points in a measured profile, which excludes isolated peaks and valleys. For a milling process, it can be an approximation of the tool marks left on wood. Instead, Rpk is defined by the isolated peaks, which for a wood species, according to Westkämper and Riegel [4], can be considered an evaluation of wood raised grain and fuzziness of the surface. The fuzziness is caused by groups of fibers that are attached to the surface at only one end. Rvk is defined by isolated valleys, which in the case of wood can be caused by accidental material pull-out during processing and/or deep anatomical cell lumens.
Another test was conducted to monitor the surface quality after the tool has milled 600 m of the same profile and species, in order to see which is the effect of the tool condition.
Surface profiles were measured in the same way as in the case when the tool was sharpened, but on two specimens. This meant there were 8 measured profiles for analysis of each of the 4 parameters combination, making a total of 32 measurements. The surface morphology measurement and evaluation followed the same steps as for the sharpened tool.
2.4. Stereo-Microscopy Analysis
A stereo-microscope NIKON SMZ 18-LOT2 (Nikon Instruments, Melville, NY, USA) was used for the microscopic investigations of the profile milled beech samples. The straight zone 1 from Figure 2 was in focus. In order to better observe the occurrence of the raised fibers and possible surface defects such as material detachment, the samples were tilted by approximately 45°.
2.5. Statistical Analysis
The surface quality parameters were tested for their significance for all processing combinations (rotation speed–feed speed). The software used was an IBM SPSS Statistics version 23.
3. Results and Discussion
The mean values and standard deviation for parameters evaluated in this analysis are contained in Table 4.
Table 4.
The mean values roughness parameters (in µm). Standard deviation is presented in parentheses.
The surface morphology was first studied by considering the largest wavelengths irregularities produced by milling on the surface, namely the surface waviness. This can be observed directly by comparing primary profiles, which contain both roughness and waviness (Figure 5), selected for the four groups/combinations of rotation speeds and feed speeds.
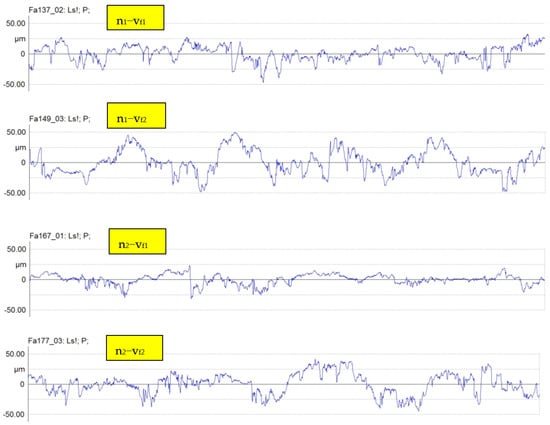
Figure 5.
Primary profiles containing waviness and roughness together, for the four combinations of rotation speeds and feed speeds, when the tool was sharpened.
It can be seen from Figure 5 that an increase in the feed speed from vf1 to vf2 (3.6 times) has increased surface waviness, in the primary profiles, for both rotation speeds. The profiles are considerably wavier, containing large undulations, which can be spotted as patterns repeated at almost regular distance (approximately 6 mm), in Figure 5 and by a waviness profile overlapped on the ridged beech surface, in Figure 6. This observation is in agreement with the values of Wa parameter, which doubled in the case of both rotation speeds (Figure 7).
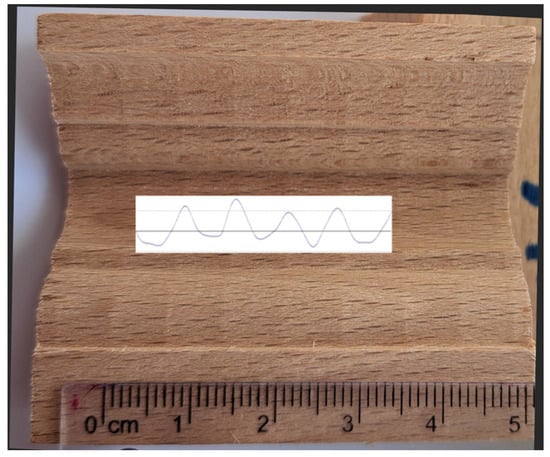
Figure 6.
Beech surface processed by n1−vf2 parameters combination with a waviness profile overlapped.
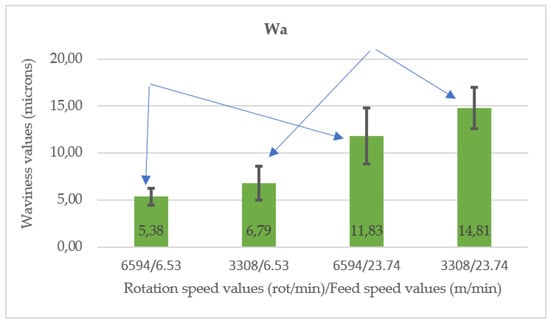
Figure 7.
The variation of waviness parameter, Wa, with combinations of the rotation speed with the feed speed. With blue arrows, pair means that differ statistically are marked.
This result was statistically significant for p < 0.05 (test ANOVA, followed by Dunnett T3 multiple comparisons) (Table 5 and Table 6). An explanation may be that an increase in the feed speed increases tool vibration, which leaves deeper waves in the surface. When the rotation speed almost doubled from n1 to n2, a decrease of 20% in surface waviness was measured, but this reduction had no statistical support (Table 6).
Table 5.
Dependent variable Wa—Test between groups’ effects.
Table 6.
Dependent variable Wa− Dunnet T3 Post Hoc Test for multiple comparisons between groups rotation speed–feed speed.
Figure 8 displays the roughness profiles measured for each pair rotation speed–feed speed. Isolated raised fibers are marked with red ellipses, while the yellow ellipses indicate isolated deep valleys. From definition, the core roughness of the roughness profiles does not contain the isolated deep valleys associated with the deep pores from earlywood or isolated detached wood material, nor the isolated raised fibers or surface fuzziness. Instead, it can be viewed as the density of data above and below the zero line. Therefore, it appears that an increase in the feed speed (respectively, in fz, for a constant n and z) is causing more dispersion above and below the zero line (Figure 6), which translated in an increase in Rk. These visual observations are confirmed by the measured Rk values, which increased, when the feed speed (respectively, fz) increased 3.6 times, by 24% for n1 and by a significant 57% for n2 (from 10.19 µm to 16.02 µm) (Figure 9). The conclusion is that an increase in the feed speed (respectively, in fz, for a constant n and z) increases the core roughness Rk and is more pronounced when the rotation speed increases as well (Figure 9).
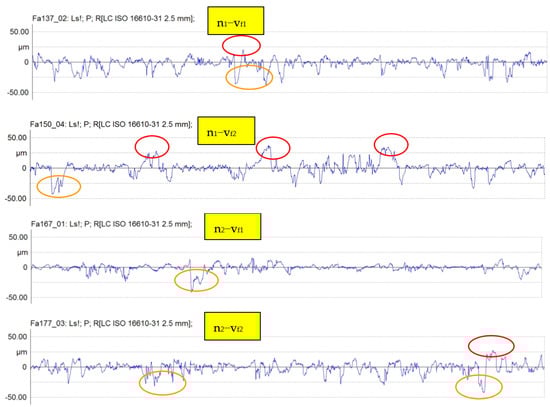
Figure 8.
Roughness profiles of each group combination, rotation speed–feed speed. Raised fibers are marked with red; deep isolated valleys are marked with yellow ellipses.
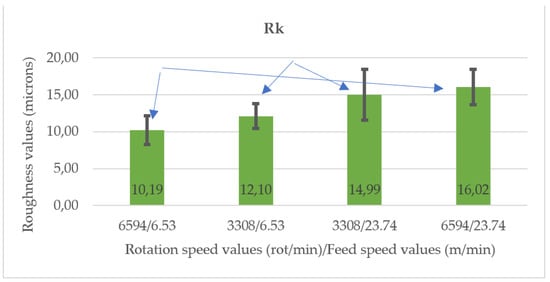
Figure 9.
The variation of the core roughness parameter, Rk, with combinations of the rotation speed with the feed speed. With blue arrows, pair means that differ statistically are marked.
Since Rk is the parameter that approximates the best the tool marks (processing roughness), a supplementary statistical test was performed with the direct cutting parameters vc–fz on local profile depths D1–D4 (as in Table 3), when the rotation speed n was kept constant and the variable was the feed speed vf (consequently, fz). The conclusion from Table 7 was the same, respectively, for a constant n; the increase in the feed speed vf (respectively, fz) was statistically significant for Rk, even at different cutting levels (D1−D4) and mostly for the n2 rotation speed.
Table 7.
Pairwise comparison of parameters combinations (vc/fz) for Rk and the level of significance for an increase in vf (fz, respectively).
Also, a visual examination of the roughness profiles in Figure 8 shows a reduction in Rk when the feed speed was kept constant while the rotation speed increased. For example, an increase in the rotation speed from n1 to n2 decreased Rk by approximately 16% for the vf1 feed speed. However, the effect on Rk of changing the rotation speed was not overall significant. This result was also confirmed by testing the local significance for the local profile depths (D1–D4) in Table 8.
Table 8.
Pairwise comparison of parameters combinations (vc/fz) for Rk and the level of significance for an increase in n (and local vc, respectively).
Similar trends to Rk were observed in the values of Ra parameter (Figure 10), for which an increase in the feed speed has caused a significant increase no matter which rotation speed was used.
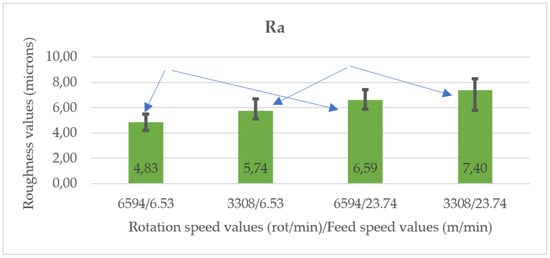
Figure 10.
The variation of the mean roughness parameter, Ra, with combinations of the rotation speed with the feed speed. With blue arrows, pair means that differ statistically are marked.
Another morphological aspect studied in relation to the processing parameters was the raised fiber. For the rotation speed n1 = 3308 rot/min, the increase more than 3.6 times in the feed speed from vf1 = 6.53 m/min to vf2 = 23.74 m/min has caused Rpk to increase 2.4 times (from 6.81 µm to 16.51 µm) which was statistically significant (ANOVA followed by Dunnett T3). This means, that an increase in the feed speed is raising the wood fiber (Figure 11). This increase can also be observed from the microscopical images in Figure 12c,d, illustrating a detail of zone 1, zone depicted with red arrows in Figure 12a,b. The raised fibers also appear in the roughness profiles, where they are encircled in red (Figure 8). For the rotation speed n2, although Rpk increased by 42% when the high feed speed was used and some raised fibers are visible in the roughness profiles, this had no statistical support. The increase in the rotation speed does not produce any significant effect regarding fuzziness or raised fiber.
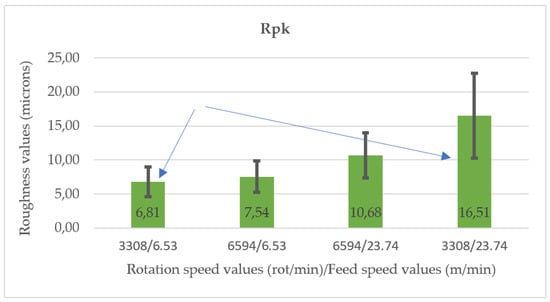
Figure 11.
The variation of the reduced peak heights parameter, Rpk, with combinations of the rotation speed with the feed speed. With blue arrows, pair means that differ statistically are marked.
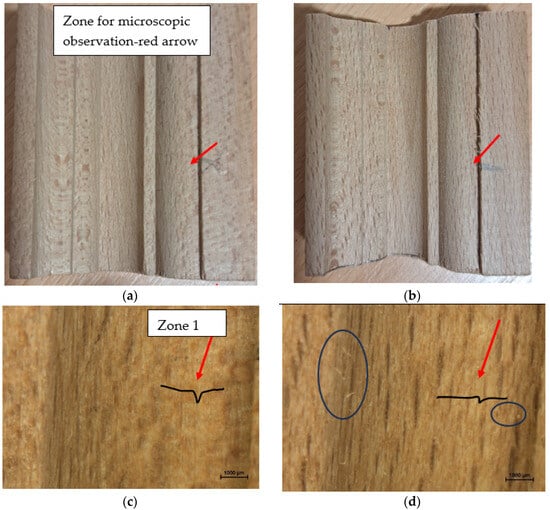
Figure 12.
Images of beech milled profiles (a,b) and microscopic details (c,d) at magnification 22.5×. (a,c) Processing by n1−vf1; (b,d) processing by n1−vf2. Examples of raised fibers are marked with blue ellipses.
Wood is a stratified heterogeneous material and apart from outliers located above the core roughness it also has outliers located below the core roughness. They can be seen as surface gaps, exemplified by yellow ellipses in Figure 8. Their origin can be deep anatomical cavities going below the marks caused by the cutting tool, but can also include accidental surface gaps when wood material is detached leaving unwanted voids in the material. Both of them will depend on the type and proportion of anatomical cells encountered by the cutting plane. The weakest zones should be those from the earlywood and those coinciding with the wood rays (radial surfaces). The processed samples did not consider a certain top wood surface orientation, which varied from radial to tangential and combinations like semi-radial and semi-tangential. For the above-mentioned reasons, the parameter Rv, which measures the deepest valley in the profile, had a high standard deviation (Table 4) in comparison with the core roughness Rk, depending on the local wood anatomy. Furthermore, Rv had values in the range of earlywood pores cavities reported for beech (8–45–85 µm) [33] (p. 107) with the majority of them around the mean values given in the literature (45 µm), while some of the deepest valleys were below 70 µm. These observations can lead to the assumption that the isolated deep valleys seen in the roughness profiles, in most cases, belong to inherent wood anatomical cavities and are not processing defects. An exception was made in the situations in which the cutter encountered radial surfaces and this caused detachment of some ray tissues, as can be seen in Figure 13b, which significantly increased Rv (Figure 14), with approximately 40%, for the feed speed vf2 in comparison with vf1 (Table 4, Figure 14). Wood pores went beyond the marks left by the tool on the wood, and this is observed by a negative Rsk and a subunitary ratio Rpk/Rvk. The same is true for the ratio A1/A2, which indicates a larger share of the area of the valleys compared to the area of the peaks (Table 4). An increase in the rotation speed from n1 to n2 has significantly reduced Rv (Figure 14) with approximately 33% for the feed speed vf1 (ANOVA and Dunnett T3).
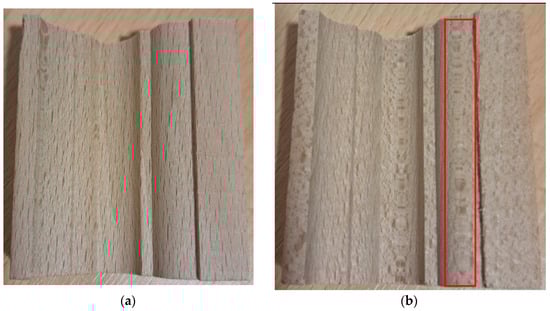
Figure 13.
Samples processed by milling with n2 rotation speed. (a) Feed speed vf1; (b) feed speed vf2. The red rectangle exemplifies a radially cut surface which contains detached ray tissues.
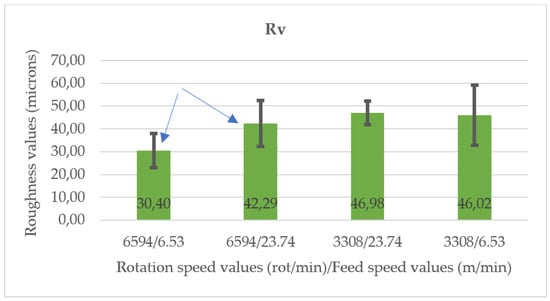
Figure 14.
The variation of the deepest valley, Rv, with combinations of the rotation speed with the feed speed. With blue arrows, pair means that differ statistically are marked.
Interpretation of surface quality in the case of wood is complex. For optimization of the cutting quality and selection of the best working parameters, the tool marks are of interest. From this perspective, Rk parameter is representative and has shown it is significantly influenced by the feed speed and was less affected by the selection of the rotation speed. The surface fuzziness and accidental material detachment will be species-dependent and of wood local anatomy. However, their effect on the overall surface quality cannot be neglected. A statistical analysis ANOVA followed by Dunnett T3 test performed on the cumulative effect of processing plus the raised fiber (Rk+Rpk) has led to the same conclusions as in the case of Rk alone: the feed speed was the most important factor affecting the surface quality by milling. Although the surface quality has improved by increasing the rotation speed, its effect was not significant (Table 9 and Table 10). The best surface quality was obtained when combining n2 (6594 rot/min) with vf1 (6.53 m/min) and the worst when the rotation speed n1 (3308 rot/min) was combined with the high feed speed vf2 (23.74 m/min), as shown in Figure 15.
Table 9.
Dependent variable Rk+Rpk—Test between groups’ effects.
Table 10.
Dependent variable Rk+Rpk—Dunnet T3 Post Hoc Test for multiple comparisons between groups’ rotation speed–feed speed.
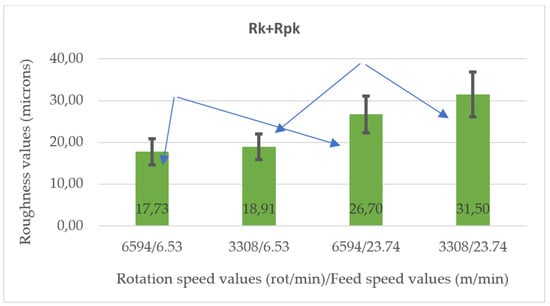
Figure 15.
The variation of the cumulative parameter Rk+Rpk with combinations of the rotation speed with the feed speed. With blue arrows, pair means that differ statistically are marked.
When the surface isolated gaps were included, together with the tool marks and the raised fiber, not only the feed speed was a significant factor, but also the rotation speed, the surface quality improving for the highest rotation speed n2 in comparison with n1 (Figure 16, Table 11 and Table 12).
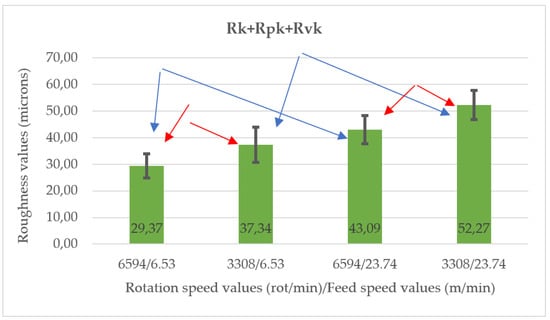
Figure 16.
The variation of the cumulative parameter Rk+Rpk+Rvk with combinations of the rotation speed with the feed speed. With blue and red arrows, pair means that differ statistically are marked.
Table 11.
Dependent variable Rk+Rpk+Rvk—Test between groups’ effects.
Table 12.
Dependent variable Rk+Rpk+Rvk—Dunnet T3 Post Hoc Test for multiple comparisons between groups’ rotation speed–feed speed.
Another test was conducted to monitor the surface quality after the tool has milled 600 m of the same profile and species, in order to see which is the effect of the tool condition.
Comparative profiles when the tool was sharpened and profiles after the tool milled 600 m are displayed in Figure 17.
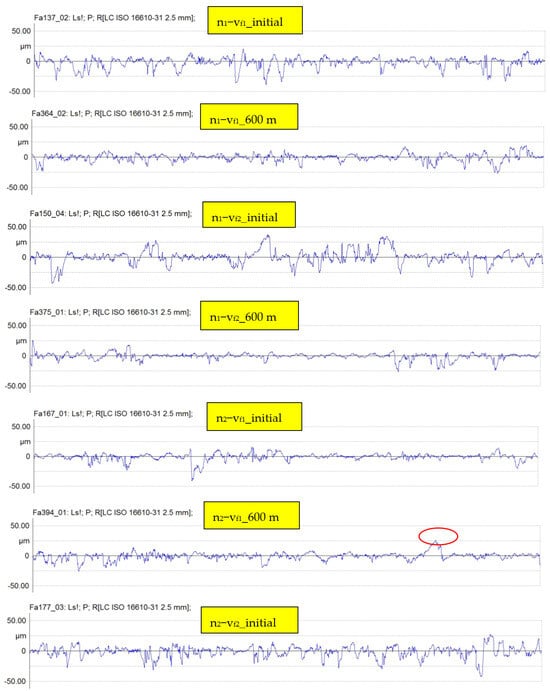
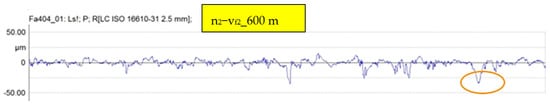
Figure 17.
Roughness profiles of each group combination, rotation speed–feed speed comparing the effect of tool condition (when new and sharpened and after 600 m cutting distance). Raised fibers are marked with red; deep isolated valleys are marked with yellow ellipse.
From the profiles presented in Figure 17, it can be observed that after using the tool by continuous processing for 600 m cutting distance, the surface quality improved (Figure 18). The surface improvement was also sensed by touch, but it is visible also in Figure 18c,d taken as example.
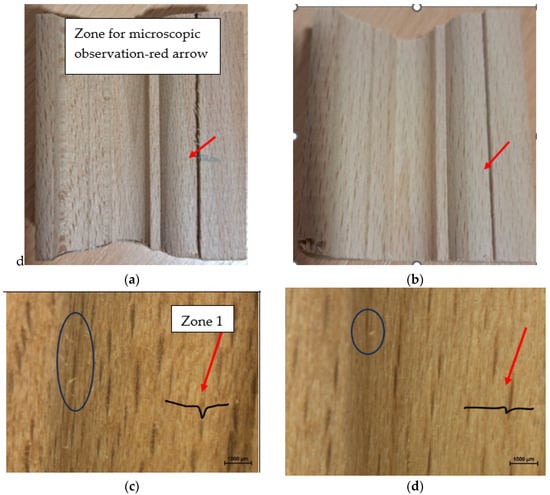
Figure 18.
Images of beech milled profiles (a,b) and microscopic details (c,d) at magnification 22.5×. (a,c) Processing by n1−vf2, sharpened tool; (b,d) processing by n1−vf2 after 600 m profile milling. Raised fibers are encircled with blue.
A statistical comparison of the composed parameter Rk+Rpk+Rvk was performed in order to obtain a global evaluation of the surface improvement. The ANOVA test followed by a Post Hoc test Games–Howell (groups had unequal number of measurements) indicated a surface improvement after the tool was working 600 m, which was significant when the high feed speed was used (vf2 = 23.74 m/min). The improvement was quantified to 30% roughness decrease for the rotation speed n2 and to 34% when the rotation speed n1 was used.
This result is an indication that the surface quality is not only dependent on the wood material and the processing parameters, but also on the tool working load, which is expected to vary with the milling parameters as well as with the species. It will be interesting, in further tests, to explore the surface quality from the moment the tool is sharpened to the moment when it is worn out, together with microscopic observations regarding the state of the tool cutting edge. This may help establish an ideal working interval for the tool before it needs resharpening or replacement. A worn tool will increase the surface roughness and the occurrence of surface defects, such as pull-out material and fiber detachment.
Finally, another analysis addressed the surface quality at the four profile depths (from Figure 3), in order to see if the variation of the local cutting speed, vc, implicitly of the feed per tooth, fz, has a significant impact on the processing roughness quantified by the Rk parameter. The analysis was made for all combinations of rotation speed–feed speed. An ANOVA single factor test was performed, with a level of significance p < 0.05. The results are presented in Table 13.
Table 13.
Rk mean values at the four measured profile depths and the analysis of their statistical difference. Standard deviation in parentheses.
From Table 13, it can be concluded that the processing quality measured at different depths does not differ statistically, in spite of the local differences in the cutting speed. There are different opinions in the literature regarding the effect of the cutting speed during machining processes. Some researchers found that the cutting speed has no effect on the surface quality, while others found that the cutting speed has a slight effect depending on process conditions [15].
The results regarding the effect of milling parameters on the wood surface quality are not surprising and are expected, but in comparison with other studies from the literature bring a novel approach to the evaluation of the surface quality, regarding wood as a stratified material. A stratified analysis of surface roughness parameters can not only clarify the surface complex morphology, but it is helpful to determine the contribution of processing parameters to the overall surface quality and their significance.
4. Conclusions
This study has shown that the surface quality should be analyzed on stratified levels of irregularities differentiating between, waviness, tool marks, fuzzy grain, and accidental surface gaps overlapped onto the deep anatomical cavities of the wood, such as pores from earlywood. This is because the milling quality will be dependent not only on the processing parameters and tool characteristics, but also on the wood species and its anatomical structure.
The interpretation of the results was focused on variations in vf, respectively n, since fz is directly influenced by the feed speed vf, for a constant n and for the same number of cutters (a single type of tool was used in this research), while the cutting speed, vc, differs very slightly with the local tool diameter (depth of cut, respectively), for a given rotation speed, n.
An increase in the feed speed, vf, increases tool vibration, which leaves deeper waves in the surface. The surface waviness measured by Wa increased more than double when the feed speed increased approximately 3.6 times, from vf1 = 6.53 m/min, to vf2 = 23.74 m/min. Increasing the rotation speed from n1 to n2 (double) has decreased Wa with 20%, but without statistical support.
An increase in the feed speed increases the toolmarks approximated by Rk which are more pronounced as the rotation speed becomes higher. Rk increased with the feed speed (respectively, fz for a constant n and number of cutters) for n2 = 6594 rot/min by a significant 57%. An increase in the rotation speed from n1 to n2 has reduced Rk, but the effect was not significant. For example, an increase in the rotation speed from n1 to n2 decreased Rk by approximately 16% for the vf1 feed speed. Similar behavior was noticed for the Ra parameter. The processing quality (Rk) measured at different depths did not differ statistically, in spite of the local differences in the cutting speed.
An increase in the feed speed raises the wood fiber. Therefore, the Rpk parameter increased 2.4 times when the feed speed increased 3.6 times. The increase in the rotation speed does not produce any significant effect regarding fuzziness or raised fiber.
Wood pores were deeper than the marks left by the tool on the wood and their effect on surface quality was disregarded in the above conclusions. However, some gaps deeper than the core roughness and caused by material detachment were noticed when the milling encountered radial surfaces, thus affecting the ray tissues. This did not change the conclusion that the smoothest beech surface is obtained when the smallest feed speed (6.53 m/min) is used. However, by including the surface gaps in the analysis by referring to the parameter Rk+Rpk+Rvk, it attributed a significance to the rotation speed as well, such as the higher rotation speed (6594 rot/min) also contributing to the surface quality improvement.
The processing quality measured at different depths does not differ statistically, in spite of the local differences in the cutting speed.
The statistical analysis helped us to understand the hierarchy of influence factors and their significance. In this respect, the most important factor affecting the surface quality was the feed speed.
The moment of measuring the surface roughness, such as immediately after sharpening or after a working period, influences the result of the surface quality. Measurements of surface quality after the tool processed 600 m of beech material improved the surface quality by 30%.
In further work, such stratified analysis will provide a more in-depth understanding and quantification of the tool interaction with the wood material and will help the selection of the most appropriate processing parameters as a function of the tool and species variables.
Author Contributions
Conceptualization, L.-M.B. and L.G.; data curation, L.-M.B. and L.G.; formal analysis, L.-M.B.; funding acquisition, L.-M.B.; investigation, L.-M.B. and L.G.; methodology, L.-M.B.; project administration, L.-M.B.; resources, L.-M.B. and L.G.; software, L.-M.B. and L.G.; supervision, L.-M.B. and L.G.; validation, L.-M.B. and L.G.; writing—original draft, L.G.; writing—review and editing, L.-M.B. and L.G. All authors have read and agreed to the published version of the manuscript.
Funding
This research received no external funding.
Institutional Review Board Statement
Not applicable.
Informed Consent Statement
Not applicable.
Data Availability Statement
Data are contained within the article.
Acknowledgments
We hereby acknowledge the structural funds project PRO-DD (POS-CCE, O.2.2.1., ID 123, SMIS 2637, No. 11/2009) for providing the infrastructure used in this work and the Contract No. 7/9.01.2014.
Conflicts of Interest
The authors declare no conflict of interest.
References
- Thoma, H.; Peri, L.; Lato, E. Evaluation of Wood Surface Roughness Depending on Species Characteristics. Maderas. Cienc. Tecnol. 2015, 17, 285–292. [Google Scholar] [CrossRef]
- Hazir, E.; Koc, K.H. Optimization of wood surface machining parameters in CNC routers: Response surface methodology (RSM) approach. Int. J. Sci. Res. Eng. Technol. 2016, 5, 494–501. [Google Scholar]
- Hazir, E.; Koc, K.H. Optimization of wood machining parameters in CNC routers: Taguchi orthogonal array based simulated angling algorithm. Maderas Cienc. Tecnol. 2019, 21, 493–510. [Google Scholar] [CrossRef]
- Westkämper, E.; Riegel, A. Qualittskriterien fur Geschlieffene Massivholzoberflchen. Holz Roh Werkst. 1993, 51, 121–125. [Google Scholar] [CrossRef]
- Krisch, J.; Csiha, C. Analysing wood surface roughness using an S3P Perthometer and computer based data processing. In Proceedings of the XIII Sesja Naukowa Badania dla Meblarstwa, Poznan, Poland, 26 November 1999. [Google Scholar]
- Magoss, E.; Sitkei, G. Influence of wood structure on the surface roughness at milling operations. In Proceedings of the 4th ICWSF, Missenden Abbey, UK, 14–16 July 1999. [Google Scholar]
- Gurău, L. The Roughness of Sanded Wood Surfaces. Ph.D. Thesis, Forest Products Research Centre, Buckinghamshire Chilterns University College, Brunel University, London, UK, 2004. [Google Scholar]
- Thibaut, B.; Denaud, L.; Collet, R.; Marchal, R.; Beauchêne, J.; Mothe, F.; Méausoone, P.J.; Martin, P.; Larricq, P.; Eyma, F. Wood machining with a focus on French research in the last 50 years. Ann. For. Sci. 2016, 73, 163–184. [Google Scholar] [CrossRef]
- Gurău, L.; Irle, M. Surface roughness evaluation methods for wood products: A review. Curr. For. Rep. 2017, 3, 119–131. [Google Scholar] [CrossRef]
- Gawronski, T. Optimisation of CNC routing operations of wooden furniture parts. Int. J. Adv. Manuf. Technol. 2013, 67, 2259–2267. [Google Scholar] [CrossRef]
- Sutcu, A. Investigation of parameters affecting surfaces roughness in CNC Routing operation on Wooden EGP. Bioresources 2013, 8, 795–805. [Google Scholar]
- Koc, K.H.; Erdinler, E.S.; Hazir, E.; Öztürk, E. Effect of CNC application parameters on wooden surface quality. Measurement 2017, 107, 12–18. [Google Scholar] [CrossRef]
- Gürgen, A.; Çakmak, A.; Yldiz, S.; Malkoçoğlu, A. Optimization of CNC operating parameters to minimize surface roughness of pinus sylvestris using integrated artificial neural network and genetic algorithm. Maderas Cienc. Tecnol. 2022, 24, 5. [Google Scholar] [CrossRef]
- Jiang, S.; Buck, D.; Tang, Q.; Guan, J.; Wu, Z.; Guo, X.; Zhu, Z.; Wang, X. Cutting Force and Surface Roughness during Straight-Tooth Milling of Walnut Wood. Forests 2022, 13, 2126. [Google Scholar] [CrossRef]
- Costes, J.P.; Larricq, P. Towards high cutting speed in wood milling. Ann. For. Sci. 2002, 59, 857–865. [Google Scholar] [CrossRef]
- Piernik, M.; Pinkowski, G.; Krauss, A. Effect of chip thickness, wood cross-sections, and cutting speed on surface roughness and cutting power during up-milling of beech wood. BioResources 2023, 18, 6784–6801. [Google Scholar] [CrossRef]
- Pakzad, S.; Pedrammehr, S.; Hejazian, M. A Study on the Beech Wood Machining Parameters Optimization Using Response Surface Methodology. Axioms 2023, 12, 39. [Google Scholar] [CrossRef]
- Rabiei, F.; Yaghoubi, S. A comprehensive investigation on the influences of optimal CNC wood machining variables on surface quality and process time using GMDH neural network and beest optimization algorithm. Mater. Today Commun. 2023, 36, 106482. [Google Scholar] [CrossRef]
- Zhu, Z.; Jin, D.; Wu, Z.; Xu, W.; Yu, Y.; Guo, X.; Wang, X. Assessment of Surface Roughness in Milling of Beech Using a Response Surface Methodology and an Adaptive Network-Based Fuzzy Inference System. Machines 2022, 10, 567. [Google Scholar] [CrossRef]
- Kilic, M.; Hiziroglu, S.; Burdurlu, E. Effect of machining on surface roughness of wood. Build. Environ. 2006, 41, 1074–1078. [Google Scholar] [CrossRef]
- Magoss, E. General regularities of wood surfaces roughness. Acta Silv. Lignaria Hung. 2008, 4, 81–93. [Google Scholar]
- Gurău, L.; Coşereanu, C.; Paiu, L. Comparative Surface Quality of Larch (Larix decidua Mill.) Fretwork Patterns Cut through by CNC Routing and by Laser. Appl. Sci. 2021, 11, 6875. [Google Scholar] [CrossRef]
- ISO 4287; Geometrical Product Specifications (GPS)—Surface Texture—Profile Method—Terms, Definitions and Surface Texture Parameters. International Organization for Standardization: Geneva, Switzerland, 2009.
- ISO 13565-2; Geometrical Product Specifications (GPS)—Surface Texture: Profile Method; Surfaces Having Stratified Functional Properties. Part 2: Height Characterisation Using the Linear Material Ratio Curve. International Organization for Standardization: Geneva, Switzerland, 1998.
- ISO/TS 16610-31; Geometrical Product Specification (GPS)—Filtration—Part 31: Robust Profile Filters: Gaussian Regression Filters. International Standards Organisation: Geneva, Switzerland, 2010.
- EN ISO 683-1; Heat-Treatable Steels, Alloy Steels and Free-Cutting Steels. Part 1: Non-Alloy Steels for Quenching and Tempering. International Organization for Standardization: Geneva, Switzerland, 2016.
- EN ISO 4957; Tool Steel. International Organization for Standardization: Geneva, Switzerland, 2018.
- Rolleri, A.; Burgos, F.; Aguilera, A. Surface Roughness and Wettability Variation: The effect of Cutting Distance during Milling of Pinus Radiata Wood. Drv. Ind. 2016, 67, 223–228. [Google Scholar] [CrossRef]
- Fujiwara, Y.; Fujii, Y.; Sawada, Y.; Okumura, S. Assessment of wood surface roughness: A comparison between tactile roughness and three-dimensional parameters derived using a robust gaussian regression filter. J. Wood Sci. 2004, 50, 35–40. [Google Scholar] [CrossRef]
- Gurău, L.; Mansfield-Williams, H.; Irle, M. Filtering the Roughness of a Sanded Wood Surface. Holz Roh Werkst. 2006, 64, 363–371. [Google Scholar] [CrossRef]
- Piratelli-Filho, A.; Sternadt, G.H.; Arencibia, R.V. Removing deep valleys in roughness measurement of soft and natural materials with mathematical filtering. Ciência Eng. 2012, 21, 29–34. [Google Scholar] [CrossRef][Green Version]
- Tan, P.L.; Sharif, S.; Sudin, I. Roughness models for sanded wood surfaces. Wood Sci. Technol. 2012, 46, 129–142. [Google Scholar] [CrossRef]
- Wagenführ, R. Holzatlas, 5th ed.; Fachbuchverlag: Leipzig, Germany, 2000; p. 707. [Google Scholar]
Disclaimer/Publisher’s Note: The statements, opinions and data contained in all publications are solely those of the individual author(s) and contributor(s) and not of MDPI and/or the editor(s). MDPI and/or the editor(s) disclaim responsibility for any injury to people or property resulting from any ideas, methods, instructions or products referred to in the content. |
© 2023 by the authors. Licensee MDPI, Basel, Switzerland. This article is an open access article distributed under the terms and conditions of the Creative Commons Attribution (CC BY) license (https://creativecommons.org/licenses/by/4.0/).