Article

Wood Material Properties of Forest Fire-Damaged Norway Spruce and Scots Pine for Mechanical Wood Processing in Finland

1
Natural Resources Institute Finland (Luke), Production Systems, Yliopistokatu 6B, FI-80100 Joensuu, Finland
2
Department of Chemistry, Faculty of Science, Forestry and Technology, University of Eastern Finland (UEF), Yliopistokatu 7 (Futura), FI-80100 Joensuu, Finland
3
UPM Forest, Kaarinantie 700, FI-20540 Turku, Finland
4
Natural Resources Institute Finland (Luke), Production Systems, Viikinkaari 9, FI-00790 Helsinki, Finland
*
Author to whom correspondence should be addressed.
Appl. Sci. 2024, 14(1), 238; https://doi.org/10.3390/app14010238
Submission received: 15 November 2023 / Revised: 7 December 2023 / Accepted: 14 December 2023 / Published: 27 December 2023

Abstract

:
Due to climate change, the risk of forest fires has increased in Europe, resulting in challenges in the allocation of salvaged wood. We studied the raw material potential for wood products of Norway spruce and Scots pine sawn log trees that remained standing after a large forest fire in Kalajoki, Finland, in July 2021. Eight burned trees, with four reference trees per species, were sampled as standard specimens, and measurements were analyzed with linear mixed models. The effects of fire on the modulus of elasticity and rupture, Brinell hardness, moisture gradient, and color were measured on clear wood specimens of sapwood and heartwood. The wood density, level of fire damage, and height location of a tree were used as additional predictors. The results show some changes in the sapwood material. Spruce wood underwent stronger changes after the fire than pine wood, probably due to spruce wood having a thinner bark and a longer crown. The moisture content decreased in spruce, and the color darkened in both spruce and pine. Changes in the mechanical properties were mostly negligible, but a small increase in the Brinell hardness in spruce and a small decrease in the modulus of rupture in pine were observed. Fresh salvaged wood can be a suitable material for middle-quality and lower-quality wood products. The spread of char and soot into wood and wood processing machinery still limits its usage, especially for spruce.

1. Introduction

Wildfires and resultant forest disturbances have become common globally, and their scale and severity have increased since the beginning of the 2000s [1,2,3,4]. This has mostly been attributed to climate change and sudden regional weather phenomena, such as droughts and heat loads during summer seasons, but partly due to human behavior and machine work activities in nature and the built environment [5,6,7,8,9,10]. Most wildfires, with respect to the overwhelmingly largest areas, have been in the Russian Federation, Canada, the U.S. West, Australia, and Mediterranean countries [2].
In Finland, the forest fire incidence level is very low [3]. For example, 470 hectares of land damaged by forest fires was reported in 2017, and the benchmark of over 1000 hectares was destroyed only in 2006 [11]. There is a short span of seasons when forests are vulnerable to fire, ranging from May to September, with June and July remaining as the peak periods; relatively cool and rainy summers, high forest and second-home road densities, and efficient aerial fire control and prevention have contributed to the low incidence rate [12]. However, with climate change causing drought periods during summer, more trees suffering and drying from bark beetle damage, and the practice of leaving standing and wind-fallen trees for biodiversity management after final harvesting, vulnerability to fires is predicted to increase in the coming decades [13].
The forest stand structure and site, tree species, and fire intensity largely determine the consequences for trees and their probability of surviving a forest fire [7,14,15]. A dense stand, dry site, small diameter, thin bark, and large crown have been observed to lead to a high mortality of trees [5,6,7,8,9,10]. Owing to fire, drying that results in checking may occur in sapwood if the bark deteriorates first; additionally, notable charring and grayish discoloration occur because of char and soot, but the heartwood should remain essentially unchanged [6,8,12,15,16]. In wood material, drying starts slowly due to direct heating at a temperature as low as 20–100 °C; thereafter, the rate increases, and the intensity multiplies [17]. Chemical transformation affecting the physico-mechanical properties starts at 50–100 °C with the decomposition of certain extractives, and the major changes begin at 160–180 °C with the decomposition of hemicelluloses and above 250 °C with lignin [18]. Physical changes start above 150 °C with a decrease in the equilibrium moisture content and a reduction in hygroscopicity, absorbability, and surface activity; these changes continue and later cause an increase in dimensional stability, color changes, and a decrease in some mechanical properties [17,18,19].
Few studies have considered the effects of forest fires on the physico-mechanical properties of wood or wood products. No effects on density or shrinkage properties have been found in the wood of loblolly pine in Brazil [20] or maritime pine in Portugal [21]. However, significant reductions in the bending properties (the modulus of rupture, MOR, and the modulus of elasticity, MOE), compression strength, and toughness values have been observed for loblolly pine when flames consume the total crown, and the compression strength has been shown to be reduced when the crown is partially consumed [20]. Maritime pine wood showed a similar response in a severe forest fire, but the reduction in the properties was traced more to biological degradation due to prolonged wood harvesting than the fire [21]. Fire effects on physico-mechanical properties and chemical composition do not cause sufficient chemical degradation or strength reduction, which would cause the rejection of these woods for commodity uses of mechanical wood processing; however, in structural uses, caution should be taken for wood from trees that have been fully or partially consumed by fire. In Uganda, Caribbean pine wood from 10-year-old burned trees has a significantly lower density, MOE, and MOR than wood from unburned trees, and it should not be used for high-strength structural purposes but rather in low-strength construction works, such as shuttering and ceilings [22].
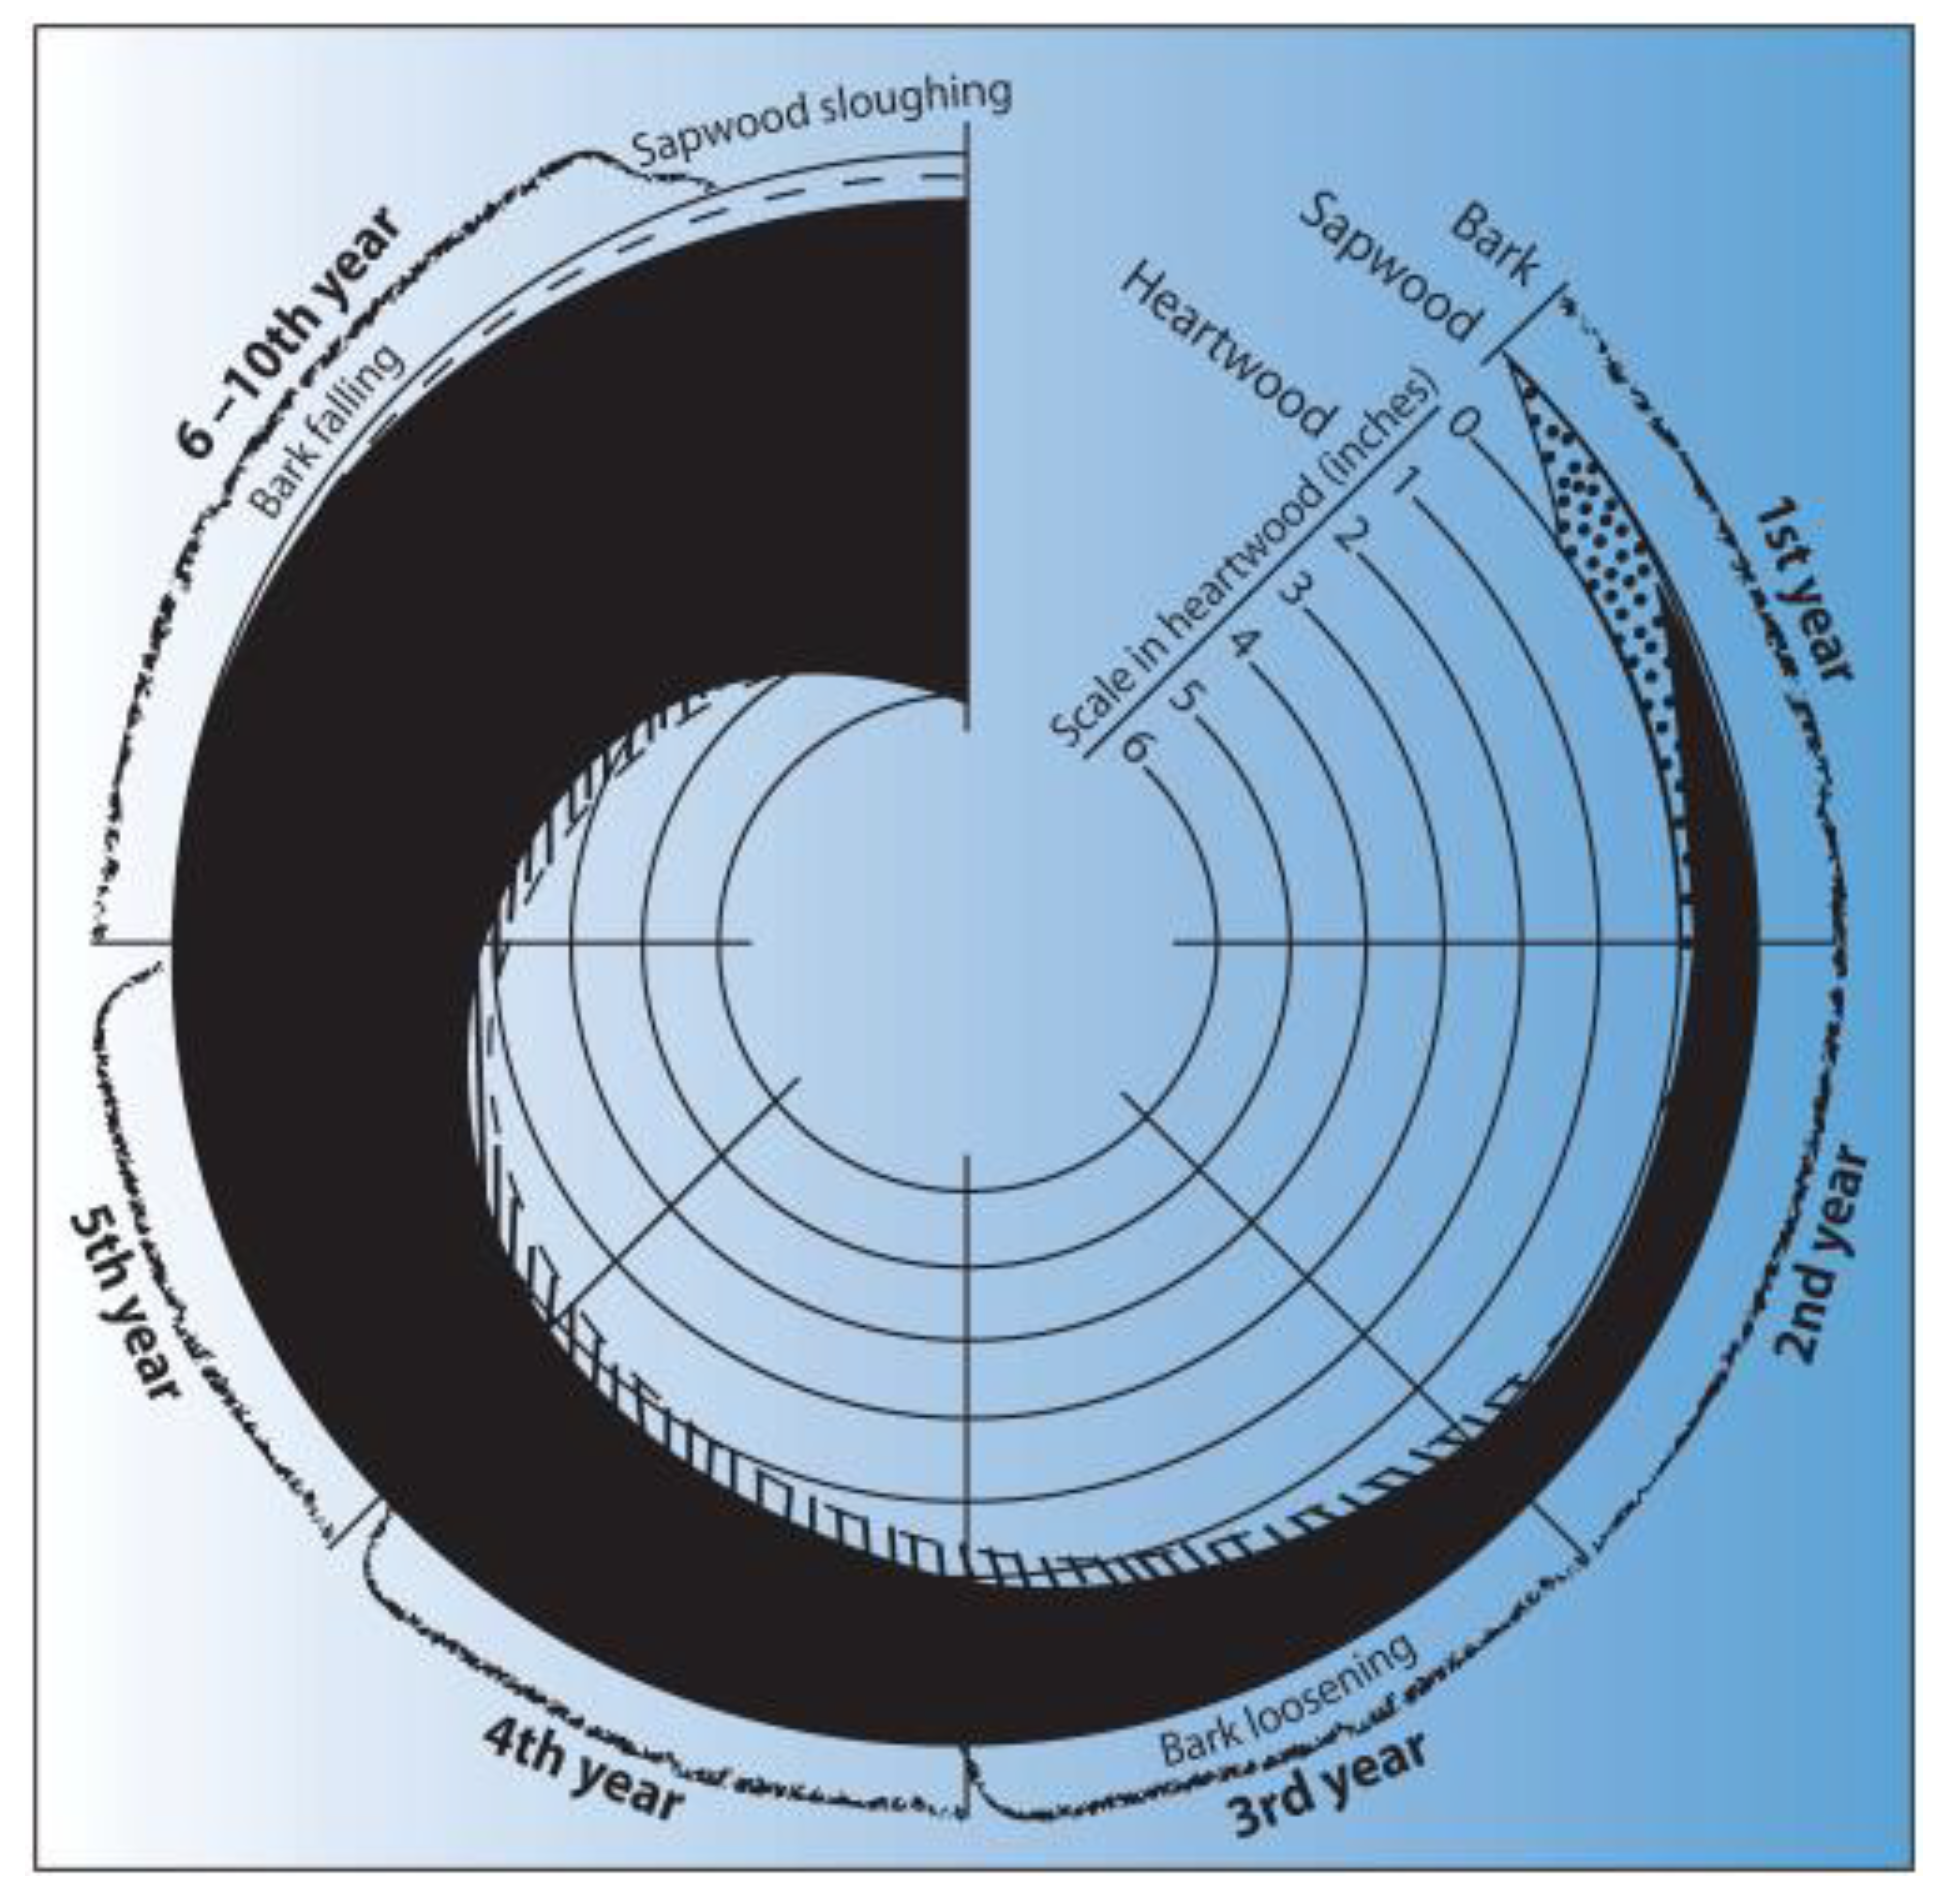
Both the direct and indirect effects of forest fire are present in wood salvaged from fire areas, and their nature and severity depend on the time between the fire and harvesting [5,14,16]. Trees with lowered vitality are susceptible to insect and microbial attacks and wind falls; the resultant wood defects lower the basic quality of sawn timber and veneer-based products but do not ruin their potential use. The susceptibility varies a lot between individual forest stands, but the following generalizations have been presented [16,23]: (1) blue stain occurs in the first year after the fire, lowering the visual quality; (2) heartwood starts to decay, and the deterioration of sapwood accelerates in the second year, reducing the quality for high-strength products; and (3) the sapwood of most coniferous species is unworthy for any construction purpose three years after the fire. The types and rates of deterioration of burned wood after forest fires in North America are illustrated in Figure 1.
In practice, wood salvaged from forest fire areas has been allocated to either bioenergy or low-grade sawn timber; in North America, some wood has also been allocated to laminated veneer lumber (LVL) [16,24,25,26]. The suitability of burned wood has also been studied for oriented strand board (OSB) and medium-density fiberboard (MDF) [27,28]. Burned wood is not accepted for pulp, paper, or paperboard processes or products due to char and soot [28]. In North America, burned timber has been posited to still be usable for sawn timber if the logs are harvested within two years after the fire [29], but other sources claim that harvesting should be done at the latest one year after the fire to recover the full economic benefits of such logging [30,31]. In Finland, the Forest Damage Prevention Act suggests that forest-damaged trees should be harvested from the forest if their volume exceeds 10 or 20 m3/ha for Norway spruce or Scots pine, respectively, counting trees with a stump diameter of more than 10 cm [32].
The objective of this study was to investigate the raw material potential of sawn wood and to select further processed products of Norway spruce and Scots pine sawn log trees from salvage harvesting in forest fire areas with northern European climatic conditions by comparing selected physical and mechanical properties of fire-affected trees and virgin reference trees. The effects of fire on the MOE, MOR, Brinell hardness (HB), moisture gradient, and wood color (CIE L*a*b*) were studied on clear wood specimens of outer sapwood and inner heartwood, and linear mixed models were constructed to analyze the sources of variation. Recommendations are provided for sawmill managers, further processors, and forest owners on wood allocation and potential products from forest fire areas in Finland.

2. Materials and Methods

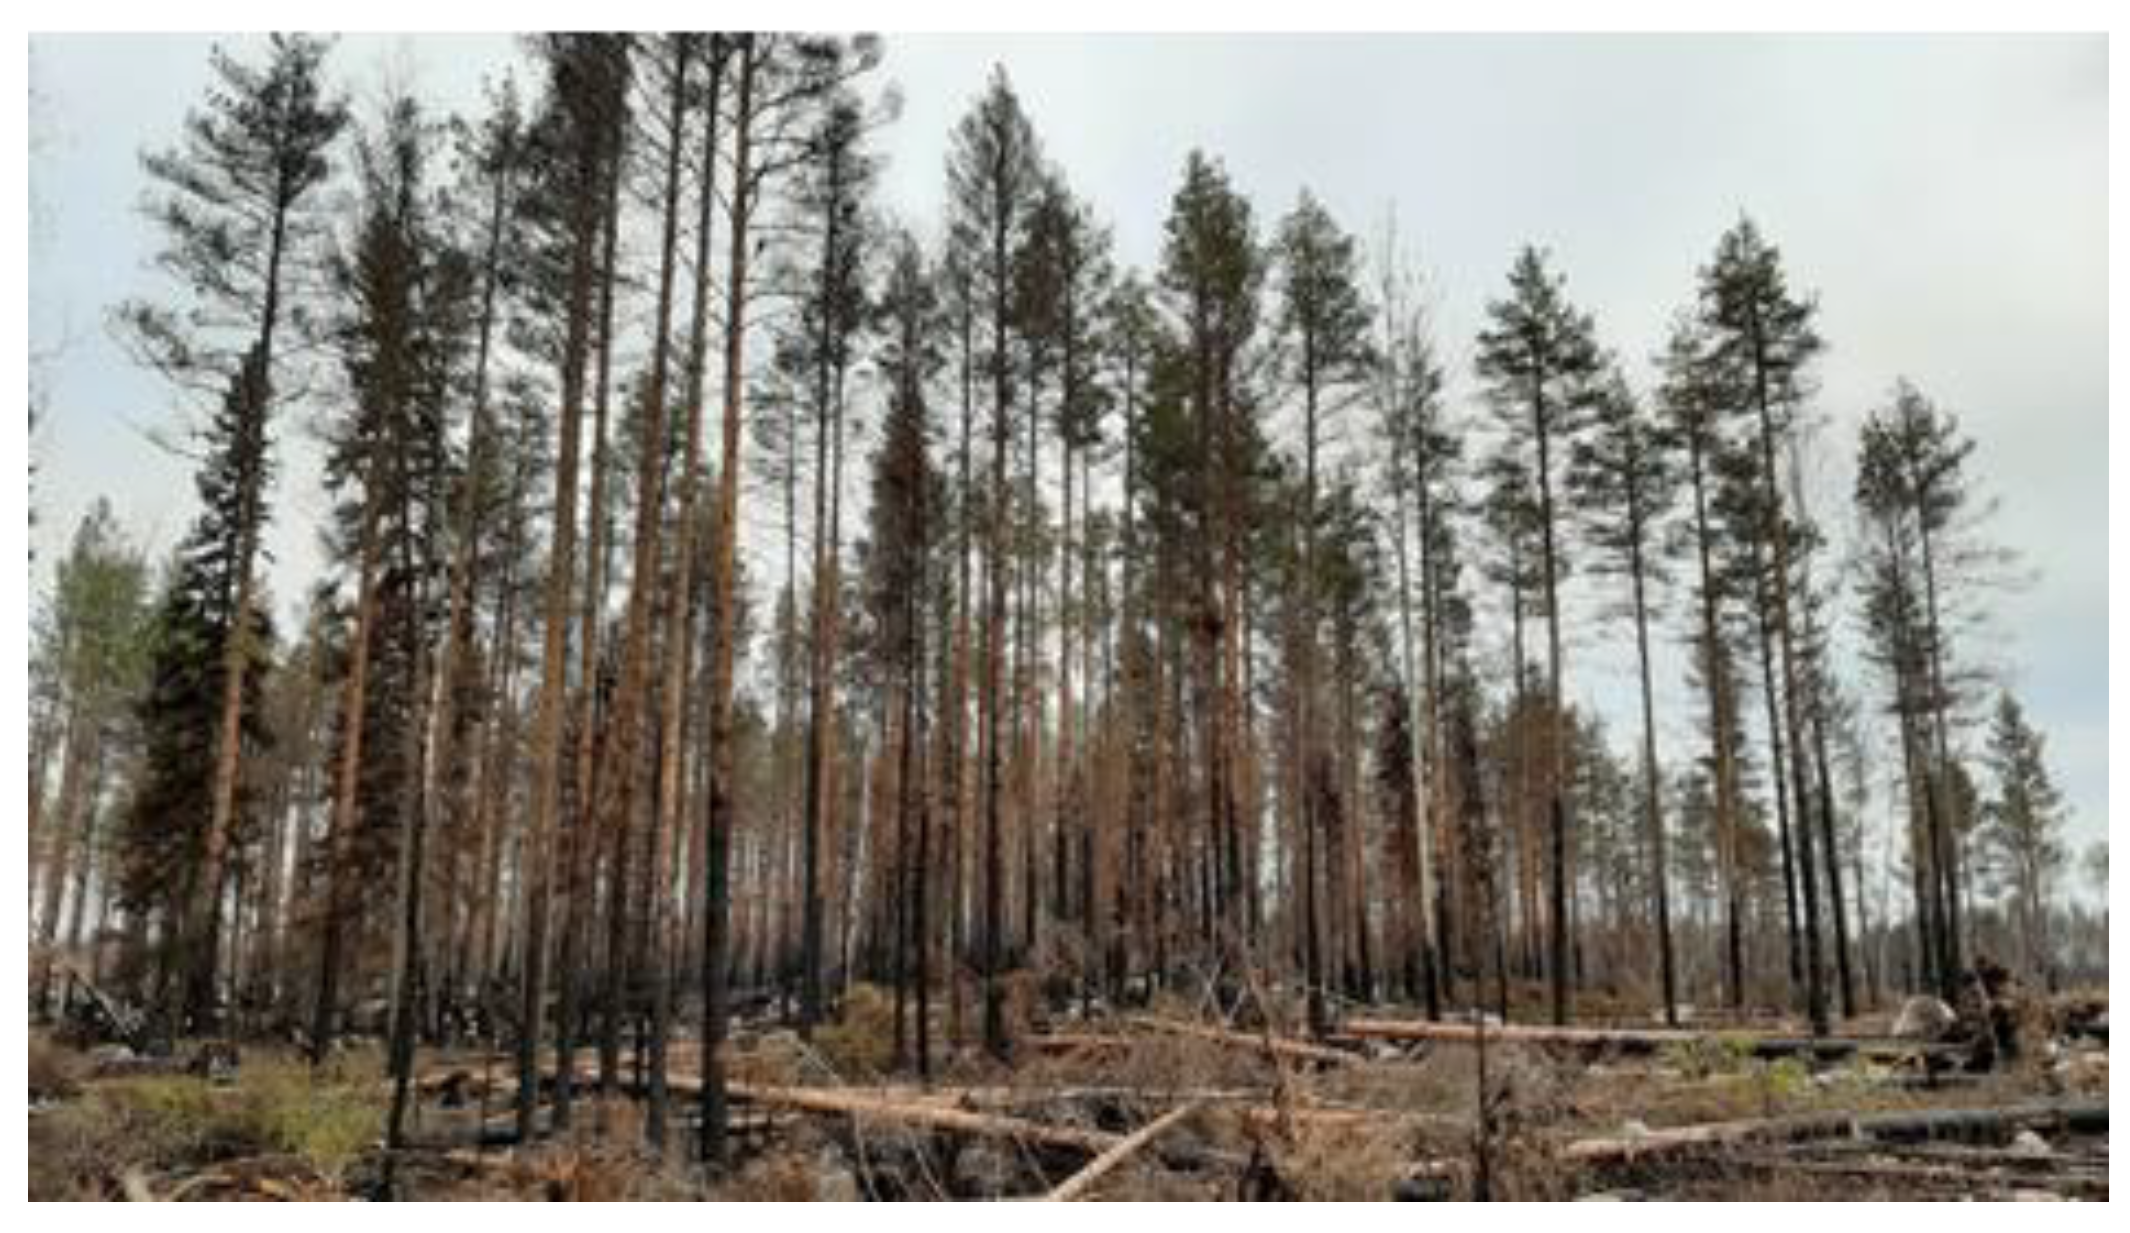
Wood samples of forest fire trees were collected from burned stands of Norway spruce and Scots pine in an area of 227 hectares in Kalajoki, Western Finland (64°00′15.0″ N 24°08′09.0″ E), in November 2021, four months after the fire in July 2021. In Kalajoki, flammability was high before the fire. The local temperature was 27 °C, and the air humidity was 44% on the first day of the fire, 26 July 2021. The wind speed was 3.5 m/s, and in gusts, it was 9–10 m/s. In the beginning, the fire spread 2–3 m/min, and at its highest, the rate of spread was 15–20 m/min. The fire reached the entire area in two and a half days (until 28 July 2021), and in its most intense phases, it spread into forests as a crown fire [33].
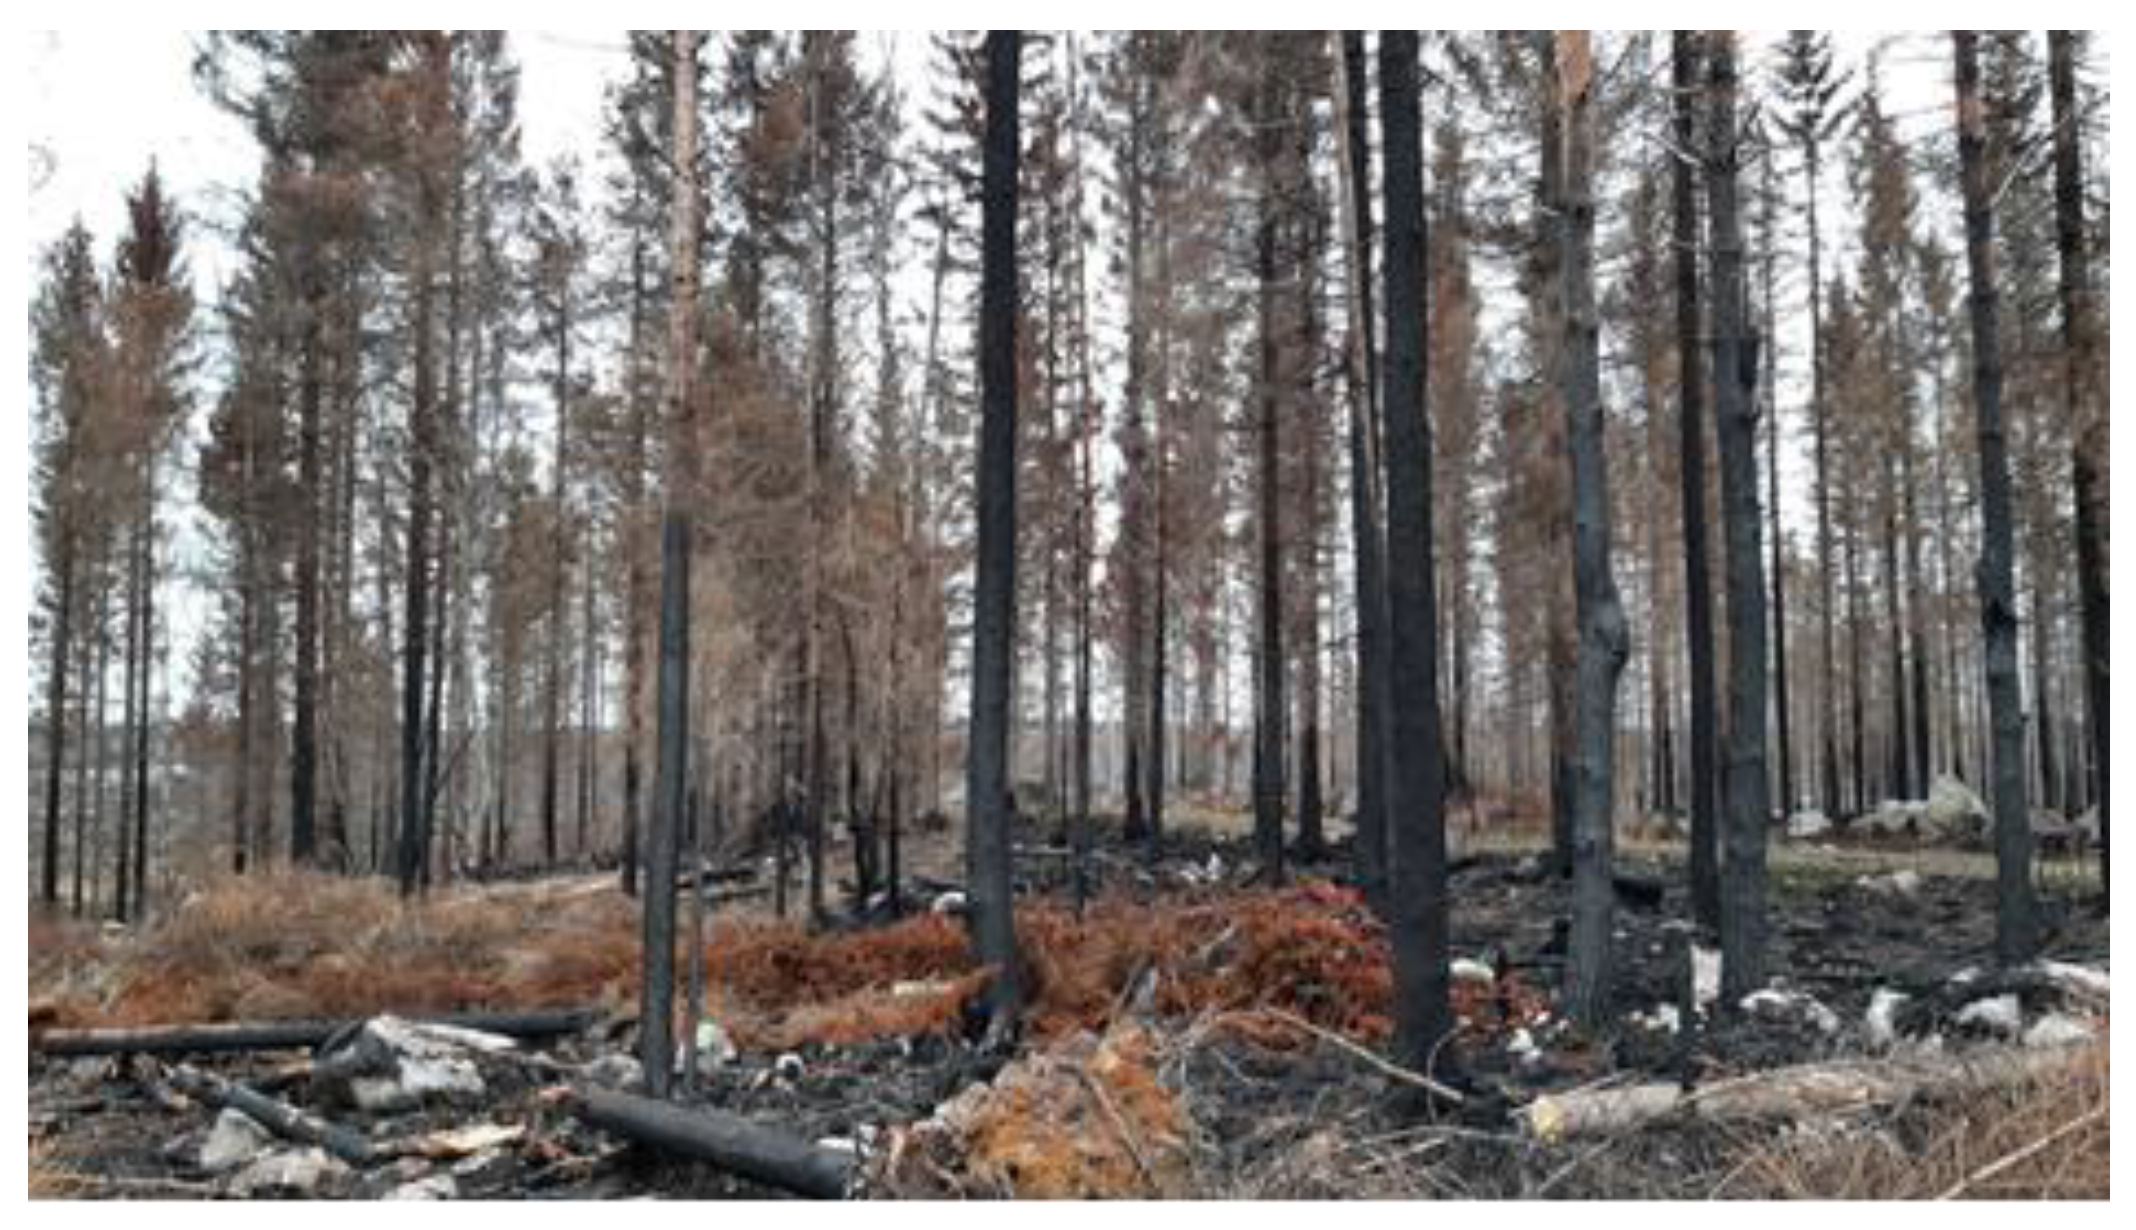
The studied stands are presented in Figure 2 and Figure 3. The samples of the reference trees were collected simultaneously from stands located near the fire area in Kalajoki and supplemented with trees in February 2022 from Raahe (64°23′36.8″ N 25°03′01.8″ E) to obtain comparable reference data in terms of tree age and diameter.
The stems of the burned trees and reference trees were cut in the forest into 4 m logs up to a top diameter of about 10 cm, which is close to the commercial minimum diameter of small-diameter logs. Four normal-sized log burned trees (diameter at breast height, DBH, about 25–30 cm) and four small-log burned trees (DBH, about 14–18 cm) of both Norway spruce and Scots pine were selected, and the total number of logs with references was 24 (Table 1). Before the cut, the length of the area damaged by the fire was measured on the burned trees based on the signs visible on the bark in two ways: (1) by considering the entire circumference of the stem, i.e., the shell surface burned, and (2) by considering all clear signs of the effects of the fire on the bark of the stem. From each 4 m log, a block of approximately 60 cm was further cut as the material to be used in physical and mechanical tests. The blocks (total number of 72) represented the butt, middle, and top logs.
In the case of spruce, the diameters and lengths of the burned and reference trees were comparable, but the normal-sized log burned trees were younger than the reference trees (Table 2). For pine, the lengths and diameters of the burned and reference trees were comparable, but the burned trees were slightly older than the reference trees.
Sixty-centimeter blocks were through and through sawn with a band saw in Joensuu in February 2022. A 60 mm thick pith-centered balk from each block was sawn towards the surface, totaling 72 balks for further tests. If there were visually noticeable differences in the intensity of the burning on different sides of the block, the direction of sawing was set in such a way that the most heavily burned area (the more damaged side) of the stem was placed on one edge of the pith-centered balk. The slightly burned area (the less damaged side) was placed on the opposite edge of the balk. The sawing direction was set for the reference blocks and the blocks that were burned entirely around the circumference to minimize knots and other defects in the final balks.
The balks were stored at room temperature (around 20 °C) for one week. The top end was trimmed with a blade saw from each balk (length of 60 cm); one cross-sectional slice was sawn to determine bark thickness, basic density, and moisture content; and two slices (thickness of 10 mm) were sawn for annual ring and chemical analyses.
The ring width was, on average, larger in the burned trees than in the reference trees, excluding the top and middle logs of Scots pine, indicating the somewhat younger age of the burned trees. The bark was generally thin in all materials, partly because of the multiple handling of logs and balk during sampling. As expected, the bark was thinner in the burned trees than in the reference trees for both species. Among the butt logs, the bark was thicker for Scots pine than for Norway spruce but thinner in the middle and top logs. A large ring width may indicate tree vitality and recovery ability after a fire. Thick bark before the fire may indicate a high protective capacity against the fire, while thin bark after the fire may indicate its large reductive and devastating effects. The variations in ring width and bark thickness in the data are described in Table 3. Before the preparation of the mechanical test specimens, the bark and outer branches were removed with a precision circular table saw from the outer faces of the remaining part of each balk (approximate length of 55 cm). Subsequently, the balks were planed on flat sides to a 60 mm thickness, and bars of 60 × 30 mm (tangential × radial) were sawn in the longitudinal direction from the outer faces (sapwood section) and the core of 10–15 annual rings from the pith (heartwood section). It was hypothesized that the effect of the fire was at its highest in the sapwood pieces, which were located immediately close to the bark. The nominal number of bars was 288.
The bars, coded with marks on the outer faces, were conditioned for 7–8 days in a weather chamber (60 °C, RH 45%). Subsequently, the bars were slightly planed on both sides. A piece of 340 mm was cut and planed from the pith side to a thickness of 20 mm. The samples were finished with a dual-blade circular saw to standard test specimens (20 × 20 × 340 mm) for determining the bending properties of clear wood (Table 4). The specimens were conditioned under standard conditions (20 °C, RH 65%) to reach a moisture content of 12% (dry weight basis). From the remaining parts of the bars, specimens for the HB test (60 × 28.5 × 90 mm) and CIE L*a*b* color analysis (30 × 20 × 60 mm) were prepared.
For the mechanical tests, the air-dry density was determined for each specimen according to ISO standard 13061-2 [34]. The MOE ( E 12 , GPa) and the static bending strength, the MOR ( σ b , 12 , MPa), were determined using a three-point bending test in the tangential direction according to standards ISO 13061-4 and ISO 13061-3, respectively [35,
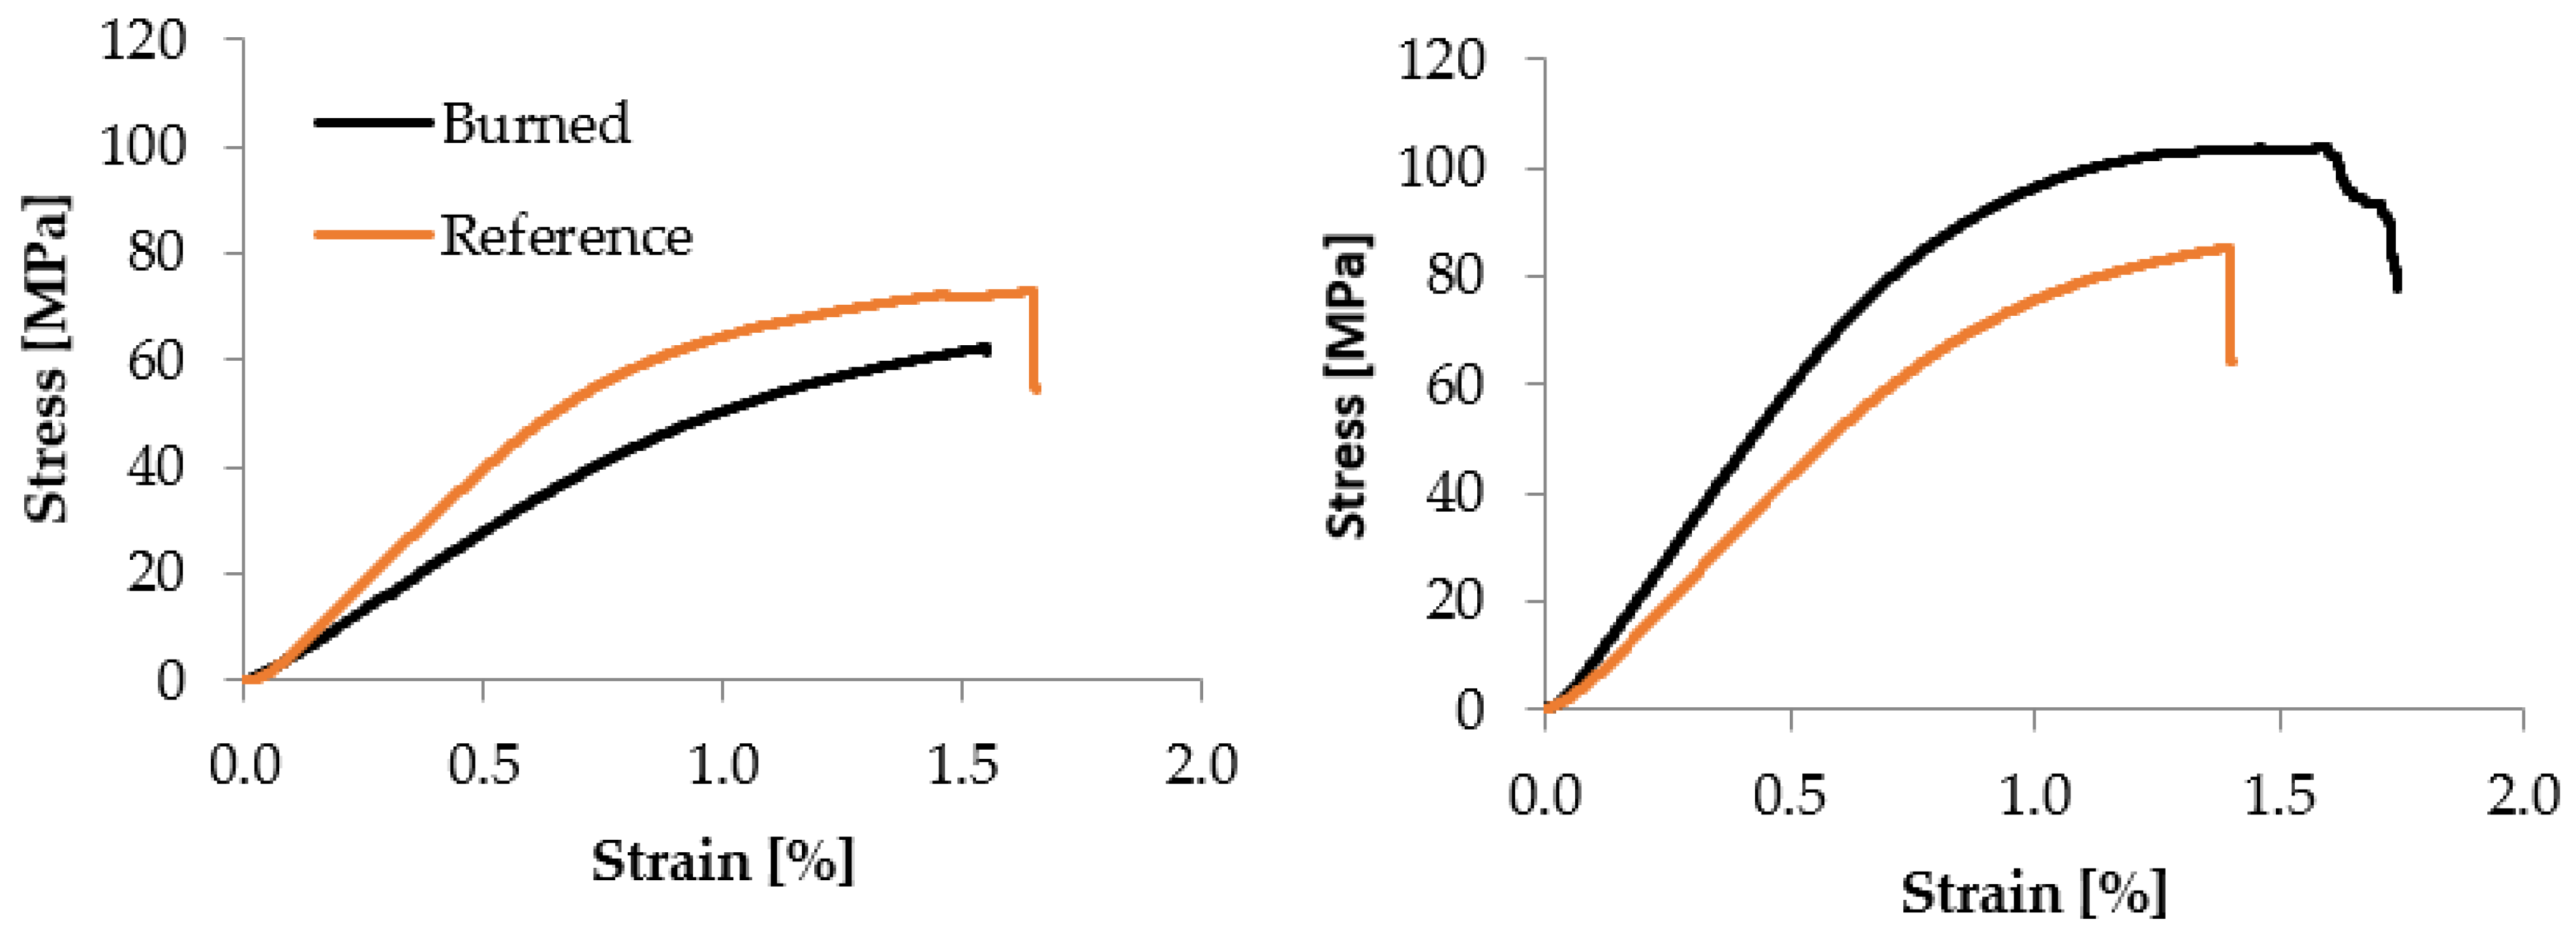
36]. Flexural stress ( σ f , MPa) and strain ( ε f , %) were calculated according to standard ISO 178 [37]:
E 12 = P l 3 4 b h 3 f
σ b , 12 = 3 P m a x l 2 b h 2
σ f = 3 P a p p l l 2 b h 2
ε f = 600 f h l 2
where P is the difference between the higher load and the lower load (N); l is the span (mm); b is the specimen width (mm); h is the specimen height (mm); f is the deflection (mm); Pmax is the maximum load (N); and Pappl is the applied load (N).
Stored energy ( U , MJ/m3) at maximum stress was calculated using the following formula:
U = 0 ε m a x σ f d ε
where ε m a x is the strain at maximum stress.
The moisture content of the samples was determined after each mechanical test and oven drying, and it was calculated on a dry weight basis, according to ISO standard 13061-1 [38]. The samples were weighed, dried at 103 °C for 24 h, and weighed dry. On average, the moisture content was 9.9% in pine samples and 10.7% in spruce samples. An approximate adjustment of the MOE and MOR to 12% moisture content was performed according to the given ISO standard.
HB was determined under air-dry conditions following standard EN 1534 [39]. A force of 1 kN was applied to a steel ball with a contact radius of 10 mm. In the test, defect-free spots from the outer edge of the sample were chosen.
H B = 2 F π D ( D D 2 d 2 )
d = 2 10 h h 2
where HB is the Brinell hardness (N/mm²); F is the maximum load force (N); D is the diameter of the ball (mm); d is the diameter of the residual indentation (mm); and h is the depth of the residual indentation (mm). The MOE, MOR, and HB were determined using the universal material testing machine Zwick Z050 (ZwickRoell GmbH, Ulm, Germany; maximum load of 50 kN).
Variations in basic density and moisture content variation, called the moisture gradient, were determined starting from the 72 battens, which were sawn in the radial direction from the cross-sectional slices (see before). The samples were stored in airproof plastic bags. From each batten, 2–4 cubes (dimensions of 20 × 20 × 20 mm) were sawn between the pith and bark, with the number of cubes depending on the diameter of the original log. The first cube was always taken immediately under the bark, and the following cubes were taken towards the pith at a distance of 20 mm each. If the log diameter did not allow for a 20 mm distance between the third and fourth cubes, the fourth cube was taken with a smaller distance from the third cube. The basic density and moisture gradient were determined from the same samples. The basic density of wood (kg/m3) was determined using the oven-dry method, according to standard ISO 13061-2 [34].
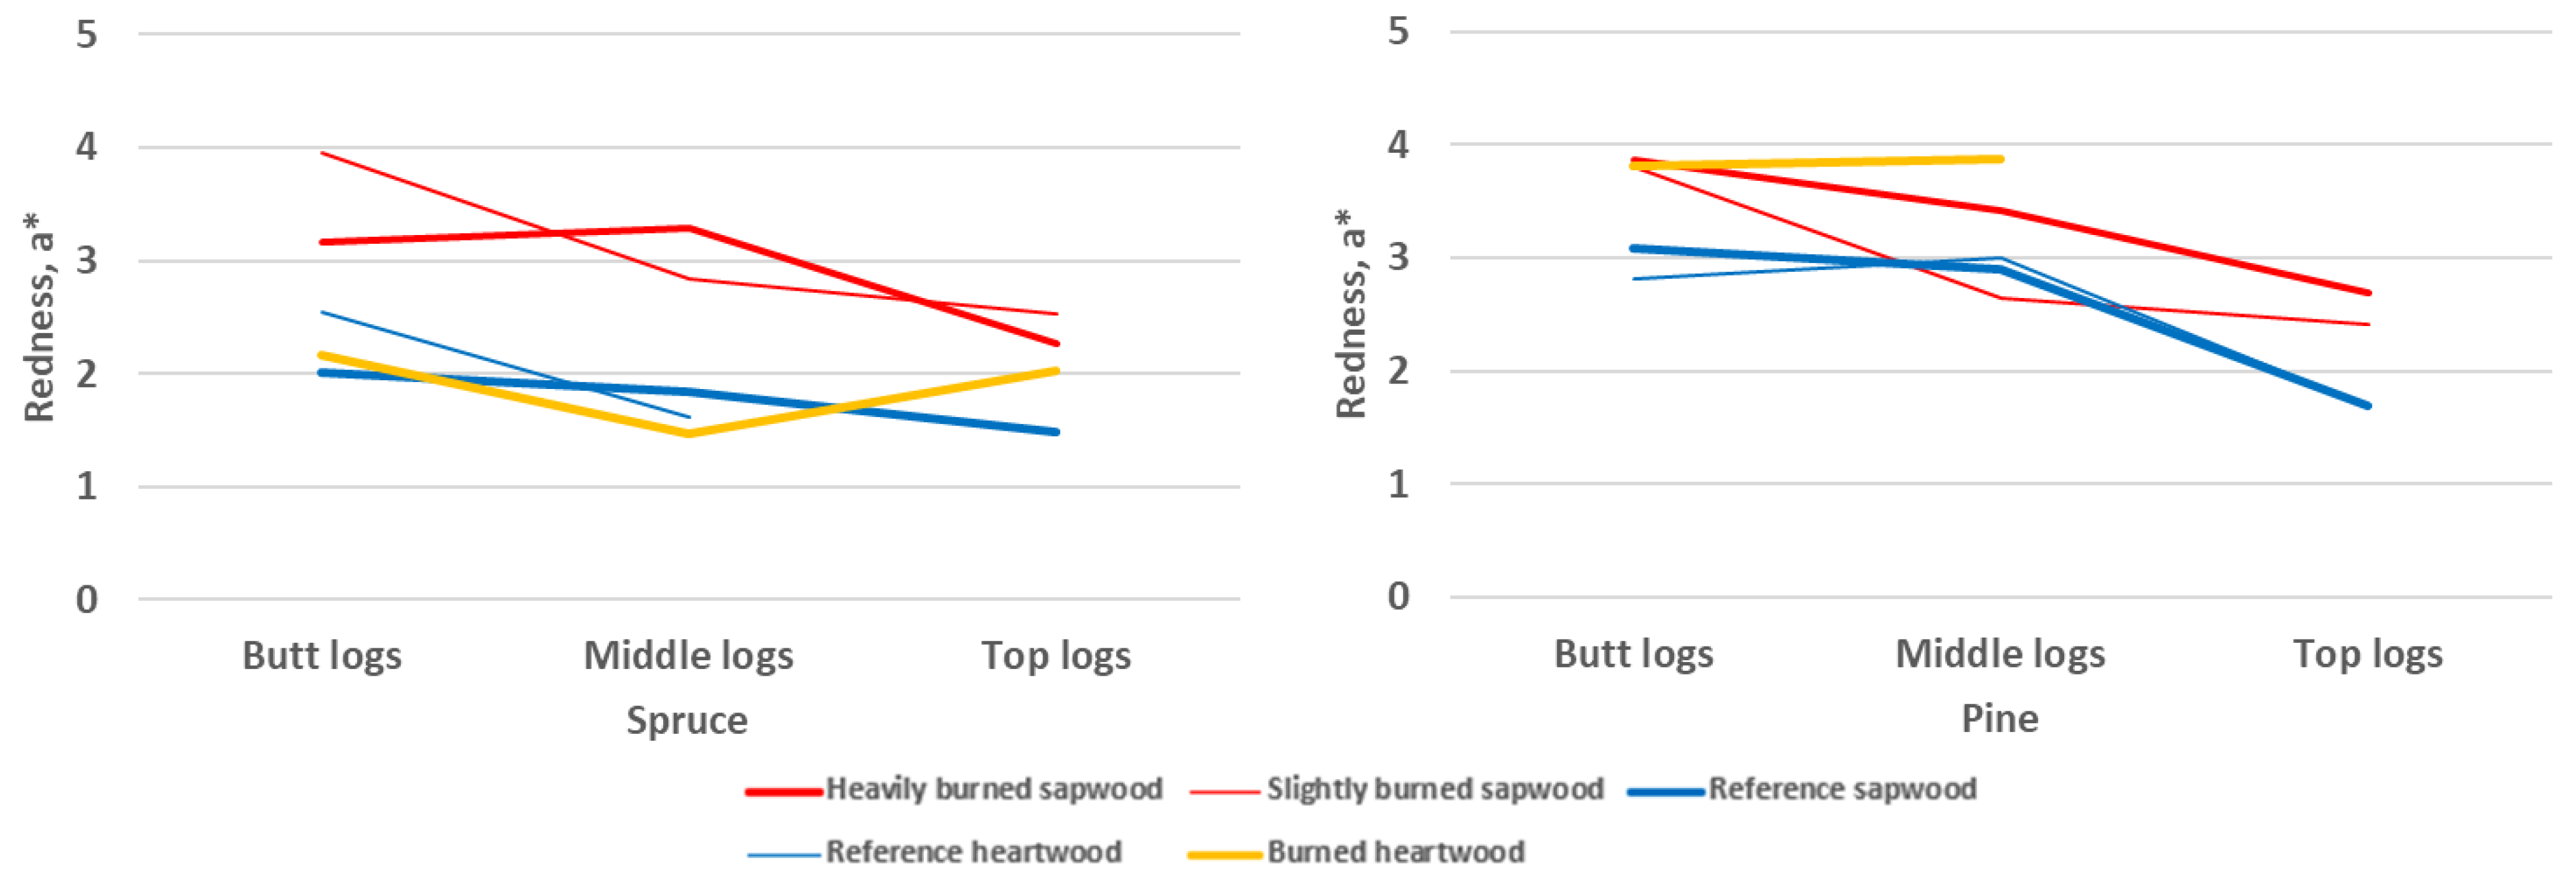
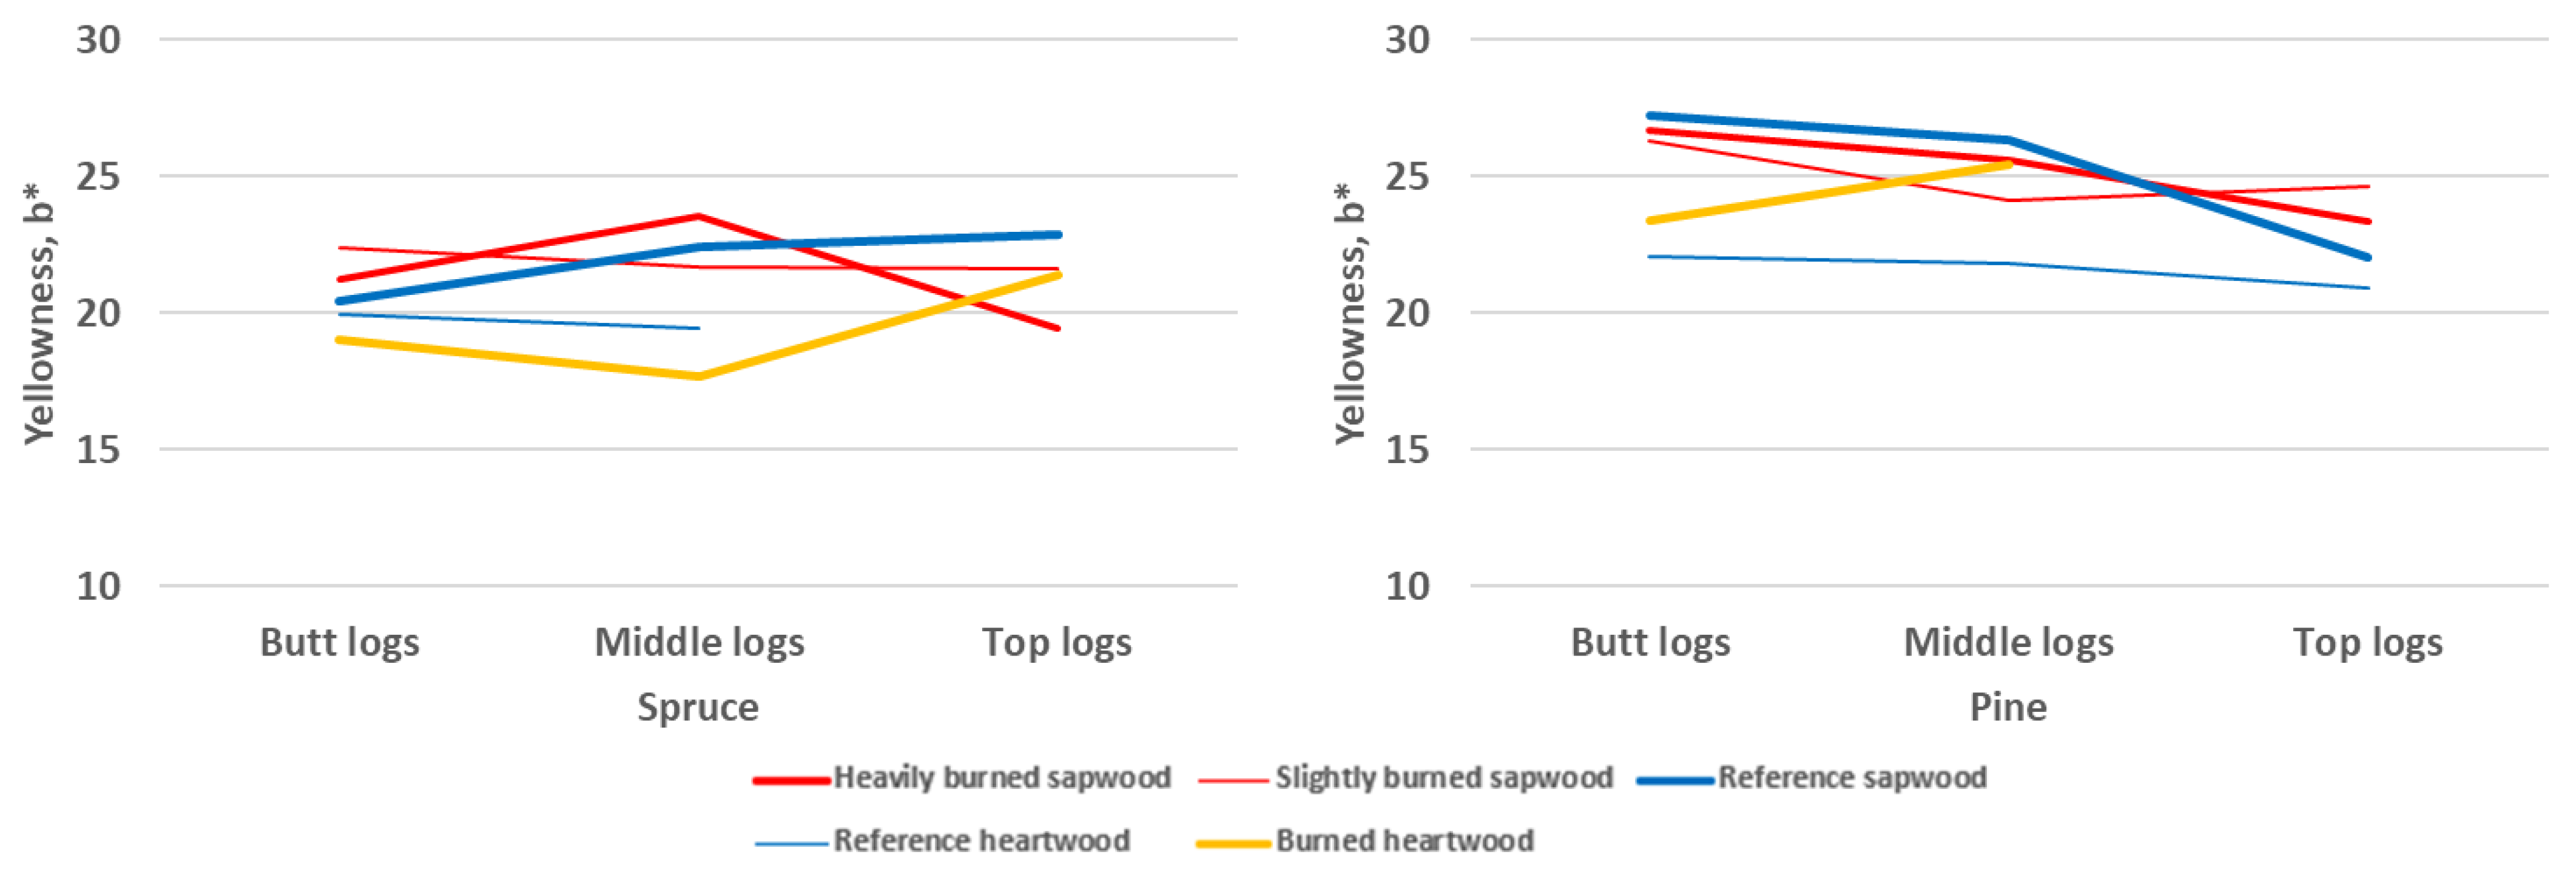
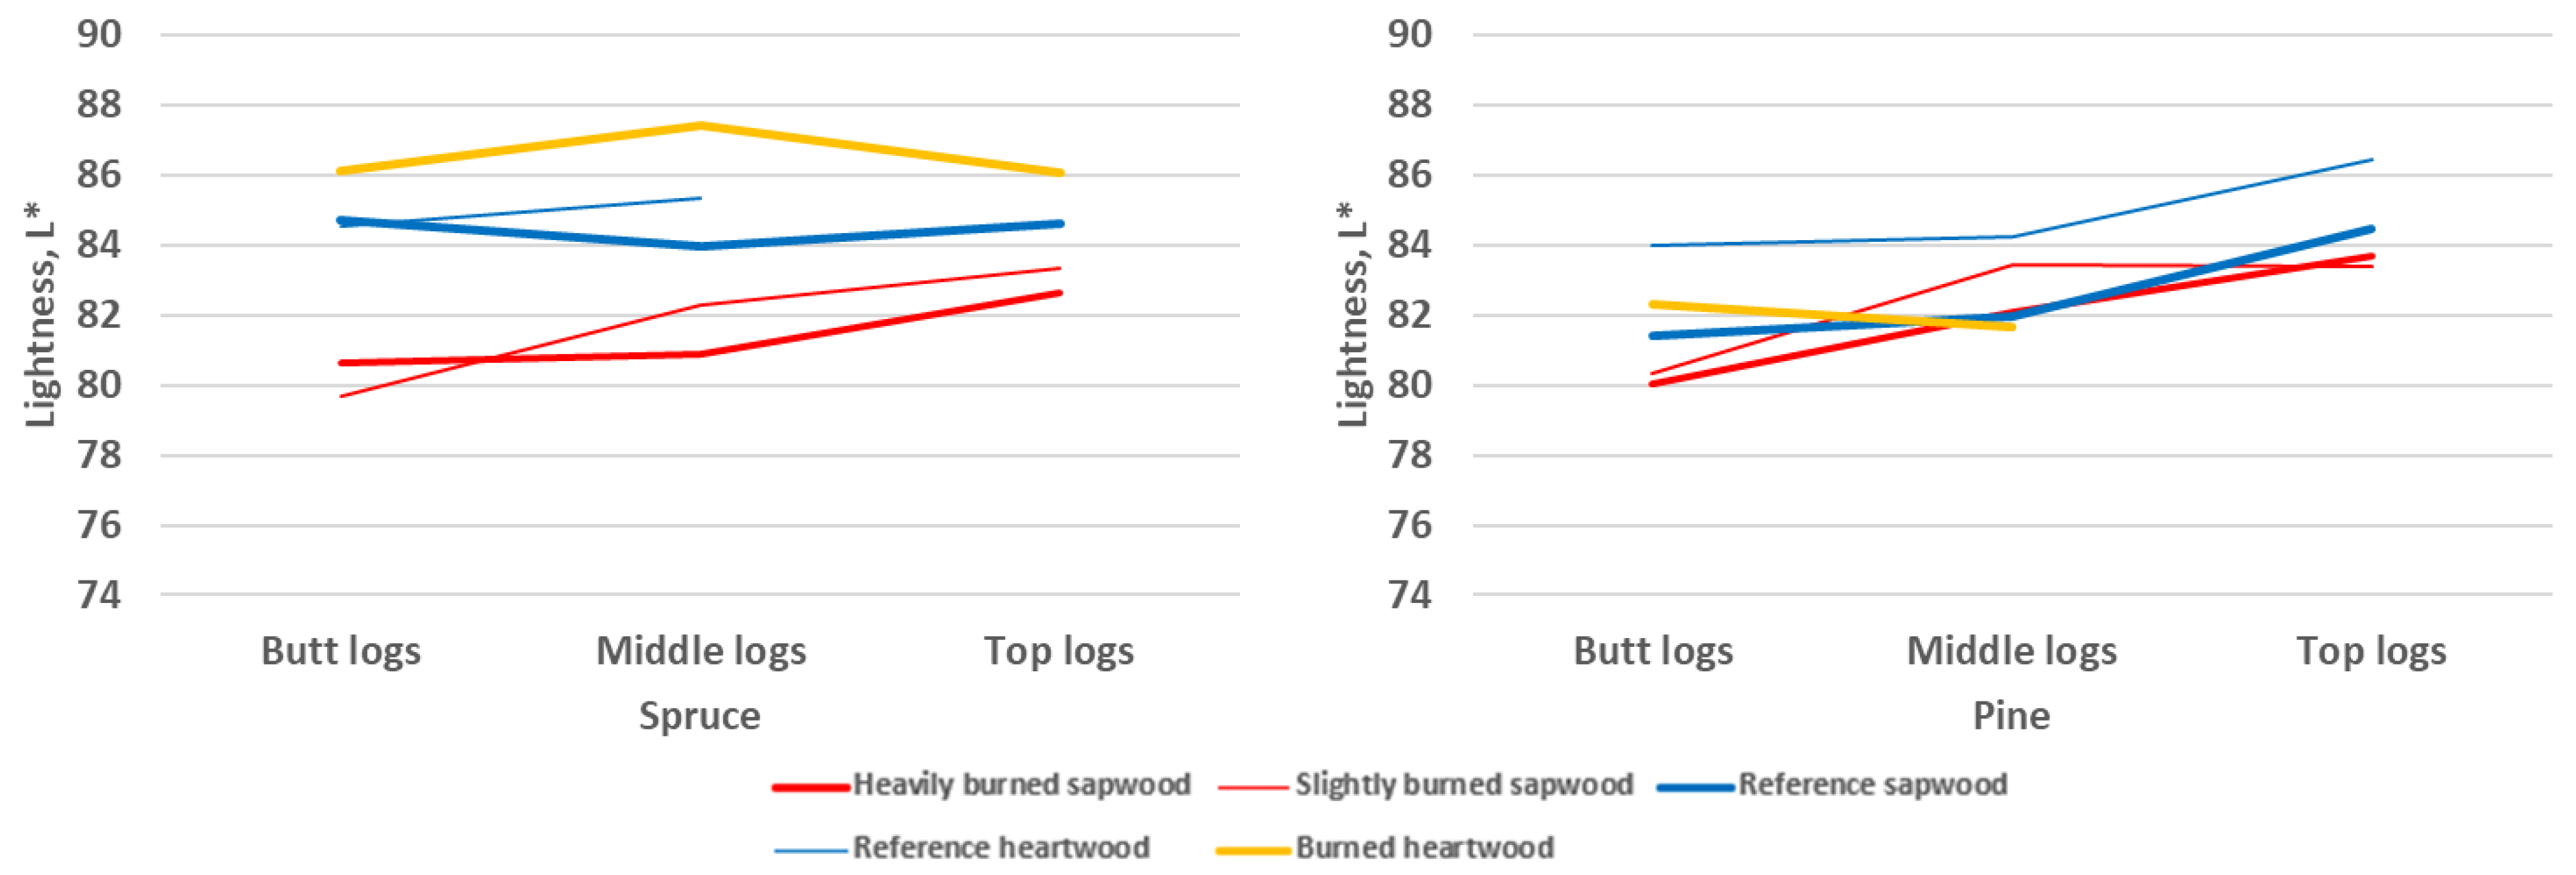
A color analysis was performed on HB specimens according to standard ISO/CIE 11664-4 [40] with a portable spectrophotometer (Konica Minolta 2600d, Osaka, Japan). In the CIELAB color space, L* indicates lightness from black to white, a* represents the red/green coordinate, and b* represents the yellow/blue coordinate. Two measurements were taken from each specimen on its outer edge. The specimens were conditioned in a weather chamber approximately 1 week before the measurements. The color difference between the reference trees and burned trees was calculated using the CIE76 color difference formula:
E a b * = ( L * ) 2 + ( a * ) 2 + ( b * ) 2  
where E a b * is the color difference, and L * , a * , and b * are the differences in the corresponding CIELAB coordinates.
Descriptive statistics of the density and mechanical properties and the Pearson correlation between them are reported. Linear mixed-effect models (LMMs) were used to determine the variability in the mechanical properties, moisture gradient, color, and effects of selected factors on them:
A i = b 0 + d m g j + h k + r + ρ a + r ρ a + u s + u t s + ε ,
M C = b 0 + d m g j + h k + r + ρ b + d m g j r + r ρ b + u s + u t s + ε ,
C m = b 0 + d m g j + h k + r + d m g j r + u s + u t s + ε ,
where A i is the modulus of elasticity (GPa), modulus of rupture (MPa), or Brinell hardness (N/mm²); M C is the moisture content (%); C m is the CIELAB color coordinate L * , a * , or b * ; b 0 is the intercept; d m g j is the fire damage class; h k is the height class; r is the dummy term of the radial position (sapwood); ρ a is the air-dry density (kg/m3); ρ b is the basic density (kg/m3); r ρ a is the interaction term of the radial position and air-dry density; d m g j r is the interaction term of the fire damage class and radial position; r ρ b is the interaction term of the radial position and basic density; u s is the random stand effect; u t s is the random tree effect; and ε is the random error term.
The LMM allows for the inclusion of dependent fixed effects (such as fire damage and radial position) and more than one source of random variation (such as tree and stand-level effect) in the model [41]. The fire damage class was included as a fixed factor in all models. The linear mixed-effects model (MIXED) procedure in IBM SPSS Statistics fits the model to the data. Normal probability distributions were tested and therefore assumed in the models. The accuracy of the predictions of the linear model was determined by calculating the proportion of explained variance (R²), bias, and root mean square error (RMSE) using only the fixed effects. The relative bias (bias, %) and relative error (RMSE, %) were calculated by dividing the bias and RMSE by the mean of the measured values.

3. Results

3.1. Mechanical Properties

3.1.1. Density

Descriptive statistics of the air-dry density are presented in Table 5. The highest density was observed in sapwood in both spruce and pine. In pine sapwood, the density in the butt logs was higher than in the middle or top logs. In spruce, the density variation between log types was small, especially in the burned trees. The highest variation was observed in the butt logs of pine, where the variation decreased in the middle and top logs. The variation in the density of spruce was smaller than that of pine, and the differences in the variation between the log types were modest. Due to the young cambial age of the top logs, heartwood samples did not occur in the burned trees or spruce reference trees. The results indicate that the spruce reference trees and burned pine trees had higher density values than the respective burned spruce trees and pine reference trees. The low density in the burned Norway spruce trees indicates rapid growth in young stands. Pine had more variation in size and age than spruce, which partly explained the higher variation in pine density.

3.1.2. Modulus of Elasticity

Descriptive statistics of the MOE are presented in Table 6. The MOE and air-dry density were strongly correlated in spruce (0.761) and pine (0.752). The differences in variation between the species and between the log types were more minor than in density. The differences in the MOE between the burned trees and reference trees in both species corresponded to the differences in density. The highest MOE was observed in the pine sapwood of the burned trees in the butt logs and the smallest in the spruce heartwood of the burned trees in the butt logs.
In the linear mixed model for the MOE, significant fixed factors differed between the species. Density was the most significant factor for both species (p < 0.01) (Table 7). Height class was very significant for spruce and significant for pine (p < 0.01). The radial position was a significant factor for pine but had no statistical significance for spruce. Fire damage class was not a significant factor for either species, although the significance was close to 0.05 in spruce. The interaction between the radial position and density was very significant for pine (p < 0.001) but did not have any significance for spruce.
The fixed coefficients of the models for the MOE are presented in Table 8. A higher density indicates a higher MOE. In both spruce and pine, the MOE was the lowest in the top logs and the highest in the middle logs. In pine, the MOE was higher in sapwood than in heartwood. The positive interaction between the radial position and density in pine indicated that density had a more substantial positive effect on the sapwood MOE than on heartwood. However, fire damage did not have any significant effect on the MOE. In spruce, the RMSE and proportion of stand-level variation (83.0%) of the total random variation were high. Most of the random variation in pine was residual (51.8%), and the RMSE was smaller.

3.1.3. Modulus of Rupture

The descriptive statistics of the MOR are presented in Table 9. The MOR had a strong correlation with air-dry density (0.720 and 0.770) and a very strong correlation with the MOE (0.919 and 0.900) in spruce and pine, respectively. Therefore, the MOR in each group mainly followed the MOE. Although the MOR in heartwood in the burned butt logs of spruce was the smallest of all groups, the relative difference from the other groups was smaller than in the case of the MOE.
No significant differences were observed in the MOR of the spruce sapwood of the butt or middle logs, but the MOR of the sapwood of the burned trees in the top logs was lower than in the reference trees (Table 10). As for the MOE, density was the most significant factor affecting the MOR of spruce and pine (p < 0.001). The radial position was a very significant factor in pine (p < 0.001) but did not have any significance in spruce. Height class was a significant factor in spruce (p < 0.05), but it did not have any significance in pine. In contrast to the MOE, fire damage class was a significant factor in pine (<0.05). The interaction between the radial position and density was a significant factor in pine (p < 0.01) but not in spruce. The RMSE values were lower in pine than in spruce. As in the case of the MOE, most of the random variation was on the stand level (69.0%) for spruce and on the residual level for pine (55.3%).
Table 11 shows the fixed coefficients of the models for the MOR. The effect of density was positive for the MOR. The sole fixed coefficient of the dummy factor of the sapwood position was negative in pine. However, because of the observed positive interaction between sapwood and density, the density indicated an increase in the MOR, and the effect of density on sapwood was larger than on heartwood. In spruce, the top logs had a lower MOR than the butt logs or middle logs. The only significant effect of fire damage was observed in pine, where the burned wood had a lower MOR than the wood from the reference trees.

3.1.4. Flexural Strain

Typical stress–strain curves in the three-point bending test are illustrated in Figure 4. The higher force values at the same deformation (deflection) in Scots pine than in Norway spruce indicated higher MOE and MOR values. The corresponding stored energy values at maximum stress for the curves presented in Figure 3 were 0.81 MJ/m3 (spruce, burned), 0.58 MJ/m3 (spruce, reference), 1.16 MJ/m3 (pine, burned), and 0.73 MJ/m3 (pine, reference).
The flexural strain at maximum force during the three-point bending test is presented in Table 12. Strain and air-dry density had a modest negative correlation in spruce (–0.266) and a negligible correlation in pine (–0.071). The highest strain values at maximum force were observed in the reference trees in pine sapwood in the top logs and the lowest in the slightly burned trees in spruce heartwood in the butt logs. In Norway spruce, strain generally decreased towards the top, but in Scots pine, the lowest values were observed in most cases in the middle logs. In the middle and top logs, the strain values were, on average, higher in pine than in spruce in all groups.

3.1.5. Brinell Hardness

Descriptive statistics of HB are presented in Table 13. HB was strongly correlated with air-dry density in spruce (0.629) and pine (0.701). The correlations of HB with the MOE and MOR were moderate in spruce (0.465 and 0.476, respectively) but higher in pine (0.678 and 0.721, respectively). This was consistent with the more significant effects of density on the MOE and MOR in pine in the linear mixed model analysis than in spruce.
Similar to other mechanical properties, density was the most significant factor for HB (Table 14). In pine, the radial position and the interaction between the radial position and density had some effects, similar to the MOE and MOR. In spruce, these factors were not significant. Instead, fire damage class proved significant (p < 0.01). The RMSE value was slightly smaller in spruce than in pine. Most of the random variation in both species was residual (74.8% for spruce and 53.6% for pine). Density had a positive effect on HB in both spruce and pine (Table 15). In spruce, the sapwood position was a positive predictor of HB. Although the estimate for the dummy term of sapwood was negative in pine, because of the positive interaction between the dummy term or sapwood position and density, the higher density indicated a higher HB in pine sapwood. Similar to the MOR, density had a higher effect on hardness in pine sapwood than in pine heartwood. It was notable that fire damage positively affected HB in spruce.

3.2. Moisture Gradient

The moisture content at different distances from the log surface is illustrated for the burned wood and the wood of the reference trees of spruce and pine by log type in Figure 5. A clear trend of decreasing moisture content from the surface to the pith was observed in all cases. The highest moisture content was observed in the surface layer of the reference trees for all log types (140–160%), and the lowest moisture content was observed in the core of the butt logs and middle logs of the burned and reference trees (30–40%). Due to the smaller diameter of the top logs, no samples were obtained there at 12–14 cm from the log surface.
Because the logs had varying thicknesses and the moisture content was expected to vary by distance from the log surface, the fixed effect of the radial position in the linear mixed models was divided into two classes. The specimen at 0–2 cm from the log surface represented the tree surface (outer sapwood), and the specimen at the farthest distance from the log surface represented the core (inner heartwood).
The fixed effects are illustrated in Table 16. In spruce, height class was highly significant for the moisture gradient (p < 0.001); other significant factors included fire damage class and the interaction between fire damage class and the radial position. In pine, the radial position and the interaction between the radial position and basic density were highly significant factors (p < 0.001), and basic density and height class were significant (p < 0.01). Most of the random variation was residual in spruce (53.5%) and pine (50.0%). The RMSE values were lower for pine than for spruce. For both spruce and pine, the moisture content was the lowest in the butt logs and the highest in the top logs (Table 17). In spruce, the burned wood had a lower moisture gradient than the wood from the reference trees because the forest fire decreased the moisture content in sapwood. The moisture content was higher in sapwood than in heartwood in pine and spruce. In pine, the fixed coefficient for basic density was positive, but due to the interaction between the radial position and basic density, the higher the basic density, the lower the moisture content in sapwood.

3.3. Wood Color

The CIE L*a*b* color values differed between the burned and reference spruce sapwood at all tree heights. In pine sapwood, the difference in color between the burned and reference trees was evident in the butt logs but smaller in the middle and top logs. The L*, a*, and b* values are presented in Figure 6, Figure 7, and Figure 8, respectively.
The fixed effects for the CIE L*, a*, and b* coordinates are presented separately for spruce wood in Table 18. The radial position was highly significant (p < 0.001) regarding all color coordinates. Height class was significant for the L* and a* coordinates (p < 0.05). The interaction between fire damage class and the radial position was very significant (p < 0.001) for the L* coordinate and significant (p < 0.05) for the a* coordinate. Most of the random variation was residual for all color coordinates (59.3–62.1%). The RMSE value was at its lowest, and the R² value was the highest for the L* coordinate. The fixed coefficients of the models for the color coordinates of spruce wood are presented in Table 19. Sapwood was darker and closer to green and yellow than heartwood, possibly because of the higher content of darker latewood in sapwood than in heartwood. Sapwood in the butt logs and middle logs was also darker than in the top logs. In the top logs, the a* coordinate was closer to green than in the butt and middle logs. Due to the fire damage class and radial position interaction, sapwood was darker and closer to green in the burned trees. This was explained by the most substantial effects of forest fires on the outer layer of the wood.
The fixed effects for the CIE L*, a*, and b* coordinates are presented separately for pine wood in Table 20. Similar to spruce, height class was highly significant (p < 0.001) for all color coordinates. The radial position was very significant (p < 0.001) for the L* and b* coordinates, but not for the a* coordinate, albeit the naturally red-brown color of pine heartwood. The fire damage class was significant for the a* coordinate. The fixed coefficients of the models for the color coordinates are presented in Table 21. As for pine, most of the random variation was residual, primarily for all color coordinates (61.0–32.4%). The R² values were, in general, lower than in spruce. Due to the apparent color difference between earlywood and latewood, the variation in the share of earlywood and latewood in the measurement spots probably explains most of the color variation. All R² values were relatively low.
The color differences between the wood from the burned trees and reference trees is presented in Table 22 as ΔE*ab values. The values were calculated based on the L, a*, and b* estimates in Table 19 and Table 21. In the sapwood layer, a noticeable color difference was observed on the more damaged and less damaged sides compared with the wood from the reference trees in Norway spruce and Scots pine. In heartwood, the color change was less perceptible, especially in Norway spruce and on the less damaged side. However, due to the relatively high standard error in the estimated L, a*, and b*, caution is needed when interpreting single ΔE*ab values.

4. Discussion

Due to the global increase in forest fires during the 2000s, the direct and indirect damage that deteriorates raw wood materials has become more frequent in tree stock, resulting in challenges in the allocation of salvaged wood to the roundwood market and profitable utilization in forest industries [3,16,24]. The risk increase is not only commonly traced to climate change, regional droughts, and heat loads but also to human behavior and working with machines in nature and the built environment [5,6,7,8,9,10].
The data from this study represent a typical forest fire in Finland in terms of vastness, intensity, and season. According to our visual observations in the studied stands, the mortality of trees and fire patterns were consistent with previous findings in practical forestry. Based on the crown’s status, most spruces were judged as dead or dying, whereas almost all pines remained living. The vertical length of the fire effect, starting from the base of the tree, was relatively short, with values of 9% for spruce and 12% for pine when the bark was required to have burned for the entire circumference, but the values were as high as 39% for spruce and 20% for pine when any signs of the fire effect were considered on bark. In a study on two forest stands in northern Europe, 20% of Scots pine trees survived in a heavy forest fire, with the proportion reaching 50% for trees with a DBH of 20 cm or more if the fire remained at a low height and below the living crown, whereas 99% of Norway spruce trees and 98% of broadleaved trees died [42].
Our results show that fire damage had only minor or no significant effects on the wood properties studied, evident only in sapwood. The changes in wood properties were more substantial in spruce than in pine, presumably because of the thinner bark, especially in the lower parts of the trees, that protects wood less from deterioration, and the longer crown that accelerates the spread of fire in the middle and top parts of trees [12,15,23,42].
In the mechanical tests, the physical properties and position of a tree explained most of the variation in wood properties. As expected, wood density proved to be the strongest predictor by far, followed by height location and the radial position. The fire damage class of trees at respective heights was identified as a significant factor only for the MOR in Scots pine (decrease) and for HB in Norway spruce (increase). In general, the models obtained were more accurate in predicting the mechanical properties of Scots pine. In Norway spruce, the bias and variation by random effects were relatively high, and the R2 values were relatively low. This indicates that only some of the essential factors in modeling the bending properties of spruce are recognized. In flexural strain at maximum force, no clear differences were detected between the burned and the reference trees. In spruce logs, flexural strain decreased towards the top, but in pine, the lowest values were observed in the middle logs.
In studies on Brazilian loblolly pine and Portuguese maritime pine, where the forest fire intensities were heavier than in our study, more substantial effects on wood properties were observed. The consumption of the full crown of loblolly pine by fire led to a decrease in the MOE and MOR in static bending by 17% and 12%, respectively, in addition to decreases in ultimate stress and stress at the proportional limit in parallel compression by 19% and 34% and the resilience coefficient for toughness by 17% [20]. Similar reductions in these properties have been observed for maritime pine, albeit associated with reductions in biological degradation because of harvest 5–7 months after the fire [21]. The effect of the biological and chemical degradation of wood translates into changes in viscoelastic behavior [43].
Clear positive correlations between density and mechanical properties were noted in our study, as in numerous previous studies [44,45]. In sapwood (mature wood), the mechanical properties were also higher than in heartwood (juvenile wood), particularly in pine. Structural differences between the mature wood and juvenile wood of softwoods have been reported in several compilation works [45,46,47].
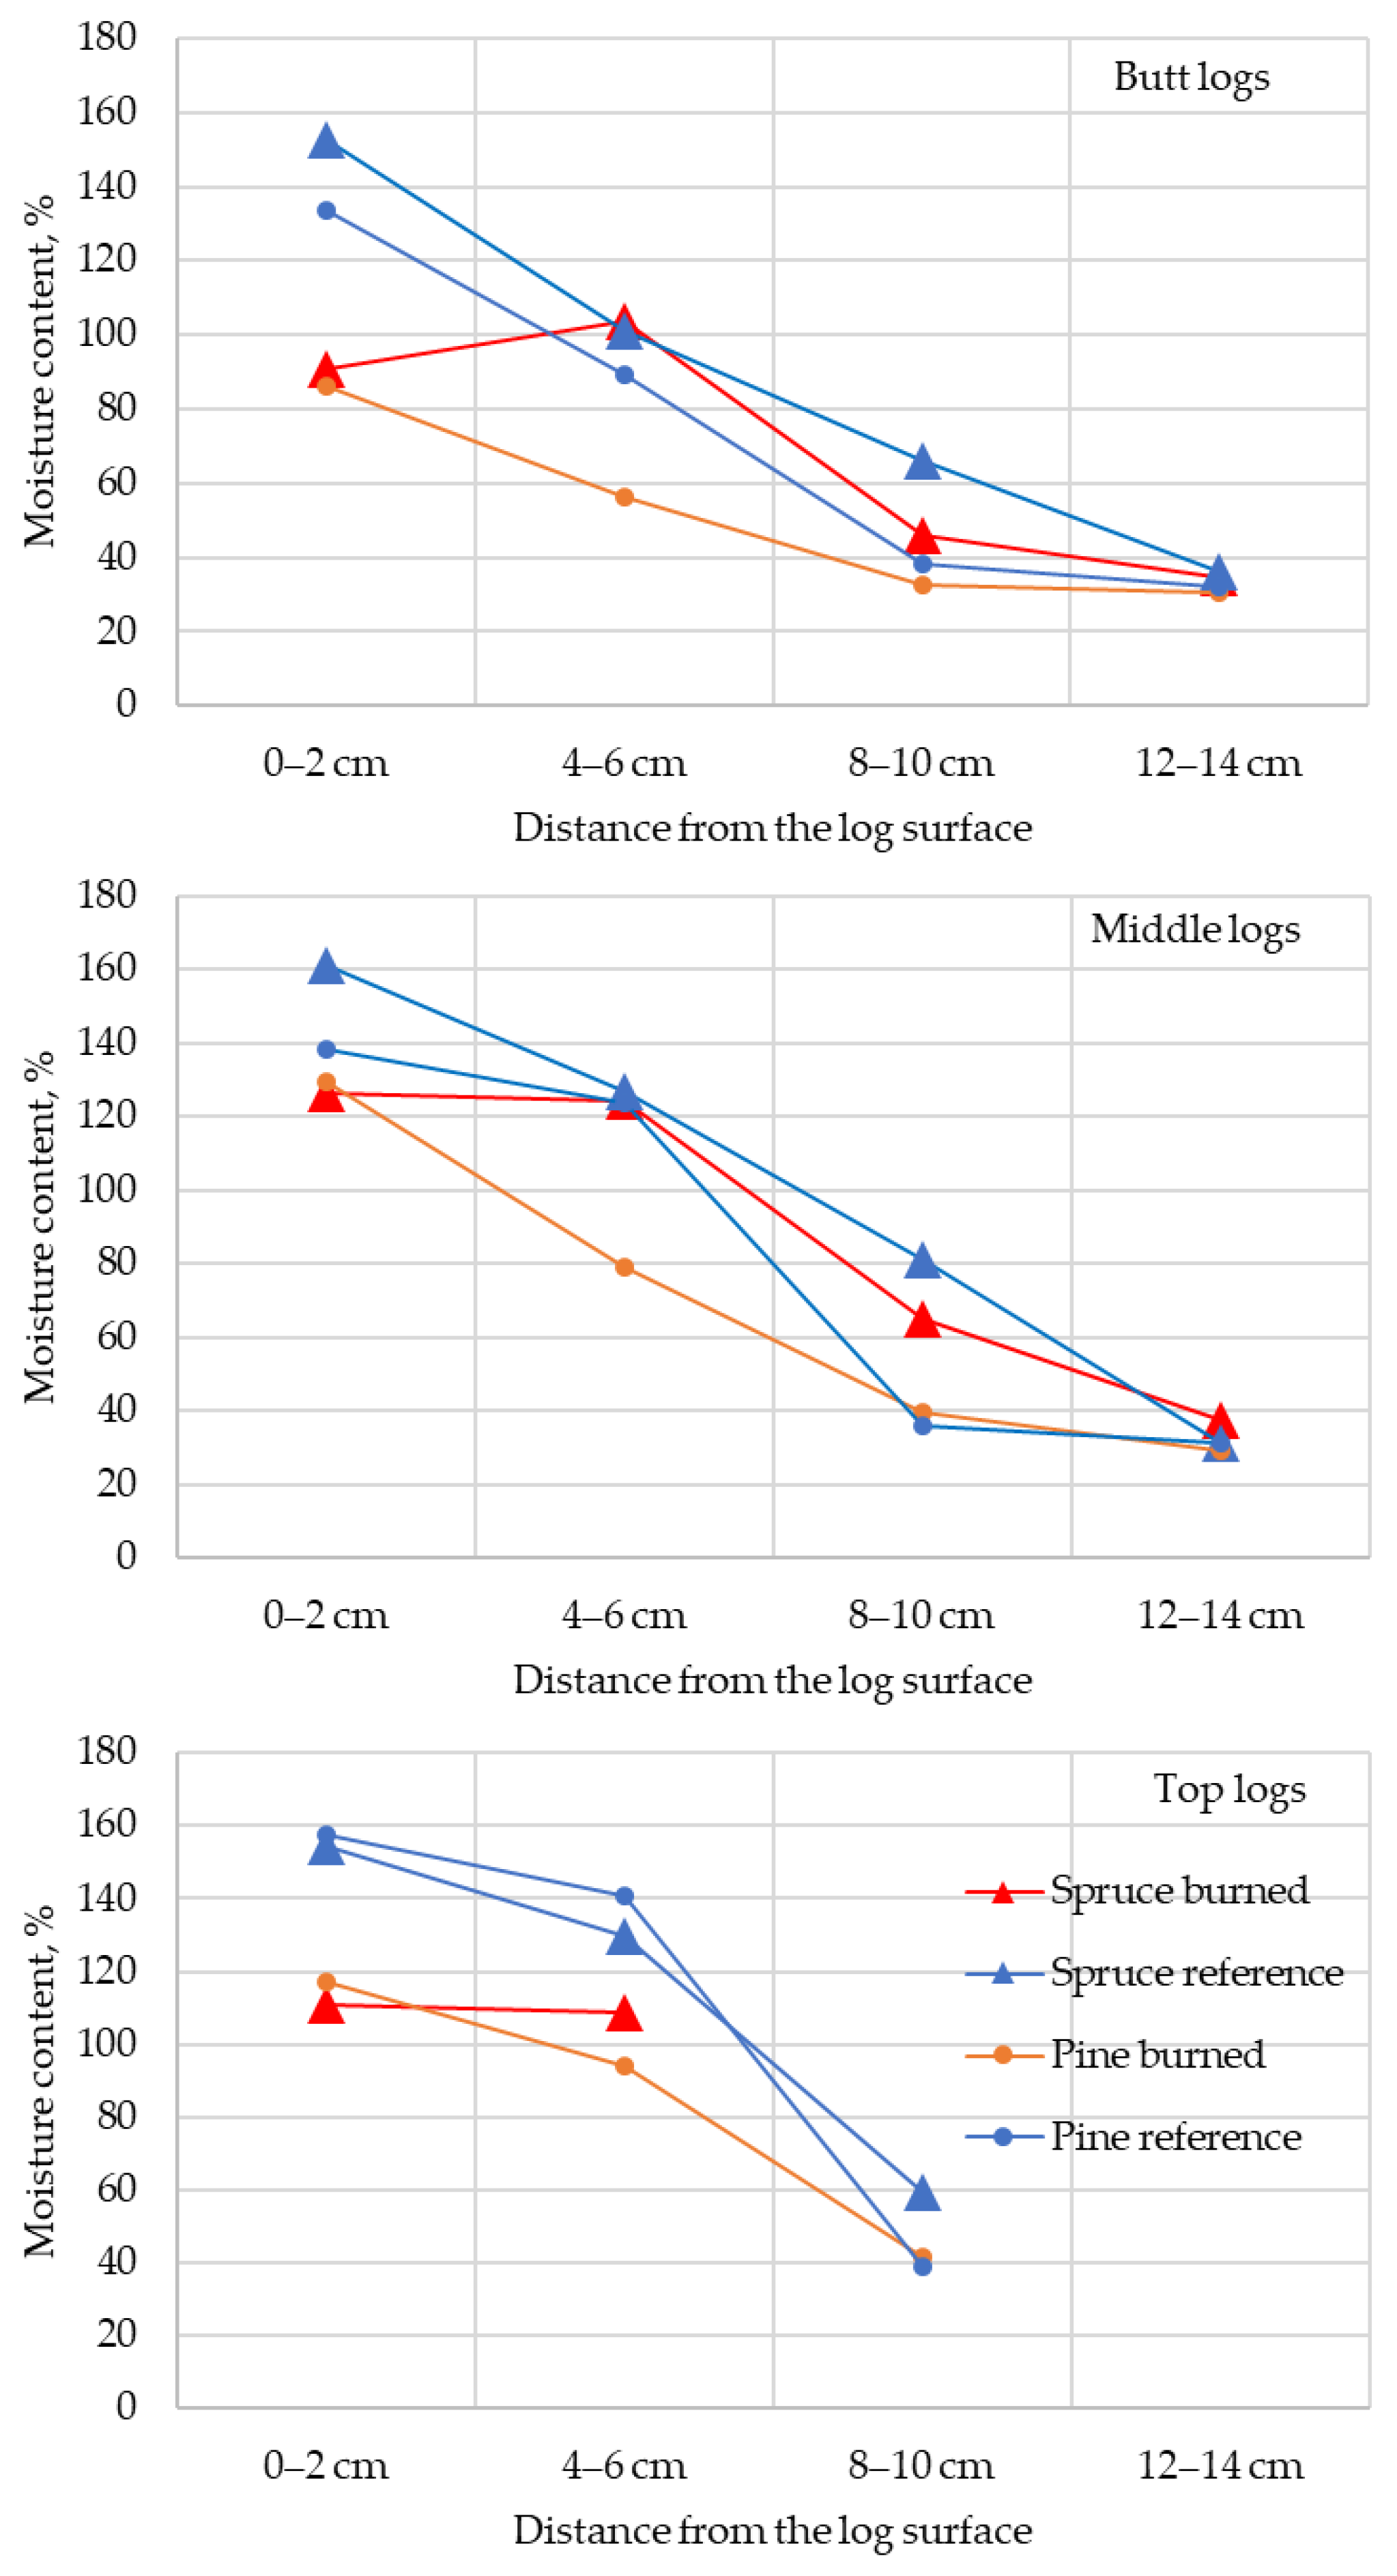
Forest fire caused a decrease in the moisture content in spruce sapwood due to its thin bark and partly dead wood (high mortality of trees). The moisture gradient between sapwood and heartwood after the fire was larger in pine wood than in spruce. The radial position and basic density had significant effects on the moisture content. Density and the moisture content were partially negatively correlated for pine but not for spruce. In both species, the moisture content decreased from the butt to the top. When modeling the moisture content, the RMSE values were relatively high in both species, and the model’s explanatory power was higher in Scots pine. The slight difference in harvesting time may have influenced the moisture content difference between the burned trees and reference trees, with the former being harvested in November and the latter in February (except for small-log spruce trees). In Northern Europe, the moisture content of spruce and pine is the highest in the middle of winter and usually 2–4% lower in November than in February [48,49].
In Norway spruce and Scots pine sapwood, a perceptible color difference due to the fire was observed. In heartwood, the ΔE values indicated slight changes in color but were mostly below the perceptibility level of ΔE*ab = 2 for wooden surfaces [50]. The wood color was the darkest in the burned Norway spruce wood of all studied wood materials.
Changes in wood color might indicate some chemical changes in the wood at high temperatures during the forest fire or some staining due to soot and char. The increase in the relative proportion of darker latewood with an increased cambial age explains the difference between heartwood and sapwood. In Scots pine, the color difference due to heartwood formation is naturally visible between sapwood and heartwood. A sharp boundary between heartwood and sapwood occurs naturally in Scots pine, while in Norway spruce, yellowish heartwood is not clearly distinguished from sapwood [51,52]. The differences in color parameters between heartwood and sapwood can mainly be explained by their different chemical compositions. The color of Scots pine heartwood is usually brown with a hue of red. The color of sapwood, especially earlywood, is typically very light, with a hue of yellow in both species. In addition, the proportion of darker latewood is higher in heartwood than in earlywood.
It is well known that the temperature level and burning time of the exposed area during a fire are critical factors for changes in the physico-mechanical and chemical properties of wood [12,23]. We had no information available on the thermal circumstances during the forest fire, but we assumed that the temperature elevation stayed lower than in the prescribed burning. The following temperatures were measured in experiments in the forest: 400–500 °C at ground level, 220 °C at the 3 m level, 150 °C at the 6 m level, and 45 °C at the 9 m level [15].
In a forest fire, bark provides protective support for wood, slowing or inhibiting the rise in temperature and the chemical and physical alteration of wood. Accordingly, in the loblolly pine study in Brazil, only the most severe burning level, where the flames consumed the total crown, had any effect on the chemical composition of the wood, decreasing the content of cold water-soluble extracts (tannins, gums, sugars, pigments, or colorants) due to the movement of water within the wood tissue [20]. Similarly, no chemical effects of fire on wood were observed in an Aleppo pine study conducted in Turkey [53].
The mortality rate of the burned trees and the high deterioration rate of fire-affected wood were evident for Norway spruce but less severe for Scots pine. Similar to North American softwoods [16], rapid wood procurement after a fire is essential to prevent excessive drying and further biological–physical degradation of the material. In Finland, the Forest Damage Prevention Act effectively prevents the advancement of secondary defects to a harmful degree in salvaged wood [32].
The partial suitability of burned wood has also been found for wood panel applications. Jack pine wood in Wisconsin, USA, had a similar engineering performance for oriented strand board (OSB) at four fire damage levels and met the standard mechanical properties when all char was removed from the flakes [27]. In a parallel study on red pine wood from fire-killed, fire-affected, and virgin trees, the addition of 20% charred bark among flakes reduced bending strength, still providing OSB mechanical properties meeting the standard requirements for all fire levels, but bark addition of up to 20% improved the stability of the boards. Scots pine fiber material from burned wood was tested as a mixture of virgin beech and oak to manufacture a medium-density fiberboard (MDF) in Turkey. All test panels met the mechanical properties of general-purpose MDF panels, but surface roughness remained higher and dimensional stability remained weaker than control panels from unburned beech and oak [28].

5. Conclusions

This study, based on wood materials from a forest fire area and a neighboring forest area in Western Finland, showed fire-induced changes in the physical and mechanical properties of the sapwood of Norway spruce and Scots pine in Northern Europe. The changes in the properties were more substantial in spruce than in pine, presumably because the thinner bark, especially in the lower parts of trees, protects wood less from deterioration, and the longer crown accelerates the spread of fire in the middle and top parts of trees.
In spruce, the moisture content decreased, and the color darkened compared to the reference trees. In pine, color changes were observed. Spruce wood underwent greater changes, probably due to the thinner bark and the longer crown being more susceptible to fire. The changes in mechanical properties were mostly unessential. In spruce, a slight increase in HB was observed, and in pine, a slight decrease in bending strength was observed.
Due to the minor deterioration, and from a mechanical point of view, fresh wood salvaged from forest fire areas, especially Scots pine but also Norway spruce, is a potential raw material for middle-quality and low-quality sawn timber and selected end-uses where the requirements for quality are moderate and aesthetic or hygienic criteria are not critical, including the following: varieties of construction, non-food packaging and pallets, and other less sensitive uses of wood. However, most physico-mechanical properties of virgin wood change only a little in a forest fire, especially in spruce char and soot, making use difficult in many product applications and manufacturing processes. Sapwood is prone to excessive drying, which may initiate checking in wood after being sawn, sliced, or rotary cut but reduces the need for drying wood products. We recommend further studies on the following to create and develop the use of wood from forest fire areas: (1) chemical composition and surface activity of burned wood, (2) performance and usability in different types of production and products (mechanical, chemical, and hybrid), (3) potential for diversified biorefining processes and chemical treatments, and (4) technical procedures to remove or reduce char and soot in wood material before processing.

Author Contributions

Conceptualization, V.M., A.H., P.K. and E.V.; Data curation, V.M., P.Y. and E.V.; Formal analysis, J.M., V.M., P.Y. and E.V.; Funding acquisition, J.M. and V.M.; Methodology, J.M., V.M. and E.V.; Project administration, J.M., P.K. and E.V.; Software, J.M. and V.M.; Supervision, V.M., A.H. and E.V.; Validation, J.M., V.M., A.H. and E.V.; Writing—original draft, J.M., V.M., P.Y. and E.V.; Writing—review and editing, J.M., V.M. and E.V. All authors have read and agreed to the published version of the manuscript.

Funding

This research was mainly funded by Puumiesten Ammattikasvatussäätiö (The Foundation for Finnish Wood Professionals’ Education), project Wood properties and product potential of forest fire damaged timber in wood product uses, project no. 41007-00246600. Additional funding was provided for working hours by Luke’s strategic project PosFibes, project no. 41007-00212300, and as a grant for the M.Sc. thesis of Pekka Ylimäki by Pyhäjoen Puu Oy, a wood product company located near the forest fire area in Pyhäjoki, Northern Ostrobothnia.

Institutional Review Board Statement

Not applicable.

Informed Consent Statement

Not applicable.

Data Availability Statement

Data are available on request from the corresponding author.

Acknowledgments

The authors want to thank the Natural Resources Institute Finland Luke technical staff in the Joensuu Research Unit for their contribution to preparing and trimming the wood laboratory samples. Päiviö Nikki, the owner of Pyhäjoen Puu Oy, participated in the preliminary discussion on the research problem and provided the site for the pre-processing of sample blocks and wood discs. The Forestry Association Pyhä-Kala from Kalajoki assisted in selecting the study stands. Two local forest entrepreneurs from Kalajoki and Raahe cut the sample trees and transported the logs to the pre-processing site. Luke Joensuu Research Unit and UEF, Department of Environmental and Biological Sciences (Joensuu), provided the laboratory infrastructure and methods for the project.

Conflicts of Interest

The authors declare no conflicts of interest.

References

  1. ESA Climate Office. Multi-Decade Global Fire Dataset Set to Support Trend Analysis. The European Space Agency, 28 January 2021. Available online: https://climate.esa.int/de/news-events/multi-decade-global-fire-dataset-set-support-trend-analysis/ (accessed on 25 September 2023).
  2. Burgueño Salas, E. Global Forest Cover Loss by Wildfires 2001–2022. Statista 2023. Available online: https://www.statista.com/statistics/1401539/forest-loss-by-wildfires/ (accessed on 25 September 2023).
  3. Camia, A.; Durrant, T.; San-Miguel-Ayanz, J. The European Fire Database: Technical Specifications and Data Submission; EUR—Scientific and Technical Research series; Publications Office of the European Union: Luxembourg, 2014. [Google Scholar] [CrossRef]
  4. San-Miguel-Ayanz, J.; Durrant, T.; Boca, R.; Maianti, P.; Liberta, G.; Artes Vivancos, T.; Jacome Felix Oom, D.; Branco, A.; De Rigo, D.; Ferrari, D.; et al. Forest Fires in Europe, Middle East and North Africa 2021; EUR—Scientific and Technical Research Series; Publications Office of the European Union: Luxembourg, 2022. [Google Scholar] [CrossRef]
  5. Flannigan, M.D.; Amiro, B.B.; Logan, K.A.; Stocks, B.J.; Wotton, B.M. Forest Fires and Climate Change in the 21st Century. Mitig. Adapt. Strateg. Glob. Chang. 2005, 11, 847–859. [Google Scholar] [CrossRef]
  6. Roshani, S.H.; Kumar, P.; Masroor, M.; Rahaman, M.H.; Rehman, S.; Ahmed, R.; Sahana, M. Forest Vulnerability to Climate Change: A Review for Future Research Framework. Forests 2022, 13, 917. [Google Scholar] [CrossRef]
  7. Dupuy, J.; Fargeon, H.; Martin-St. Paul, N.; Pimont, F.; Ruffault, J.; Guijjaro, M.; Madrigal, H.J.; Fernandes, P. Climate change on future wildfire danger and activity in southern Europe: A review. Ann. For. Sci. 2020, 77, 35. [Google Scholar] [CrossRef]
  8. De Rigo, D.; Libertà, G.; Houston Durrant, T.; Artés Vivancos, T.; San-Miguel-Ayanz, J. Forest Fire Danger Extremes in Europe under Climate Change: Variability and Uncertainty; JRC Technical Reports; Publication Office of the European Union: Luxembourg, 2017; Available online: https://data.europa.eu/doi/10.2760/13180 (accessed on 13 December 2023).
  9. Tang, Y.; Zhong, S.Y.; Luo, L.F.; Bian, X.D.; Heilman, W.E.; Winkler, J. The potential impact of regional climate change on fire weather in the United States. Ann. Am. Assoc. Geogr. 2015, 105, 1–21. [Google Scholar] [CrossRef]
  10. DiVirgilio, G.; Evans, J.P.; Blake, S.A.P.; Armstrong, M.; Dowdy, A.J.; Sharples, J.; McRae, R. Climate change increases the potential of extreme wildfires. Geophys. Res. Lett. 2019, 46, 8517–8526. [Google Scholar] [CrossRef]
  11. Natural Resources Institute Finland. Suomen Metsätilastot 2021—Finnish Forest Statistics 2021: Helsinki. 2022. Available online: https://stat.luke.fi/sites/default/files/suomen_metsatilastot_2021_verkko.pdf (accessed on 18 September 2023).
  12. Wallenius, T. Major decline in fires in coniferous forests—reconstructing the phenomenon and seeking for the cause. Silva Fenn. 2011, 45, 36. [Google Scholar] [CrossRef]
  13. Kilpeläinen, A.; Kellomäki, S.; Strandman, H.; Venäläinen, A. Climate change impacts on forest fire potential in boreal conditions in Finland. Clim. Chang. 2010, 103, 383–398. [Google Scholar] [CrossRef]
  14. Budi, A.S. Effects of Forest Fire on Wood: A Biological (Anatomical Study). In Rehabilitation of Degraded Tropical Forest Ecosystems: Workshop Proceedings; Kobayashi, S., Turnbull, J.W., Toma, T., Mori, T., Majid, M.N.M.A., Eds.; Center for International Forest Research (CIFOR): Bogor, Indonesia, 2001; pp. 57–68. [Google Scholar]
  15. Karjalainen, J. Tuli Pohjoisissa Havumetsissä ja Metsänhoidollinen Kulotus [Fire in Northern Coniferous Forests and Silvicultural Burning]; Tiedote 5/94; Metsähallitus, kehittämisyksikkö: Rovaniemi, Finland, 1994; Available online: https://julkaisut.metsa.fi/assets/pdf/mt/tuli_pohjoisissa_havumetsissa.pdf (accessed on 12 January 2022).
  16. Barkley, Y. Salvage Logging after a Wildfire; Forestry Extension Series, Fire 11; Station Bulletin No. 96. University of Idaho Extension, Idaho Forestry Wildlife and Range Experiment Station: Moscow, ID, USA, 2020. Available online: https://www.uidaho.edu/search?q=Salvage%20Logging%20after%20a%20Wildfire (accessed on 12 January 2023).
  17. Hill, C.A.S. Wood Modification: Chemical, Thermal and Other Processes; Wiley Series in Renewable Resources; Wiley: Hoboken, NJ, USA, 2006. [Google Scholar] [CrossRef]
  18. Fengel, D.; Wegener, G. Wood: Chemistry, Ultrastructure, Reactions; Walter de Gruyter: Berlin, Germany; New York, NY, USA, 1984. [Google Scholar] [CrossRef]
  19. Piernik, M.; Woz’niak, M.; Pinkowski, G.; Szentner, K.; Ratajczak, I.; Krauss, A. Impact of the Heat Treatment Duration on Colour and Selected Mechanical and Chemical Properties of Scots Pine Wood. Materials 2022, 15, 5425. [Google Scholar] [CrossRef]
  20. Bortoletto Júnior, G.; Moreschi, J.C. Physical-mechanical properties and chemical composition of Pinus taeda mature wood following a forest fire. Bioresources 2003, 87, 231–238. [Google Scholar] [CrossRef]
  21. Carvalho, A. Madeiras ‘‘Salvadas’’ de Fogos Florestais [Woods Saved from Forest Fires]; Departamento de Tecnologia dos Produtos Florestais, Estac~ao Nacional de Tecnologia dos Produtos Agrarios/INIA: Alcobaca, Portugal, 1986. [Google Scholar]
  22. Zziwa, A.; Mukasa, J.; Kizito, S. Structural suitability of 10-year old Pinus caribaea timber with a forest fire history in farm buildings. AgricEngInt CIGR J. 2020, 22, 49–58. [Google Scholar]
  23. Lowell, E.C.; Cahill, J.M. Deterioration of Fire Killed Timber in Southern Oregon and Northern California. West. J. Appl. For. 1996, 11, 125–131. [Google Scholar] [CrossRef]
  24. Cole, R. Selling Burned Timber. Los Angeles Times. 24 August 2014. Available online: https://northwestmanagement.com/selling-burned-timber/ (accessed on 16 November 2022).
  25. Reader, T. After the Fire: Finding Value in Burned Timber 2-3-2. Colorado State University, Center for Collaborative Conservation. 2018. Available online: https://collaborativeconservation.org/2019/02/12/after-the-fire-finding-value-in-burned-timber-within-the-2-3-2/ (accessed on 12 January 2023).
  26. West Fraser. Salvaging Wood Products from Charred Trees. 2022. Available online: https://www.westfraser.com/responsibility/stories-responsibility/salvaging-wood-products-charred-trees (accessed on 14 December 2022).
  27. Moya, L.M.; Winandy, J.E.; Tze, W.T.Y.; Ramaswamy, S. Use of fire-impacted trees for oriented strand board. For. Prod. J. 2008, 58, 45–52. [Google Scholar]
  28. Akgül, M.; Ayrilmis, N.; Camlibel, O.; Korkut, S. Potential utilization of burned wood in manufacture of medium density fiberboard. J. Mater. Cycles Waste Manag. 2012, 15, 195–201. [Google Scholar] [CrossRef]
  29. Watson, P.; Potter, S. Burned wood in the pulp and paper industry: A literature review. For. Chron. 2004, 80, 473–477. Available online: https://pubs.cif-ifc.org/doi/pdf/10.5558/tfc80473-4 (accessed on 14 December 2022). [CrossRef]
  30. Johnson, J. California Wildfire Fallout: Timber Industry Confronted with Too Many Dead Trees, Warns of Damaged Forest. San Francisco Chronicle, 28 November 2021, Updated 29 November 2021. Available online: https://www.sfchronicle.com/bayarea/article/California-wildfire-fallout-Timber-industry-16655624.php (accessed on 12 January 2023).
  31. Militz, H. Georg-August-Universität Göttingen, Department of Wood Biology and Wood Products, Göttingen, Germany. Personal Communication, 4 September 2023. [Google Scholar]
  32. Finlex. Laki Metsätuhojen Torjunnasta [Finnish Law on Preventing Forest Damage]. Finlex 1087/2013. Available online: https://www.finlex.fi/fi/laki/alkup/2013/20131087 (accessed on 18 January 2022).
  33. Saarela, M. Kalajoen Metsäpalo 2021. Tapaustutkimus Palotapahtumasta ja Suojeluratkaisusta. [Kalajoki Forest Fire 2021: A Case Study of a Fire Event and a Conservation Solution.]. Bachelor’s Thesis, Tampere University of Applied Sciences, Tampere, Finland, 2022. [Google Scholar]
  34. ISO 13061-2:2014; Physical and Mechanical Properties of Wood—Test Methods for Small Clear Wood Specimens—Part 2: Determination of Density for Physical and Mechanical Tests. International Organization for Standardization: Geneva, Switzerland, 2014.
  35. ISO 13061-4:2014; Physical and Mechanical Properties of Wood—Test Methods for Small Clear Wood Specimens—Part 4: Determination of Modulus of Elasticity in Static Bending. International Organization for Standardization: Geneva, Switzerland, 2014.
  36. ISO 13061-3:2014; Physical and Mechanical Properties of Wood—Test Methods for Small Clear Wood Specimens—Part 3: Determination of Ultimate Strength in Static Bending. International Organization for Standardization: Geneva, Switzerland, 2014.
  37. ISO 178:2019; Plastics—Determination of Flexural Properties. International Organization for Standardization: Geneva, Switzerland, 2019.
  38. ISO 13061-1:2014; Physical and Mechanical Properties of Wood—Test Methods for Small Clear Wood Specimens—Part 1: Determination of Moisture Content for Physical and Mechanical Tests. International Organization for Standardization: Geneva, Switzerland, 2014.
  39. CEN-EN 1534:2020; Wood Flooring and Parquet—Determination of Resistance to Indentation—Test Method. European Committee for Standardization (CEN): Brussels, Belgium, 2020.
  40. ISO/CIE 11664-4:2019; Colorimetry—Part 4: CIE 1976 L*a*b* Colour Space. International Commission on Illumination (CIE). International Organization for Standardization: Geneva, Switzerland, 2019.
  41. Fox, J. Applied Regression Analysis and Generalized Linear Models, 3rd ed.; Sage Publications, Inc.: New York, NY, USA, 2016. [Google Scholar]
  42. Kolström, T.; Kellomäki, S. Tree survival in wildfires. Silva Fenn. 1993, 27, 5521. [Google Scholar] [CrossRef]
  43. Broda, M.; Spear, M.; Curling, S.; Dimitriou, A. Effects of Biological and Chemical Degradation on the Properties of Scots Pine—Part II: Wood-Moisture Relations and Viscoelastic Behaviour. Forests. 2022, 13, 1390. [Google Scholar] [CrossRef]
  44. Bodig, J.; Jayne, B.A. Mechanics of Wood and Wood Composites, 2nd ed.; Krieger Publishing Company: Malabar, FL, USA, 1993. [Google Scholar]
  45. Kretschmann, D.E. Mechanical Properties of Wood. In Wood Handbook: Wood as an Engineering Material; General Technical Report FPL-GTR282; Department of Agriculture, Forest Service, Forest Products Laboratory: Madison, WI, USA, 2021. Available online: https://www.fpl.fs.usda.gov/documnts/fplgtr/fplgtr282/fpl_gtr282.pdf (accessed on 30 March 2023).
  46. Zobel, B.J.; Sprague, J.R. Juvenile Wood in Forest Trees; Springer: Berlin/Heidelberg, Germany, 1998. [Google Scholar]
  47. Moore, J.R.; Cown, D.J. Corewood (Juvenile Wood) and Its Impact on Wood Utilisation. Curr. For. Rep. 2017, 3, 107–118. [Google Scholar] [CrossRef]
  48. Hakkila, P. Polttohakepuun kuivuminen metsässä [Forest seasoning of wood intended for fuel chips]. Commun. Inst. For. Fenn. 1962, 54(4), 1–82. [Google Scholar]
  49. Repola, J.; Heikkinen, J.; Lindblad, J. Pulpwood green density prediction models and sampling-based calibration. Silva Fenn. 2021, 55, 19. [Google Scholar] [CrossRef]
  50. Buchelt, B.; Wagenführ, A. Evaluation of colour differences on wood surfaces. Eur. J. Wood Wood Prod. 2012, 70, 389–391. [Google Scholar] [CrossRef]
  51. Grekin, M. Color and color uniformity variation of Scots pine wood in the air-dry condition. Wood Fiber Sci. 2007, 39, 279–290. [Google Scholar]
  52. Torniainen, P.; Popescu, C.-M.; Jones, D.; Scharf, A.; Sandberg, D. Correlation of Studies between Colour, Structure and Mechanical Properties of Commercially Produced ThermoWood® Treated Norway Spruce and Scots Pine. Forests 2021, 12, 1165. [Google Scholar] [CrossRef]
  53. Antonović, A.; Barčić, D.; Kljak, J.; Ištvanić, J.; Podvorec, T.; Stanešić, J. The Quality of Fired Aleppo Pine Wood (Pinus Halepensis Mill.) Biomass for Biorefinery Products. Croat. J. For. Eng. 2018, 39, 313–324. [Google Scholar]
Figure 1. Effects of forest fire on the deterioration of softwood timber according to time from harvesting in the northern and western regions of the United States and Canada [16].
Applsci 14 00238 g001
Figure 2. The burned Norway spruce stands studied in Kalajoki, Finland, at the time of sample collection in November 2021.
Applsci 14 00238 g002
Figure 3. The burned Scots pine stands studied in Kalajoki, Finland, at the time of sample collection in November 2021.
Applsci 14 00238 g003
Figure 4. Typical flexural stress–strain curves of sapwood in burned wood (heavily burned side) and reference wood of Norway spruce (left) and Scots pine (right) in butt logs.
Applsci 14 00238 g004
Figure 5. The moisture content of wood at different distances from the log surface in the butt, middle, and top logs.
Applsci 14 00238 g005
Figure 6. Lightness (L*) of spruce and pine wood by log type: sapwood of burned trees on the opposite sides (concerning the intensity of forest fire) and heartwood of burned trees, sapwood, and heartwood of reference trees. Moisture content is 12%.
Applsci 14 00238 g006
Figure 7. Redness (a*) of spruce and pine wood by log type: sapwood of burned trees on the opposite sides (concerning the intensity of forest fire) and heartwood of burned trees, sapwood, and heartwood of reference trees. Moisture content is 12%.
Applsci 14 00238 g007
Figure 8. Yellowness (b*) of spruce and pine wood by log type: sapwood of burned trees on the opposite sides (concerning the intensity of forest fire) and heartwood of burned trees, sapwood, and heartwood of reference trees. Moisture content is 12%.
Applsci 14 00238 g008
Table 1. Framework of tree sampling by species and size of burned trees in Kalajoki and reference trees in Kalajoki and Raahe.
SpeciesStem ClassDBH 1 Class, mmN, Burned
Kalajoki
N, Reference
Kalajoki
N, Reference
Raahe
Norway spruceNormal-log tree250–300402
Norway spruceSmall-log tree140–180420
Scots pineNormal-log tree250–300402
Scots pineSmall-log tree140–180402
1 DBH = diameter at breast height.
Table 2. Age (at stump), dimensions, and length of the burned area of forest fire trees and reference trees by species and stem class: means and ranges of variation. The burned area is the vertical extent from the stump upwards: Burned 1 = complete surface mantle of the tree is burned. Burned 2 = burned parts are visible in the surface mantle area of the tree.
Fire ClassSpeciesStem ClassAge, YearsDBH, mmHeight, mBurned 1, mBurned 2, m
BurnedSpruceNormal-log tree52 (50–56)268 (259–284)18.0 (16.9–19.4)2.0 (0.5–3.1)5.2 (2.3–6.7)
BurnedSpruceSmall-log tree52 (45–56)169 (145–183)14.0 (10.2–16.6)1.0 (0.7–1.3)7.0 (1.7–11.5)
BurnedPineNormal-log tree82 (72–90)267 (252–280)19.4 (16.7–20.7)2.6 (1.8–3.0)4.3 (4.0–4.6)
BurnedPineSmall-log tree69 (56–82)156 (135–174)16.5 (15.5–17.7)1.8 (1.1–2.7)3.1 (2.0–3.6)
ReferenceSpruceNormal-log tree74 (68–79)263 (255–271)20.1 (20.0–20.1)
ReferenceSpruceSmall-log tree54 (53–55)159 (151–167)13.9 (13.5–14.3)
ReferencePineNormal-log tree76 (74–77)261 (252–271)21.4 (20.4–22.4)
ReferencePineSmall-log tree62 (53–71)158 (147–168)15.6 (15.2–16.0)
Table 3. Mean bark thickness (mm) and annual ring width (mm) on the more damaged and less damaged sides of forest fire trees and on the two opposite sides of reference trees by species and vertical log location in the balks after being sawn. Middle logs and top logs have common means of bark thickness.
Norway SpruceScots Pine
Burned TreesButt LogMiddle LogTop LogButt LogMiddle LogTop Log
Bark thickness, more damaged side3.303.023.024.561.711.71
Bark thickness, less damaged side2.893.423.424.461.761.76
Ring width, more damaged side2.712.692.552.061.731.24
Ring width, less damaged side2.802.752.532.061.751.26
Reference TreesButt logMiddle logTop logButt logMiddle logTop log
Bark thickness, side of maximum bark4.333.873.875.581.891.89
Bark thickness, opposite side4.193.933.935.421.731.73
Ring width, side of maximum bark1.882.122.501.681.841.80
Ring width, opposite side1.731.902.401.701.812.13
Table 4. The number of samples used for testing air-dry density, modulus of elasticity (MOE), flexural strain, and modulus or rupture (MOR) by species, damage class, radial position, and log type.
Norway SpruceScots Pine
Wood MaterialButt LogMiddle LogTop LogButt LogMiddle LogTop Log
Sapwood, heavily burned side81261565
Sapwood, slightly burned side81241565
Heartwood, burned trees2012207
Sapwood, reference trees12881686
Heartwood, reference trees1261144
Table 5. Air-dry density by species, damage class, radial position, and log type (kg/m3). Values are presented as the means, with the standard deviation in parentheses.
Norway SpruceScots Pine
Wood MaterialButt LogMiddle LogTop LogButt LogMiddle LogTop Log
Sapwood, heavily burned side446.5 (42.6)448.7 (32.5)442.0 (18.4)581.3 (71.8)489.9 (41.3)489.2 (33.4)
Sapwood, slightly burned side448.9 (44.1)455.5 (32.5)446.1 (34.4)585.4 (67.4)476.2 (31.3)489.0 (38.8)
Heartwood, burned trees388.3 (32.3)402.0 (25.1)544.2 (95.5)478.3 (28.4)
Sapwood, reference trees474.8 (40.7)448.9 (55.5)448.0 (47.3)527.7 (78.1)476.3 (63.5)446.2 (45.9)
Heartwood, reference trees467.5 (38.8)446.6 (33.4)468.6 (62.2)447.1 (22.4)450.0 (60.6)
Table 6. Modulus of elasticity (MOE) by species, damage class, radial position, and log type (GPa). Values are presented as the means, with the standard deviation in parentheses.
Norway SpruceScots Pine
Wood MaterialButt LogMiddle LogTop LogButt LogMiddle LogTop Log
Sapwood, heavily burned side8.0 (1.6)9.2 (1.6)7.7 (1.6)12.3 (1.7)9.1 (1.4)8.9 (1.2)
Sapwood, slightly burned side8.5 (1.9)9.3 (1.0)8.0 (0.4)11.6 (2.0)9.7 (1.6)9.3 (1.4)
Heartwood, burned trees5.4 (1.3)7.0 (0.8)9.4 (1.4)9.1 (1.2)
Sapwood, reference trees10.4 (2.7)9.8 (2.2)9.6 (2.4)10.6 (2.9)9.5 (2.4)7.7 (2.4)
Heartwood, reference trees9.8 (2.5)10.0 (2.1)8.3 (2.6)7.9 (2.1)6.7 (1.6)
Table 7. Fixed effects in the linear mixed model (Equation (9)) for the modulus of elasticity (MOE) and the variation in random effects.
Norway SpruceScots Pine
SourceFdf1df2Sig.Fdf1df2Sig.
Fire damage class2.78221200.0660.76021190.470
Height class10.5222120<0.0015.64421190.005
Radial position0.06211200.8047.10011190.009
Air-dry density17.3921120<0.00166.0261119<0.001
Radial position * air-dry density0.28711200.59314.0041119<0.001
Random effectVariance Variance
Stand6.866 0.068
Tree0.269 0.983
Residual1.135 1.130
Fitting statistics
36.7% 64.5%
Bias–1.01 (–11.9%) 0.00 (0.0%)
RMSE2.14 (25.4%) 1.47 (15.0%)
* refers to interaction.
Table 8. Fixed coefficients in the linear mixed model (Equation (9)) for the modulus of elasticity (MOE).
Norway SpruceScots Pine
VariableEstimateStd. Error95% CIEstimateStd. Error95% CI
LowerUpper LowerUpper
Intercept1.7172.866–3.9567.391 1.3141.375–1.4084.036
Fire damage class (ref: no damage)
  More damaged side0.8690.442–0.0071.745–0.0200.443–0.8970.857
  Less damaged side1.0560.4500.1651.947–0.2060.442–1.0820.669
Height class (ref: top log)
  Butt log0.0340.313–0.5860.6540.7290.401–0.0651.524
  Middle log0.9380.3110.3231.5520.8640.4150.0421.686
Radial position (ref: heartwood)
  Sapwood–0.5842.353–5.2434.074–4.8991.764–8.391–1.407
Air-dry density0.0150.0050.0050.0250.0130.0030.0080.019
Interaction of radial position with air-dry density (ref: heartwood * density)
  Sapwood * density0.0030.005–0.0070.0130.0120.0030.0050.019
* refers to interaction.
Table 9. Modulus of rupture (MOR) by species, damage class, radial position, and log type (MPa). Values are presented as means, with the standard deviation in parentheses.
Norway SpruceScots Pine
Wood MaterialButt LogMiddle LogTop LogButt LogMiddle LogTop Log
Sapwood, heavily burned side74.3 (13.5)75.2 (11.8)62.4 (13.5)104.2 (19.6)81.2 (11.6)81.2 (9.8)
Sapwood, slightly burned side75.3 (12.3)77.1 (7.8)62.8 (7.5)108.3 (19.1)82.9 (11.8)81.9 (17.5)
Heartwood, burned trees51.7 (10.6)58.7 (9.3)84.4 (12.5)82.6 (9.0)
Sapwood, reference trees86.4 (16.9)77.2 (12.8)77.5 (14.8)92.8 (20.7)83.8 (18.7)71.8 (15.5)
Heartwood, reference trees77.3 (20.5)77.4 (12.8)67.2 (16.8)72.1 (13.9)67.3 (13.2)
Table 10. Fixed effects in the linear mixed model (Equation (9)) for the modulus of rupture (MOR) and the variation in random effects.
Norway SpruceScots Pine
SourceFdf1df2Sig. Fdf1df2Sig.
Fire damage class0.98121200.3783.59321180.031
Height class4.47821200.0130.64921180.525
Radial position0.02811200.86720.6001118<0.001
Air-dry density18.4191120<0.00181.0541118<0.001
Radial position * air-dry density0.39911200.52931.7671118<0.001
Random effectVariance Variance
Stand215.127 53.704
Tree0.000 22.311
Residual96.850 94.116
Fitting statistics
42.8% 67.1%
Bias–5.76 (–8.1%) 0.86 (1.0%)
RMSE14.0 (19.8%) 11.6 (13.3%)
* refers to interaction.
Table 11. Fixed coefficients in the linear mixed model (Equation (9)) for the modulus or rupture (MOR).
Norway SpruceScots Pine
VariableEstimateStd. Error95% CIEstimateStd. Error95% CI
LowerUpper LowerUpper
Intercept15.51119.585–23.26654.288 42.14611.974–23.26654.288
Fire damage class (ref: no damage)
  More damaged side3.5053.198–2.8279.838–11.4854.285–2.8279.838
  Less damaged side4.4963.288–2.01311.006–9.3194.316–2.01311.006
Height class (ref: top log)
  Butt log6.3912.8650.71912.0642.8302.8940.71912.064
  Middle log8.4742.8342.86414.0843.1372.8992.86414.084
Radial position (ref: heartwood)
  Sapwood–3.18219.017–40.83334.470–57.08012.576–40.83334.470
Air-dry density0.1080.0380.0330.1830.0650.0210.0330.183
Interaction of radial position with air-dry density (ref: heartwood * density)
  Sapwood * density0.0270.043–0.0580.112 0.1440.026–0.0580.112
* refers to interaction.
Table 12. Flexural strain at maximum force by species, damage class, radial position, and log type (%). Values are presented as means, with the standard deviation in percentage points in parentheses.
Norway SpruceScots Pine
Wood MaterialButt LogMiddle LogTop LogButt LogMiddle LogTop Log
Sapwood, heavily burned side1.47 (0.11)1.34 (0.11)1.29 (0.18)1.42 (0.19)1.39 (0.11)1.43 (0.08)
Sapwood, slightly burned side1.48 (0.15)1.28 (0.15)1.19 (0.32)1.52 (0.19)1.40 (0.11)1.47 (0.07)
Heartwood, burned trees1.53 (0.37)1.24 (0.32)1.37 (0.21)1.44 (0.09)
Sapwood, reference trees1.42 (0.18)1.31 (0.21)1.35 (0.14)1.59 (0.25)1.46 (0.13)1.60 (0.23)
Heartwood, reference trees1.23 (0.18)1.32 (0.16)1.47 (0.22)1.36 (0.21)1.46 (0.10)
Table 13. Brinell hardness (HB) by species, damage class, radial position, and log type (MPa). Values are presented as means, with the standard deviation in parentheses.
Norway SpruceScots Pine
Wood MaterialButt LogMiddle LogTop LogButt LogMiddle LogTop Log
Sapwood, heavily burned side12.4 (1.9)12.0 (2.7)11.8 (2.0)15.3 (2.4)12.4 (1.0)12.6 (2.0)
Sapwood, slightly burned side11.9 (1.8)11.4 (1.6)10.1 (1.8)14.9 (2.6)12.3 (1.1)12.6 (0.7)
Heartwood, burned trees9.9 (1.8)9.6 (1.3)14.7 (2.2)12.5 (1.8)
Sapwood, reference trees11.4 (1.1)10.6 (2.1)10.2 (2.0)13.9 (4.3)12.2 (2.9)10.3 (2.1)
Heartwood, reference trees11.2 (2.1)11.2 (2.6)11.7 (2.1)10.7 (1.3)9.9 (2.2)
Table 14. Fixed effects in the linear mixed model (Equation (9)) for Brinell hardness (HB) and variation in random effects.
Norway SpruceScots Pine
SourceFdf1df2Sig.Fdf1df2Sig.
Fire damage class5.09321200.0082.66121190.074
Height class1.80021200.1701.91421190.152
Radial position0.03711200.8484.54911190.035
Air-dry density25.1521120<0.00131.1151119<0.001
Radial position * density0.06811200.7946.07111190.015
Random effectVariance Variance
Stand0.000 1.782
Tree0.600 1.034
Residual1.779 3.254
Fitting statistics
46.9% 42.9%
Bias0.00 (0.0%) 0.01 (0.0%)
RMSE1.49 (13.6%) 2.21 (16.6%)
* refers to interaction.
Table 15. Fixed coefficients in the linear mixed model (Equation (9)) for Brinell hardness.
Norway SpruceScots Pine
VariableEstimateStd. Error95% CIEstimateStd. Error95% CI
LowerUpper LowerUpper
Intercept0.1632.357–4.5054.8307.4522.23303.03011.873
Fire damage class (ref: no damage)
  More damaged side1.5090.5190.4832.536–1.5680.7980–3.1480.012
  Less damaged side0.6590.525–0.3801.699–1.8320.7973–3.411–0.254
Height class (ref: top log)
  Butt log0.6970.392–0.0801.4740.8790.5381–0.1871.944
  Middle log0.3640.389–0.4071.1340.1390.5398–0.9291.208
Radial position (ref: heartwood)
  Sapwood0.5682.958–5.2886.424–4.9922.3406–9.626–0.357
Air-dry density0.0230.0060.0120.0340.0010.0100.00390.002
Interaction of radial position with air-dry density (ref: heartwood * density)
  Sapwood * density–0.0020.006–0.0150.0110.0120.00480.0020.021
* refers to interaction.
Table 16. Fixed effects in the linear mixed model (Equation (10)) for moisture gradient and variation in random effects.
Norway SpruceScots Pine
SourceFdf1df2Sig.Fdf1df2Sig.
Fire damage class5.94321330.0030.41021500.665
Height class9.2152133<0.0014.97421500.008
Radial position1.40011330.23993.3301150<0.001
Basic density1.56311330.2138.40011500.004
Fire damage class * radial position5.36721330.0060.67121500.513
Radial position * basic density0.04011330.84154.8601150<0.001
Random effectVariance Variance
Stand654.551 373.526
Tree275.985 151.485
Residual1070.354 525.179
Fitting statistics
42.4% 79.5%
Bias1.55 (1.6%) 0.00 (0.0%)
RMSE42.4 (44.9%) 21.6 (26.0%)
* refers to interaction.
Table 17. Fixed coefficients in the linear mixed model (Equation (10)) for moisture content.
Norway SpruceScots Pine
VariableEstimateStd. Error95% CIEstimateStd. Error95% CI
LowerUpper LowerUpper
Intercept134.06851.75231.704236.43117.89531.324–43.99879.788
Fire damage class (ref: no damage)
  More damaged side–30.07716.500–62.7132.559–18.66529.080–76.12438.793
  Less damaged side–30.10816.946–63.6273.411–20.97529.098–78.47136.520
Height class (ref: top log)
  Butt log–29.9647.100–44.007–15.922–14.3875.682–25.614–3.160
  Middle log–14.3628.178–30.5371.813–2.3995.890–14.0379.239
Radial position (ref: heartwood)
  Sapwood92.05559.173–24.986209.097292.49628.989235.217349.775
Basic density–0.1070.126–0.3560.1420.1360.0600.0160.255
Interaction of fire damage class * radial position (ref: no damage or heartwood)
  More damaged side * sapwood–44.22313.530–70.985–17.462–9.4159.096–27.3878.557
  Less damaged side * sapwood–24.31013.809–51.6243.003–0.6419.064–18.55017.268
Interaction of radial position with basic density (ref: heartwood * basic density)
  Sapwood * basic density–0.0320.157–0.3430.280–0.5300.072–0.672–0.389
* refers to interaction.
Table 18. Fixed effects in the linear mixed model (Equation (11)) for the color of Norway spruce wood and the variation in random effects.
L*a*b* L*a*b*
SourceFFFdf1df2Sig.Sig.Sig.
Fire damage class0.0840.2860.09322340.9190.7510.911
Height class4.2025.9740.15622340.0160.0030.856
Radial position75.45516.09623.8511234<0.001<0.001<0.001
Fire damage class * radial position12.8276.1000.3852234<0.0010.0030.681
Random effectVarianceVarianceVariance
Stand6.6771.4819.158
Tree0.6540.0460.064
Residual10.7042.42715.125
Fitting statistics
31.9%16.8%9.4%
Bias−0.01 (0.0%)0.00 (0.2%)0.06 (0.3%)
RMSE3.29 (3.9%) 1.54 (62.7%) 3.91 (18.9%)
* refers to interaction.
Table 19. Fixed coefficients in the linear mixed model (Equation (11)) for the color of Norway spruce and the variation in random effects.
L a* b*
VariableEstimateStd. ErrorEstimateStd. ErrorEstimateStd. Error
Intercept86.3092.7501.4461.28719.5443.191
Fire damage class (ref: no damage)
  More damaged side1.7253.781–0.2661.770–0.9314.393
  Less damaged side1.2433.780–0.2191.770–0.8614.393
Height class (ref: top log)
  Butt log–1.7270.6490.9500.3080.1010.765
  Middle log–0.8100.6910.3950.3270.3800.815
Radial position (ref: heartwood)
  Sapwood–0.8720.777–0.1420.3692.0450.921
Interaction of fire damage class * radial position (ref: no damage or heartwood)
  More damaged side * sapwood–4.9681.0661.3950.5060.7091.261
  Less damaged side * sapwood–4.3641.0681.6500.5071.0951.265
* refers to interaction.
Table 20. Fixed effects in the linear mixed model (Equation (11)) for the color of Scots pine and the variation in random effects.
L*a*b* L*a*b*
SourceFFFdf1df2Sig.Sig.Sig.
Fire damage class0.7193.5410.95222520.4880.0300.387
Height class12.4347.6217.8852252<0.001<0.001<0.001
Radial position13.1290.23331.4371252<0.0010.629<0.001
Fire damage class * radial position1.1201.6732.06822520.3280.1900.129
Random effectVarianceVarianceVariance
Stand6.4511.8609.699
Tree0.0000.0790.446
Residual10.6923.04115.849
Fitting statistics
17.0%13.4%16.9%
Bias0.00 (0.0%)0.00 (0.1%)0.04 (0.2%)
RMSE3.32 (4.0%) 1.74 (53.9%) 3.96 (16.0%)
* refers to interaction.
Table 21. Fixed coefficients in the linear mixed model (Equation (11)) for color coordinates of Scots pine and variation in random effects.
L a* b*
VariableEstimateStd. ErrorEstimateStd. ErrorEstimateStd. Error
Intercept86.6632.6331.7441.42319.4633.251
Fire damage class (ref: no damage)
  More damaged side–2.3593.6871.5431.9882.3334.542
  Less damaged side–1.5173.6800.2801.9840.8104.533
Height class (ref: top log)
  Butt log–2.9250.5951.2550.3222.9060.735
  Middle log–1.9470.6670.9600.3582.5070.818
Radial position (ref: heartwood)
  Sapwood–2.4030.6640.1080.3594.3090.819
Interaction of fire damage class * radial position (ref: no damage or heartwood)
  More damaged side * sapwood1.4761.034–0.8280.557–2.5731.272
  Less damaged side * sapwood1.0391.0130.1650.546–1.3541.247
* refers to interaction.
Table 22. ΔE*ab (Equation (8)) values between damaged wood and Norway spruce and Scots pine reference wood.
Fire Damage ClassRadial PositionNorway SpruceScots Pine
More damaged sideSapwood4.615.29
More damaged sideHeartwood1.983.66
Less damaged sideSapwood4.774.77
Less damaged sideHeartwood1.531.74
Disclaimer/Publisher’s Note: The statements, opinions and data contained in all publications are solely those of the individual author(s) and contributor(s) and not of MDPI and/or the editor(s). MDPI and/or the editor(s) disclaim responsibility for any injury to people or property resulting from any ideas, methods, instructions or products referred to in the content.

