
Food Classification and Meal Intake Amount Estimation through Deep Learning


Abstract
1. Introduction
2. Related Works for Food Detection and Meal Intake Amount Estimation
3. Food Classification and Meal Intake Amount Estimation through Deep Learning
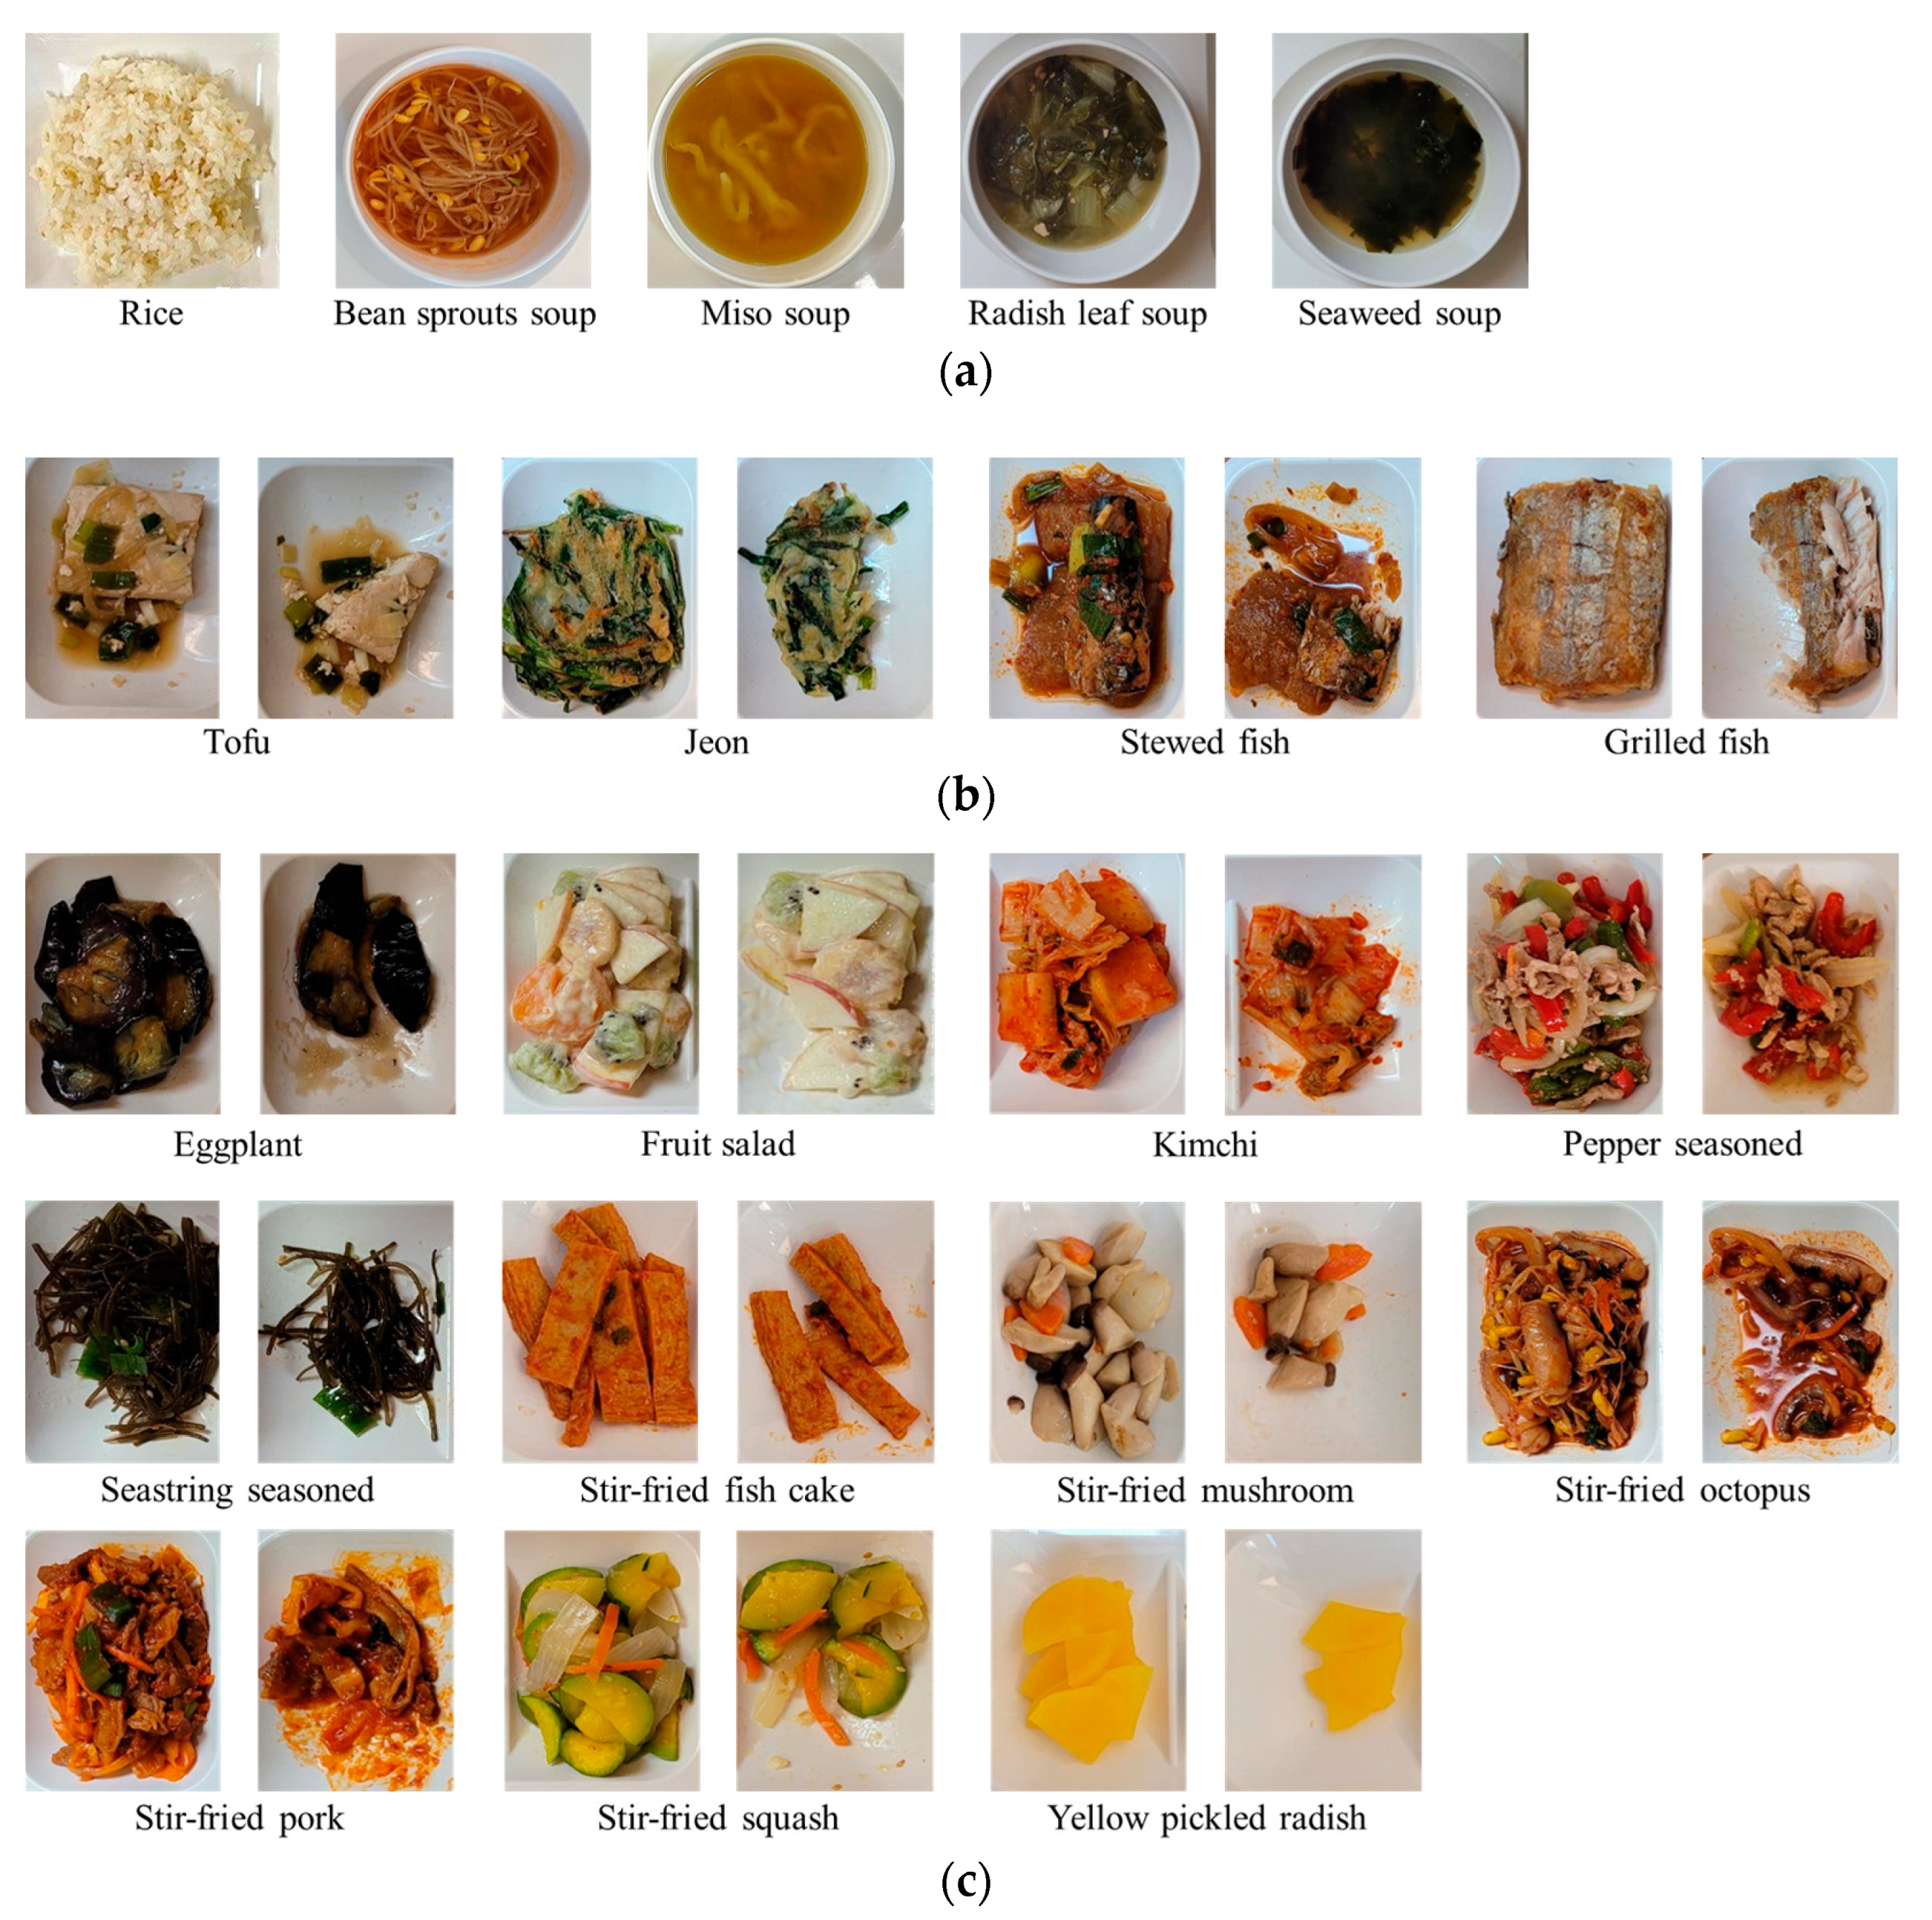
3.1. Dataset
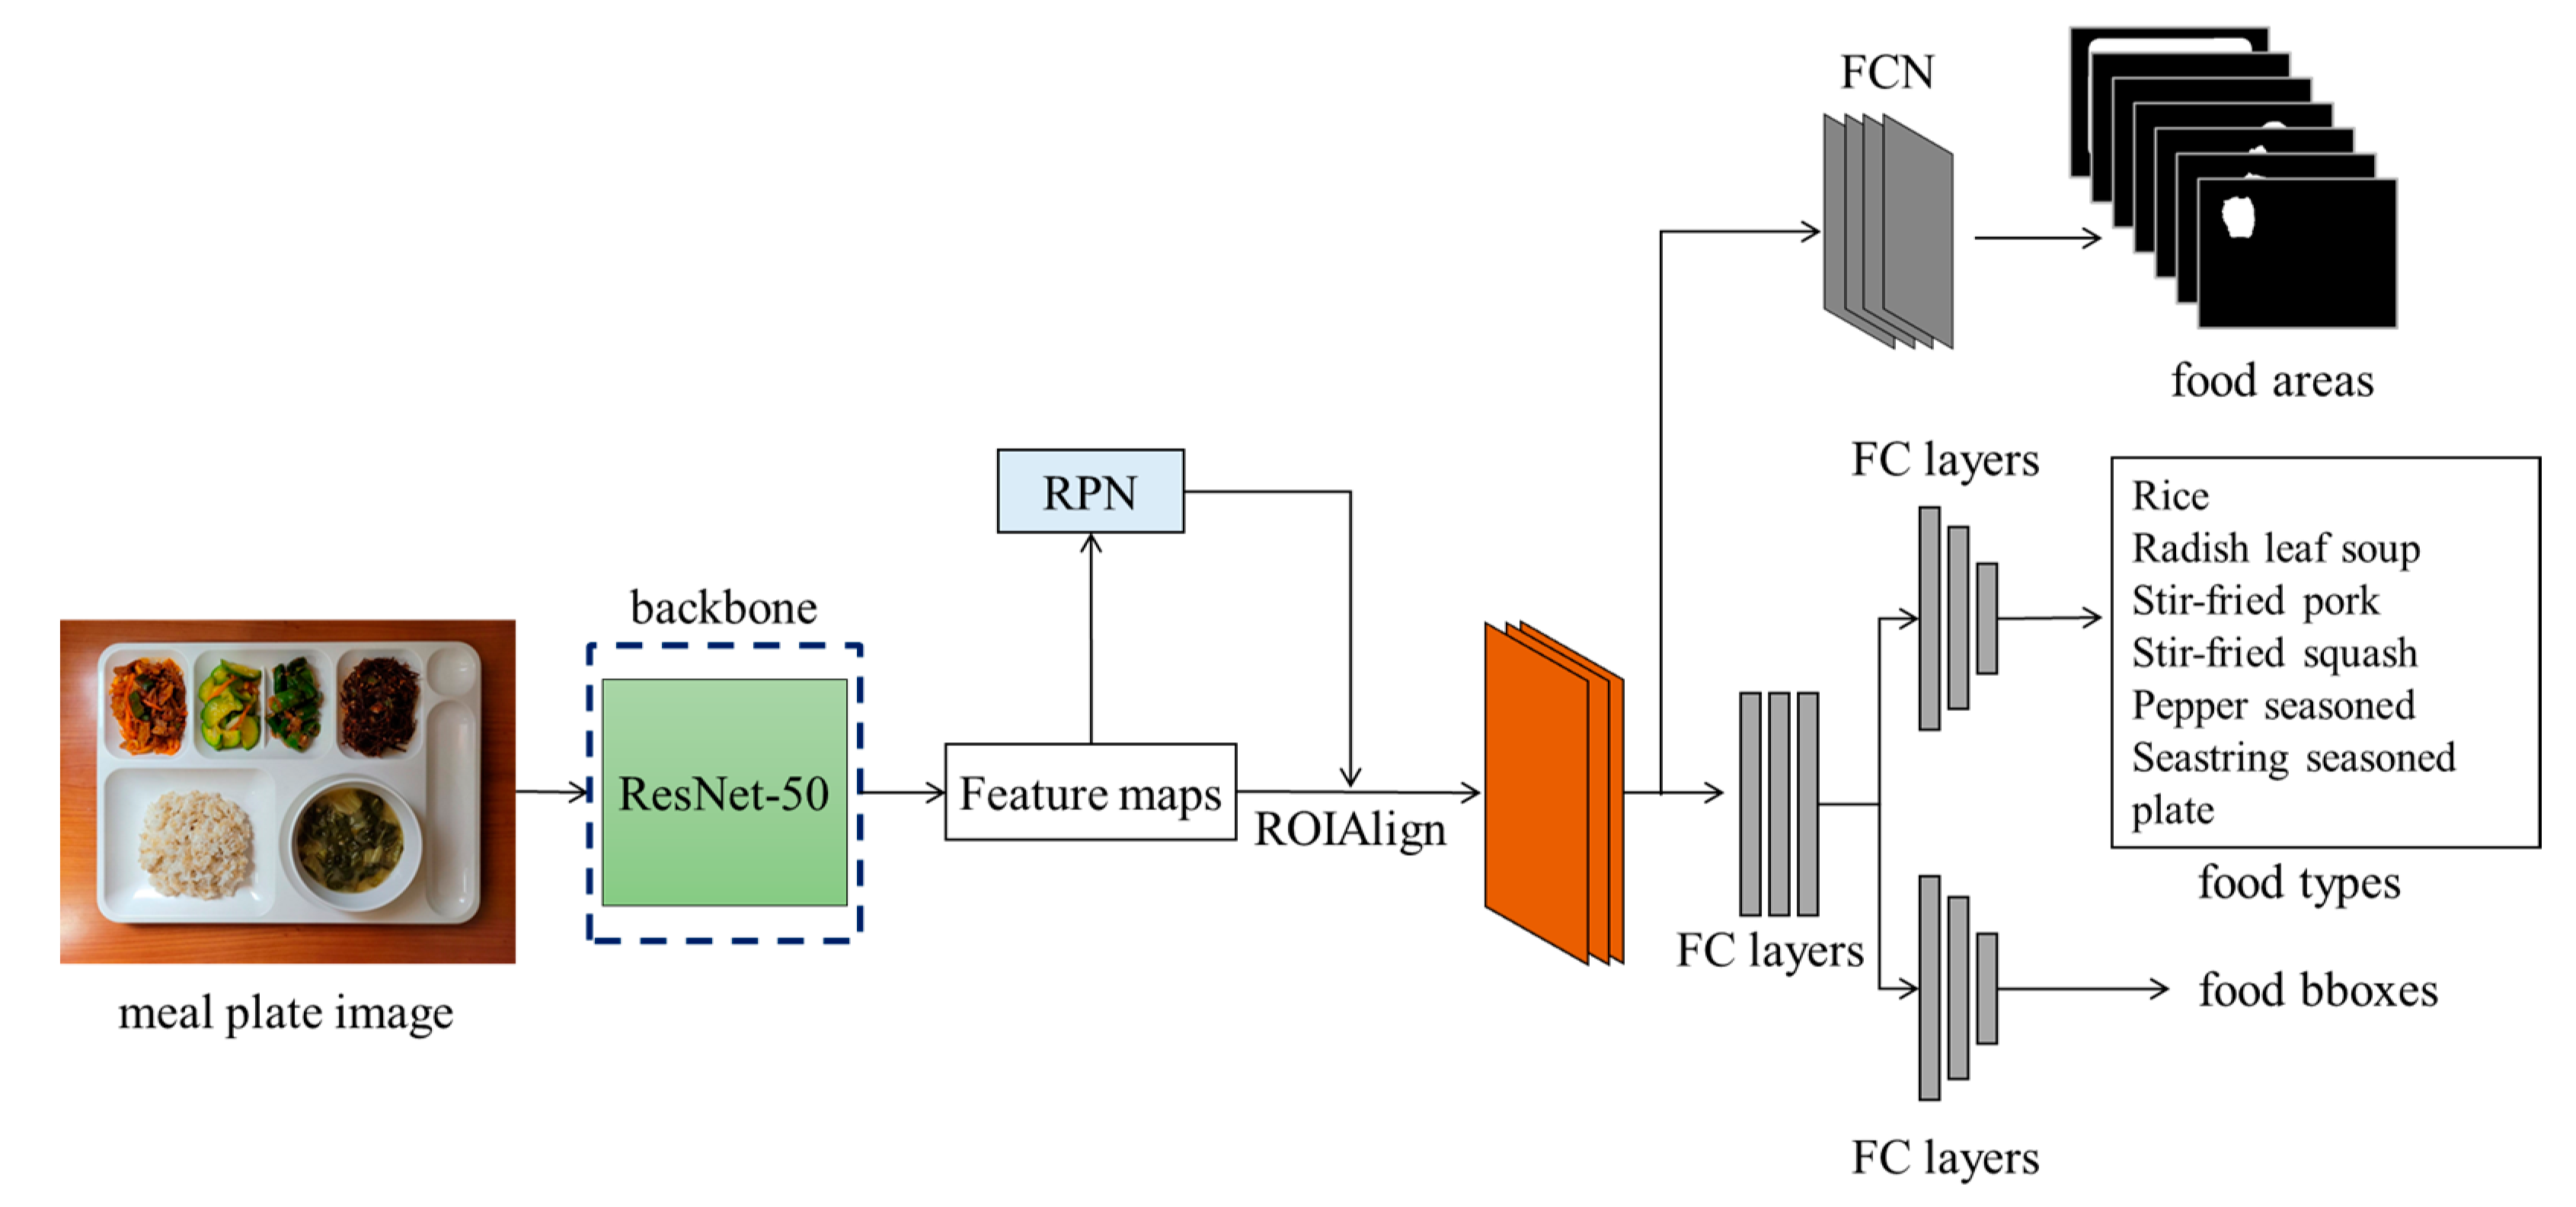
3.2. Food Detection through Mask R-CNN
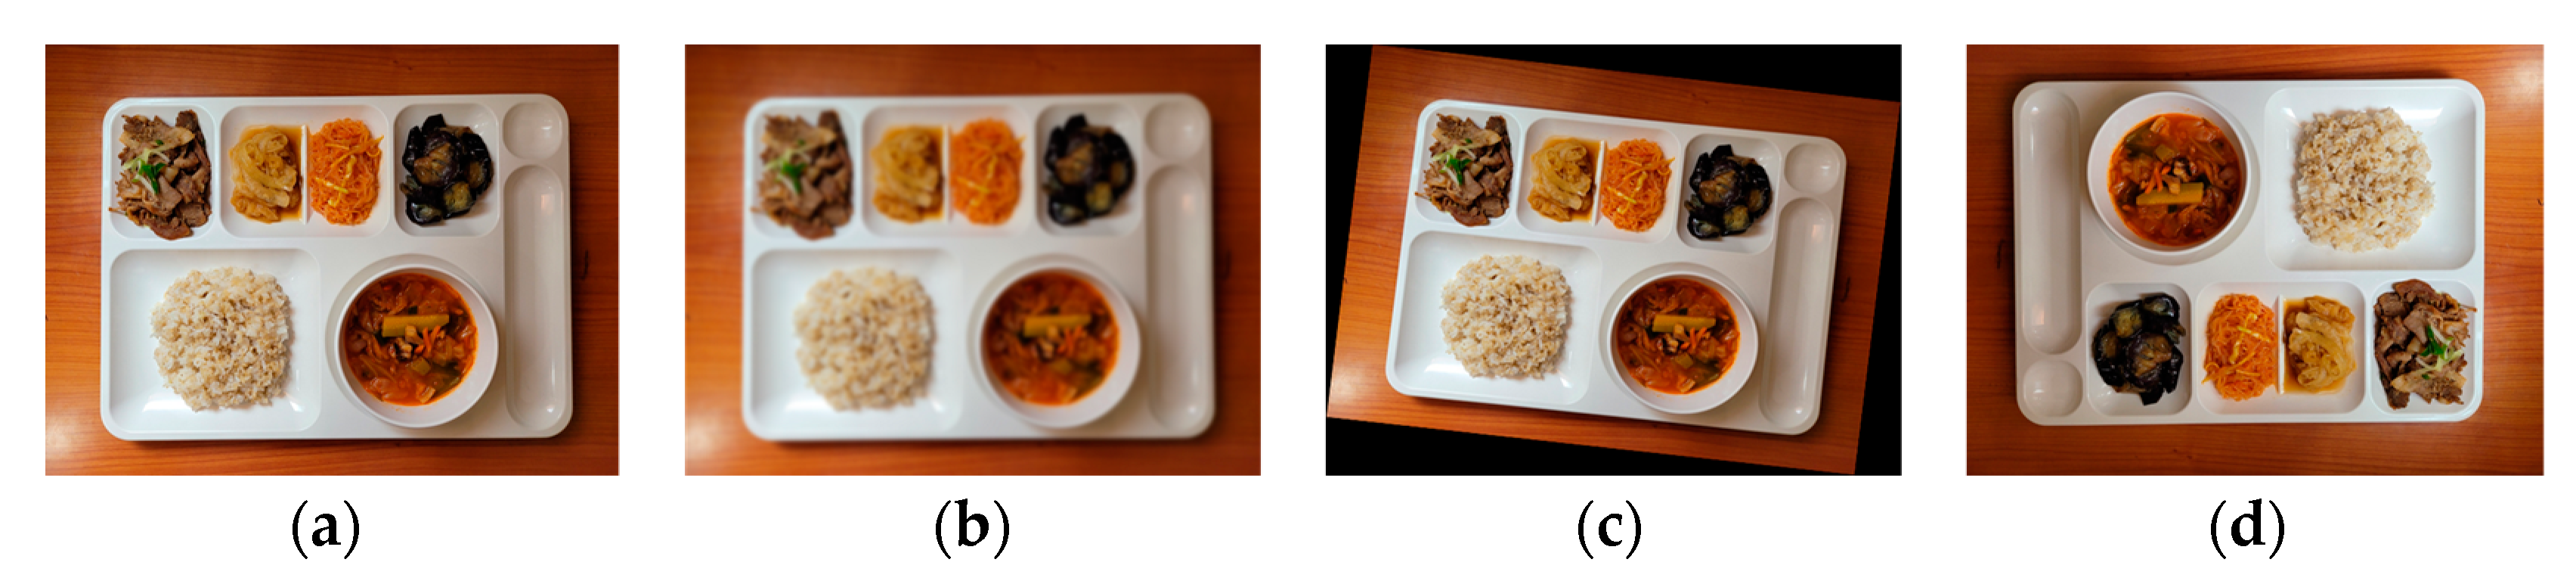
3.3. Image Correction for Food Amount Comparison
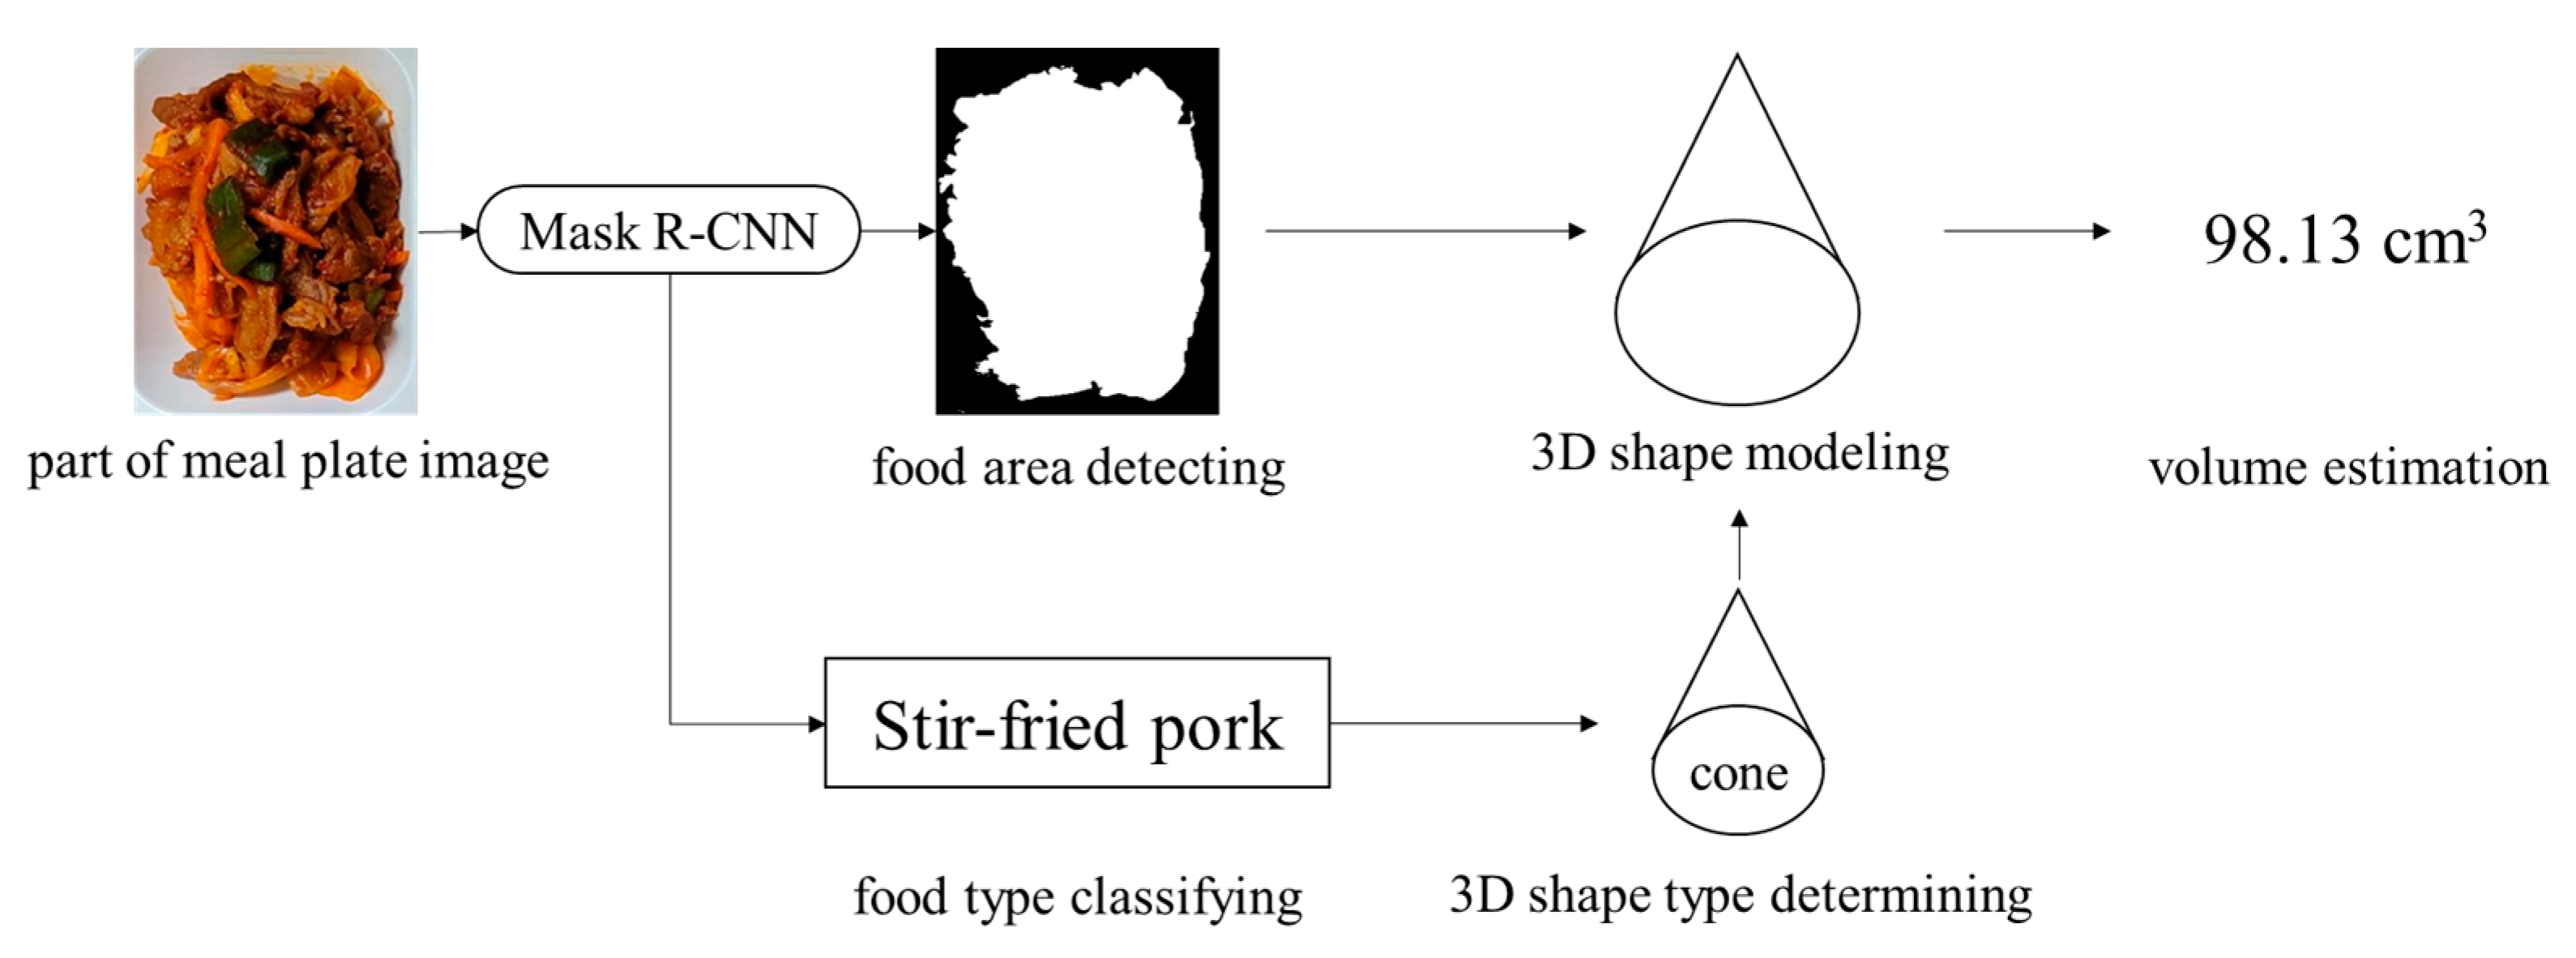
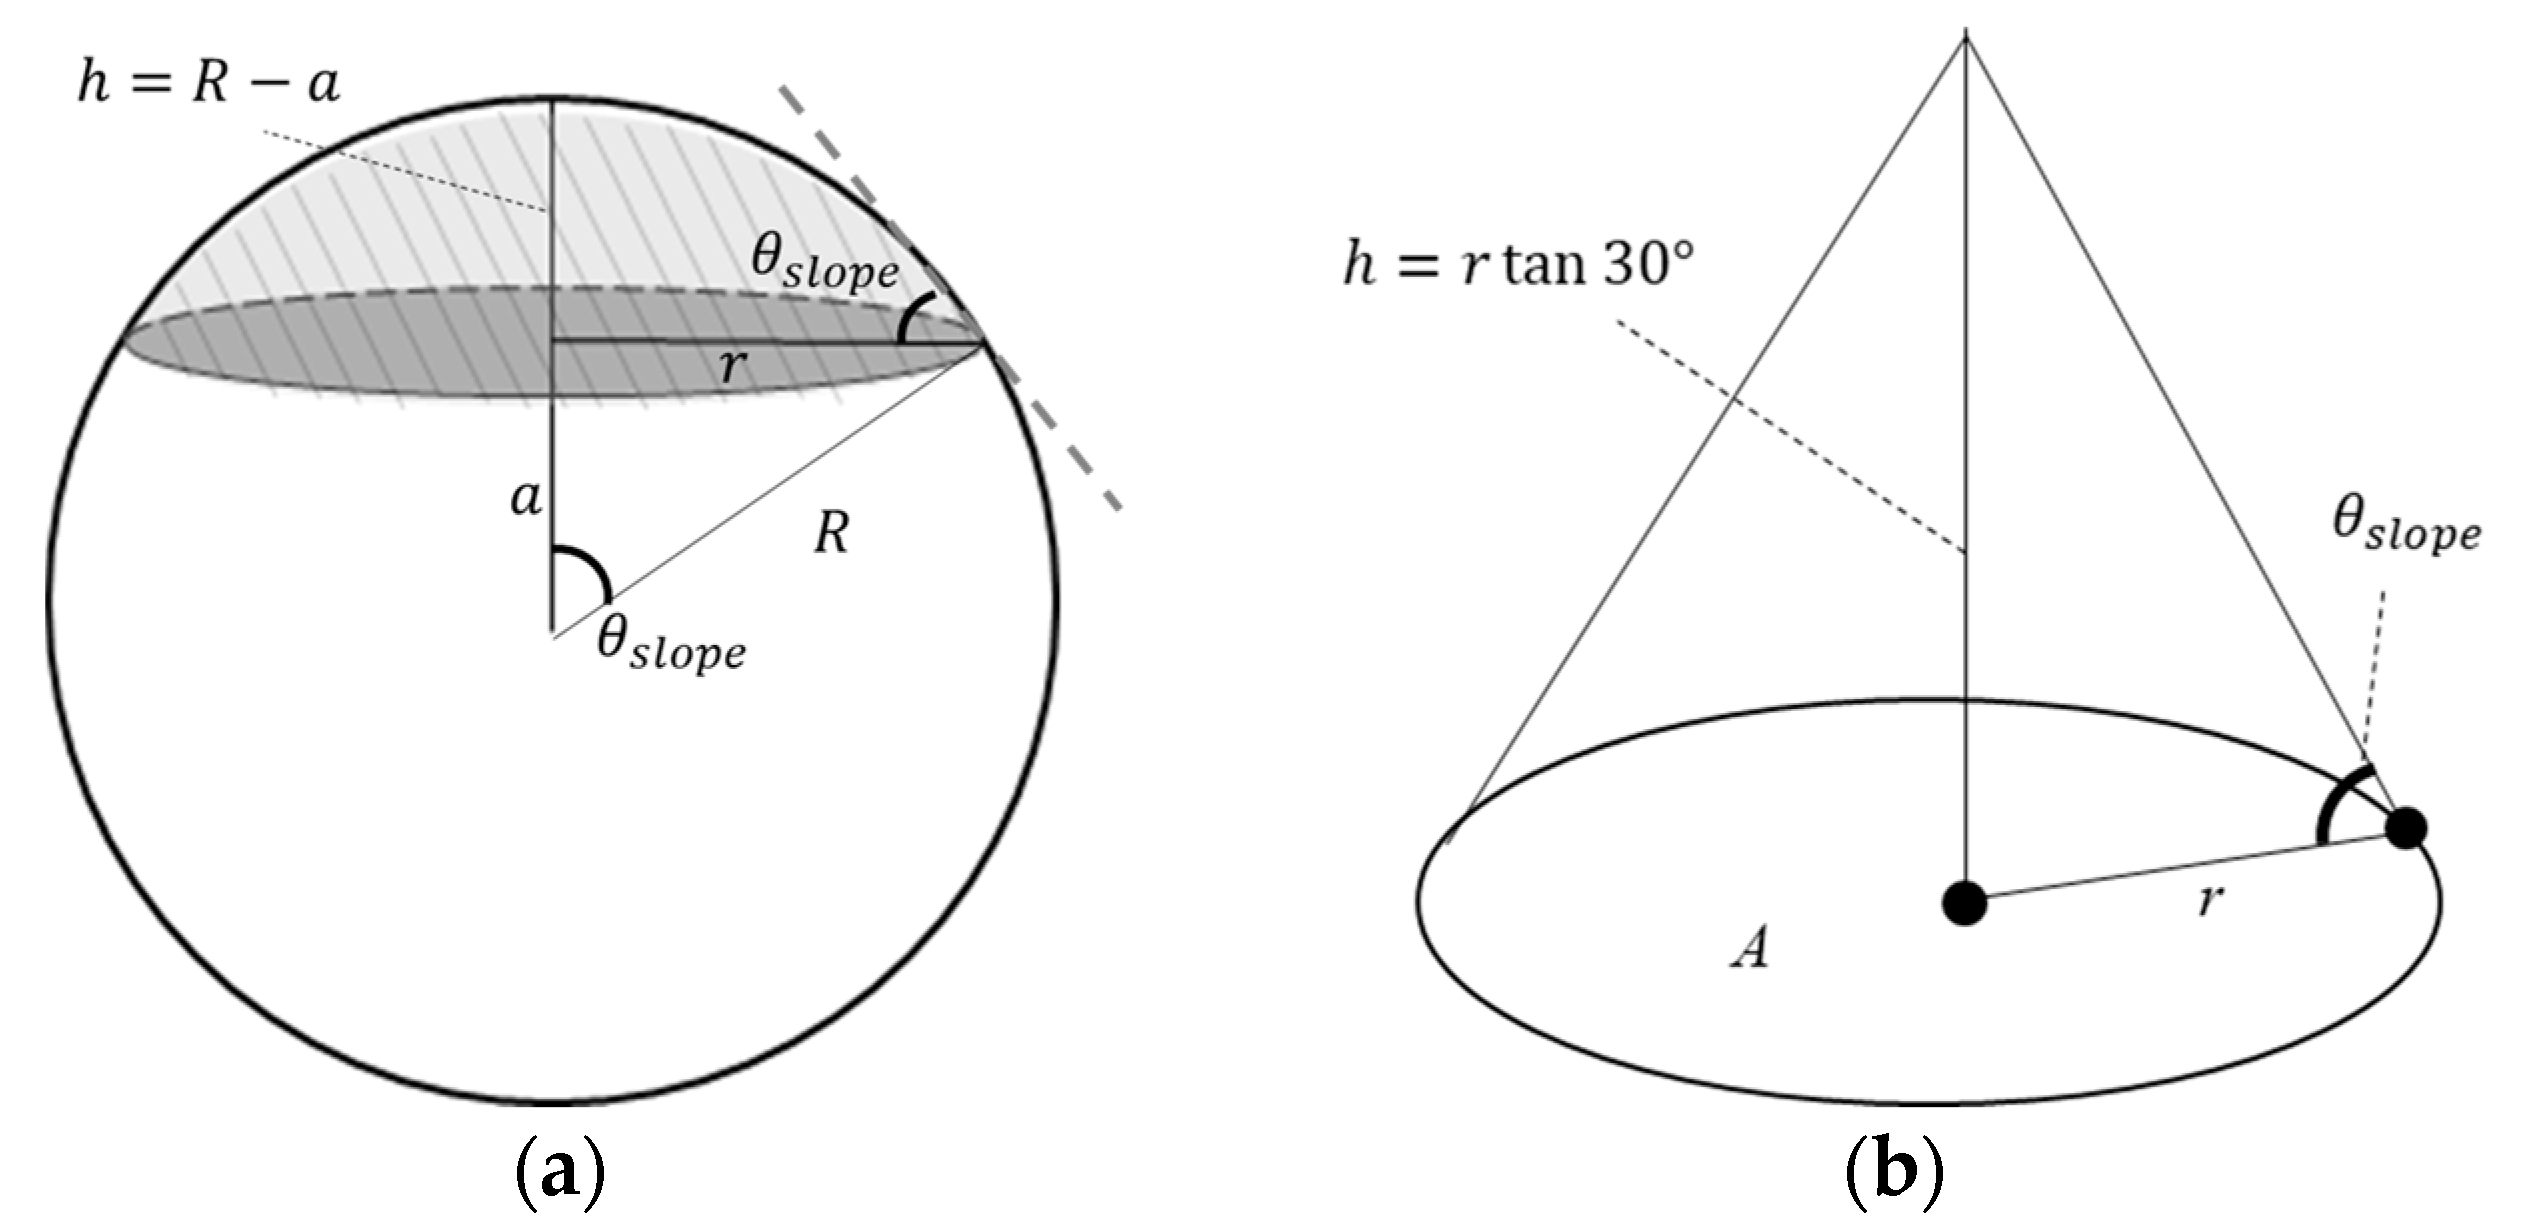
3.4. Meal Intake Amount Estimation
4. Simulation
4.1. Simulation Results
4.2. Discussion
5. Conclusions
Author Contributions
Funding
Institutional Review Board Statement
Informed Consent Statement
Data Availability Statement
Conflicts of Interest
References
- Westerterp, K.R.; Goris, A.H. Validity of The Assessment of Dietary Intake: Problems of Misreporting. Curr. Opin. Clin. Nutr. Metab. Care 2002, 5, 489–493. [Google Scholar] [CrossRef] [PubMed]
- Elbassuoni, S.; Ghattas, H.; Ati, J.E.; Shmayssani, Z.; Katerji, S.; Zoughbi, Y.; Semaan, A.; Akl, C.; Gharbia, H.B.; Sassi, S. DeepNOVA: A Deep Learning NOVA Classifier for Food Images. IEEE Access 2022, 10, 128523–128535. [Google Scholar] [CrossRef]
- Tiankaew, U.; Chunpongthong, P.; Mettanant, V. A Food Photography App with Image Recognition for Thai Food. In Proceedings of the Seventh ICT International Student Project Conference, Nakhonpathom, Thailand, 11–13 July 2018. [Google Scholar]
- Mezgec, S.; Seljak, B.K. Using Deep Learning for Food and Beverage Image Recognition. In Proceedings of the IEEE International Conference on Big Data, Los Angeles, CA, USA, 9–12 December 2019. [Google Scholar]
- Islam, M.T.; Siddique, B.M.K.; Rahman, S.; Jabid, T. Food Image Classification with Convolutional Neural Network. In Proceedings of the International Conference on Intelligent Informatics and Biomedical Sciences, Bangkok, Thailand, 21–24 October 2018. [Google Scholar]
- Bándi, N.; Tunyogi, R.B.; Szabó, Z.; Farkas, E.; Sulyok, C. Image-Based Volume Estimation Using Stereo Vision. In Proceedings of the IEEE International Symposium on Intelligent Systems and Informatics, Subotica, Serbia, 17–19 September 2020. [Google Scholar]
- Okinda, C.; Sun, Y.; Nyalala, I.; Korohou, T.; Opiyo, S.; Wang, J.; Shen, M. Egg Volume Estimation Based on Image Processing and Computer Vision. J. Food Eng. 2020, 283, 110041. [Google Scholar] [CrossRef]
- Lu, Y.; Stathopoulou, T.; Vasiloglou, M.F.; Christodoulidis, S.; Blum, B.; Walser, T.; Meier, V.; Stanga, Z.; Mougiakakou., S. An Artificial Intelligence-Based System for Nutrient Intake Assessment of Hospitalised Patients. IEEE Trans. Multimedia 2020, 23, 1136–1147. [Google Scholar] [CrossRef]
- Lo, F.P.W.; Sun, Y.; Qiu, J.; Lo, B. Food Volume Estimation Based on Deep Learning View Synthesis from a Single Depth Map. Nutrients 2018, 10, 2005. [Google Scholar] [CrossRef] [PubMed]
- Suzuki, T.; Futatsuishi, K.; Yokoyama, K.; Amaki, N. Point Cloud Processing Method for Food Volume Estimation Based on Dish Space. In Proceedings of the Annual International Conference of the IEEE Engineering in Medicine & Biology Society, Montreal, QC, Canada, 20–24 July 2020. [Google Scholar]
- Ando, Y.; Ege, T.; Cho, J.; Yanai, K. Depthcaloriecam: A Mobile Application for Volume-Based Foodcalorie Estimation Using Depth Cameras. In Proceedings of the International Workshop on Multimedia Assisted Dietary Management, New York, NY, USA, 21 October 2019. [Google Scholar]
- Okamoto, K.; Yanai, K. An Automatic Calorie Estimation System of Food Images on A Smartphone. In Proceedings of the International Workshop on Multimedia Assisted Dietary Management, Amsterdam, The Netherlands, 16 October 2016. [Google Scholar]
- Smith, S.P.; Adam, M.T.P.; Manning, G.; Burrows, T.; Collins, C.; Rollo, M.E. Food Volume Estimation by Integrating 3D Image Projection and Manual Wire Mesh Transformations. IEEE Access 2022, 10, 48367–48378. [Google Scholar] [CrossRef]
- Liu, Y.; Lai, J.; Sun, W.; Wei, Z.; Liu, A.; Gong, W.; Yang, Y. Food Volume Estimation Based on Reference. In Proceedings of the International Conference on Innovation in Artificial Intelligence, Xiamen, China, 8–11 May 2020. [Google Scholar]
- Jia, W.; Ren, Y.; Li, B.; Beatrice, B.; Que, J.; Cao, S.; Wu, Z.; Mao, Z.H.; Lo, B.; Anderson, A.K.; et al. A Novel Approach to Dining Bowl Reconstruction for Image-Based Food Volume Estimation. Sensors 2022, 22, 1493. [Google Scholar] [CrossRef] [PubMed]
- Yue, Y.; Jia, W.; Sun, M. Measurement of Food Volume Based on Single 2-D Image without Conventional Camera Calibration. In Proceedings of the Annual International Conference of the IEEE Engineering in Medicine and Biology Society, San Diego, CA, USA, 28 August–1 September 2012. [Google Scholar]
- Fang, S.; Liu, C.; Zhu, F.; Delp, E.J.; Boushey, C.J. Single-view Food Portion Estimation Based on Geometric Models. In Proceedings of the IEEE International Symposium on Multimedia, Miami, FL, USA, 14–16 March 2015. [Google Scholar]
- He, K.; Gkioxari, G.; Dollar, P.; Girshick, R. Mask R-CNN. In Proceedings of the IEEE International Conference on Computer Vision, Venice, Italy, 22–29 October 2017. [Google Scholar]
- Chang, K.H.; Liu, S.Y.; Chu, H.H.; Hsu, J.Y.J.; Chen, C.; Lin, T.Y.; Chen, C.Y.; Huang, P. The Diet-aware Dining Table: Observing Dietary Behaviors over A Tabletop Surface. In Proceedings of the 4th International Conference on Pervasive Computing, Dublin, Ireland, 7–10 May 2006; pp. 366–382. [Google Scholar]
- Zhou, B.; Cheng, J.; Sundholm, M.; Reiss, A.; Huang, W.; Amft, O.; Lukowicz, P. Smart Table Surface: A Novel Approach to Pervasive Dining Monitoring. In Proceedings of the 2015 IEEE International Conference on Pervasive Computing and Communications (PerCom), St. Louis, MO, USA, 23–27 March 2015. [Google Scholar]
- Olubanjo, T.; Moore, E.; Ghovanloo, M. Detecting Food Intake Acoustic Events in Noisy Recordings Using Template Matching. In Proceedings of the International Conference on Biomedical and Health Informatics, Las Vegas, NV, USA, 25–27 February 2016. [Google Scholar]
- Thomaz, E.; Essa, I.; Abowd, G.D. A Practical Approach for Recognizing Eating Moments with Wrist-mounted Inertial Sensing. In Proceedings of the International Joint Conference on Pervasive and Ubiquitous Computing, Osaka, Japan, 7–11 September 2015. [Google Scholar]
- Ye, X.; Chen, G.; Gao, Y.; Wang, H.; Cao, Y. Assisting Food Journaling with Automatic Eating Detection. In Proceedings of the CHI Conference Extended Abstracts on Human Factors in Computing Systems, San Jose, CA, USA, 7–12 May 2016. [Google Scholar]
- Redmon, J.; Divvala, S.; Girshick, R.; Farhadi, A. You Only Look Once: Unified, Real-Time Object Detection. In Proceedings of the IEEE Conference on Computer Vision and Pattern Recognition, Las Vegas, NV, USA, 27–30 June 2016. [Google Scholar]
- Simonyan, K.; Zisserman, A. Very Deep Convolutional Networks for Large-Scale Image Recognition. In Proceedings of the International Conference on Learning Representations, San Diego, CA, USA, 7–9 May 2015. [Google Scholar]
- Krizhevsky, A.; Sutskever, I.; Hinton, G.E. Imagenet Classification with Deep Convolutional Neural Networks. Commun. ACM 2017, 60, 84–90. [Google Scholar] [CrossRef]
- Szegedy, C.; Vanhoucke, V.; Ioffe, S.; Shlens, J.; Wojna, Z. Rethinking the Inception Architecture for Computer Vision. In Proceedings of the IEEE Conference on Computer Vision and Pattern Recognition, Las Vegas, NV, USA, 27–30 June 2016. [Google Scholar]
- Wang, Y.; Wu, J.; Deng, H.; Zeng, X. Food Image Recognition and Food Safety Detection Method Based on Deep Learning. Comput. Intell. Neurosci. 2021, 2021, 1268453. [Google Scholar] [CrossRef] [PubMed]
- Lo, F.P.W.; Sun, Y.; Qiu, J.; Lo, B. Image-Based Food Classification and Volume Estimation for Dietary Assessment: A Review. IEEE J. Biomed. Health. Inf. 2020, 24, 1926–1939. [Google Scholar] [CrossRef] [PubMed]
- Hippocrate, E.; Suwa, H.; Arakawa, Y.; Yasumoto, K. Food Weight Estimation Using Smartphone and Cutlery. In Proceedings of the Annual International Conference on Mobile Systems, Applications, and Services, Singapore, 25–30 June 2016. [Google Scholar]
- Xu, C.; He, Y.; Khanna, N.; Boushey, C.; Delp, E. Model-Based Food Volume Estimation Using 3D Pose. In Proceedings of the IEEE International Conference on Image Processing, Melbourne, Australia, 15–18 September 2013. [Google Scholar]
- Chang, X.; Ye, H.; Albert, P.; Edward, D.; Nitin, K.; Carol, B. Image-Based Food Volume Estimation. In Proceedings of the ACM Multimedia Conference, Barcelona, Spain, 21–25 October 2013. [Google Scholar]
- He, K.; Zhang, X.; Ren, S.; Sun, J. Deep Residual Learning for Image Recognition. In Proceedings of the IEEE Conference on Computer Vision and Pattern Recognition, Las Vegas, NV, USA, 27–30 June 2016. [Google Scholar]
- Long, J.; Shelhamer, E.; Darrell, T. Fully Convolutional Networks for Semantic Segmentation. In Proceedings of the Computer Vision and Pattern Recognition Conference, Boston, MA, USA, 8–10 June 2015. [Google Scholar]
- Shamos, M.I. Computational Geometry; Yale University: Connecticut, CT, USA, 1978. [Google Scholar]
- Al-Hashemi, H.M.B.; Al-Amoudi, O.S.B. A Review on The Angle of Repose of Granular Materials. Powder Technol. 2018, 330, 397–417. [Google Scholar] [CrossRef]
- YOLOv8. Available online: https://github.com/ultralytics/ultralytics (accessed on 22 April 2023).


| Category | Food Name | No. of Images in Training Set | No. of Images in Validation Set |
|---|---|---|---|
| Rice | Rice | 412 | 95 |
| Soup | Bean sprout soup | 108 | 16 |
| Miso soup | 216 | 32 | |
| Radish leaf soup | 80 | 12 | |
| Seaweed soup | 68 | 12 | |
| Side-dish | Eggplant | 86 | 13 |
| Fruit salad | 43 | 5 | |
| Grilled fish | 246 | 43 | |
| Jeon | 104 | 23 | |
| Kimchi | 258 | 29 | |
| Pepper seasoned | 81 | 11 | |
| Seastring seasoned | 84 | 14 | |
| Stewed fish | 185 | 20 | |
| Stir-fried fish cake | 84 | 23 | |
| Stir-fried mushroom | 121 | 29 | |
| Stir-fried octopus | 58 | 5 | |
| Stir-fried pork | 179 | 29 | |
| Stir-fried squash | 87 | 8 | |
| Tofu | 116 | 26 | |
| Yellow pickled radish | 142 | 17 |
| Category | Food Name | 3D Shape Types | Category | Food Name | 3D Shape Types |
|---|---|---|---|---|---|
| Rice | Rice | spherical cap | Side-dish | Fruit salad | Cone |
| Soup | Bean sprout soup | spherical cap | Kimchi | cone | |
| Miso soup | spherical cap | Pepper seasoned | cone | ||
| Radish leaf soup | spherical cap | Seastring seasoned | cone | ||
| Seaweed soup | spherical cap | Stir-fried fish cake | cone | ||
| Side-dish | Tofu | cuboid | Stir-fried mushroom | cone | |
| Jeon | cuboid | Stir-fried octopus | cone | ||
| Stewed fish | cuboid | Stir-fried pork | cone | ||
| Grilled fish | cuboid | Stir-fried squash | cone | ||
| Eggplant | cone | Yellow pickled radish | cone |
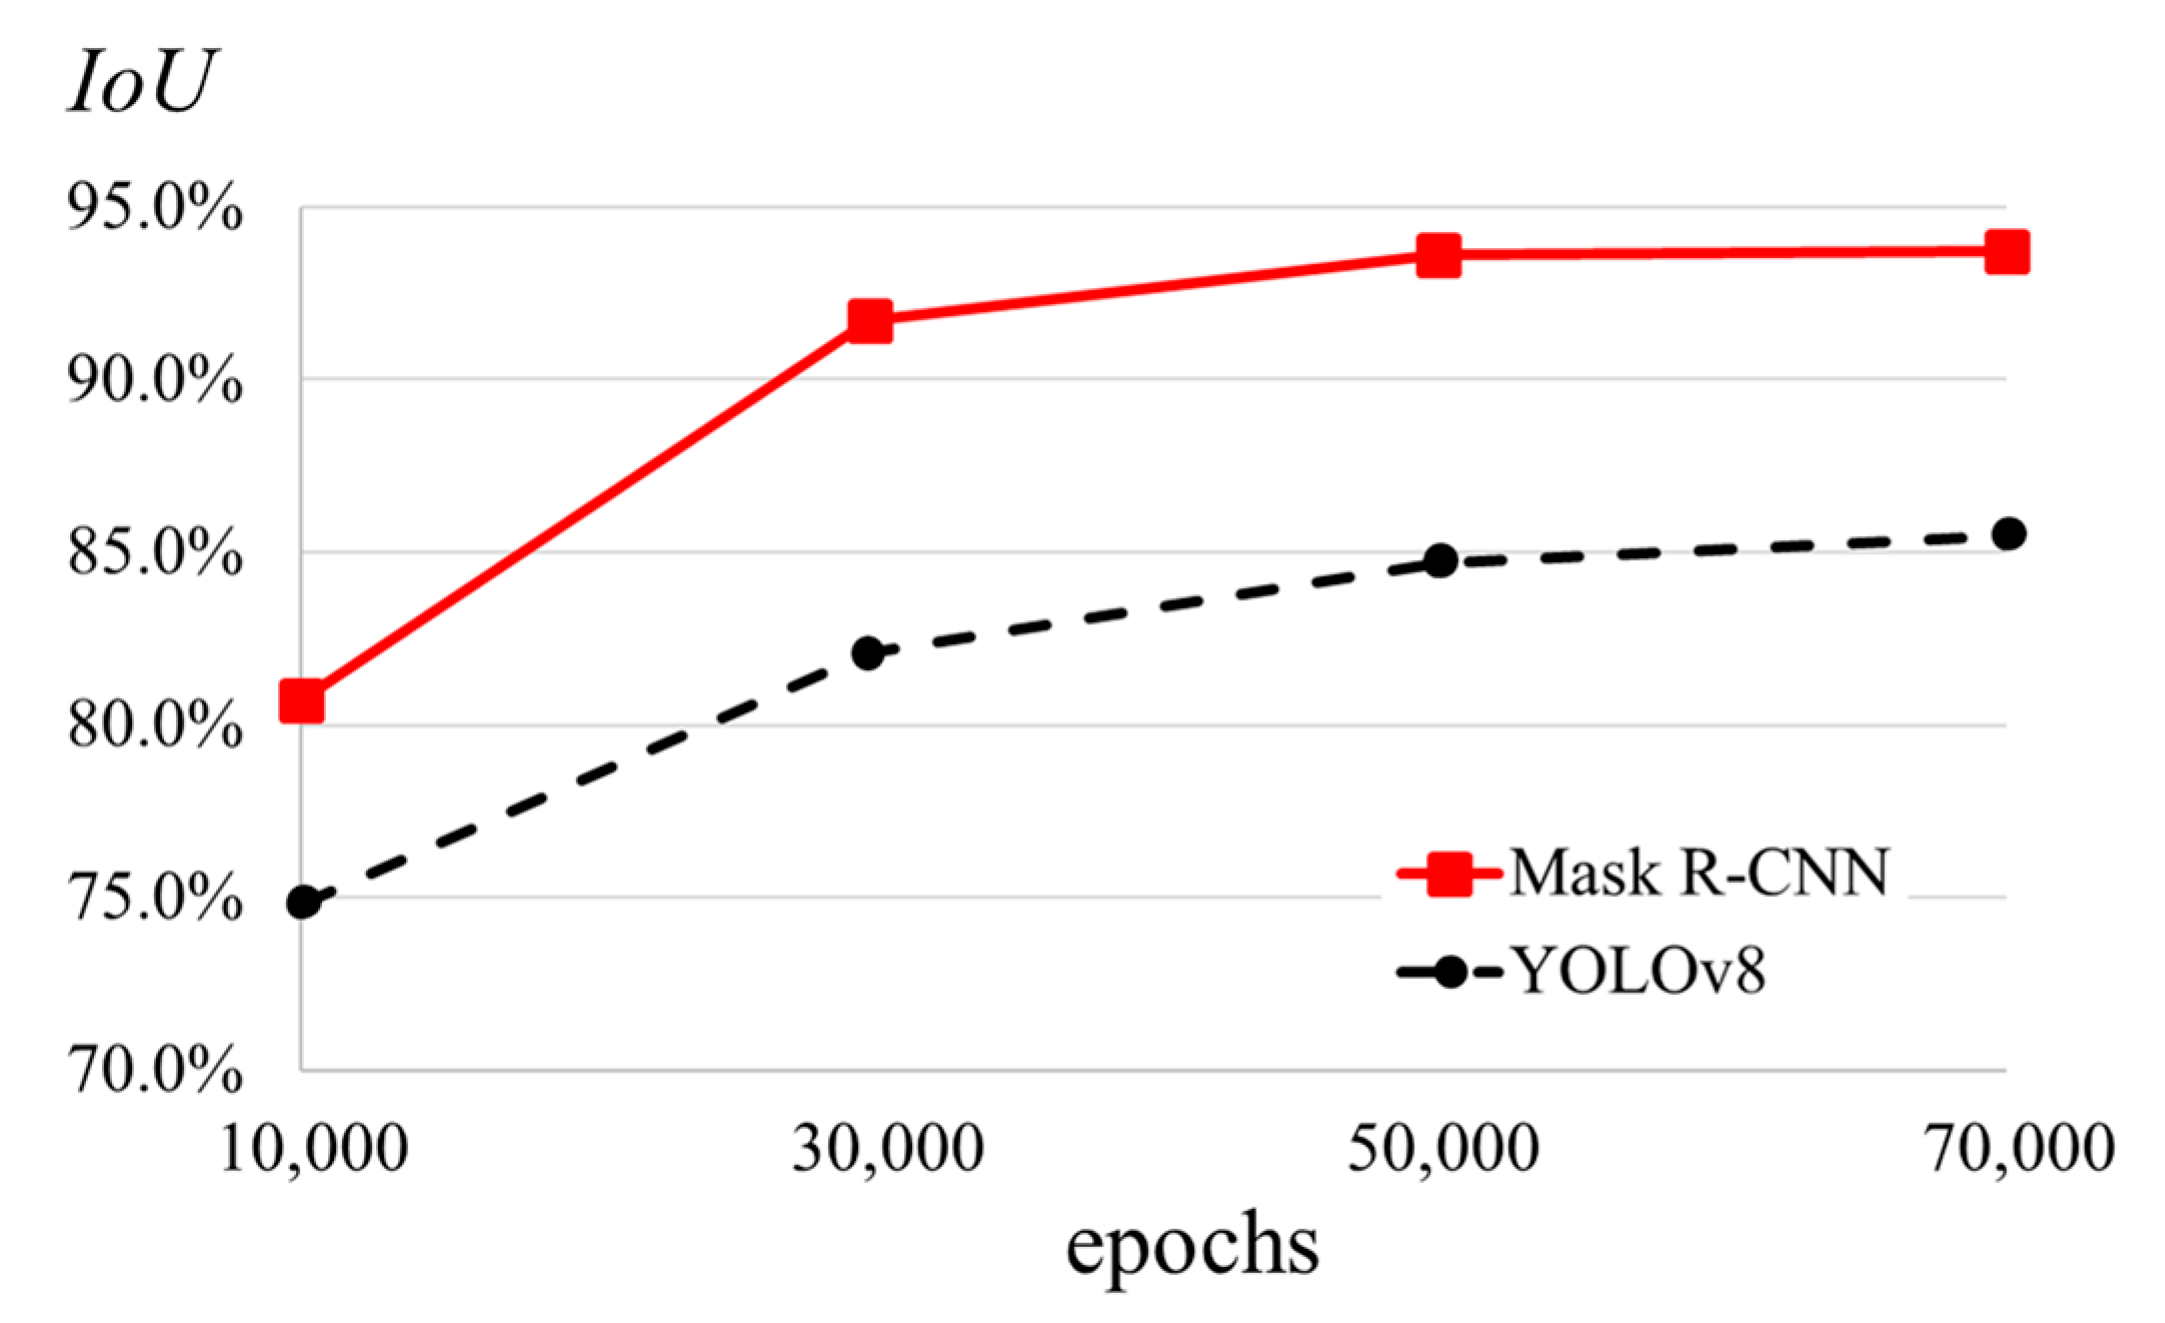
| Network | Epochs | No. of Detected Objects (Accuracy %) | No. of Correct Classification (Accuracy %) |
|---|---|---|---|
| Mask R-CNN | 10,000 | 202 (98.06%) | 191 (92.72%) |
| 30,000 | 204 (99.03%) | 196 (95.15%) | |
| 50,000 | 206 (100%) | 201 (97.57%) | |
| 70,000 | 206 (100%) | 201 (97.57%) | |
| YOLOv8 | 10,000 | 191 (92.72%) | 183 (88.83%) |
| 30,000 | 196 (95.15%) | 190 (92.23%) | |
| 50,000 | 200 (97.09%) | 196 (95.15%) | |
| 70,000 | 202 (98.06%) | 197 (95.63%) |
| Food Category | No. of Total Objects | No. of Detected Objects (Accuracy %) | No. of Correct Classification (Accuracy %) |
|---|---|---|---|
| Rice | 63 | 63 (100%) | 63 (100%) |
| Soup | 18 | 18 (100%) | 17 (94.44%) |
| Side-dish | 94 | 94 (100%) | 89 (94.68%) |
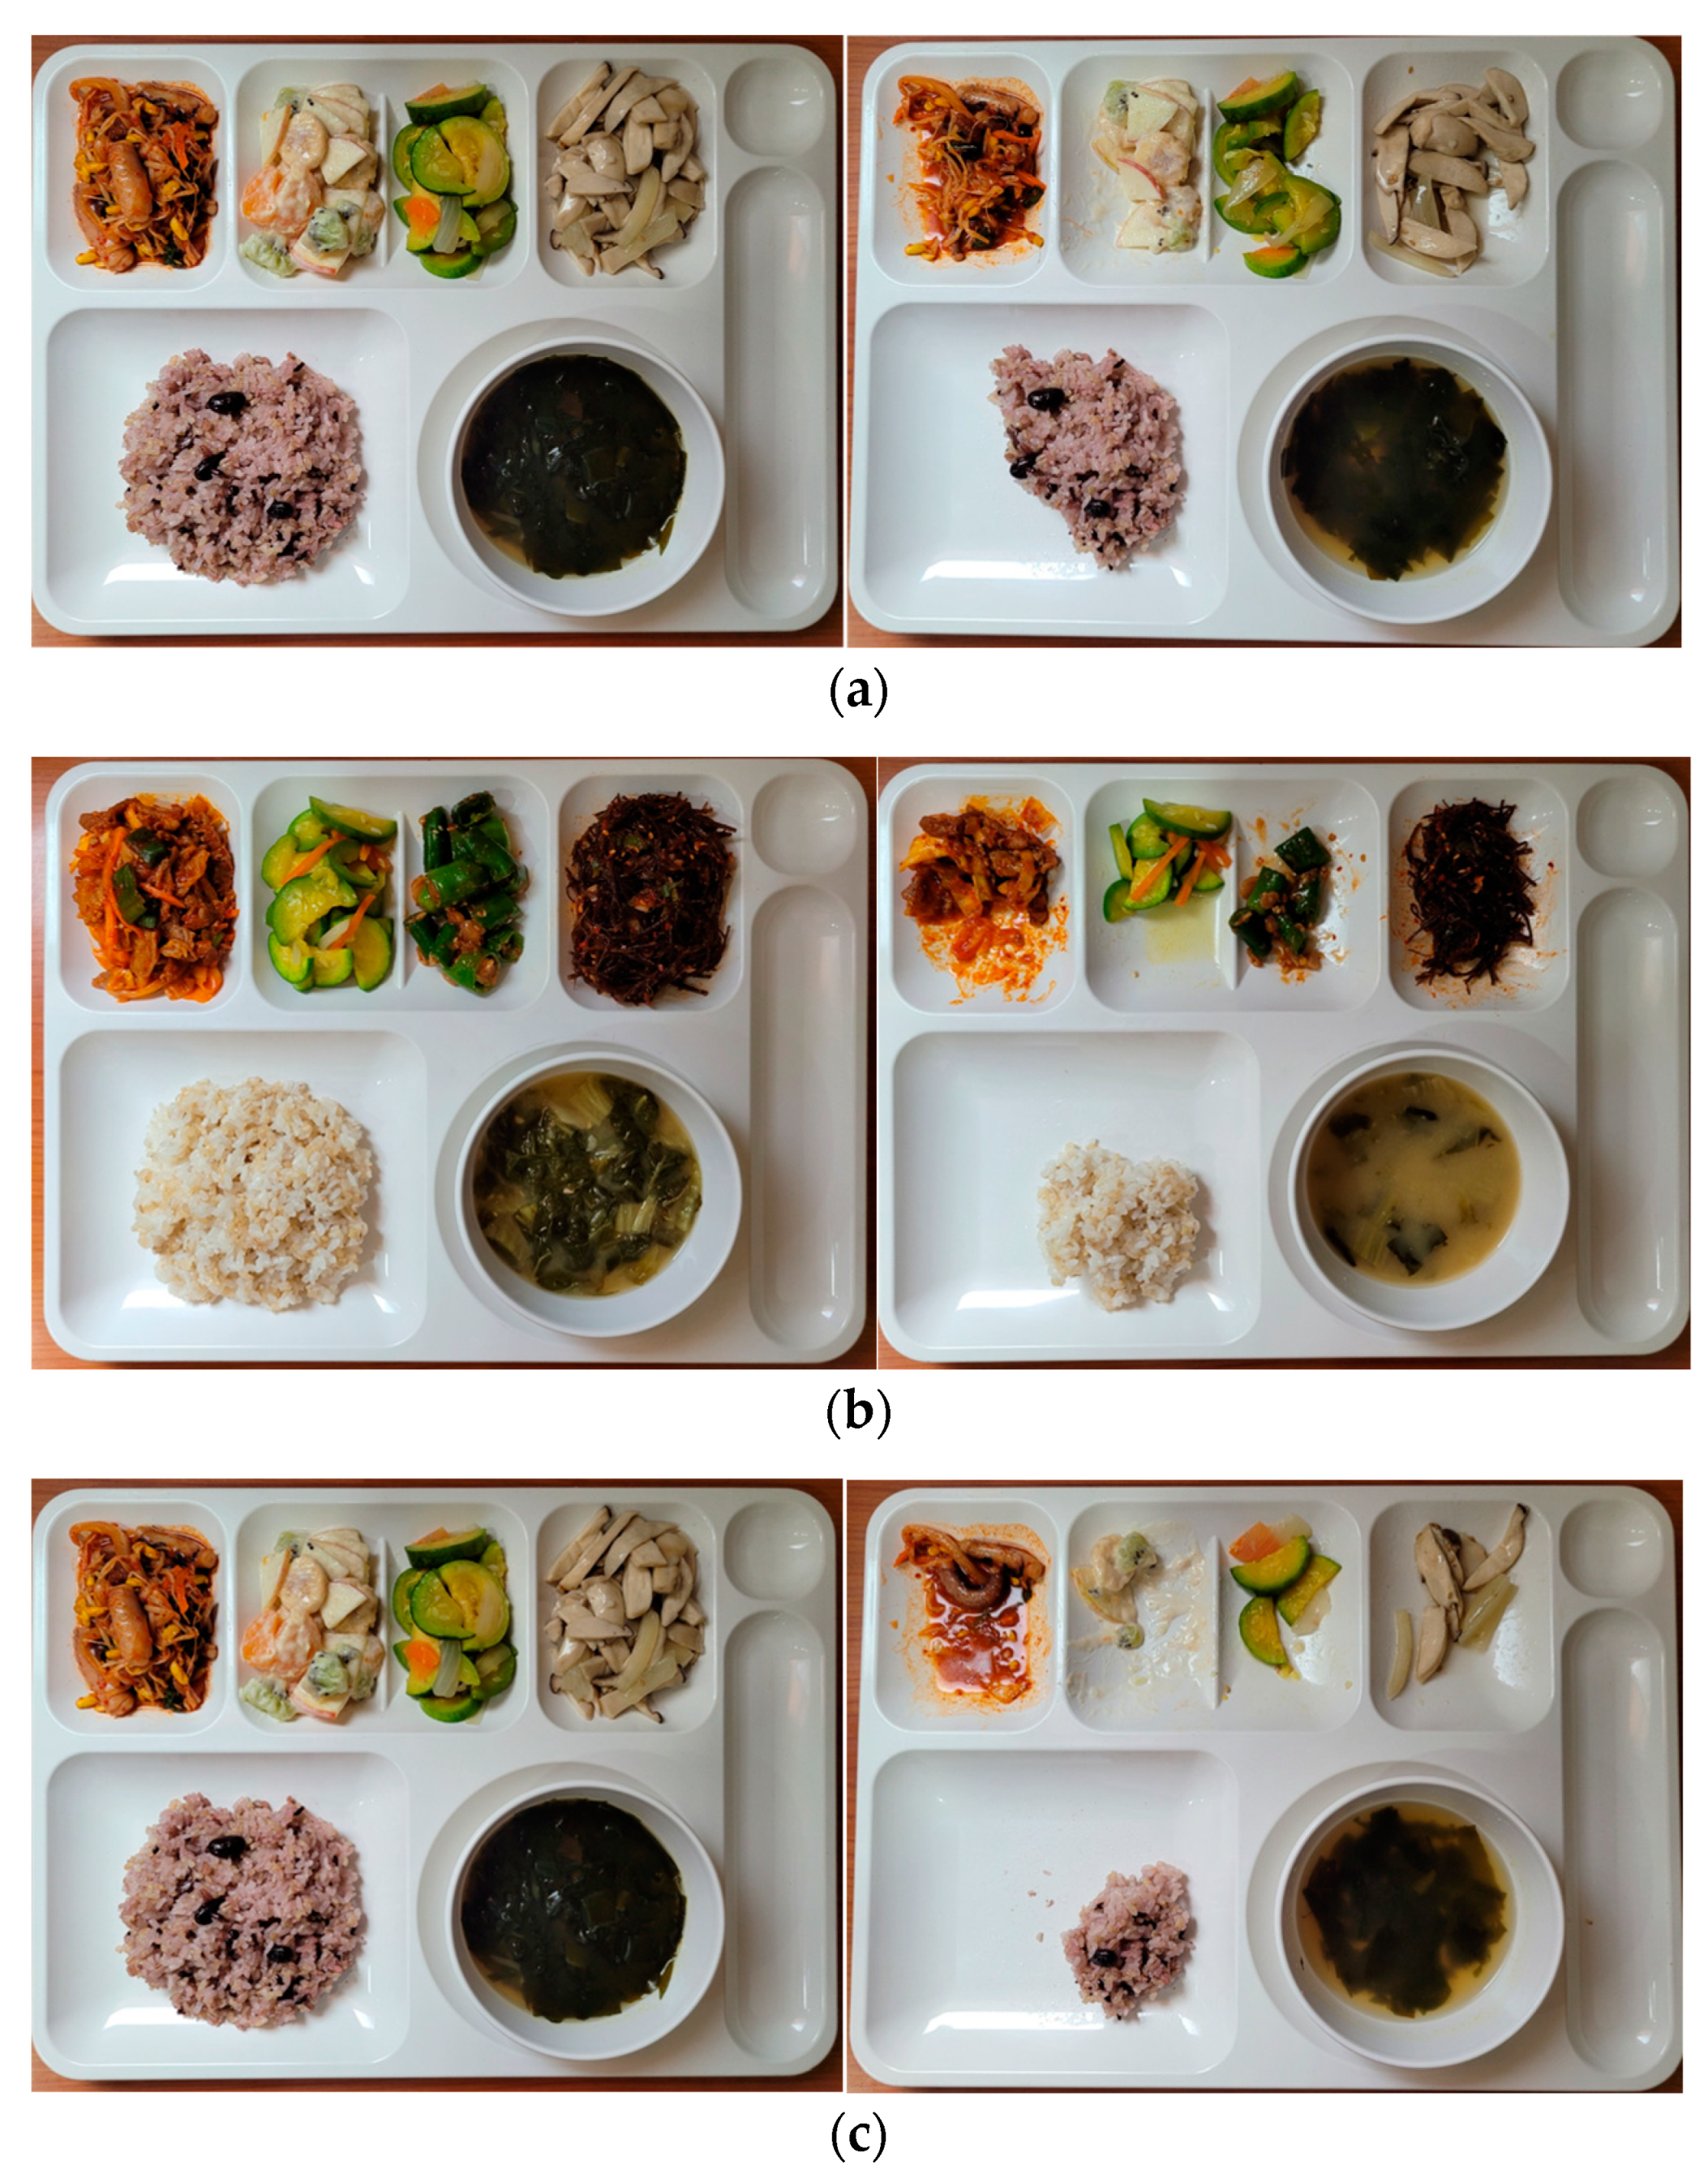
| Target | Food Category | Food Name | Food Volume of Pre-Meal Image (cm3) | Food Volume of Post-Meal Image (cm3) | Meal Intake Amount (cm3) |
|---|---|---|---|---|---|
| Figure 11a | Rice | Rice | 89.12 | 48.51 | 40.61 |
| Soup | Seaweed soup | 104.81 | 82.80 | 22.01 | |
| Side-dish 1 | Stir-fried octopus | 50.74 | 23.58 | 27.16 | |
| Side-dish 2 | Fruit salad | 26.41 | 17.15 | 9.26 | |
| Side-dish 3 | Stir-fried squash | 36.31 | 23.58 | 12.73 | |
| Side-dish 4 | Stir-fried mushroom | 50.74 | 36.31 | 14.43 | |
| Figure 11b | Rice | Rice | 89.12 | 26.41 | 62.71 |
| Soup | Sirak soup | 104.81 | 49.69 | 55.12 | |
| Side-dish 1 | Stir-fried pork | 50.74 | 5.69 | 45.05 | |
| Side-dish 2 | Stir-fried squash | 36.31 | 5.69 | 30.62 | |
| Side-dish 3 | Pepper seasoned | 17.15 | 3.30 | 13.85 | |
| Side-dish 4 | Seastring seasoned | 36.90 | 17.15 | 19.75 | |
| Figure 11c | Rice | Rice | 89.12 | 17.15 | 71.97 |
| Soup | Seaweed soup | 104.81 | 37.73 | 67.08 | |
| Side-dish 1 | Stir-fried octopus | 50.74 | 4.54 | 46.20 | |
| Side-dish 2 | Fruit salad | 26.41 | 3.30 | 23.11 | |
| Side-dish 3 | Stir-fried squash | 36.31 | 4.54 | 31.77 | |
| Side-dish 4 | Stir-fried mushroom | 50.74 | 12.84 | 37.90 |
Disclaimer/Publisher’s Note: The statements, opinions and data contained in all publications are solely those of the individual author(s) and contributor(s) and not of MDPI and/or the editor(s). MDPI and/or the editor(s) disclaim responsibility for any injury to people or property resulting from any ideas, methods, instructions or products referred to in the content. |
© 2023 by the authors. Licensee MDPI, Basel, Switzerland. This article is an open access article distributed under the terms and conditions of the Creative Commons Attribution (CC BY) license (https://creativecommons.org/licenses/by/4.0/).
Share and Cite
Kim, J.-h.; Lee, D.-s.; Kwon, S.-k. Food Classification and Meal Intake Amount Estimation through Deep Learning. Appl. Sci. 2023, 13, 5742. https://doi.org/10.3390/app13095742
Kim J-h, Lee D-s, Kwon S-k. Food Classification and Meal Intake Amount Estimation through Deep Learning. Applied Sciences. 2023; 13(9):5742. https://doi.org/10.3390/app13095742
Chicago/Turabian StyleKim, Ji-hwan, Dong-seok Lee, and Soon-kak Kwon. 2023. "Food Classification and Meal Intake Amount Estimation through Deep Learning" Applied Sciences 13, no. 9: 5742. https://doi.org/10.3390/app13095742
APA StyleKim, J.-h., Lee, D.-s., & Kwon, S.-k. (2023). Food Classification and Meal Intake Amount Estimation through Deep Learning. Applied Sciences, 13(9), 5742. https://doi.org/10.3390/app13095742