Article

Mechanical Properties of Disconnectable Coupling Joints for Steel Bracing under Eccentric Load

1
Key Laboratory of Advanced Functional Materials, Ministry of Education, Faculty of Materials and Manufacturing, Beijing University of Technology, Beijing 100124, China
2
Beijing Municipal Engineering Research Institute, Beijing 100037, China
3
Key Laboratory of Urban Security and Disaster Engineering, Ministry of Education, Beijing University of Technology, Beijing 100124, China
*
Author to whom correspondence should be addressed.
Appl. Sci. 2023, 13(9), 5596; https://doi.org/10.3390/app13095596
Submission received: 20 March 2023 / Revised: 14 April 2023 / Accepted: 20 April 2023 / Published: 30 April 2023
(This article belongs to the Special Issue Urban Underground Engineering: Excavation, Monitoring, and Control)

Abstract

:
Disconnectable coupling (DC) joints of steel bracing in foundation pit engineering are inevitably subjected to eccentric load, but their mechanical properties under eccentric load have not been thoroughly investigated. Based on full-scale test results of DC joints under axial compression, a validated finite element model was established. The bearing capacity and flexural performance of DC joints under eccentric load were studied systematically through a series of numerical simulations. These parameters included the length, width and height of the steel wedge; eccentricity; steel tube wall thickness; channel steel thickness and middle-rib plate height. Based on the numerical results, a modified moment–rotation model was established. The results obtained show that the numerical models accurately reflect the failure mode and the load-displacement curves revealed by the full-scale test. The bearing capacity and flexural performance of DC joints decreases with eccentricity, middle-rib plate height, and steel wedge height. The effect of eccentricity is the most significant. By contrast, the bearing capacity and flexural performance of DC joints increases with steel wedge length, steel wedge width, channel steel thickness and steel tube wall thickness. The modified moment–rotation model can describe the flexural performance of DC joints accurately under eccentric load.

1. Introduction

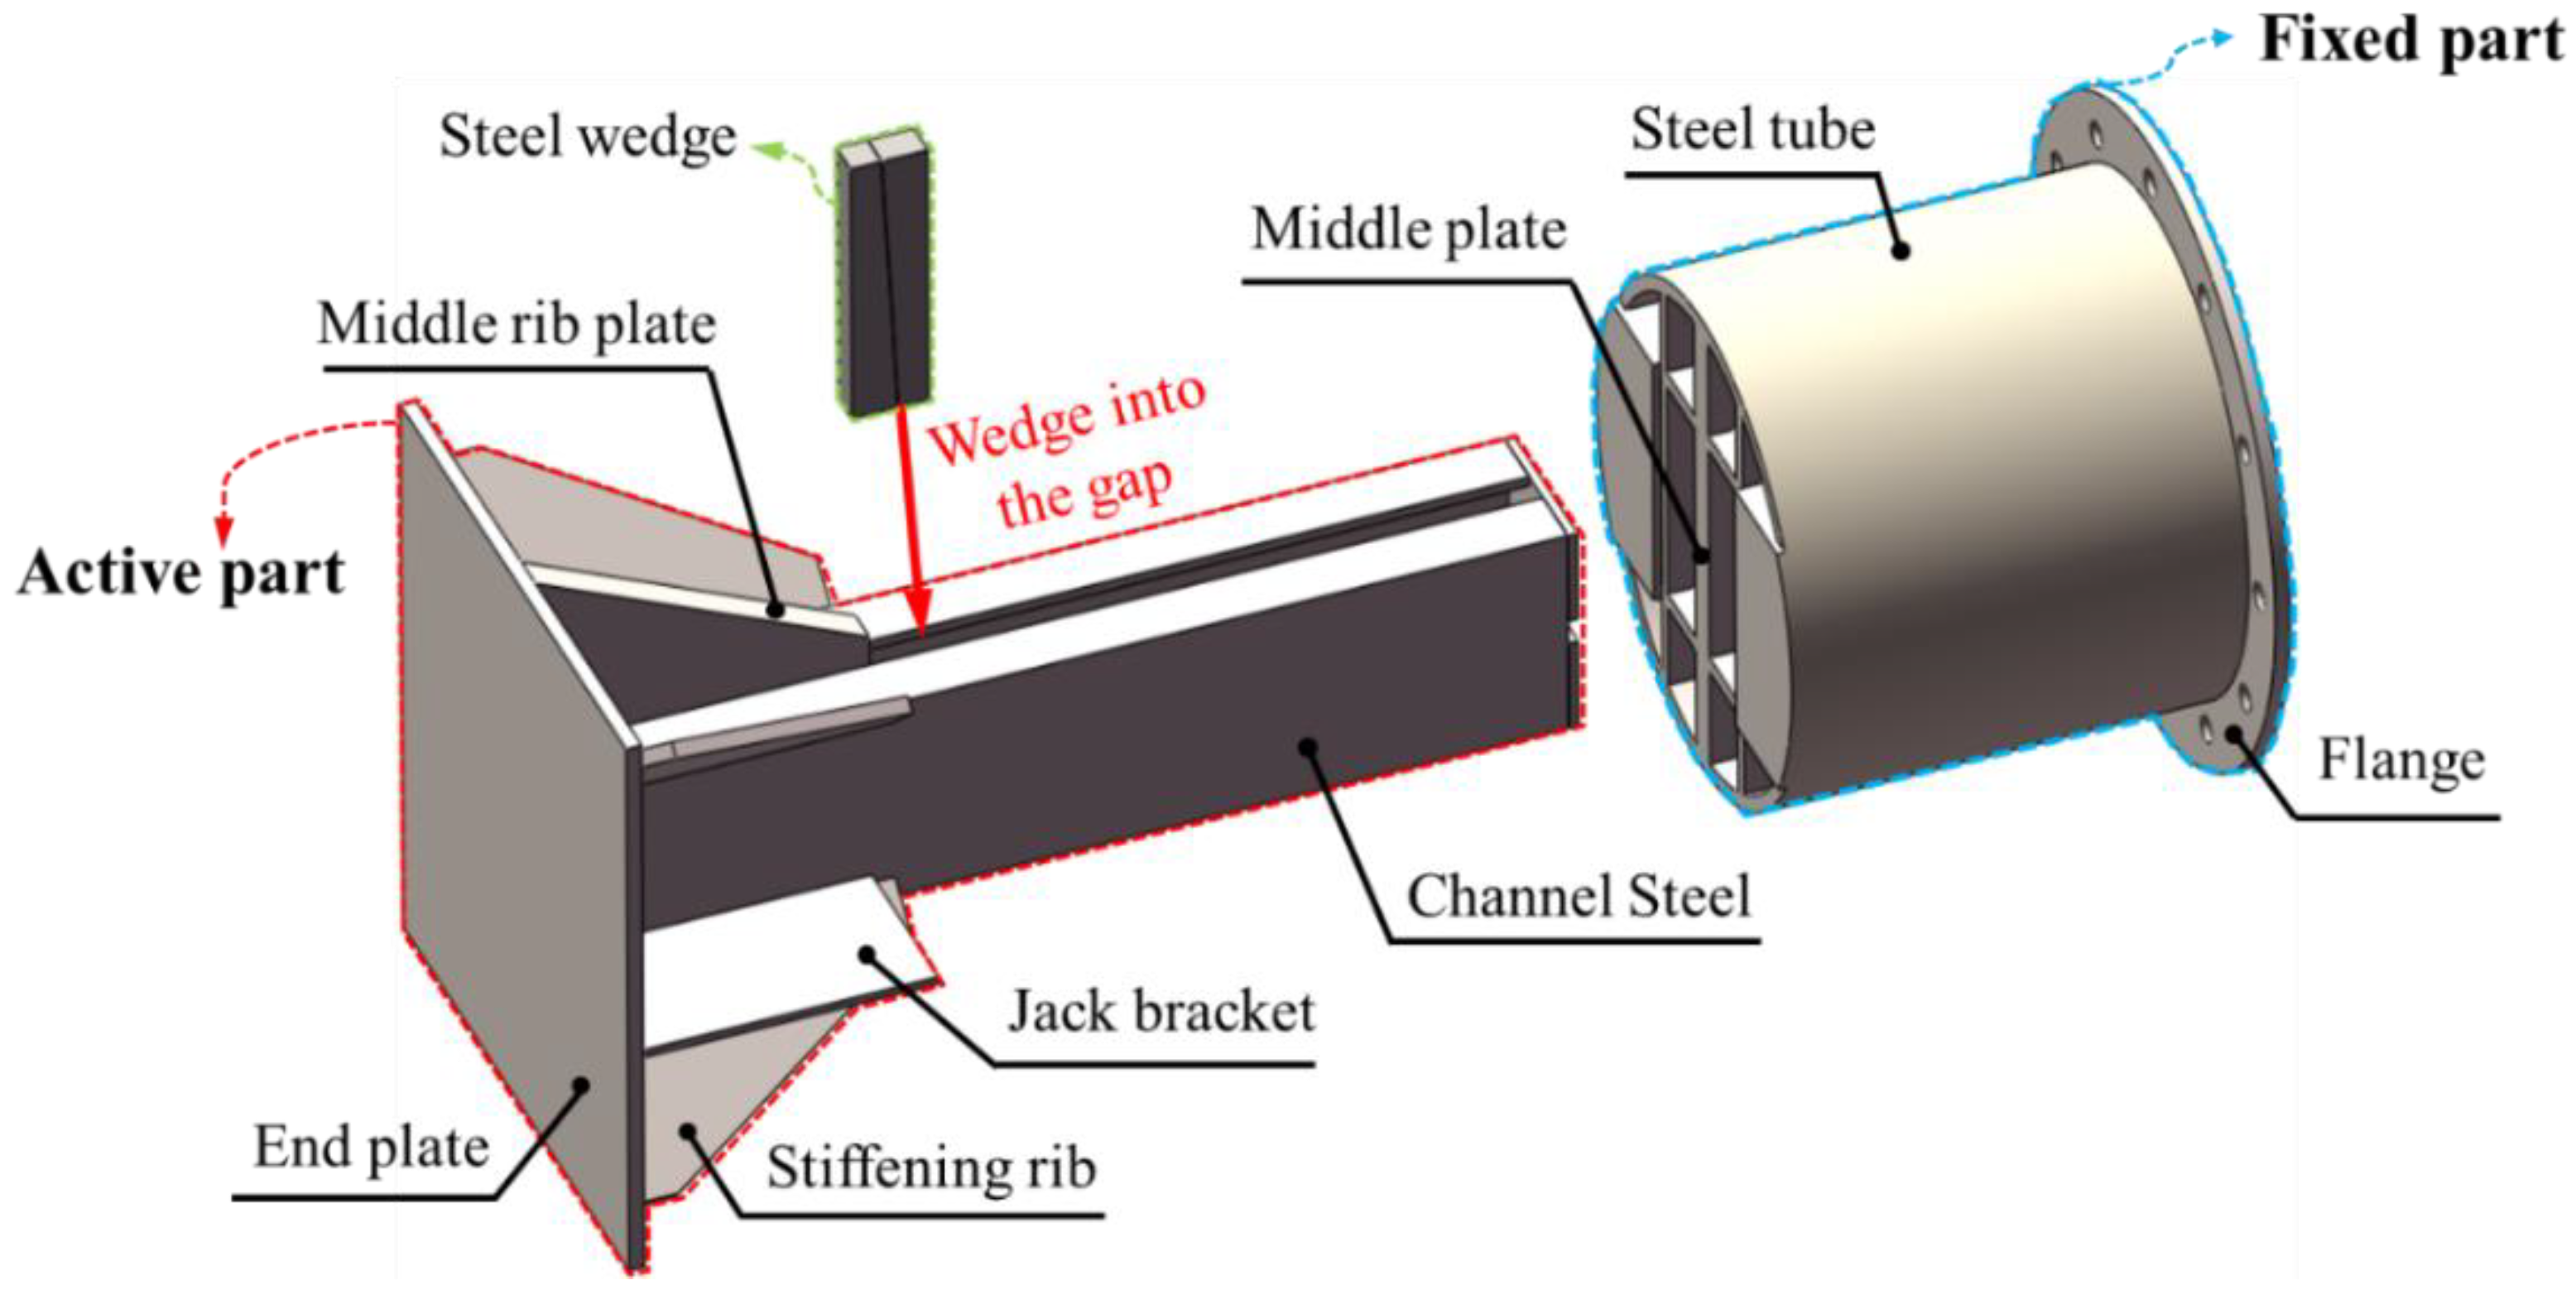
At present, the “row pile plus steel support” internal support system is widely used in foundation pit engineering [1,2,3]. This support system improves the overall bearing capacity of a foundation pit through prestressing [4,5], so that the deformation of the foundation pit is effectively controlled. The DC joint is the device to apply and maintain prestressing [6]. The “row pile plus steel support” internal supporting system of the foundation pit is shown in Figure 1. The DC joint is a crucial connection between steel support and row piles, composed of steel wedges, a fixed part and an active part, as revealed in Figure 2. The role of the end plate is to connect the steel support with the purlin or top beam. The jack bracket is used to place the jack. The DC joint and the steel support are associated by flange and bolt. An essential advantage of DC joints is convenient installation. The active part is separated gradually from the fixed part by the jack, and prestress is applied. The steel wedges are wedged between the fixed part and active part when the design value of prestressing is achieved; then, the jack is removed. Therefore, the critical role of the DC joints is to apply prestress to the whole support system. The DC joint sits at the junction of the vertical member and the horizontal member, which is a crucial joint connecting the row pile and the steel support. The importance of the joints generally exceeds the components which connect to them [7], since the failure of joints can arouse the progressive collapse of row piles. Further, the transfer path of force at the joint is more complex and fuzzier than that of the components which it connects to. Therefore, the influence of the DC joints should be considered when evaluating the mechanical properties of the steel support system. Current research on joints mainly focuses on the joints of frame structures [8,9,10] and beam-column structures [11,12,13], such as K-joints [14,15], T-joints [16,17,18], and X-joints [19]. The research on DC joints is relatively minor. Most studies focus on bearing capacity under axial compression. For example, The literature [20] studied the mechanical properties of DC joints through experimental methods, and corresponding improvements were proposed. The literature [21] improved the DC joint. The load holding performance of the improved DC joints increased about 30%, verified by field test. The literature [22] systematically analyzed the strain evolution process, load-displacement curves and failure modes of DC joints under axial load, and the fitting formulas of bearing capacity indexes were obtained.
DC joints inevitably bear eccentric load [23,24], due to the incomplete vertical of the embedded steel plate at the connection, in addition to other quality problems. Local buckling, or even overall instability of the support system, is easily caused by eccentric load [25]. Eccentric compression reduces the bearing capacity of the support system [26]. Therefore, the flexural performance of DC joints affects the bearing capacity of the whole support system. Currently, the research on the flexural performance of DC joints focuses chiefly on improved DC joints. The literature [27] studied the influence of eccentricity on the bearing capacity of disconnectable coupling with a rectangular plate through numerical simulation and theoretical calculation. The results showed that the ultimate bearing capacity of disconnectable coupling with a rectangular plate decreases by 20% when the eccentricity increases from 0 to 30 cm. The literature [28] experimentally studied the mechanical properties of disconnectable coupling with a bolt fasten wedge under eccentric load. The results showed that the compression stiffness of disconnectable coupling with a bolt fasten wedge was clearly outstanding; the fracture of the bolts was irregular.
The moment–rotation model is usually used to describe the flexural performance of structures. At present, research on the moment–rotation model of DC joints is relatively lacking. Most similar research focuses on frame construction, which is worthy of interest. The literature [29] put forward a multi-parameter exponential model for semi-rigid joints. The literature [30] provided a three-parameter exponential model to describe the moment–rotation curves of top-and seat-angles with or without double web-angle connections. The literature [31] fitted a four-parameter moment–rotation model of rectangular steel frames. The literature [32] proposed a method to calculate the rotational deformation of semi-rigid end plate connections of steel structures. The moment–rotation curve can be calculated accurately using this method. As the chief semi-rigid joint in the internal support system, it is necessary to study the flexural performance and moment–rotation model of DC joints.
In this paper, a study of the mechanical properties of DC joints under eccentric load for steel bracing in foundation pit engineering is reported. To begin, a finite element model was established based on the test results of axial compression experiments in the literature [22], and its accuracy and reliability were verified. Then, the influence of eccentricity and key position parameters on the bearing capacity and flexural performance of DC joints under eccentric load was studied through numerical simulation. Finally, a moment–rotation model for DC joints is proposed and the initial rotational stiffness and moment resistance of the numerical results are compared with the calculation results. At present, research on DC joints mostly focus on bearing performance under axial loads, while research on bearing performance, flexural performance and a moment–rotation model of DC joints under eccentric loads are lacking. Therefore, the research content of this paper is meaningful.

2. Numerical Model and Verification

2.1. Finite Element Model

In the literature [22], the mechanical properties of DC joint specimens under axial load were studied experimentally, and the load-displacement curve and ultimate failure mode of the specimens—welded with Q235 steel [33]—were obtained [22]. The experimental results showed that the weld was not cracked. Therefore, the welds are set as a rigid connection in the numerical models. The geometric dimension of the numerical models is consistent with that of the specimens, as displayed in Figure 3.
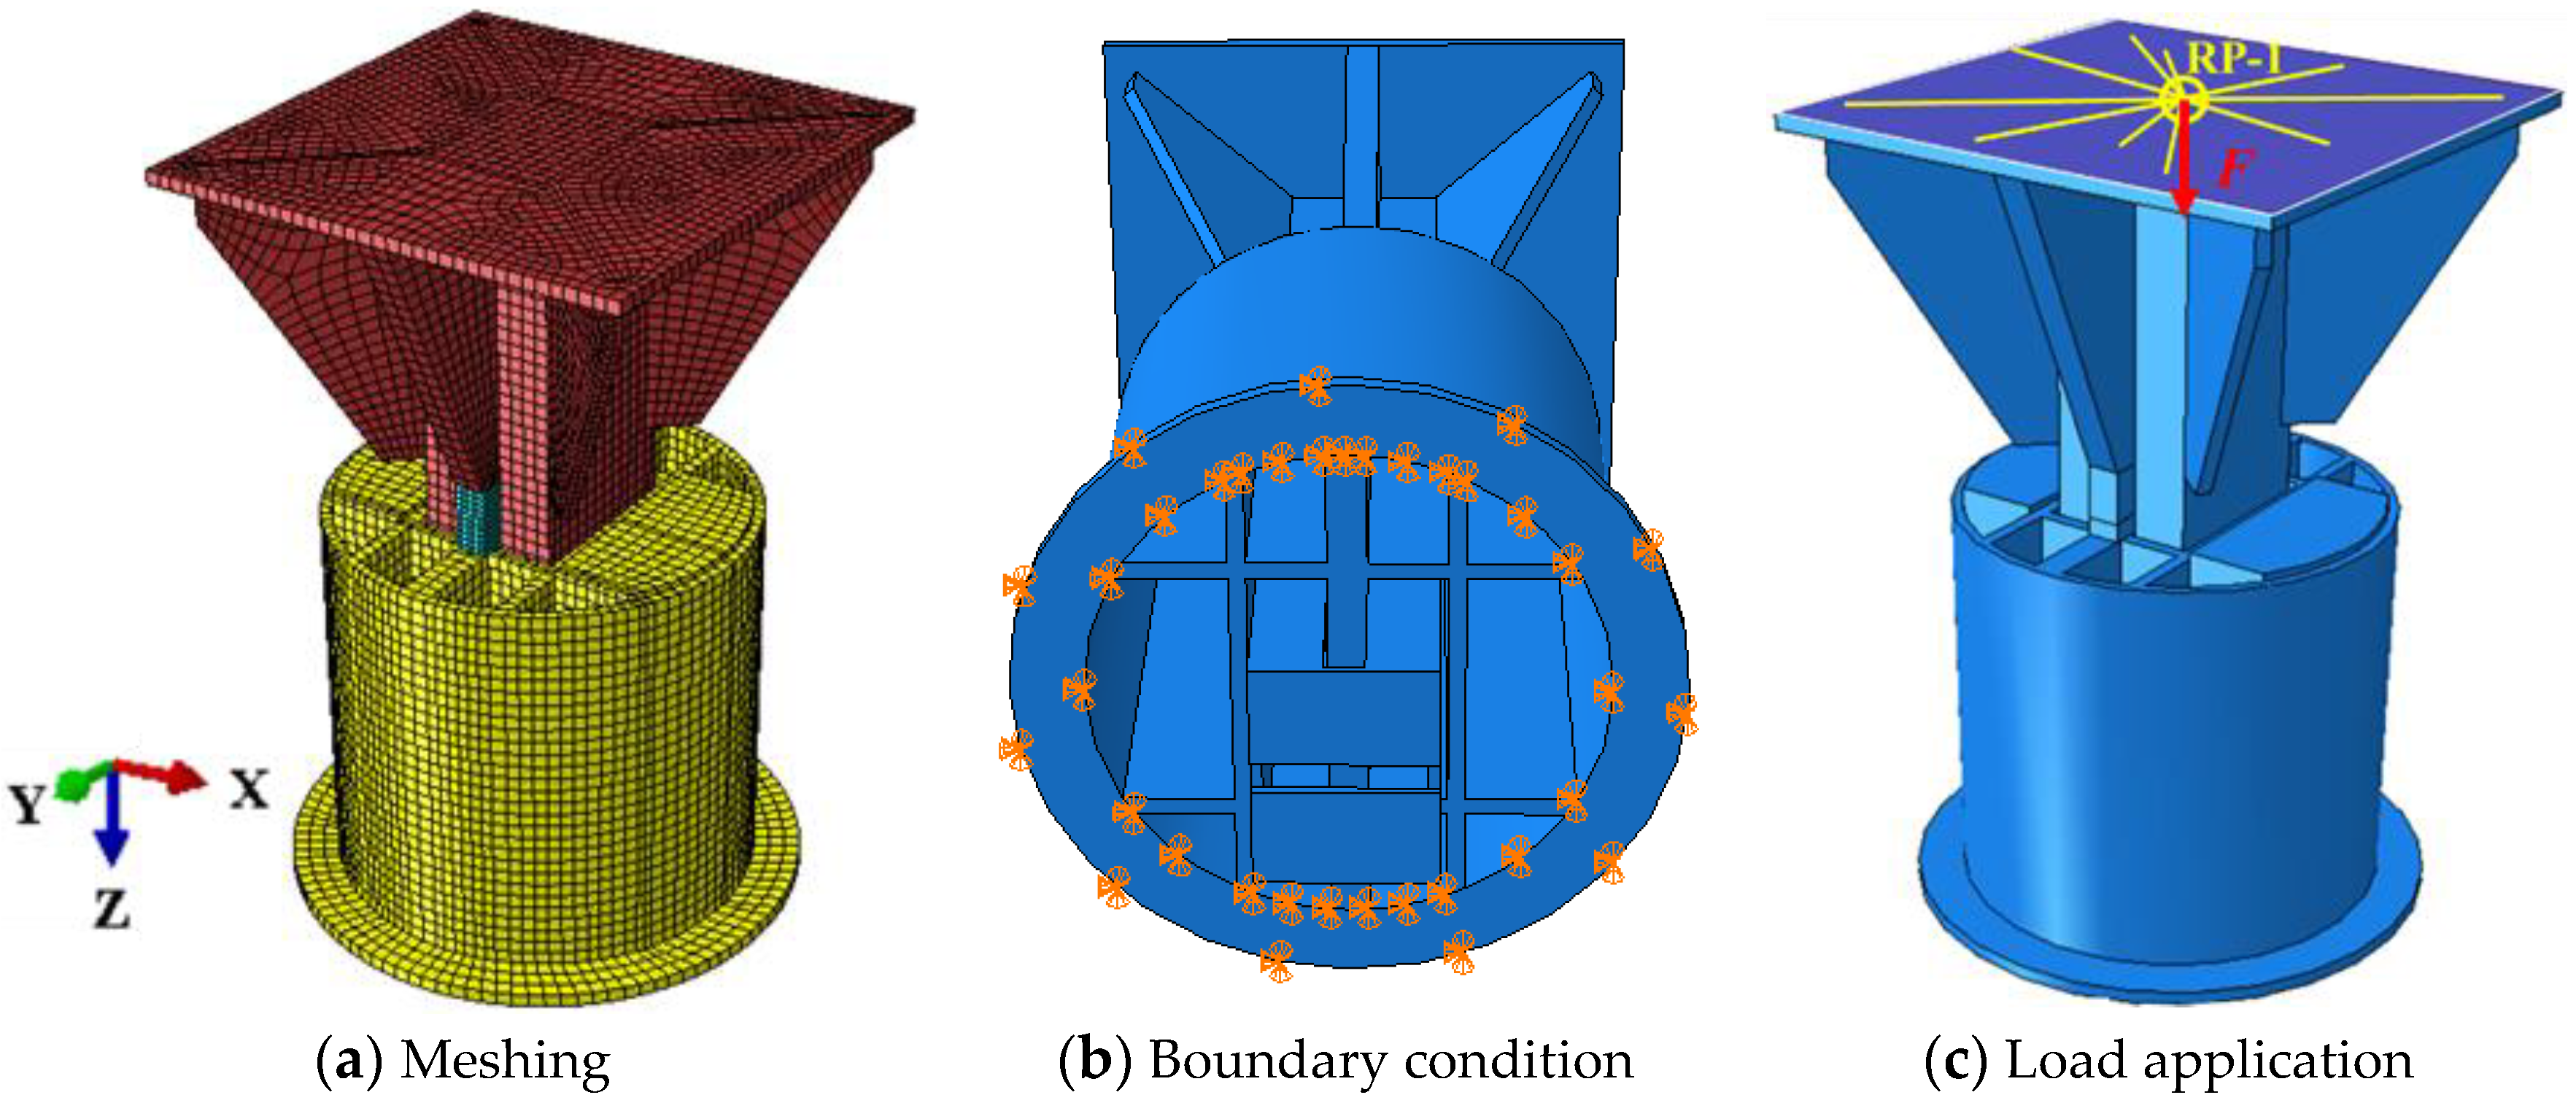
The yield strength, ultimate strength, Young’s modulus and true stress–strain relationship of Q235 steel were obtained through experiments by the literature [34,35]. The physical and mechanical parameters of materials are shown in Table 1 and Table 2. A numerical model of DC joints was constructed in the FEM software package ABAQUS 2016/Standard. The numerical model was meshed with the C3D8I element. C3D8I is an improved version of the C3D8 element, and is an incompatible mode 8-node brick element. In the bending problem, the result equivalent to the quadratic element can be obtained with fewer elements in the thickness direction, which greatly reduces the calculation cost. A total of 22,508 meshes were obtained. The finite element model is listed in Figure 4a. The boundary condition of the model is only to restrict the movement of the flange plate completely. The rotation of the flange is free, as shown in Figure 4b. The numerical model adopts the contact form of surface to surface. The normal contact method adopts hard contact. Tangential contact is applied in a penalty calculation, and the friction coefficient is 0.2 [34]. To accurately simulate the interaction between the loading plate and end plate, the reference point RP-1 is established, and the outer surface of the end plate is connected to the center of RP-1 through kinematic coupling. A concentrated force is applied at RP-1, as shown in Figure 4c. Two steps are set, gravity is applied at the first step, and the concentrated force is applied at the second step. The concentration force increases from 0 to 6200 kN, and its increment is 1%.

2.2. Validation of Finite Element Model

2.2.1. Failure Mode

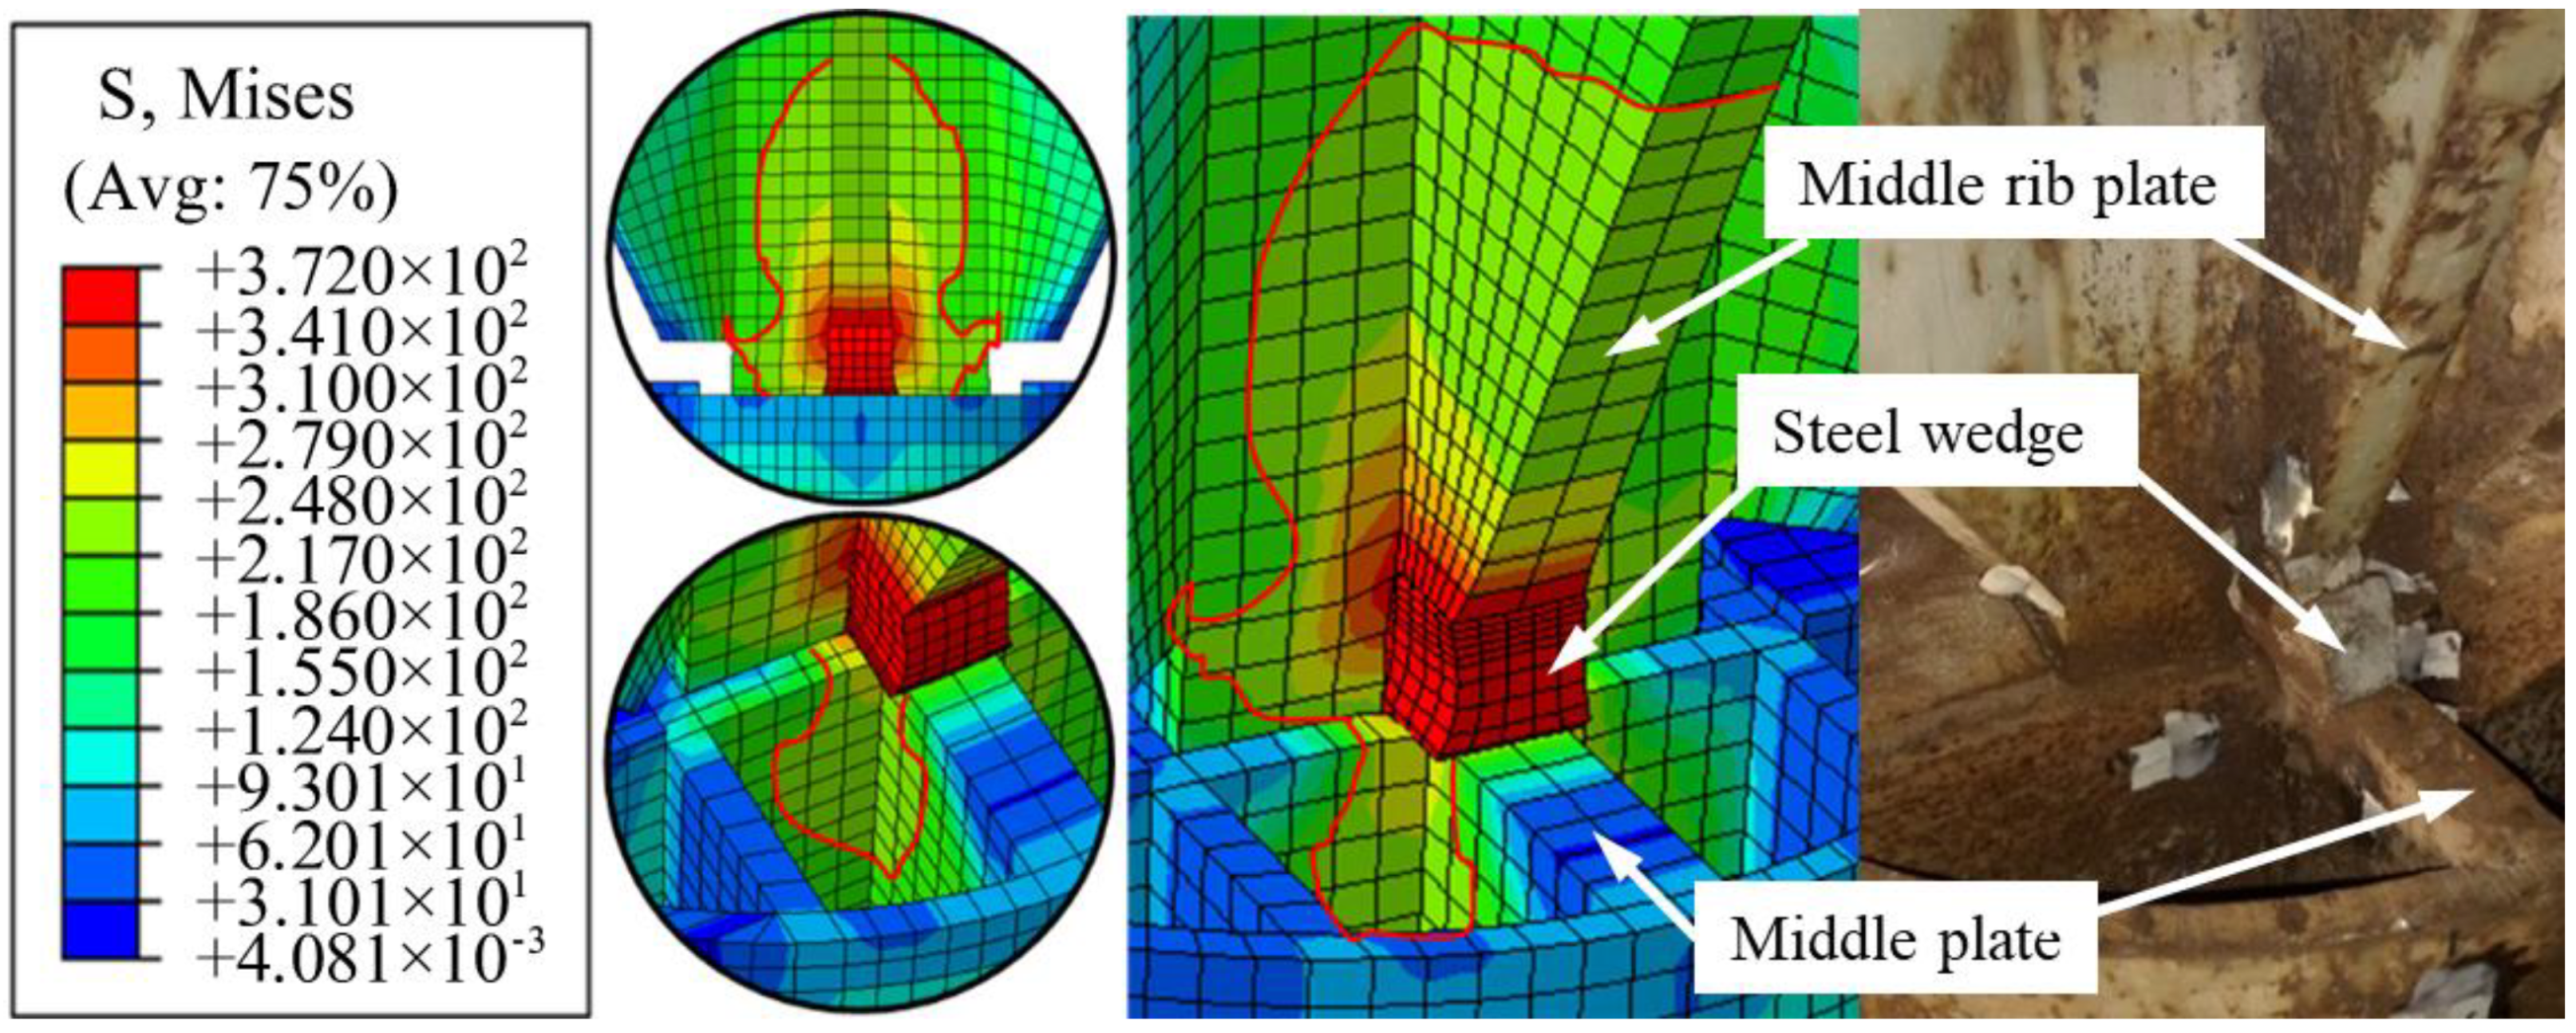
The failure mode of the model in the numerical results is consistent with the experiment. Only the steel wedges are excessively deformed, and there is no other obvious failure in the specimen. According to the von Mises stress nephogram shown in Figure 5, the contact area (inside the red line) of channel steel, middle-rib plate and steel wedge generate the evident stress concentration. Further, the material in the area marked by the red line has yielded. Plastic strain emerges in the contact zone, which is consistent with the failure mode and strain distribution of the test results.

2.2.2. Load-Displacement Curve

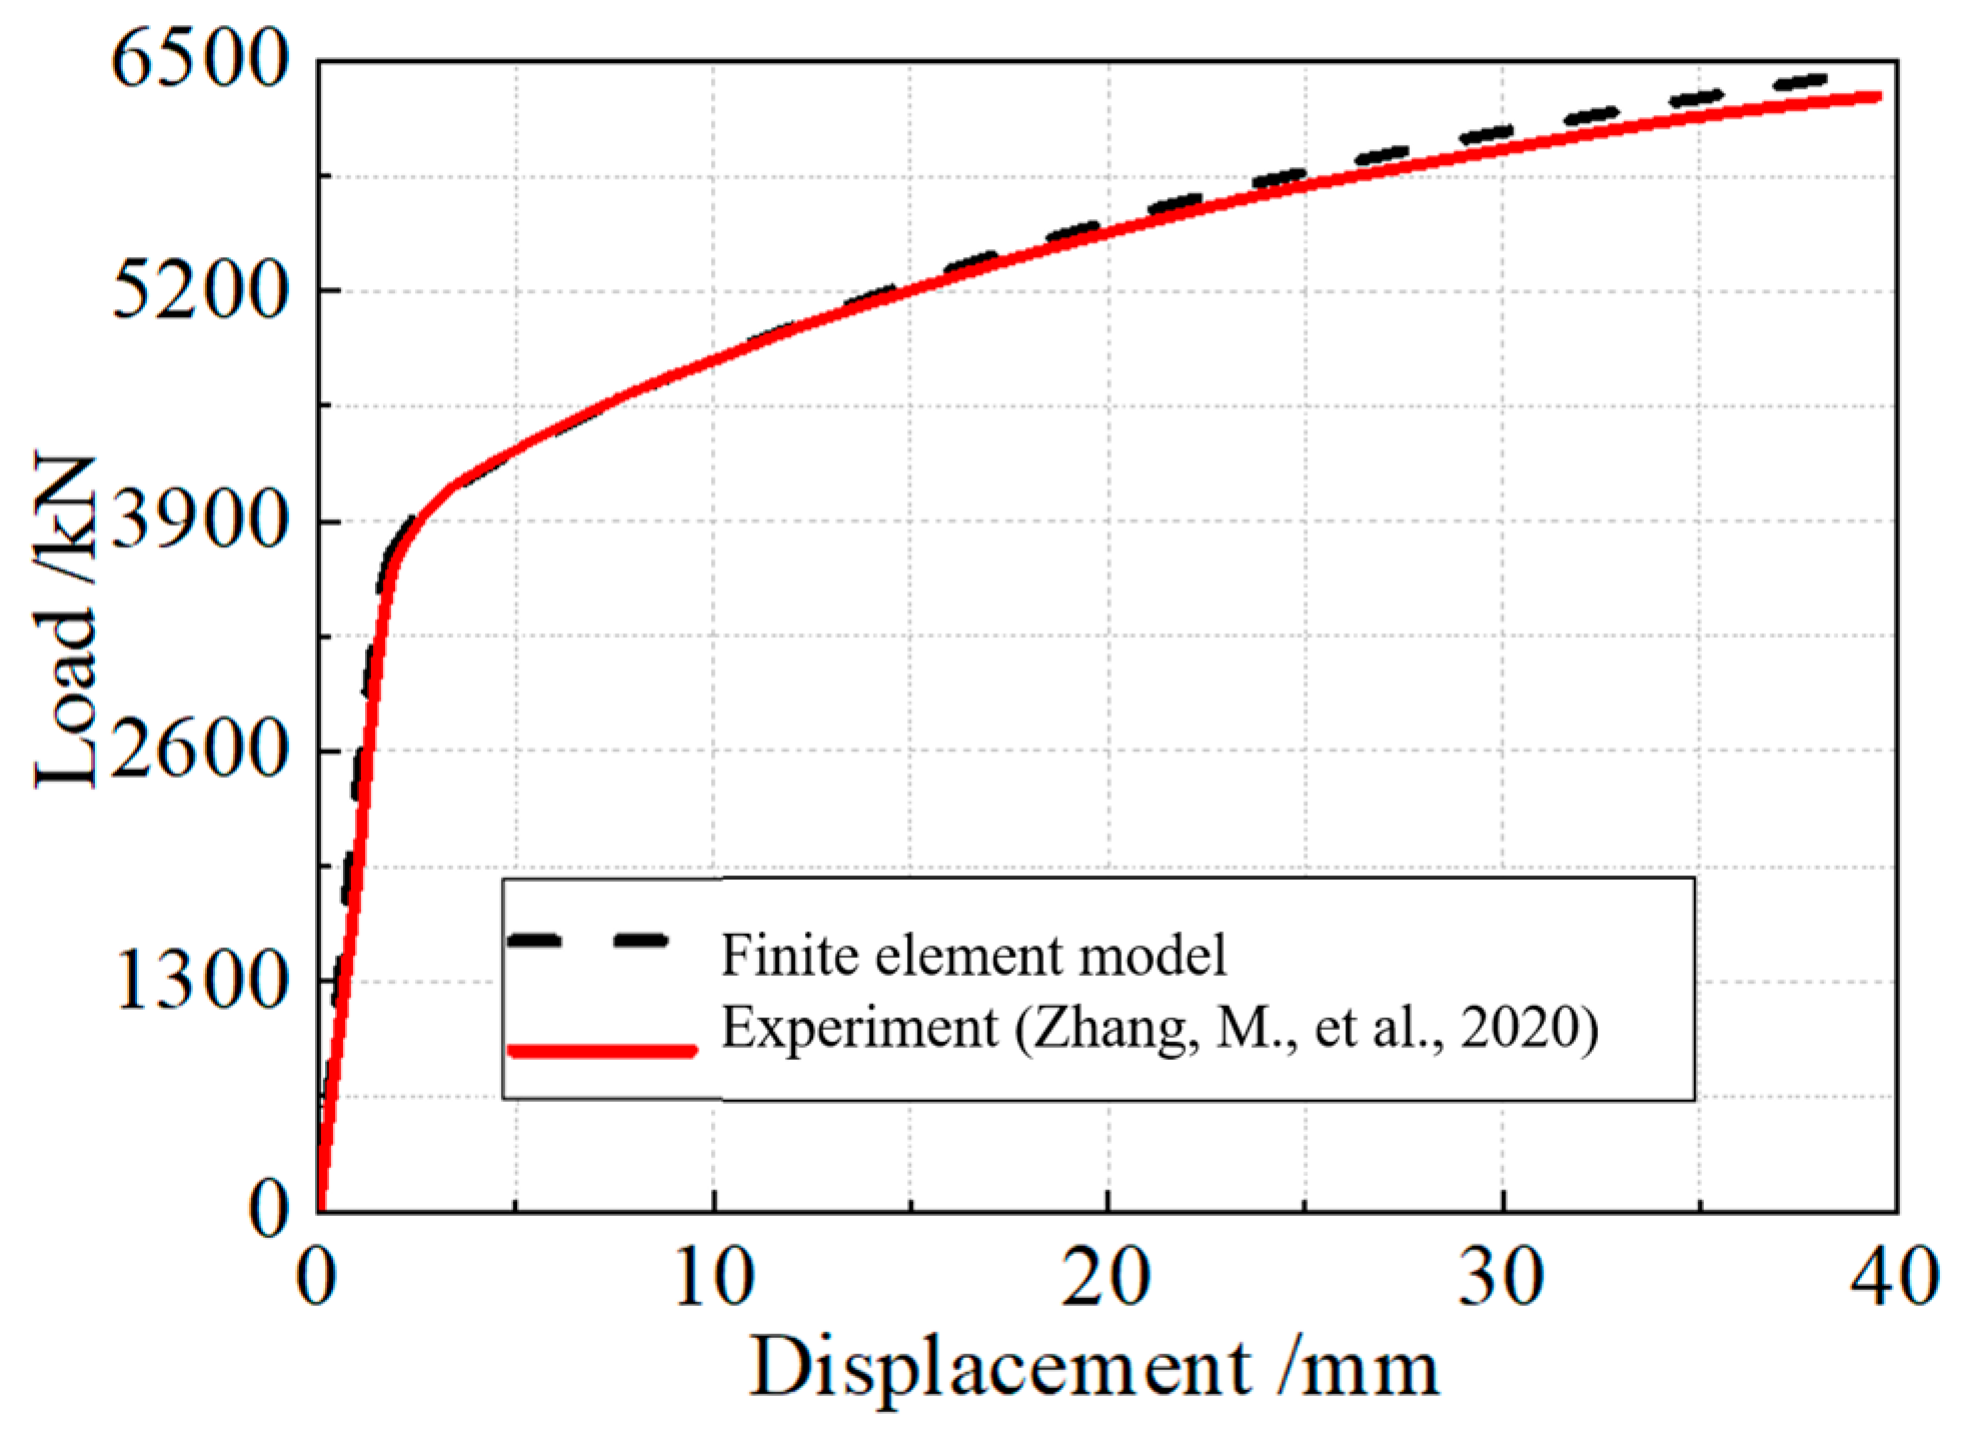
The load-displacement curve obtained through numerical results agrees well with that obtained by the experiment, as shown in Figure 6. There is a slight difference between the experimental results and numerical results in the later loading stage. However, joint deformation is limited to a certain extent in engineering applications; a single joint will not evince excessive deformation. The initial compression stiffness and yield load obtained by the numerical results agree well with the experiment results, especially in the elastic stage.
Taken together, comparison of the numerical results and experiment results shows that the numerical model can accurately estimate the stress distribution and deformation characteristics of DC joints. The established model and physical and mechanical parameters are reasonable, and the load is an external factor. Therefore, the finite element model of DC joints can also be reliably used for numerical analysis under different load conditions. A study of bearing capacity and flexural performance are carried out under eccentric load through the finite element model.

3. Response Feature under Eccentric Load

3.1. Loading Method of Eccentric Load

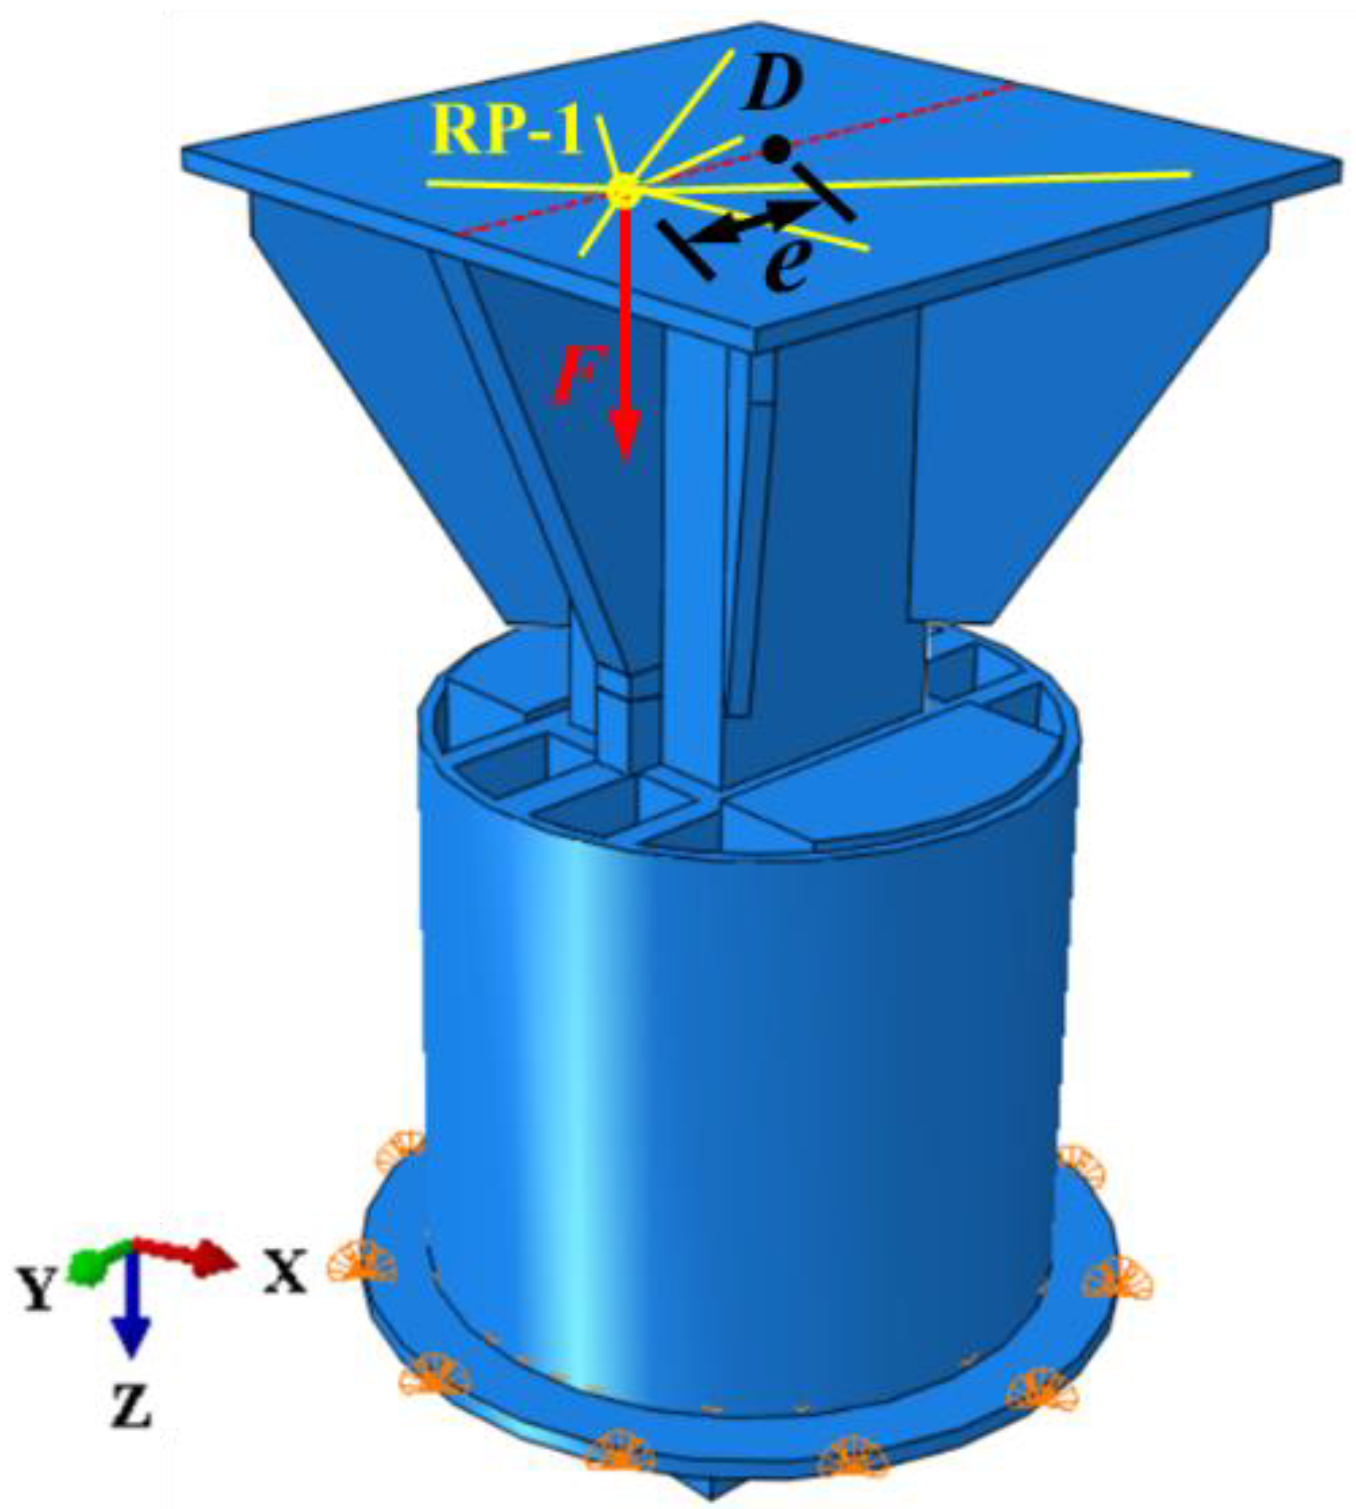
The response feature of DC joints is studied using the numerical model established in Section 2.1 under eccentric compression. The eccentric direction is along the middle-rib plate. Eccentricity is achieved through adjusting the position of RP-1. The distance between RP-1 and the centre of the outer surface of the end plate (point D) is the eccentricity of the joint. The concentrated force still applies at RP-1. The concentration force increases from 0 to 5000 kN, and its increment is 1%. The application of eccentric load in the finite element model is shown in Figure 7.

3.2. Results of Numerical Simulation

3.2.1. Deformation

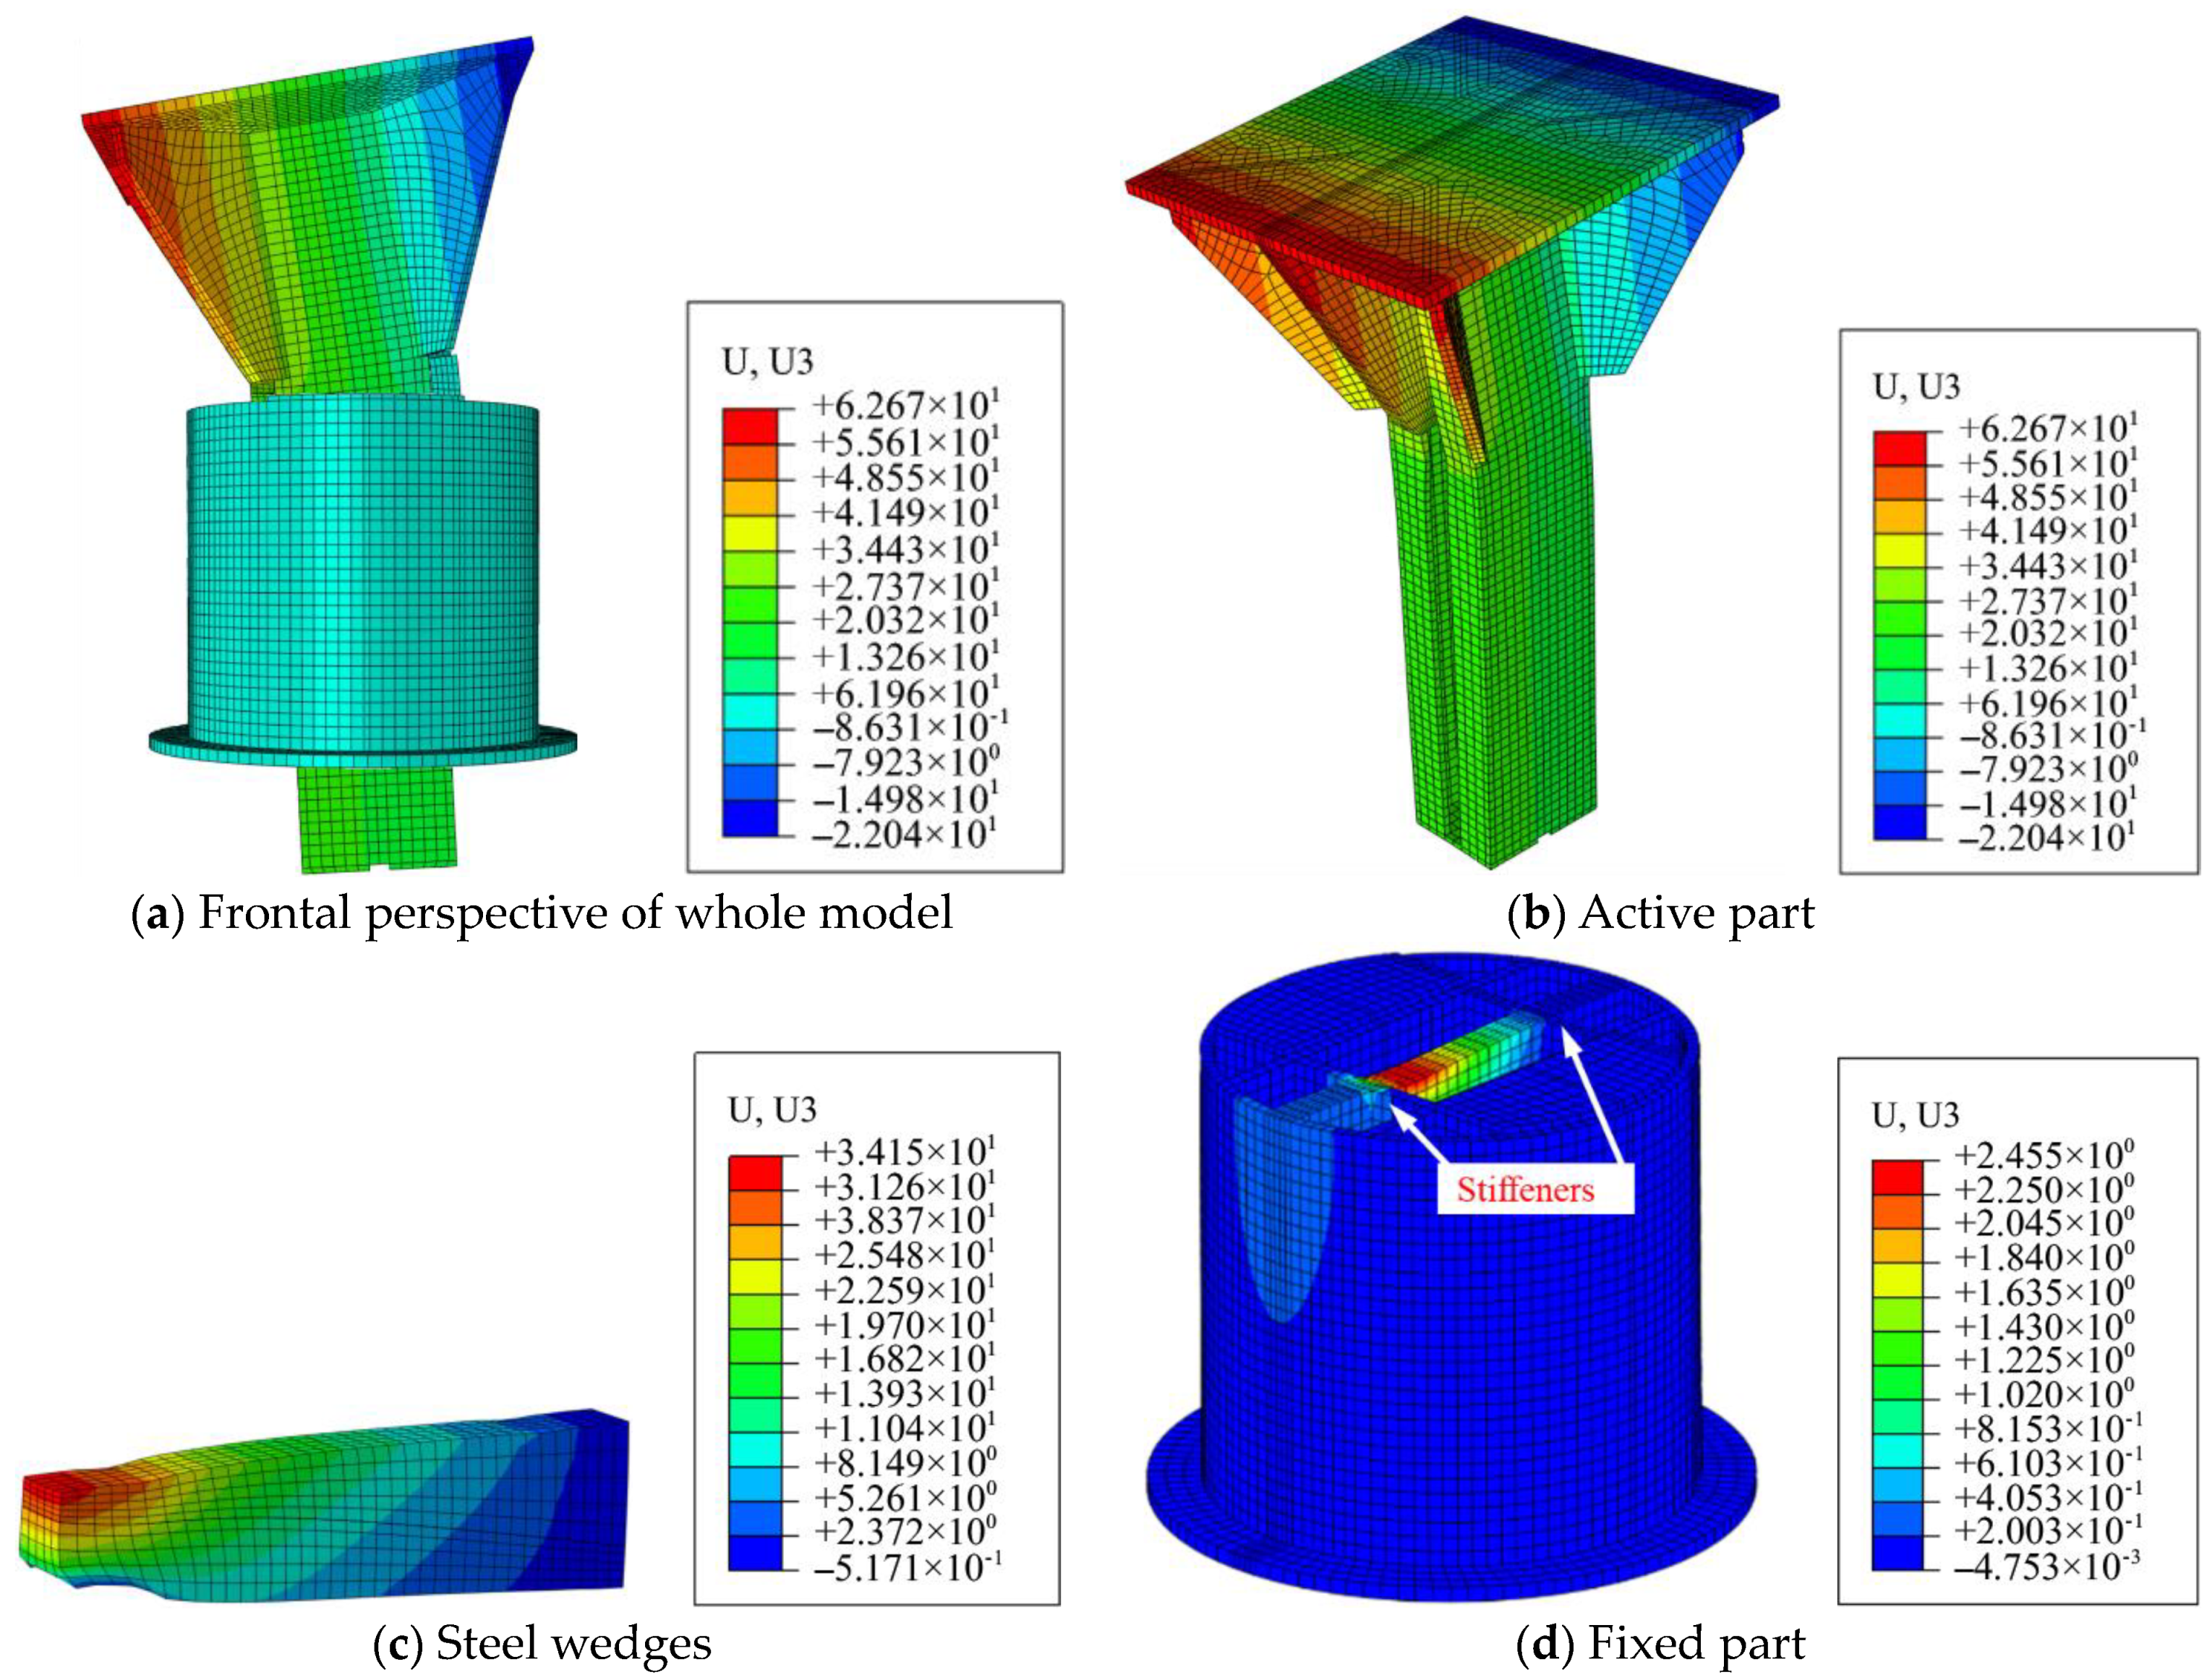
The vertical deformation nephogram of the model is shown in Figure 8. Due to the eccentric load, the active part rotates significantly around the x-axis, while the fixed part does not show any obvious rotation, as seen in Figure 8a. When the load reaches 5000 kN, the end plate of the active part rotates 0.06 rad around the x-axis. At the same time, the maximum vertical deformation at the end plate on the side with the eccentric load is 62 mm, as shown in Figure 8b. The relative deformation of the active part is mainly caused by the deformation of the steel wedge, and the absolute deformation of the active part is relatively small, due to the restriction effect of the channel steel on the middle-rib plate. The uneven deformation of the steel wedges is shown in Figure 8c. The maximum deformation of the steel wedges is 34 mm, which occurs on the loaded side of the steel wedge, and there is almost no deformation on the other side of the steel wedges. The maximum vertical deformation of the fixed part occurs at the middle plate, which also occurs on the loaded side of the middle plate, as shown in Figure 8d. However, due to the effect of the stiffeners on both sides of the middle plate, the maximum deformation value is only 2.46 mm, which is only 7.2% of the maximum deformation of the steel wedge.

3.2.2. Stress Distribution

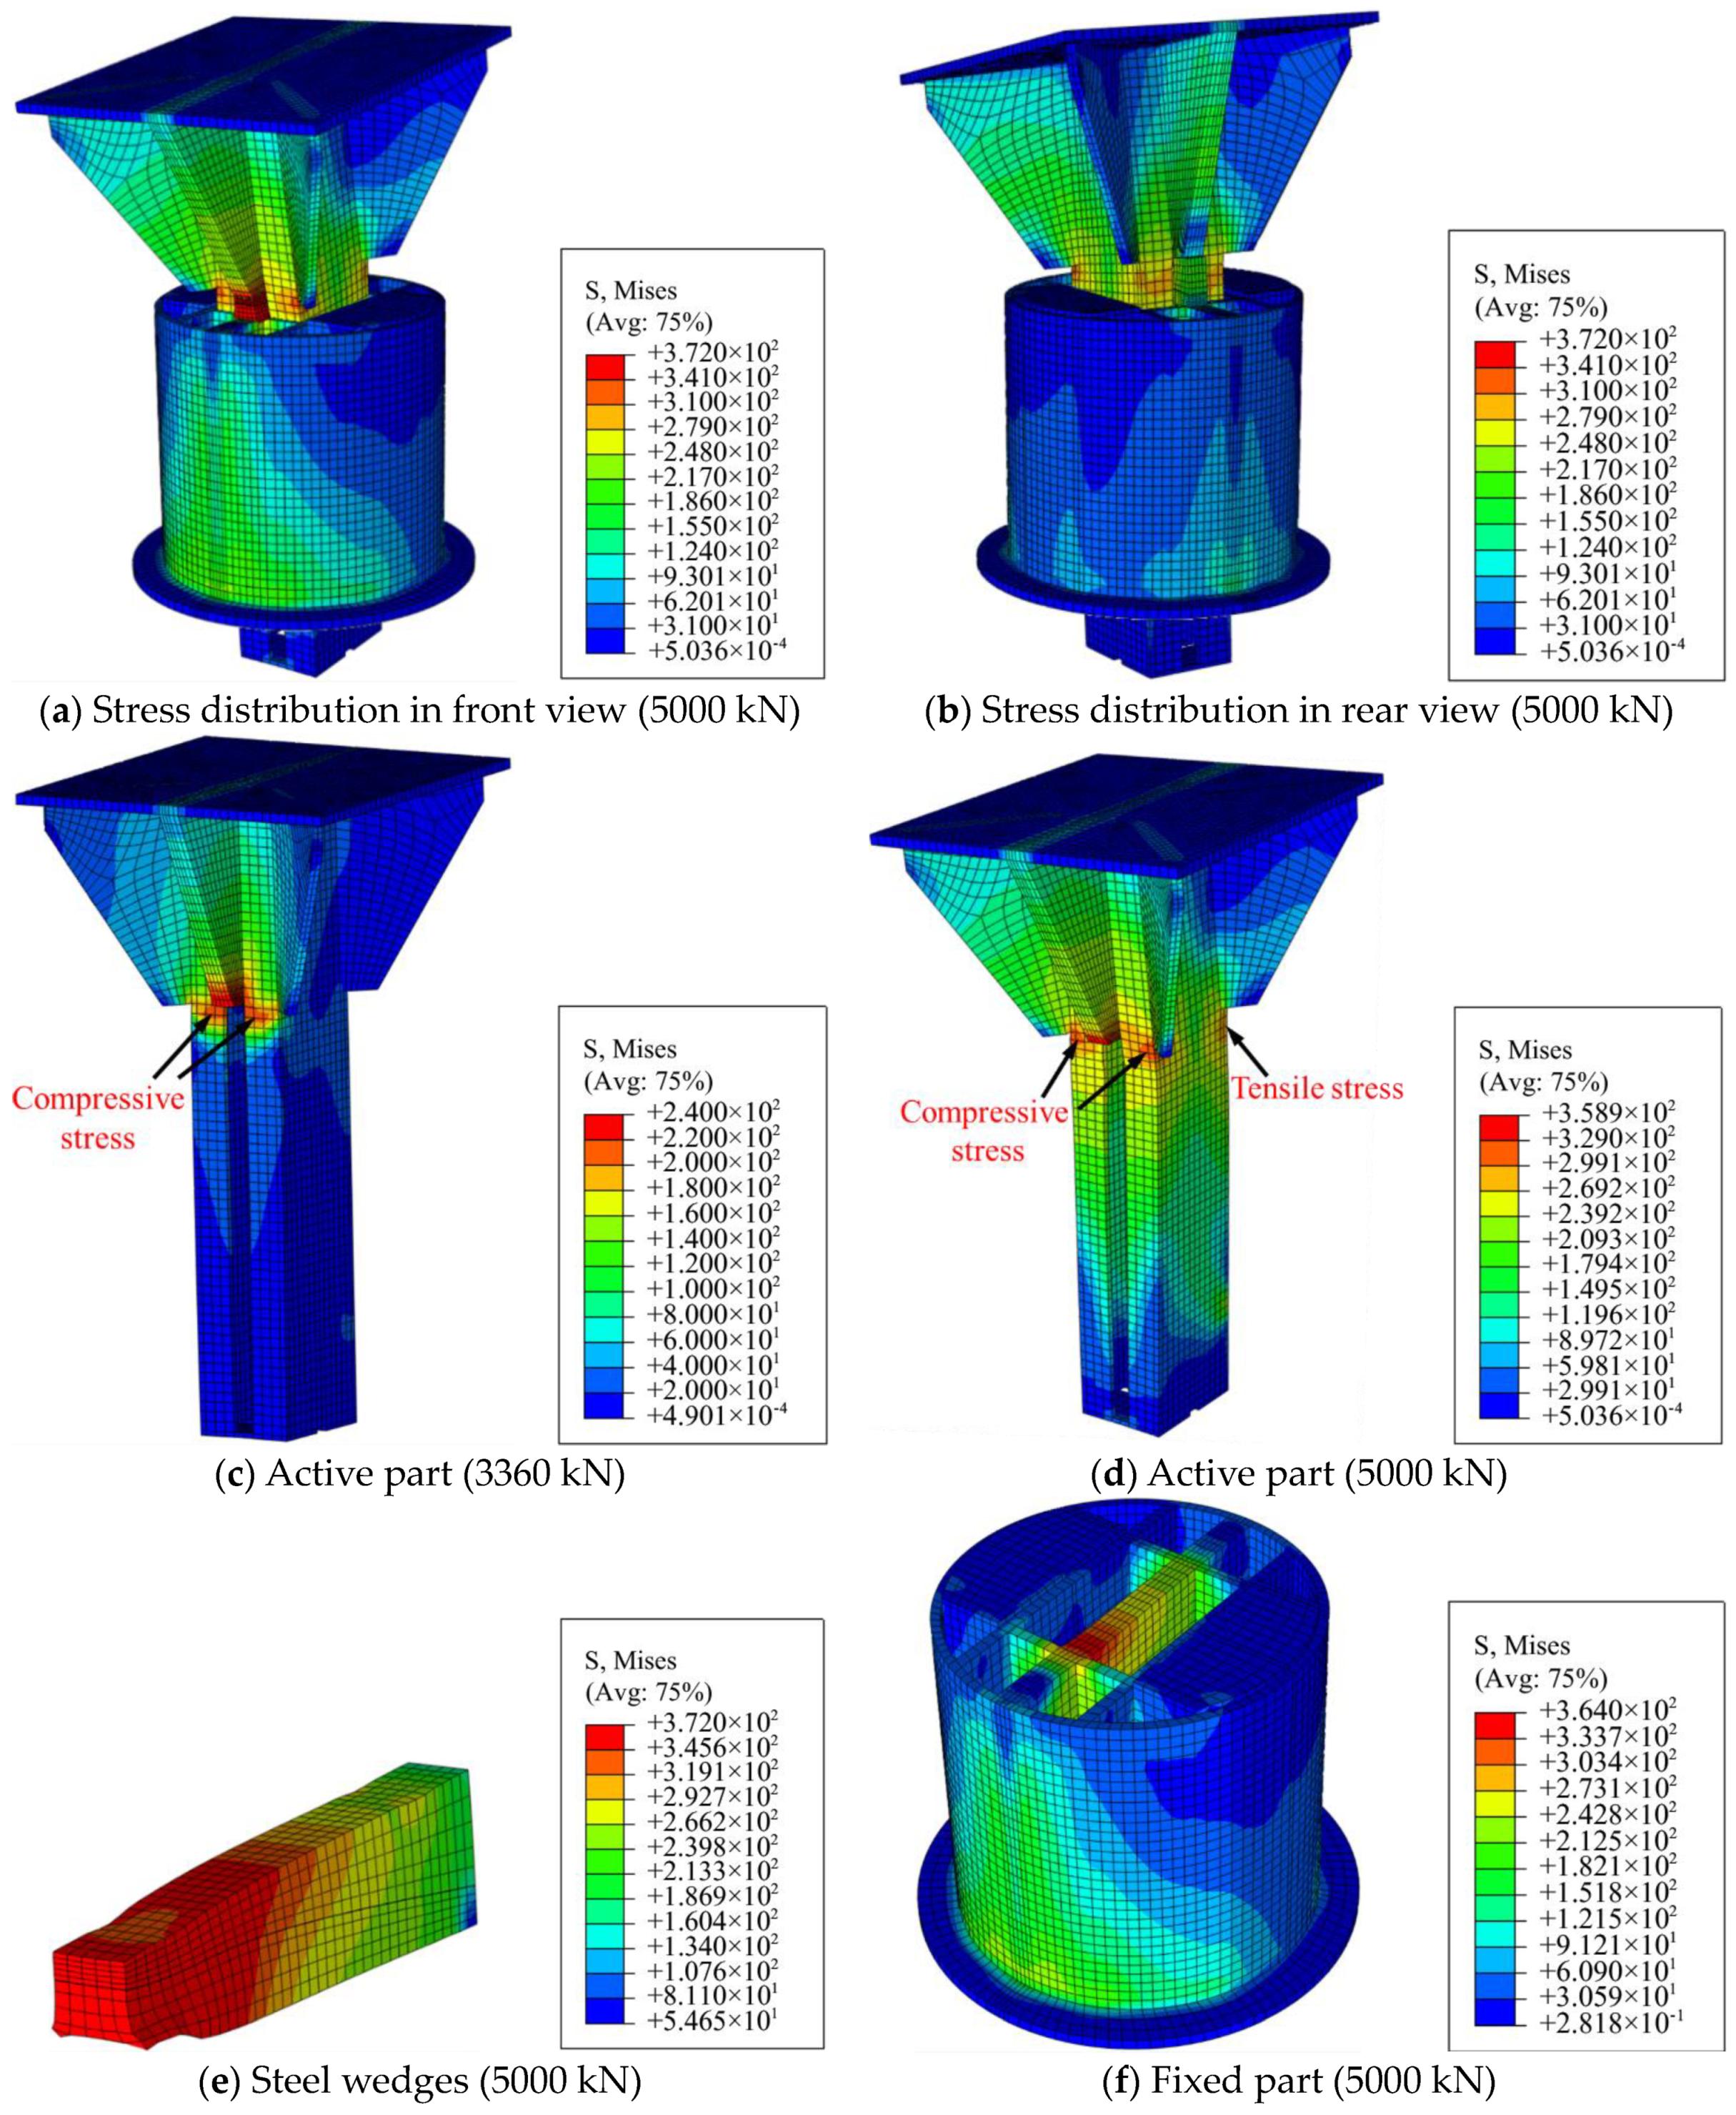
The von Mises stress nephogram of the model is shown in Figure 9. For the entire model, the stress is mainly concentrated on the side where the eccentric load is applied, as exhibited in Figure 9a,b. The stress of the active part is mainly concentrated on the bottom of the middle-rib plate, that is, the contact position with the steel wedge. When the eccentric load increases to 3360 kN, the material on the loaded side of the middle-rib plate begins to yield. At the same time, due to the rotation of the active part, the material on the pressure side of the channel steel begins to yield, as shown in Figure 9c. When the load increases to 5000 kN, the material on the compression and tension side of the channel steel is close to the ultimate strength, as shown in Figure 9d. The channel steel nested in the fixed part has a tendency to move in the negative direction of the y-axis due to the effect of eccentric load. Therefore, when the load increases to 5000 kN, the stress value of the nested part is about 209.3 MPa, which does not reach the yield strength, as shown in Figure 9d. In the numerical model, the yield strength of steel is 235 MPa, and plastic damage is identified to occur when the stress of steel exceeds 235 MPa. The material of almost the entire steel wedge yielded at the end of loading. Meanwhile, more than half of the material of the steel wedges have reached ultimate strength, as shown in Figure 9e. Therefore, the selection of high-strength steel for processing steel wedges can significantly improve the mechanical properties of DC joints. The excessive stress of the fixed part is concentrated in the middle plate, especially the side where the eccentric load is applied. At the end of the simulation, the maximum stress value of the middle plate is 362 MPa, which is close to the ultimate strength of the material. At the same time, due to the effect of the channel steel of the active part, the stress value of the stiffener is relatively large. In addition, the stress value of the steel tube on the loading side is larger; the maximum value is about 213 MPa. The stress concentration area is symmetrically distributed along the middle plate. The closer to the flange, the greater the stress, as listed in Figure 9f. On the opposite side of the steel tube of the fixed part, the stress is mainly concentrated at the junction of the steel tube and the flange. This is caused by the tensile stress of the steel tube on this side. The stress concentration area is also symmetrically distributed along the middle plate. The maximum stress value is about 121 MPa, as shown in Figure 9b.

4. Bearing Capacity under Eccentric Load

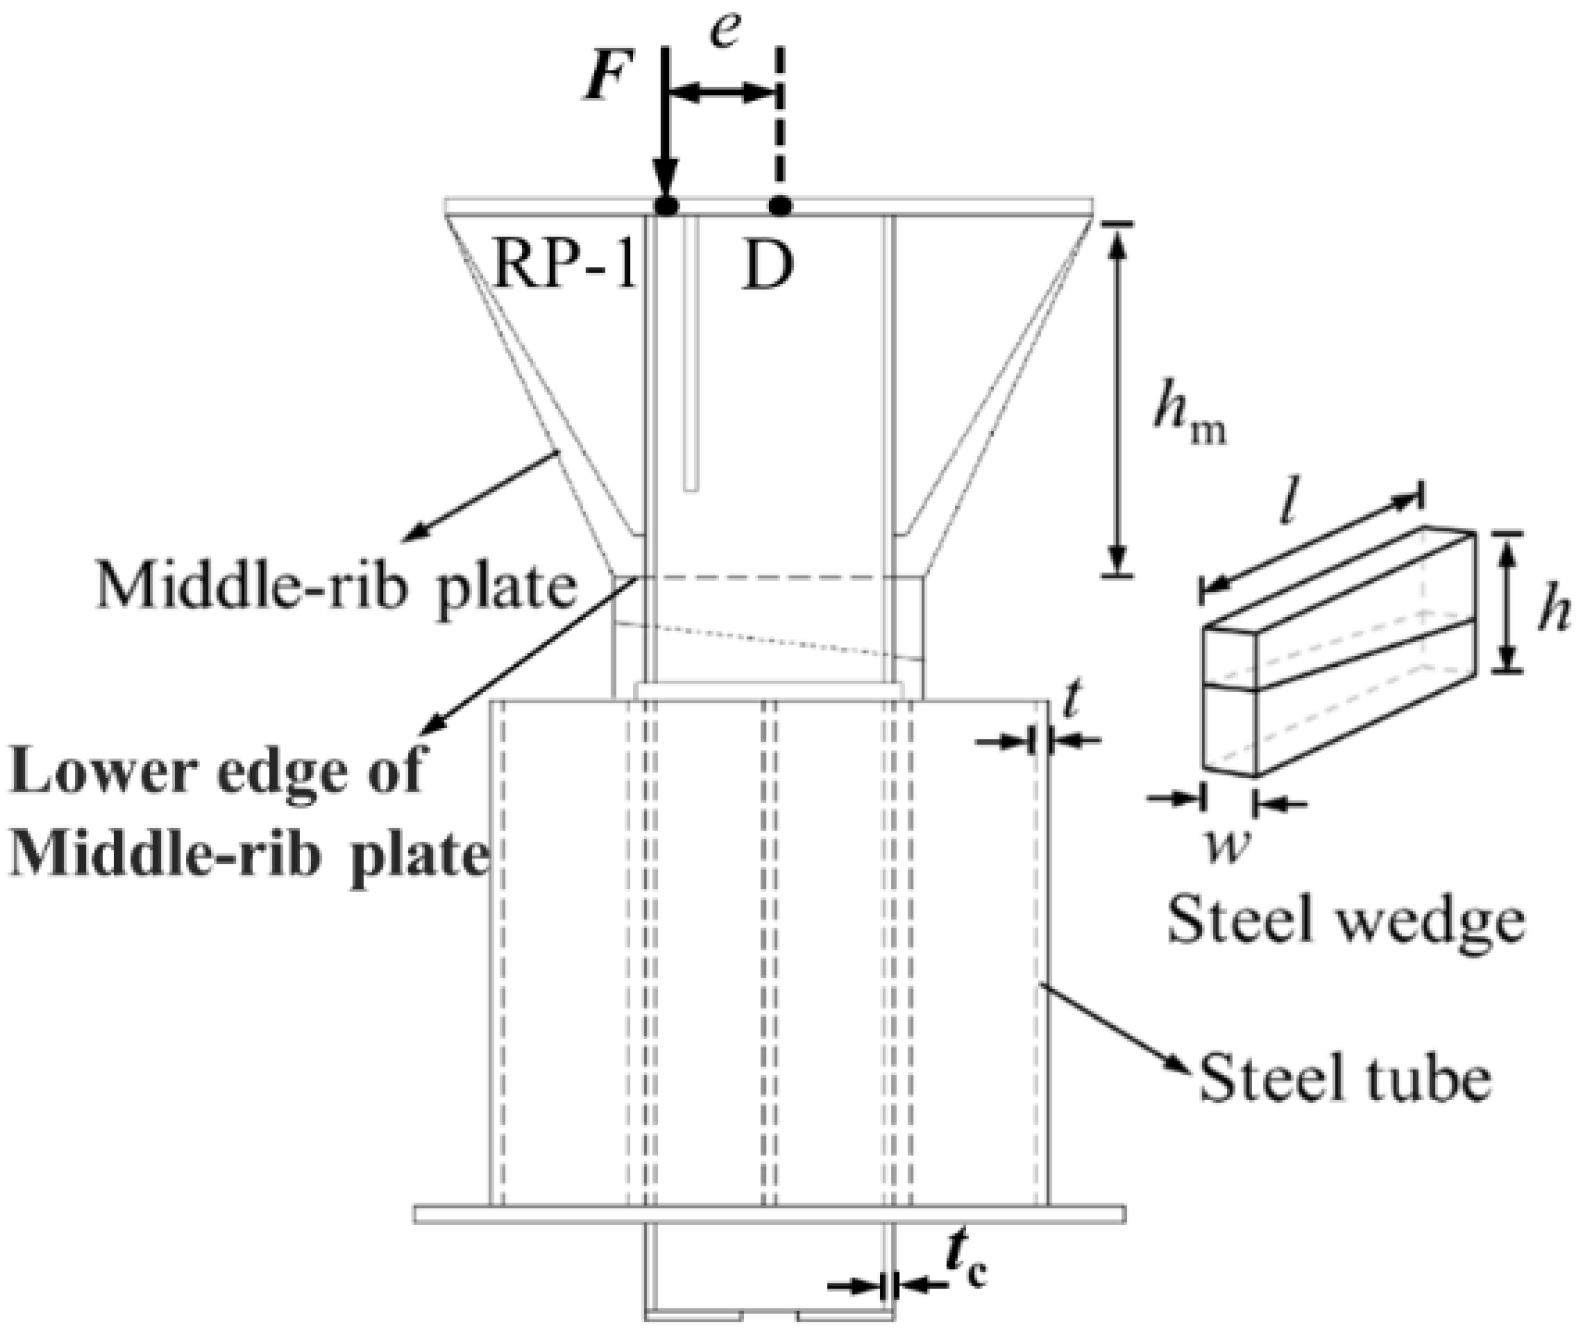
To further study the influence of parameters at key positions on the bearing capacity of DC joints under eccentric load, parametric studies were carried out. The key parameters of DC joints are shown in Figure 10. A total of 27 models were established. The eccentricity and geometric information at key position of the models are shown in Table 3.

4.1. Value Criteria of Bearing Capacity Indexes

Axial force and deformation of steel support are important monitoring projects in practical engineering. Deformation monitoring mainly collects the variation of distance between the centre points of the steel support on both sides. Control of deformation and axial force of steel bracing depend on the initial compression stiffness and yield load, respectively. Therefore, the initial compression stiffness and yield load are crucial bearing capacity indexes of DC joints. The load-displacement curves of each numerical model are obtained from point D, and they do not have a distinct yield platform. Therefore, the initial compression stiffness and yield load are defined by the conditional yield method [36]. The yield load is the corresponding load when the residual deformation of the models is 0.2%. The initial compression stiffness is the average slope of the curves between the origin and condition yield point. The initial compression stiffness and yield load are expressed as k and Fy, respectively.

4.2. Parameter Analysis of Bearing Capacity

4.2.1. Influence of Eccentricity

Figure 11a shows the load-displacement curves of the DC joints under different eccentricities. The bearing capacities of the DC joints decrease with eccentricity, and the decline rate gradually increases. Figure 11b shows the effect of eccentricity on the initial compression stiffness and yield load of the DC joints. The results show that the initial compression stiffness and yield load are inversely correlated with eccentricity, and the correlation gradually increases. While the eccentricity increases from 0 mm to 36.5 mm, the initial compression stiffness and yield load decrease about 20 kN/mm and 70 kN, respectively. When the eccentricity exceeds 73 mm, the initial compression stiffness and yield load decrease by about 84 kN/mm and 550 kN, respectively, for each increase of eccentricity by 36.5 mm.

4.2.2. Influence of Steel Wedge Length

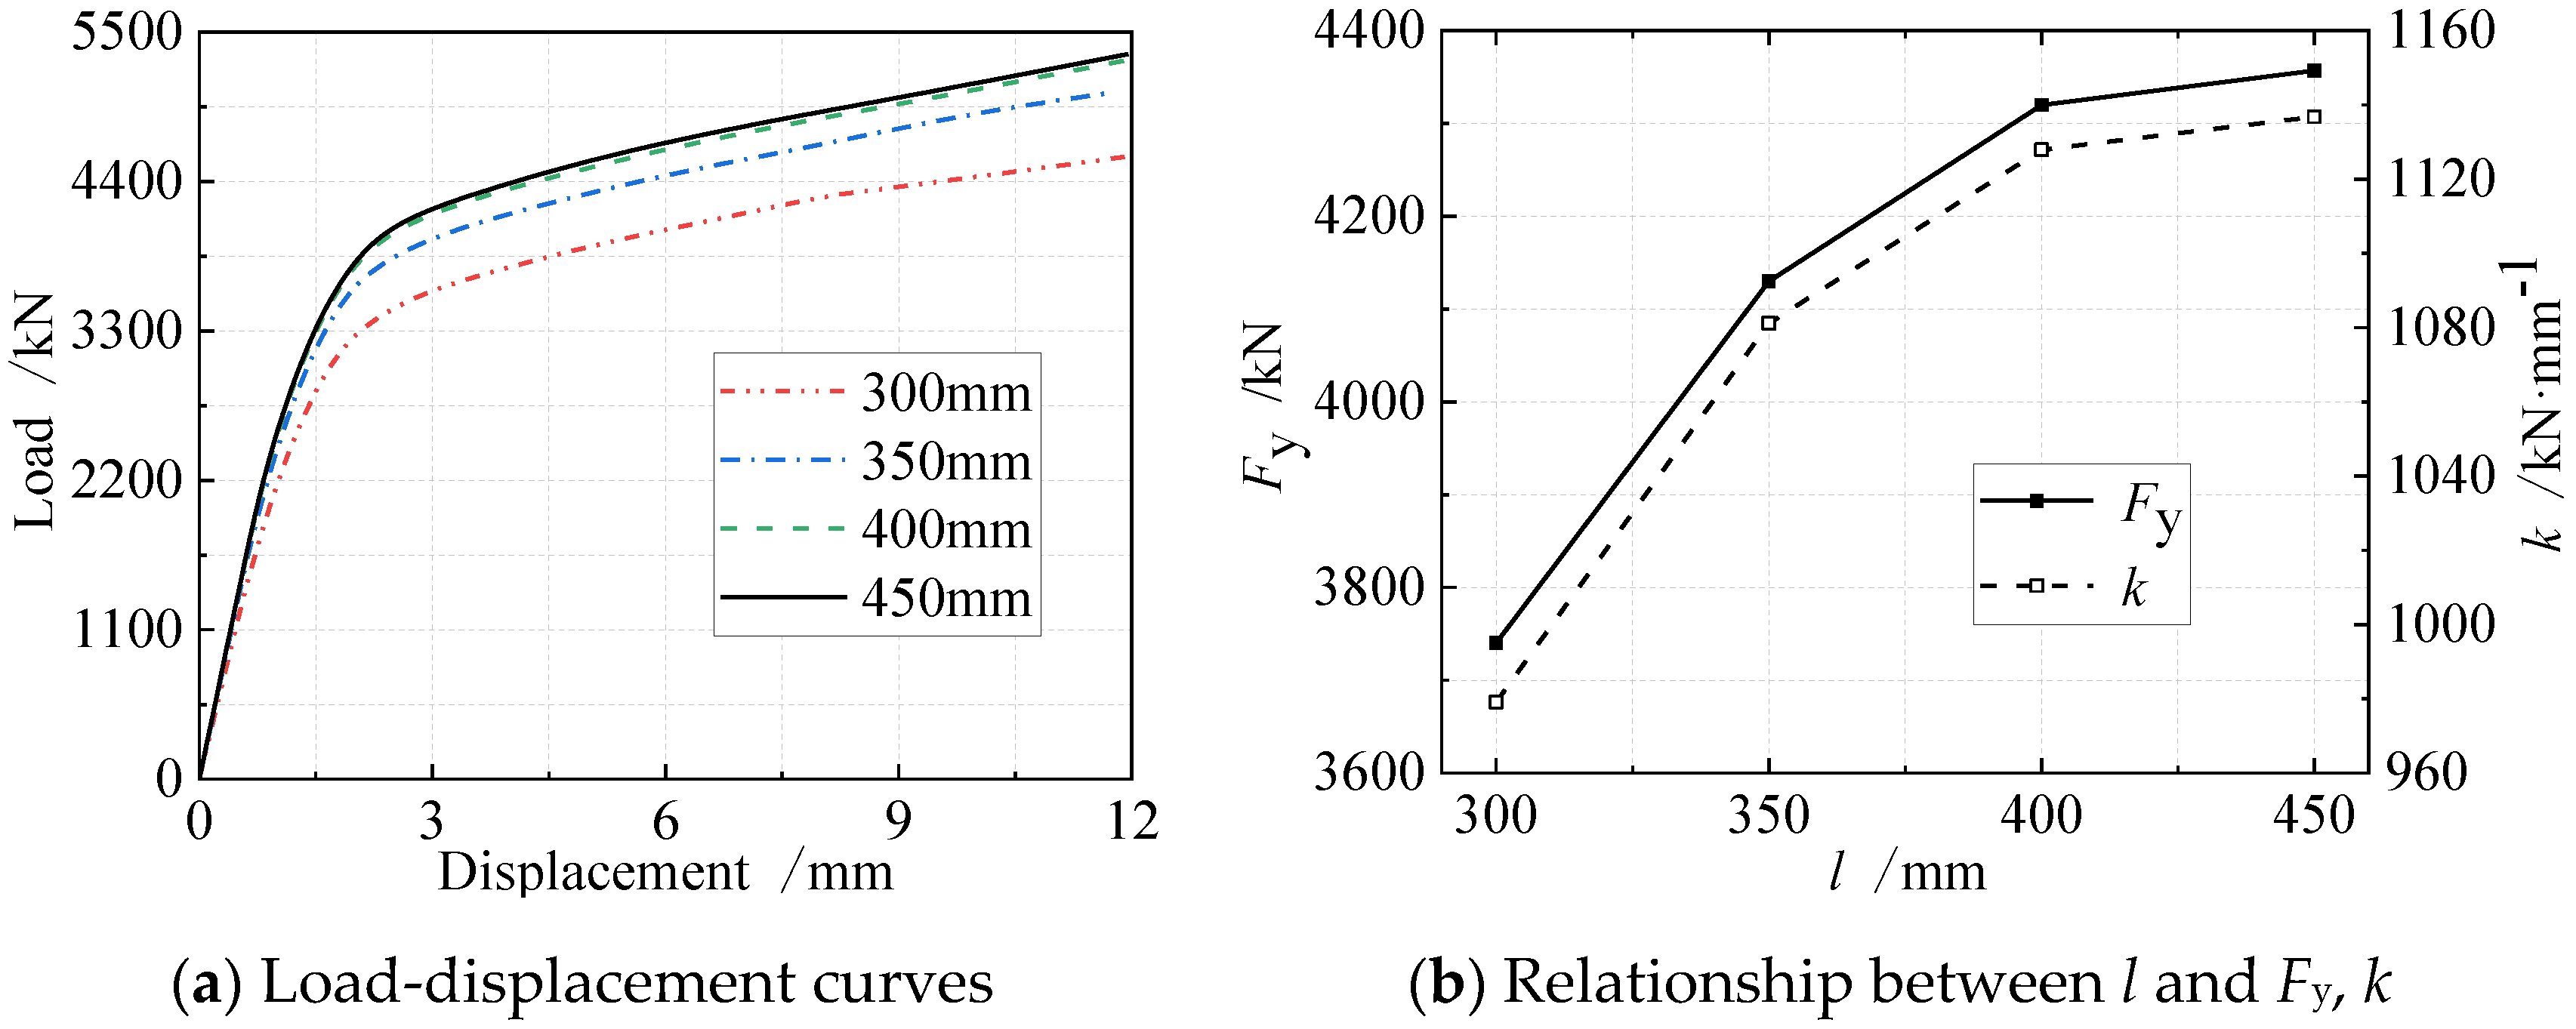
The relationship between steel wedge length and the bearing capacity of the DC joints is revealed in Figure 12a. Bearing capacity is significantly affected by steel wedge length; the bearing capacity increases with steel wedge length. When the length exceeds 400 mm, it will no longer affect bearing capacity. Figure 12b shows the effect of steel wedge length on initial compression stiffness and yield load. When steel wedge length is less than 350 mm, the initial compression stiffness and yield load increase with steel wedge length. For every increase of the length by 50 mm, the initial compression stiffness and yield load increase by 115.8 kN/mm and 412.5 kN, respectively. Steel wedge length weakly affects bearing capacity as the length exceeds 350 mm. When the steel wedge length exceeds 400 mm, the length will no longer be the influential factor on the initial compression stiffness and yield load. The increase of the length of the steel wedges is ineffective with respect to the compression area of the steel wedges.

4.2.3. Influence of Steel Wedge Width

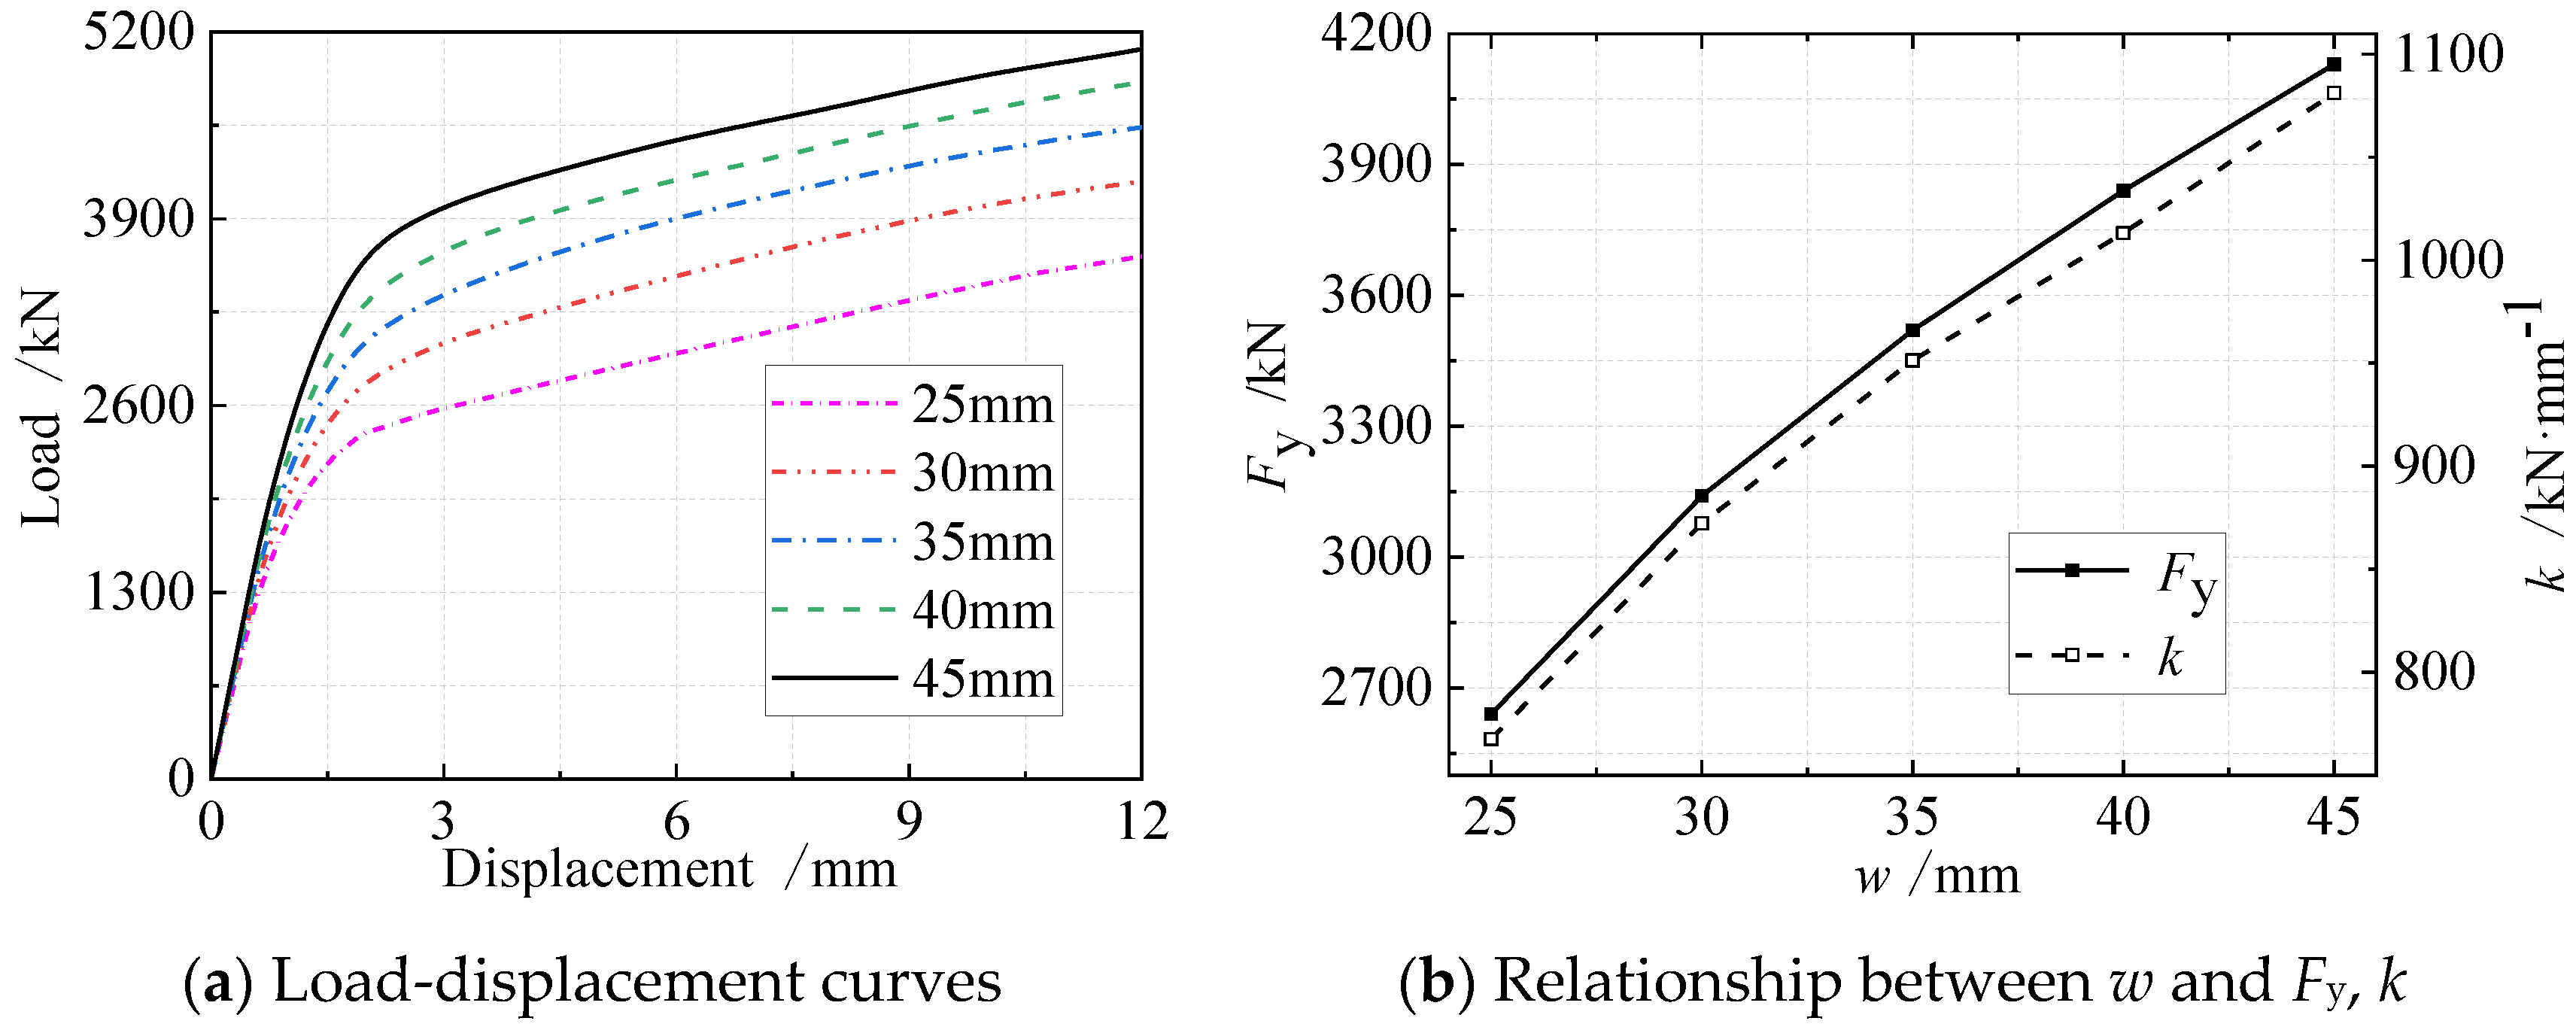
According to load-displacement curves of DC joints under different steel wedge widths, as listed in Figure 13a, it can be found that wedge width affects the bearing capacity significantly: bearing capacity increases with steel wedge width. Figure 13b shows the effect of the width on initial compression stiffness and yield load. The influence of steel wedge width on initial compression stiffness and yield load is initially weak. When the width increases from 25 mm to 30 mm, the initial compression stiffness and yield load will increase by 104.8 kN/mm and 500 kN, respectively. When the width increases from 40 mm to 45 mm, the initial compression stiffness and yield load increase by 68 kN/mm and 290 kN, respectively, which is only about 60% when the width increases from 25 mm to 30 mm. The increase rates of initial compression stiffness are both about 18.9%, 14.4%, 12.1% and 10.9% as the steel wedge width increases from 25 mm to 45 mm.

4.2.4. Influence of Steel Wedge Height

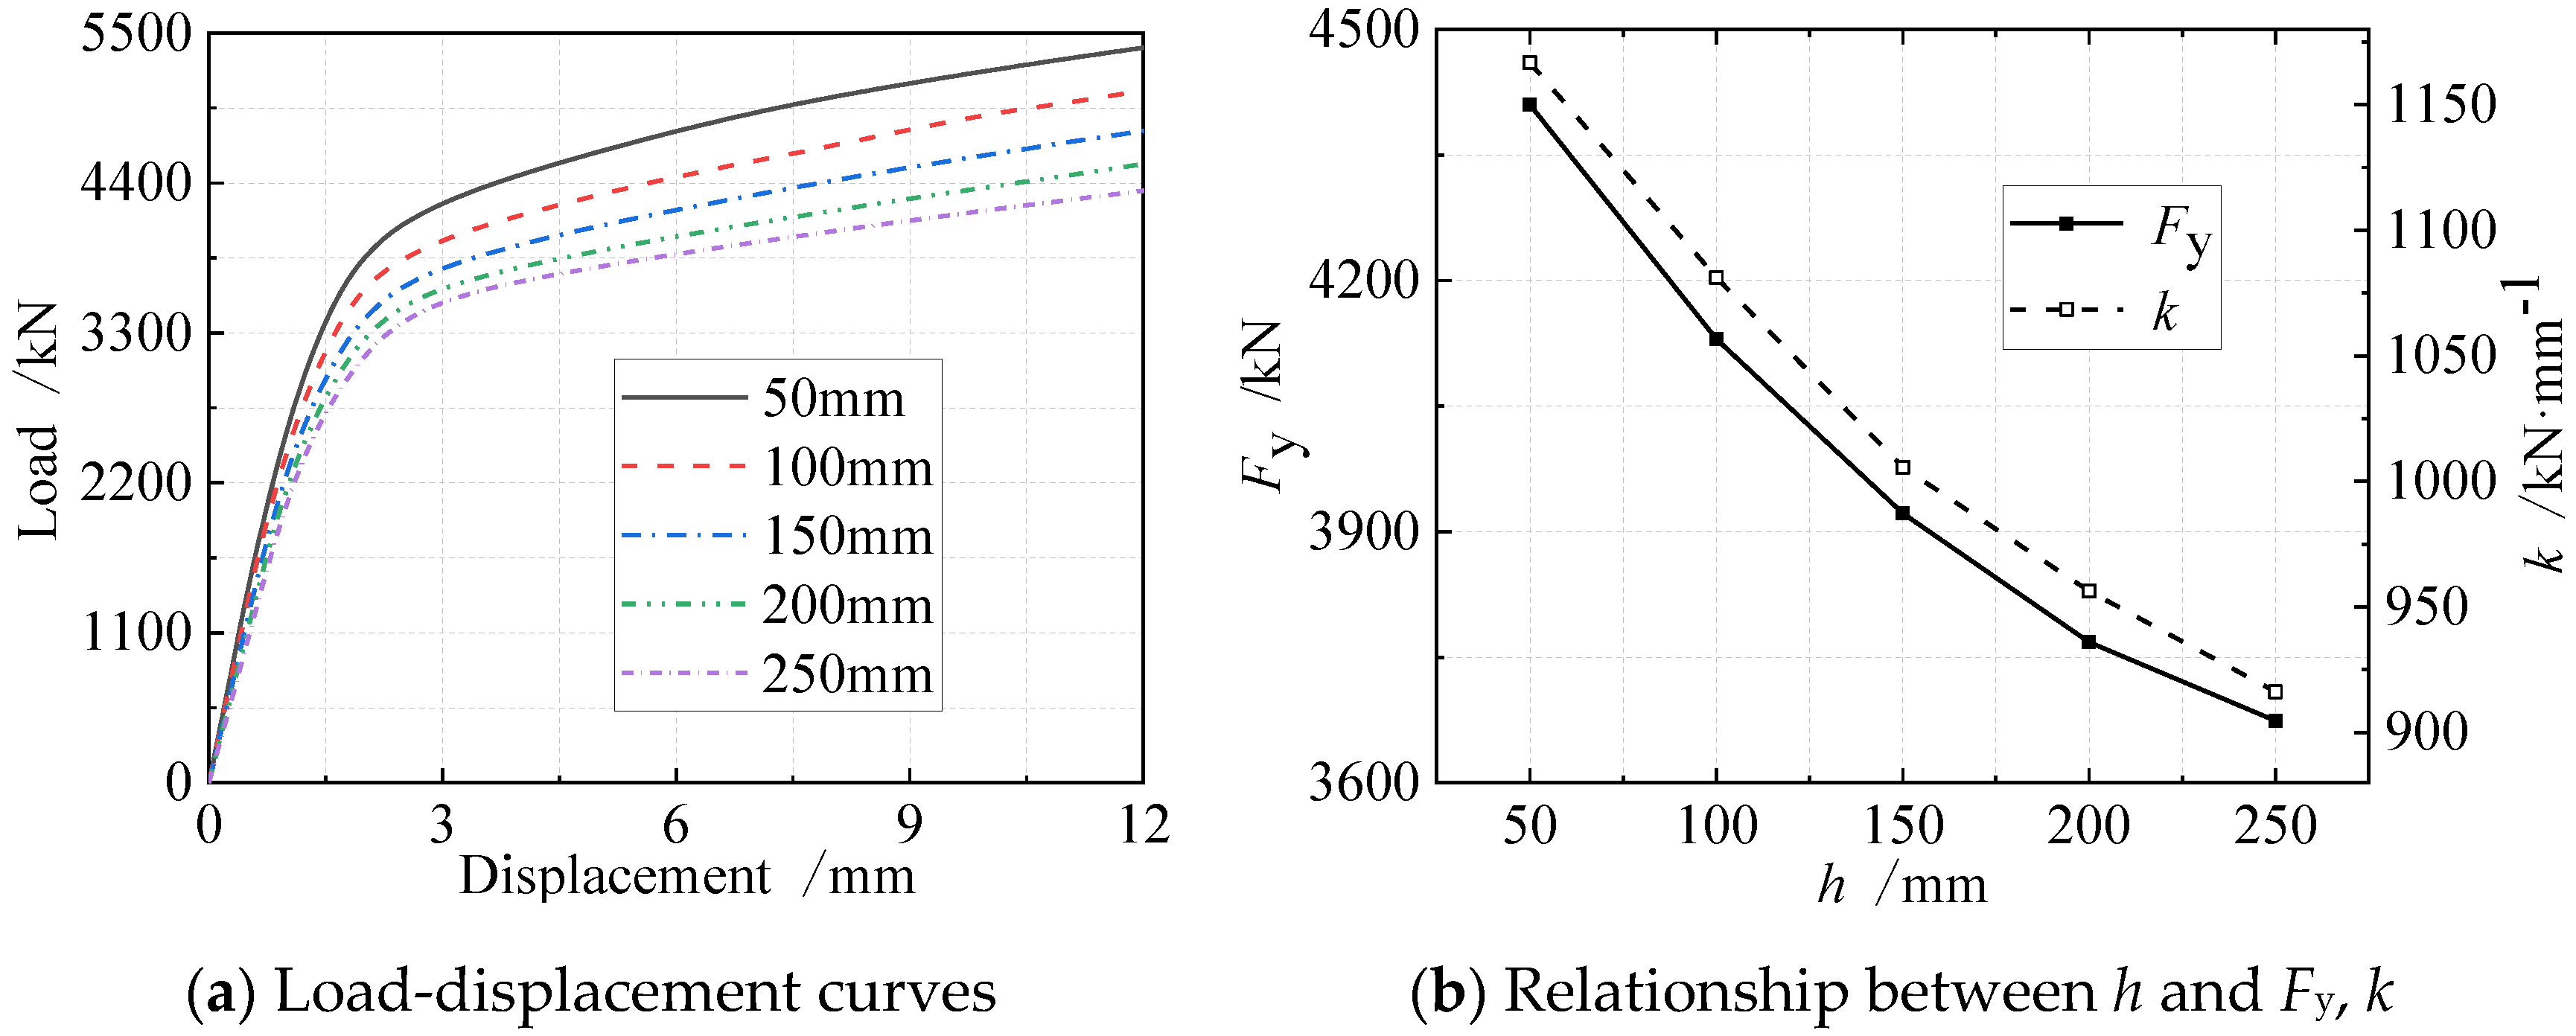
Figure 14a reveals the relationship of steel wedge height on the bearing capacity of DC joints. The bearing capacity is affected by the steel wedge height weakly, but it decreases with steel wedge height. Steel wedge height is inversely correlated with initial compression stiffness and yield load, but the correlation gradually weakens, as shown in Figure 14b. The increase rates of initial compression stiffness and yield load are both about 6.3%, 5.5%, 4.9% and 4.2%, respectively, as the height increases from 50 mm to 250 mm.

4.2.5. Influence of Steel Tube Wall Thickness

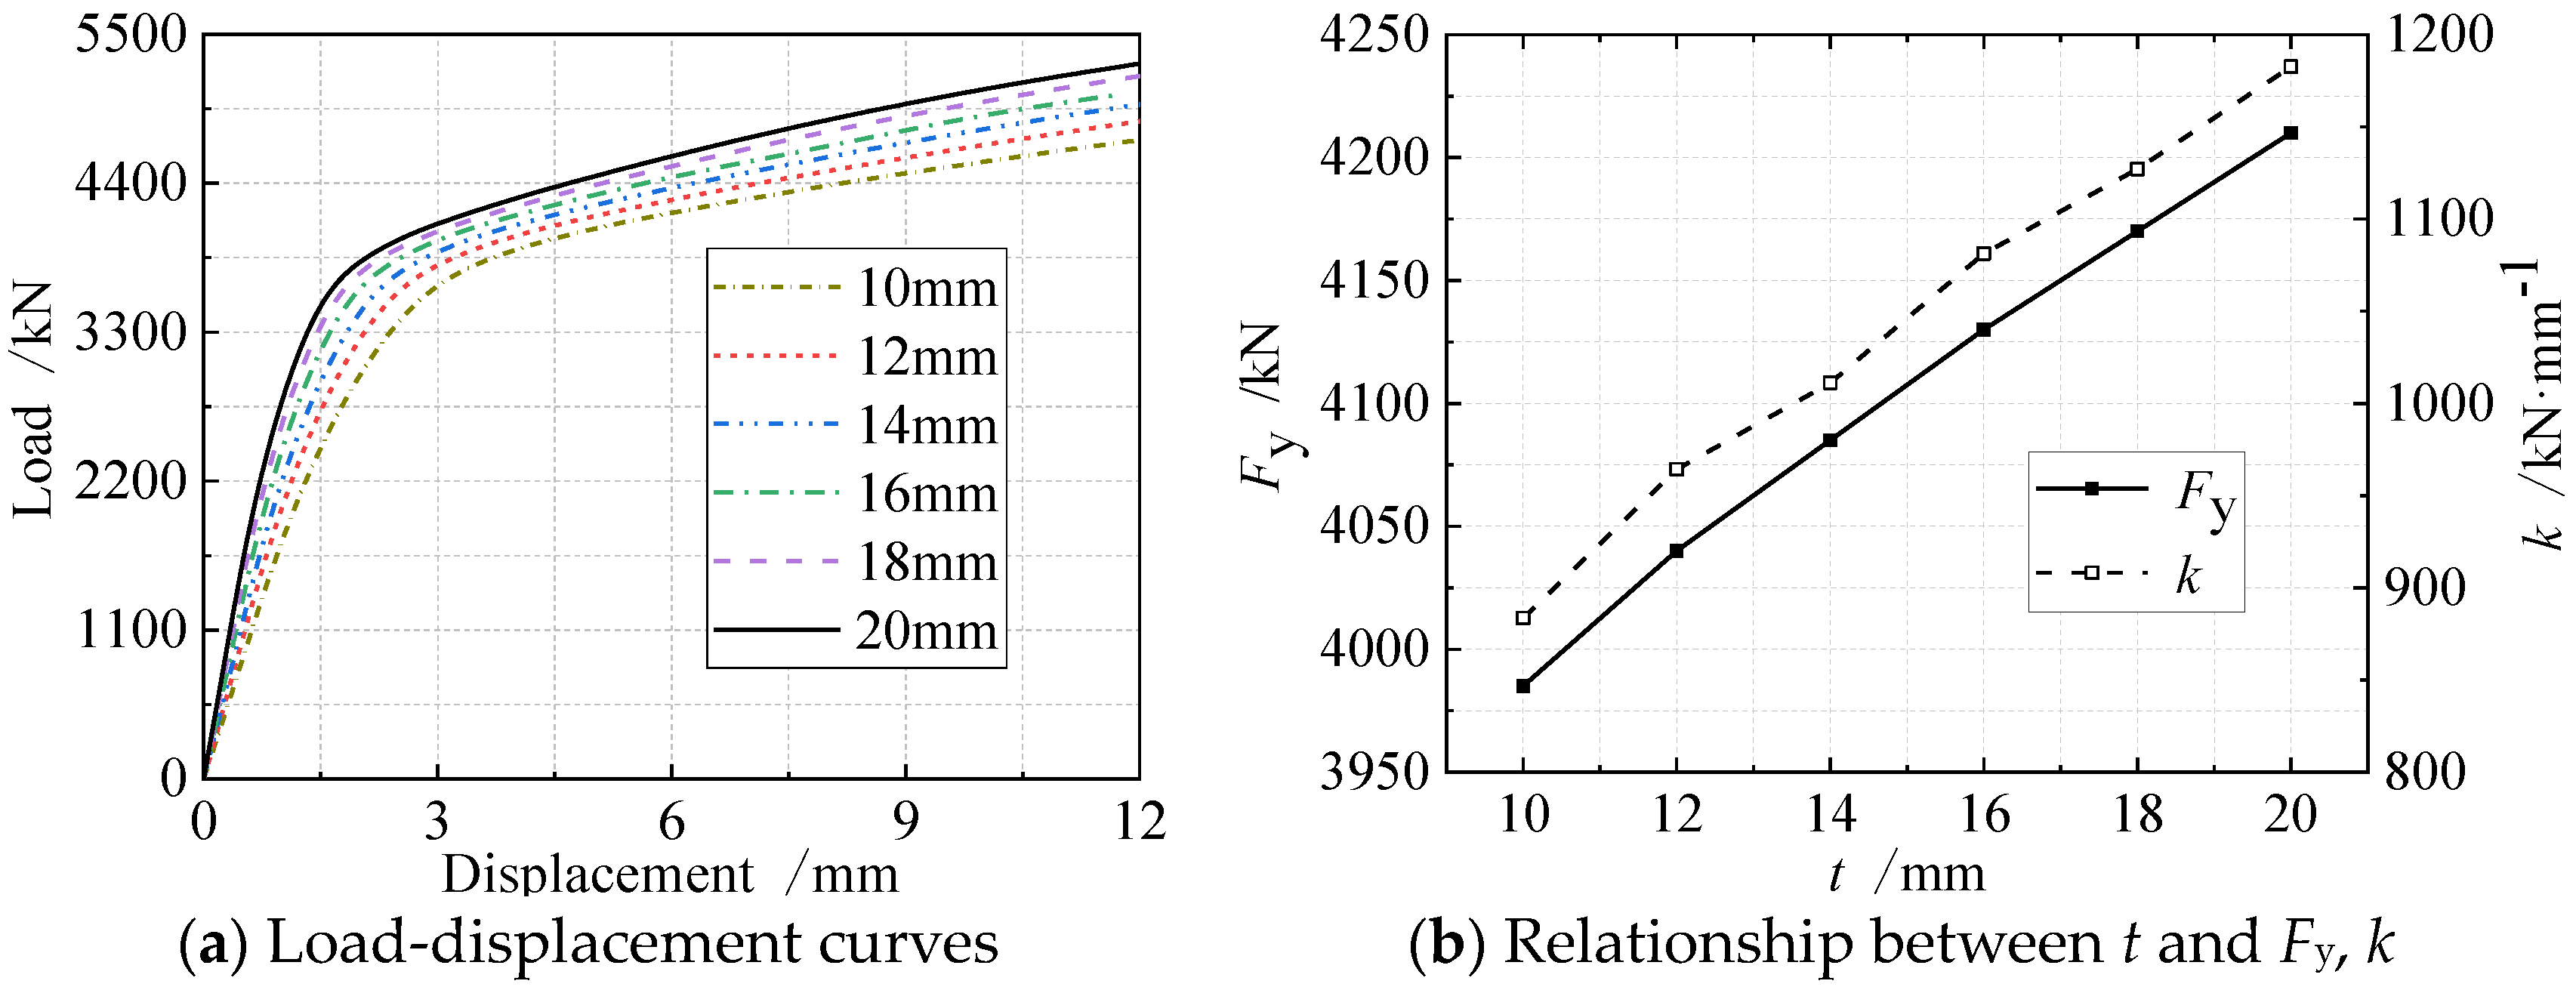
The relationship of steel tube wall thickness with the bearing capacity is shown in Figure 15a. Similarly, the DC joint is affected by the steel tube wall thickness weakly, but the bearing capacity increases with steel tube wall thickness. Figure 15b shows the curves of the steel tube wall thickness with the initial compression stiffness and yield load. The relation between the bearing capacity and the steel tube wall thickness is a positive linear correlation. When the wall thickness increases by 2 mm in each step, the initial compression stiffness and yield load increase by about 59.8 kN/mm and 45 kN, and the increase rate is about 1.5% and 1.1%, respectively.

4.2.6. Influence of Channel Steel Thickness

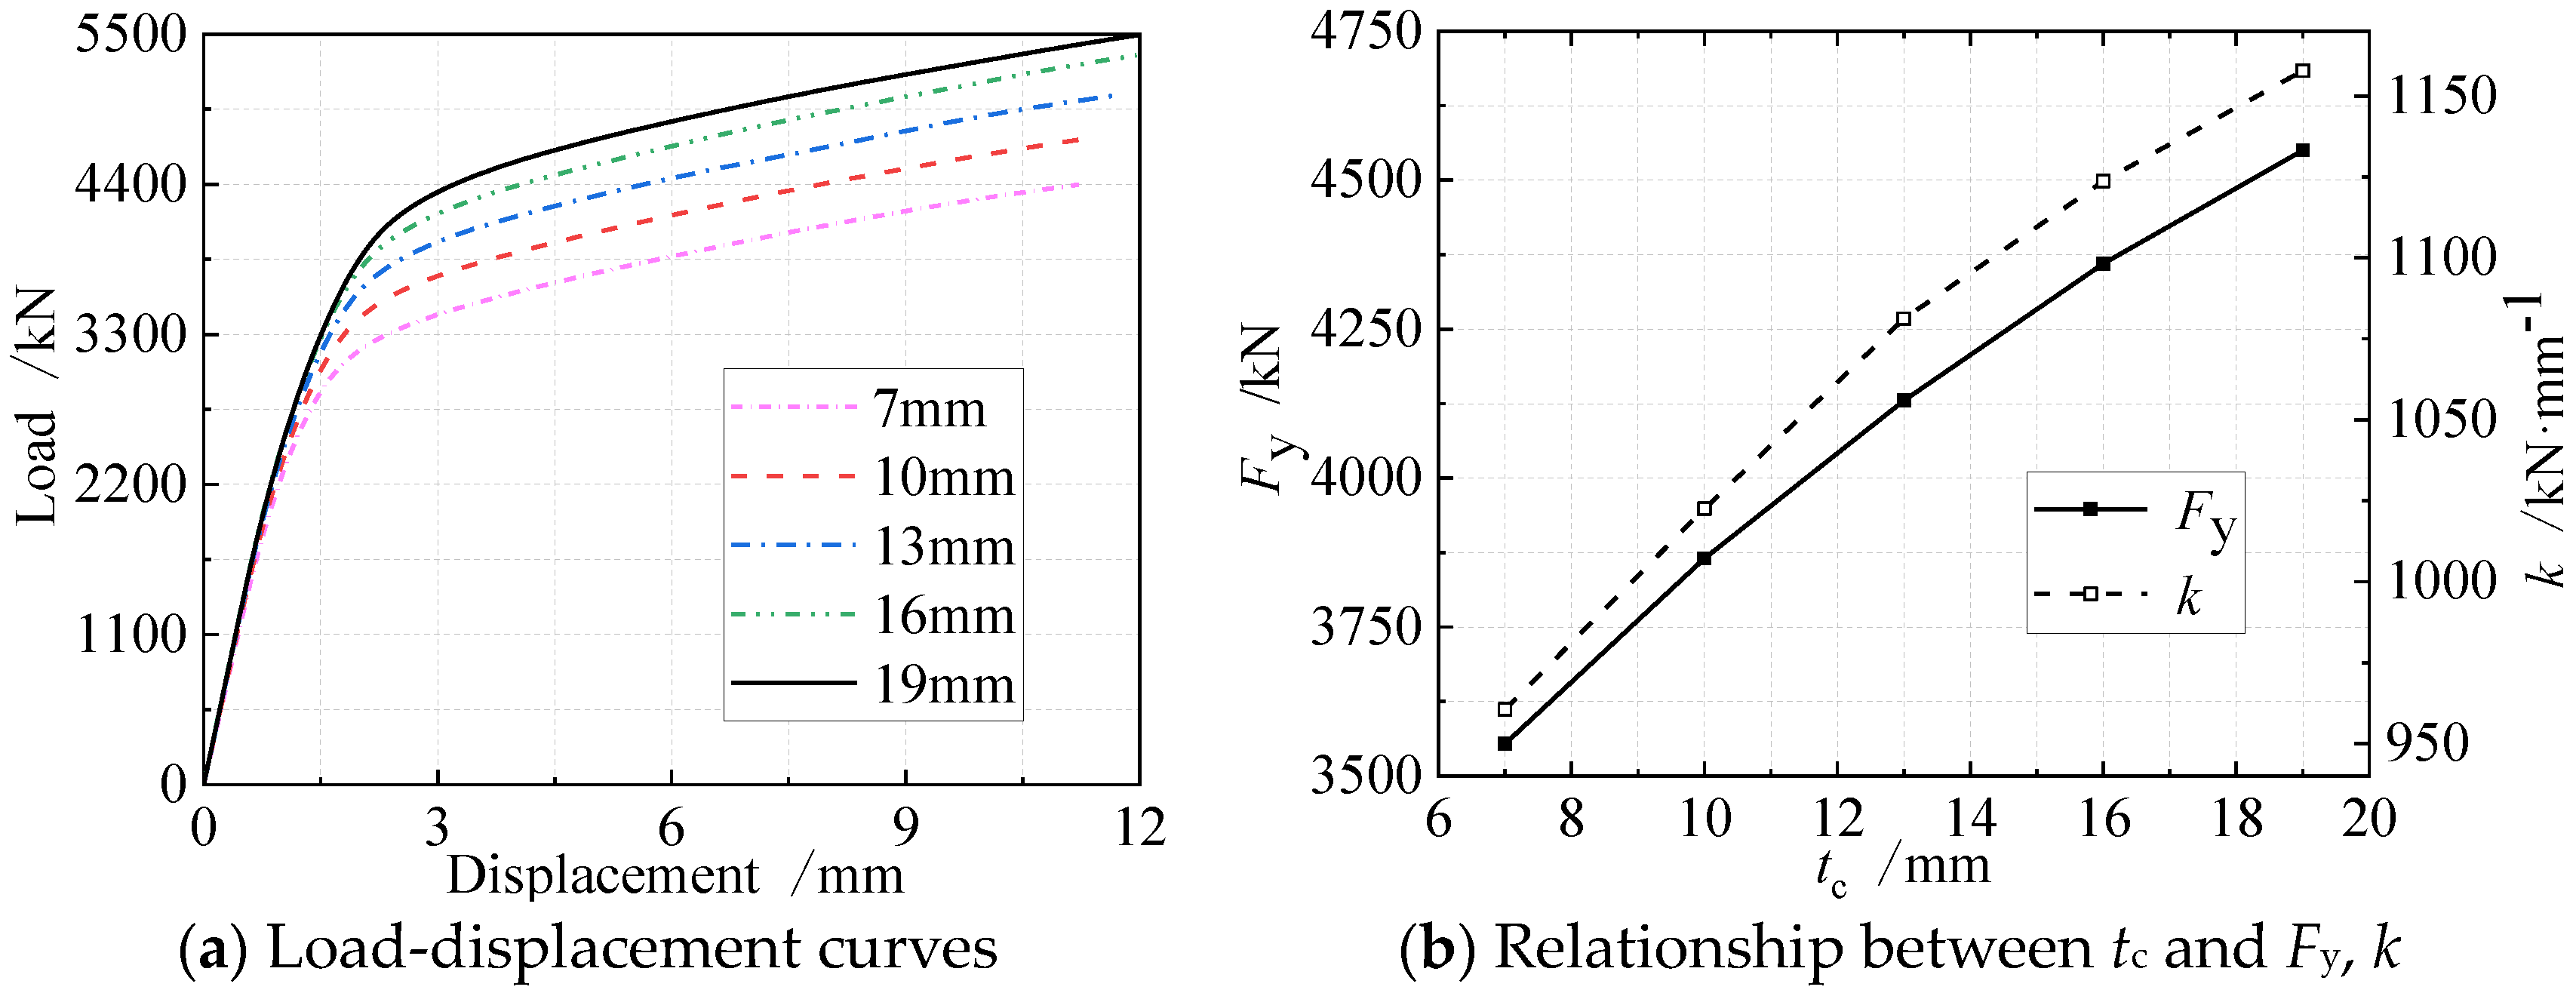
Figure 16a lists the effect of channel steel thickness on the bearing capacity of DC joints. The increase of channel steel thickness improves the bearing capacity of DC joints. The beneficial effect reduces gradually. When the load is less than 2200 kN, the impact of channel steel thickness on the bearing capacity of the DC joints is weak. However, the effect amplifies as the load increases. The relationship of channel steel thickness with initial compression steel and yield load is shown in Figure 16b. The channel steel thickness positively correlates with initial compression stiffness and yield load, and the correlation gradually decreases. When the channel steel thickness increases from 8 mm to 10 mm, the initial compression stiffness and yield load increase by 61.9 kN/mm and 311 kN, respectively, and their increase rates are about 1.7% and 8.8%, respectively. The initial compression stiffness and yield load increase by 34 kN/mm and 190 kN, respectively, as the thickness increases from 16 mm to 18 mm, and their increase rate is only about 0.9% and 5.3%, respectively.

4.2.7. Influence of the Middle-Rib Plate Height

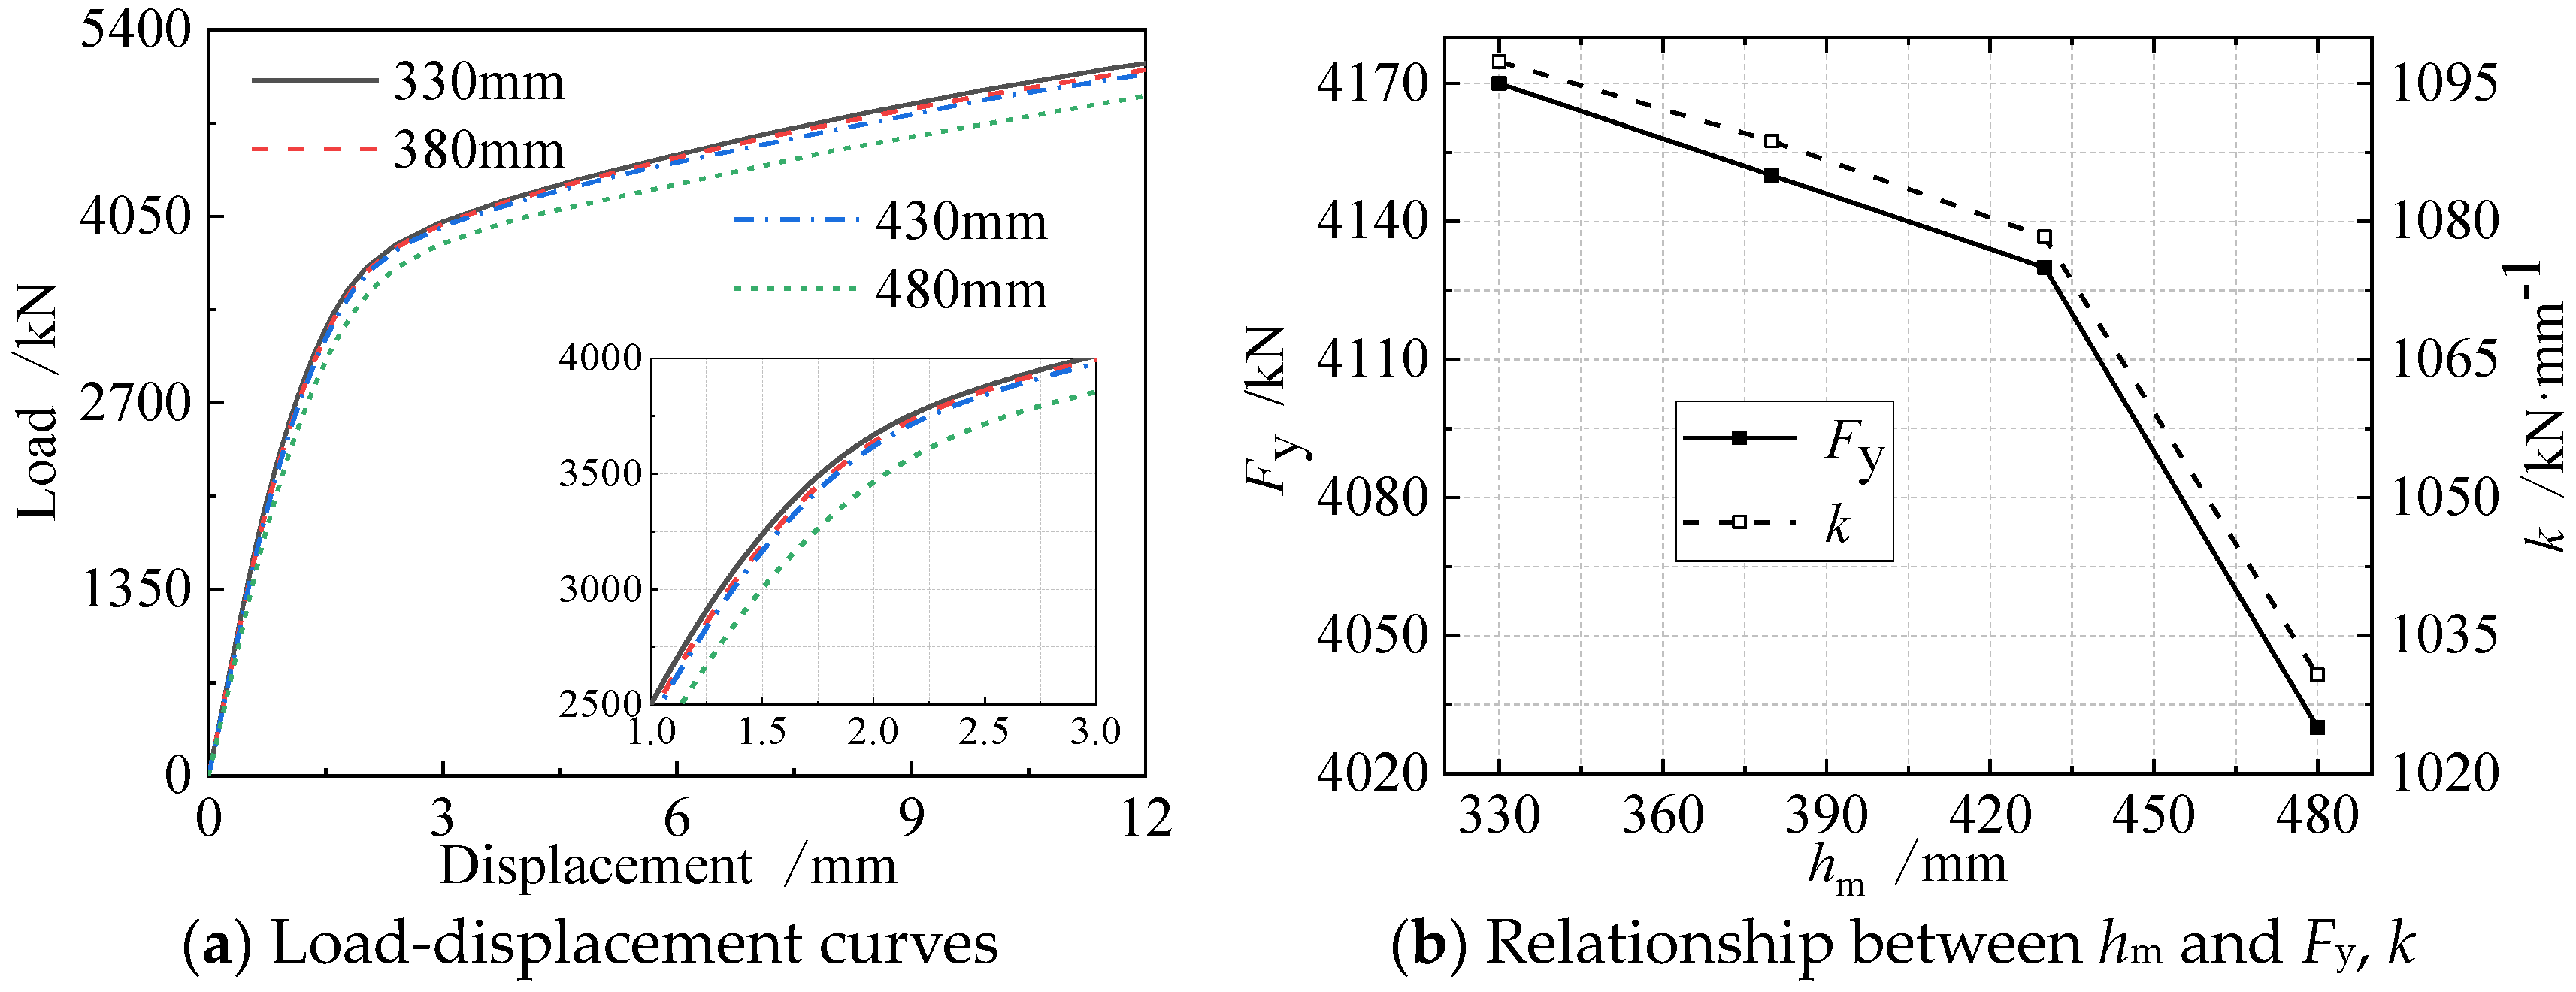
According to Figure 17a, the bearing capacity of the DC joint decreases with the middle-rib plate height, due to the beneficial influence of channel steel and the stiffener-rib in the active part of deformation of the middle-rib plate. The height weakly affects the bearing capacity of the DC joints. As revealed in Figure 17b, while the middle-rib plate height increases from 330 mm to 430 mm, the initial compression stiffness and yield load reduce by 9.5 kN/mm and 20 kN, respectively, and their reduction rate is 0.2% and 0.4%, respectively. As the middle-rib plate height exceeds 430 mm, the initial compression stiffness and yield load reduce by 47 kN/mm and 100 kN, respectively, due to the instability of the active part.

5. Flexural Performance under Eccentric Load

5.1. Selection Criteria of Flexural Performance Indexes

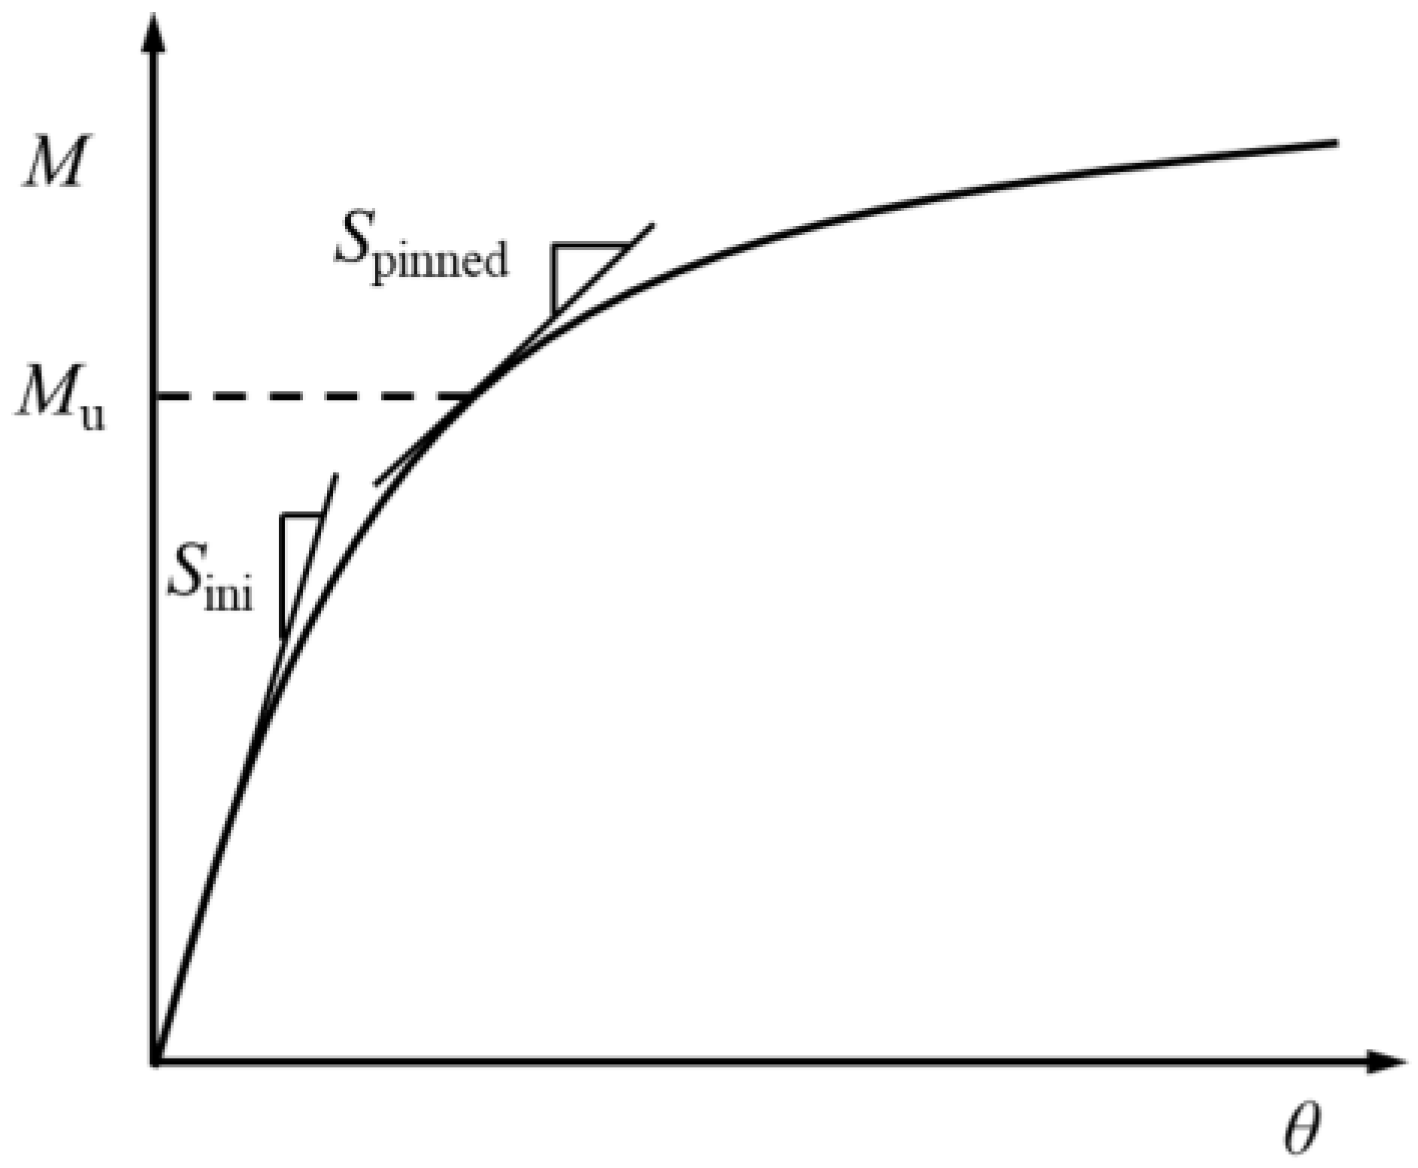
The flexural performance indexes of DC joints include initial rotational stiffness and moment resistance. The moment–rotation curves of the models start from point D. Due to the strengthening effect of the material, all moment–rotation curves are smooth and without the apparent descending stage. In European standard [37], the bending moment corresponding to the lower limit of the rotation stiffness of the semi-rigid joint is the moment resistance. The lower limit of rotation stiffness is obtained by the following formula:
S p i n n e d = E I 2 L
where L equals 15 times the height of the bending section [38]. The initial rotational stiffness is the slope at the initial stage of the moment–rotation curve. The selection criteria of the flexural performance indexes are shown in Figure 18.

5.2. Parameters Analysis on Flexural Performance

5.2.1. Influence of Eccentricity

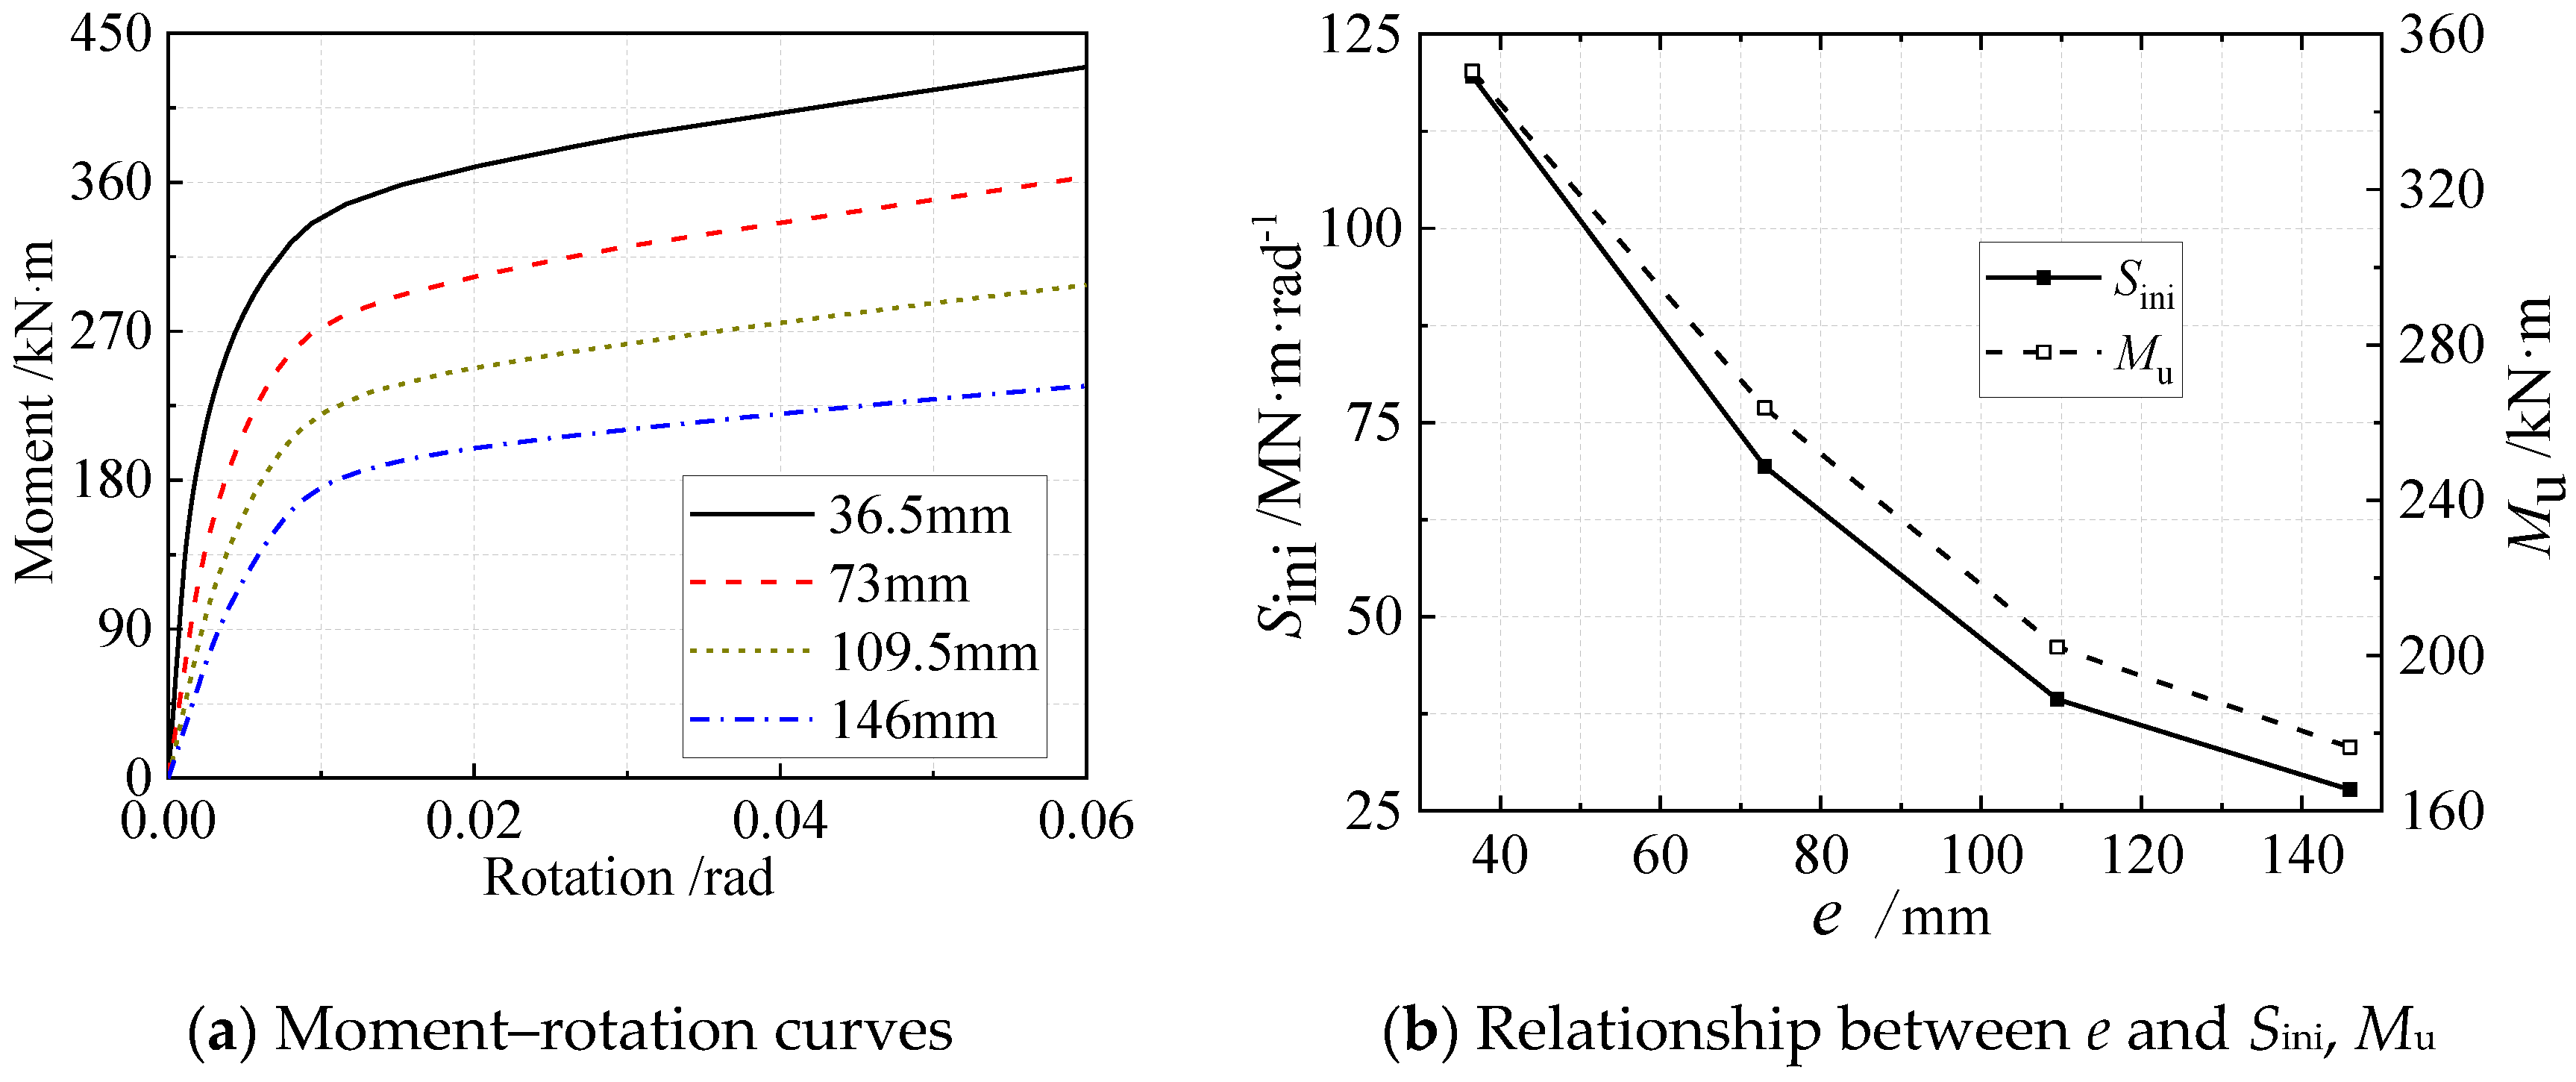
Figure 19a shows the moment–rotation curves of DC joints under different eccentricities. Eccentricity significantly affects flexural performance; flexural performance decreases with eccentricity. The relationship of eccentricity with initial rotational stiffness and moment resistance is presented in Figure 19b. The influence of eccentricity on flexural performance gradually weakens with the increase in eccentricity. The initial rotational stiffness and moment resistance decrease by 50.3 MN·m·rad−1 and 86.7 kN·m, respectively, as the eccentricity increases from 36.5 mm to 73 mm. However, the initial rotational stiffness and moment resistance significantly decrease by 11.6 MN·m·rad−1 and 25.8 kN·m, respectively, as the eccentricity increases from 109.5 mm to 146 mm.

5.2.2. Influence of Steel Wedge Length

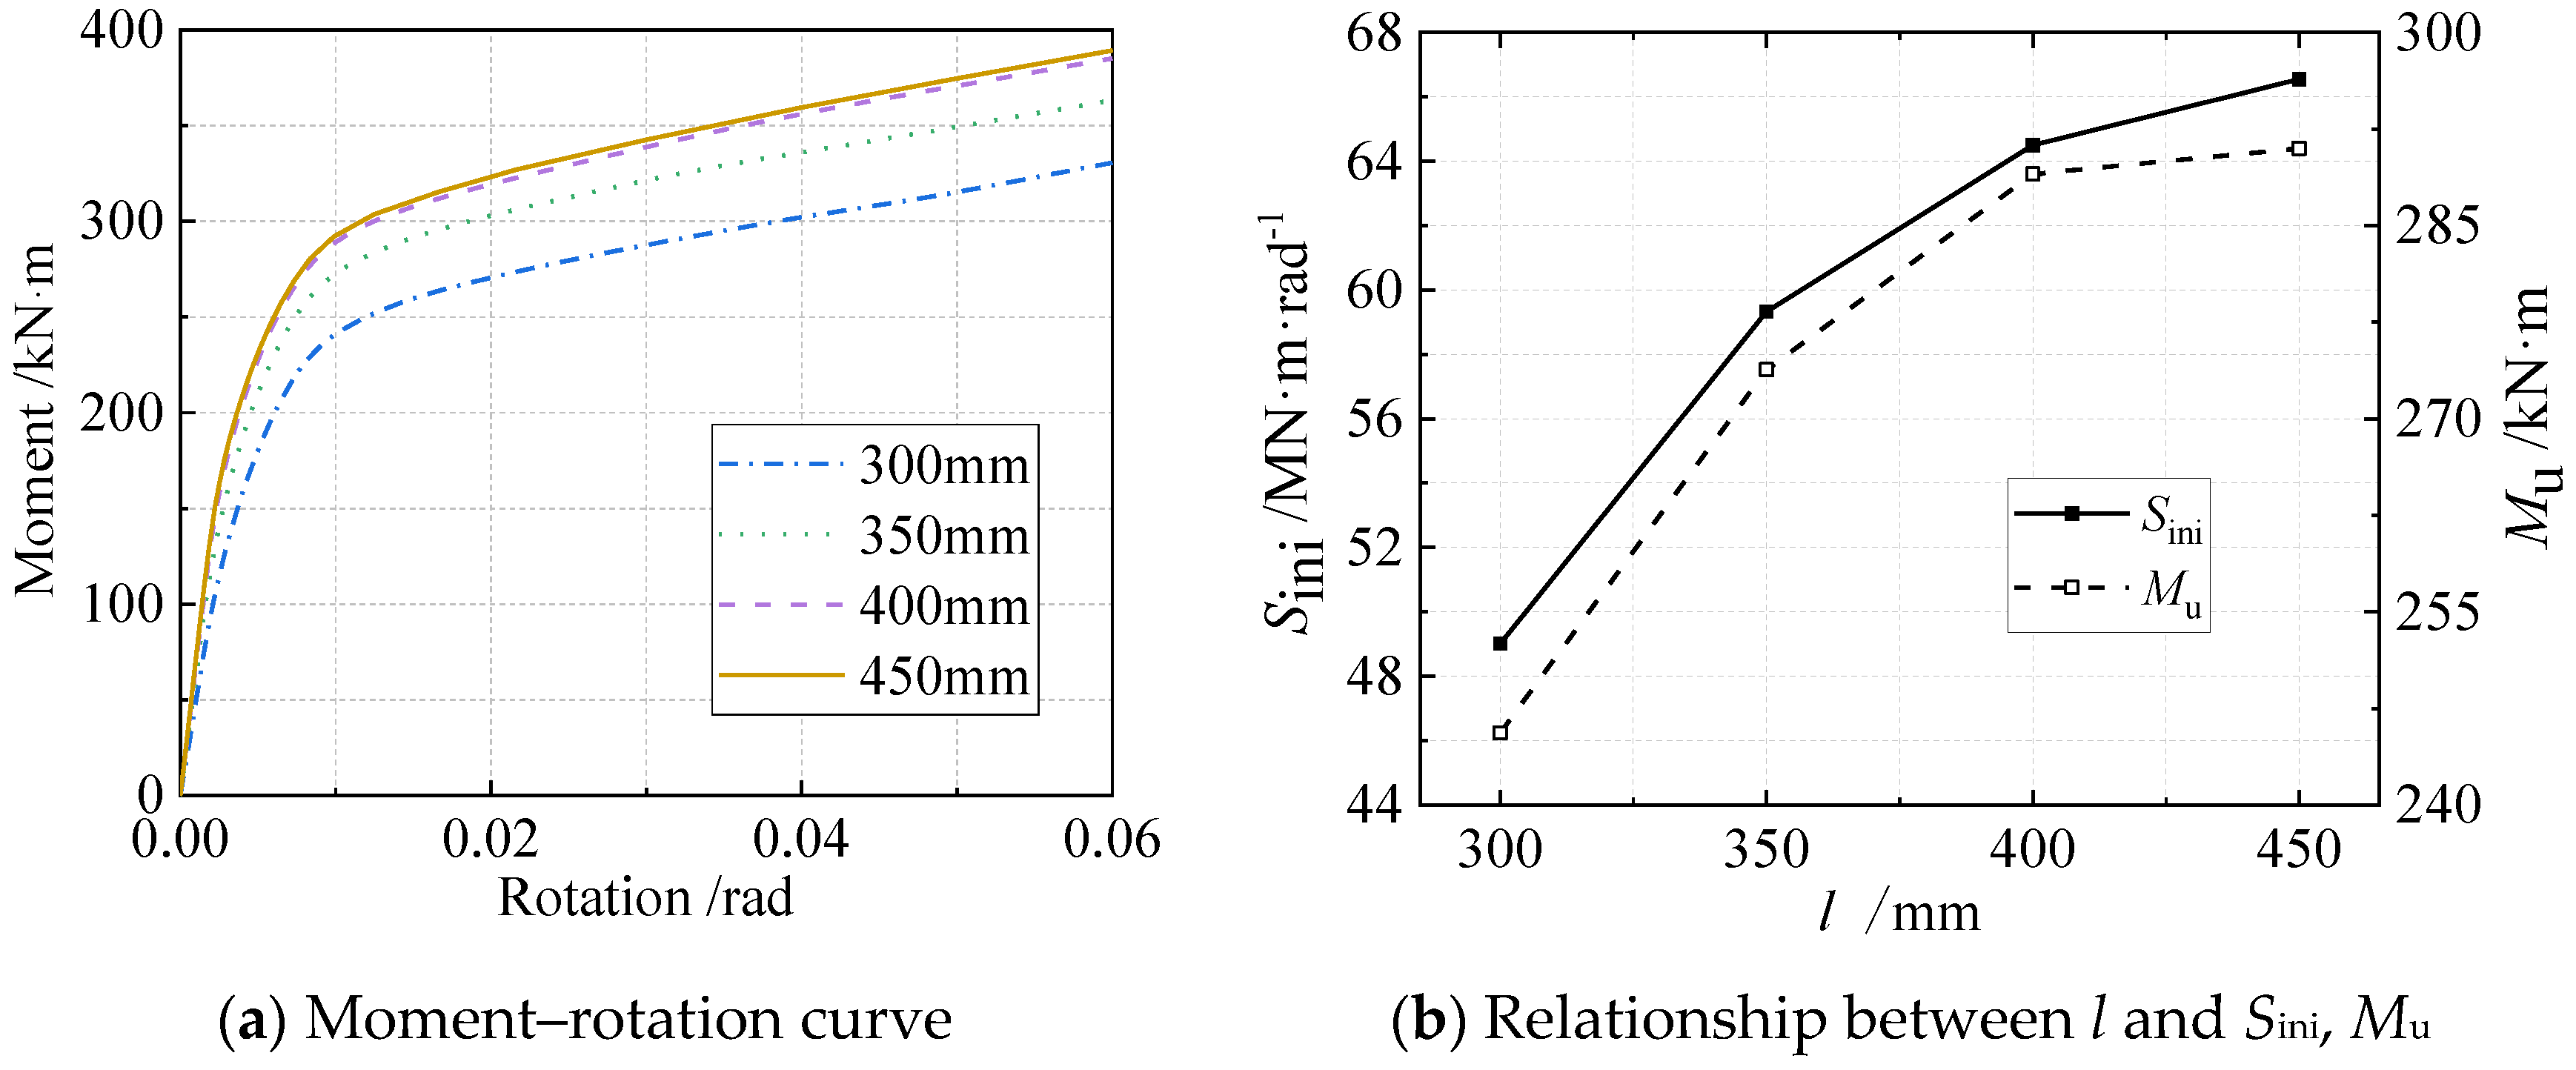
Figure 20a shows the effect of steel wedge length on the moment–rotation curves. Length significantly improves the flexural performance of DC joints when the length is less than 350 mm. Figure 20b shows the relationship of the steel wedge length with the initial rotational stiffness and moment resistance. When the length increases from 300 mm to 350 mm, the initial rotational stiffness and moment resistance increase by 9.5 MN·m·rad−1 and 27.9 kN·m, respectively, and their increase rate is about 30.2% and 12.9%, respectively. When steel wedge length is greater than 350 mm, the effective compression area is unaffected because the length exceeds the lower edge length of the middle-rib plate. Therefore, when steel wedge length increases from 350 mm to 400 mm, the increase rate of the initial rotational stiffness and moment resistance is only 8.7% and 5.5%, respectively. The increase rate decreases to 3.2% and 0.7%, respectively, as the steel wedge length increases from 400 mm to 450 mm. Therefore, in practical engineering, the steel wedge length should be greater than that of the lower edge of middle-rib plate, and excessively long steel wedges are unnecessary.

5.2.3. Influence of Steel Wedge Width

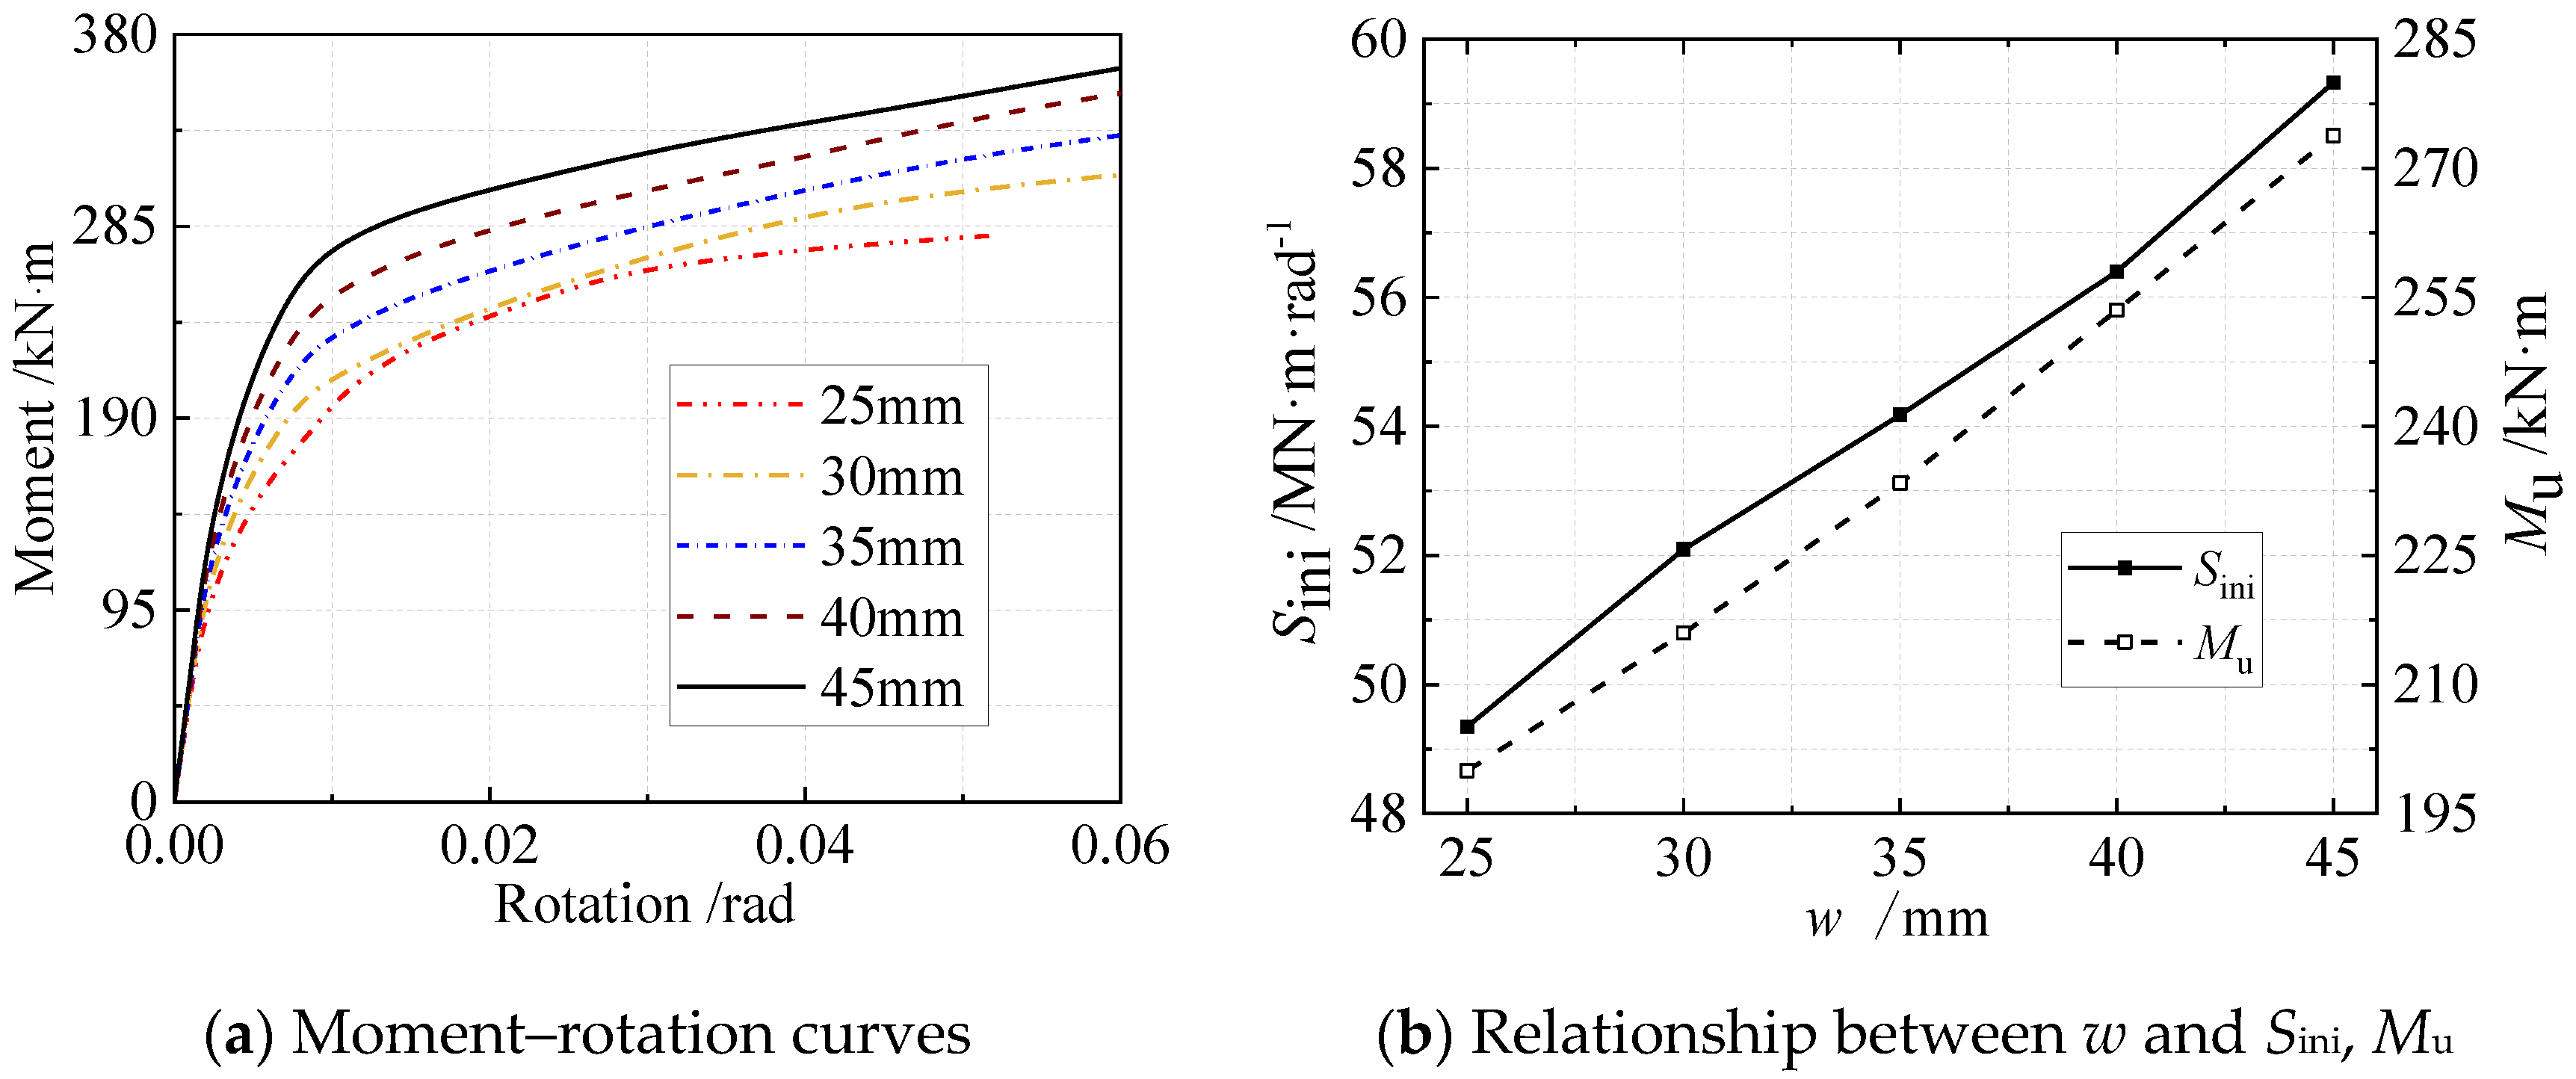
Steel wedge width weakly affects the flexural performance of DC joints, as shown in Figure 21a; flexural performance increases with steel wedge width. When the width is 25 mm, the joints produce local buckling of the steel wedge at the later stage of loading. Flexural performance is undesirable when the width is 25 mm. As revealed in the relationship curves in Figure 21b, the correlation between steel wedge width and the moment resistance, initial rotational stiffness is linear and positive. The initial rotational stiffness and moment resistance increase by 2.5 MN·m·rad−1 and 18.5 kN·m, respectively, as the steel wedge width each increase by 5 mm, and their average increase rates are 4.7% and 8.2%, respectively.

5.2.4. Influence of Steel Wedge Height

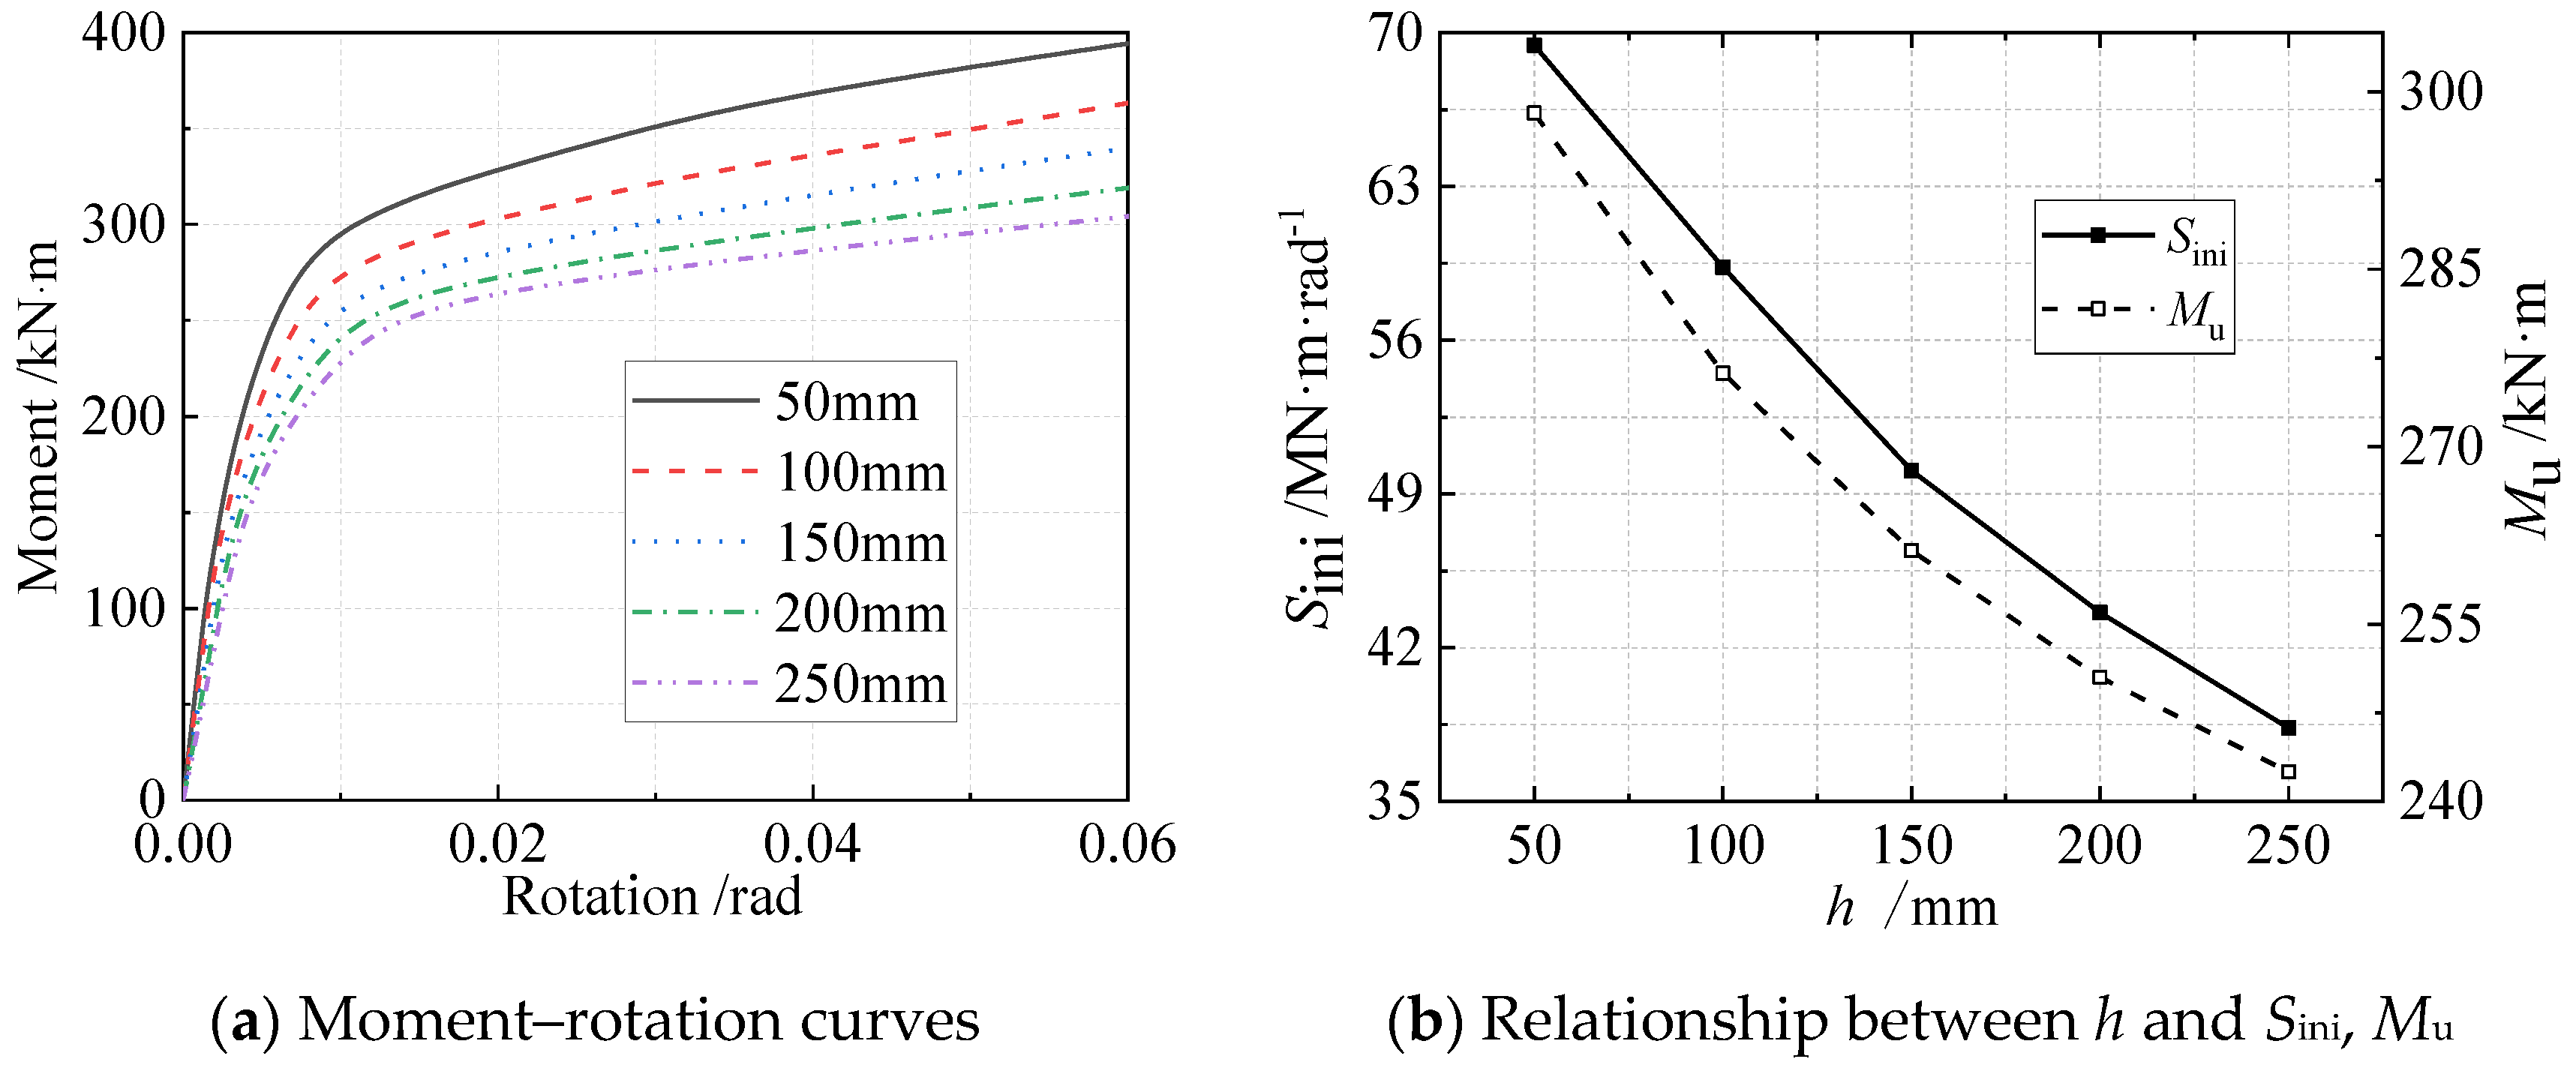
The moment–rotation curves of different steel wedge heights are given in Figure 22a. The flexural performance of DC joints gradually decreases with steel wedge height. Figure 22b shows the relation curves of steel wedge height on initial rotational stiffness and moment resistance. Steel wedge height is inversely correlated with the initial rotational stiffness and moment resistance, and the correlation gradually weakens. When the steel wedge height increases from 50 mm to 100 mm, the initial rotational stiffness and moment resistance decrease by 10.1 MN·m·rad−1 and 22 kN·m, respectively. When the height increases from 200 mm to 250 mm, the initial rotational stiffness and moment resistance decrease 5.3 MN·m·rad−1 and 8 kN·m, respectively. The decrease rates of initial rotational stiffness are 14.5%, 13.3%, 9.3% and 3%, respectively, and those of moment resistance are 7.4%, 5.0%, 4.1% and 3.2%, respectively.

5.2.5. Influence of Steel Tube Wall Thickness

According to Figure 23a, it can be found that flexural performance increases with the wall thickness of the steel tube. The increase of wall thickness does not significantly improve the flexural performance of DC joints. Figure 23b shows the relationship of wall thickness with the initial rotational stiffness and moment resistance of DC joints. The results show that wall thickness is linearly and positively related to the initial rotational stiffness and moment resistance; the initial rotational stiffness increases by 6.7 MN·m·rad−1 and the moment resistance increases by 2.1 kN·m with the increase of steel tube wall thickness by 2 mm in each step. The average increase rates of the two are about 17% and 0.8%, respectively.

5.2.6. Influence of Channel Steel Thickness

Figure 24a shows the moment–rotation curves for different channel thickness. In the early stage of loading, the influence of varying channel thicknesses on flexural performance is slight when the bending moment is less than 150 kN·m. When the bending moment is greater than 150 kN·m, the effect of channel thickness is significant. According to the relationship curves in Figure 24b, the initial rotational stiffness and moment resistance increase with channel thickness, and the increase rate gradually decreases. The increase rate of initial rotational stiffness decreases from 7.1% to 4.0%, and the increase rate of moment resistance decreases from 10.9% to 5.4%, when the channel thickness increases from 7 mm to 19 mm.

5.2.7. Influence of Middle-Rib Plate Height

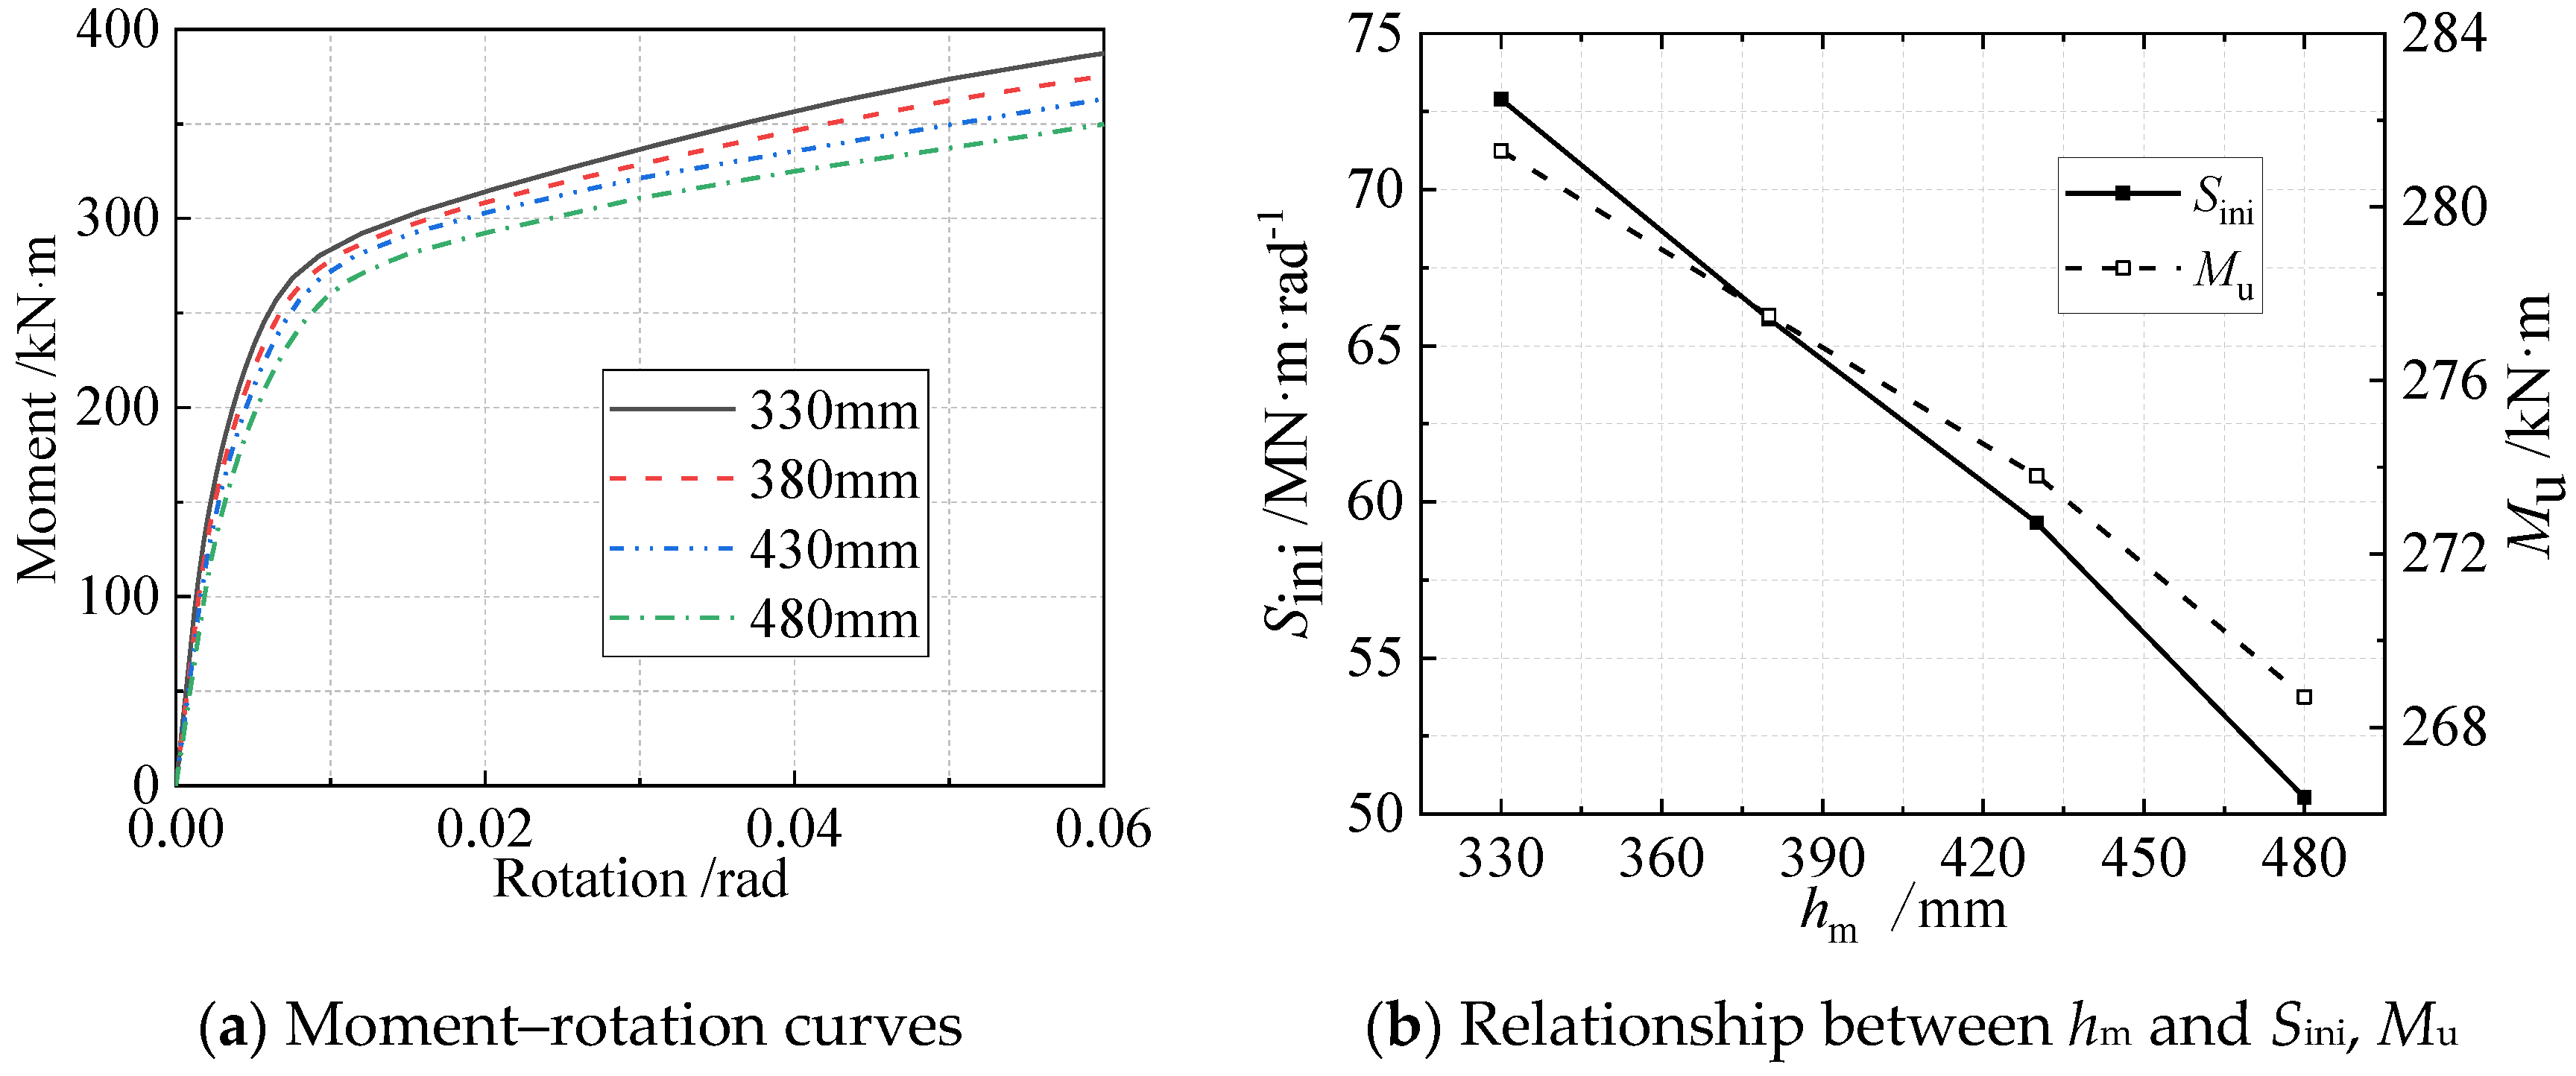
According to Figure 25a, the flexural performance of DC joints decreases with the height of the middle-rib plate. Due to the restraint effect of the channel steel on both sides of the middle-rib plate, the height of the middle-rib plate weakly impacts flexural performance. Figure 25b shows the influence of middle-rib plate height on initial rotational stiffness and moment resistance. The initial rotational stiffness and moment resistance decrease linearly with the height of the middle-rib plate when the height is less than 430 mm. When the middle-rib plate height increases by 50 mm, the initial rotational stiffness and moment resistance decrease linearly by 7.8 MN·m·rad−1 and 3.8 kN·m, respectively, and their reduction rates are 9.3% and 1.3%, respectively. When the middle-rib plate height exceeds 430 mm, the reduction rate of initial rotational stiffness and moment resistance slightly increase to 10.2% and 1.5%, respectively.

6. Moment–Rotation Model

6.1. Building Model

The slope of the moment–rotation curves is increasing at the later stage of loading, as described accurately in the model proposed by the literature [29] and in the moment–rotation models here proposed. The moment–rotation model is consistent with the changing trend of the moment–rotation curves of DC joints, as in Section 4. The model begins with Equation (2). In this model, Mi represents the idealized elastic-plastic mechanism moment, which refers to the limit bending moment when the material of the DC joints shows plastic strain; θ0 means reference rotation; n represents the shape parameter of structure, is only related to θ0 and needs to be obtained by fitting; the calculation of Mi is irrelevant to some parameters such as h and hm, while Mi is relevant to h and hm in the numerical results. Therefore, the model needs to be modified, and the correction coefficient λ is introduced. The moment–rotation model of DC joints is listed in Equation (3).
M M i = n ln 1 + θ n θ 0
M = λ M i n ln 1 + θ n θ 0
According to a series of numerical analysis results of DC joints under eccentric compression, the deformation of a DC joint is mainly caused by the steel wedges. The deformation of the middle-rib plate is only 1% of that of the steel wedges, due to the restriction of channel steel. The deformation of the middle plate is 7% of that of the steel wedges, due to the action of the stiffening ribs. Therefore, the deformation of the middle plate and middle-rib plate can be ignored, and it can be assumed that the bending of DC joints is caused entirely by the deformation of the steel wedges.

6.2. Determination of Parameters

6.2.1. Determination of Mi

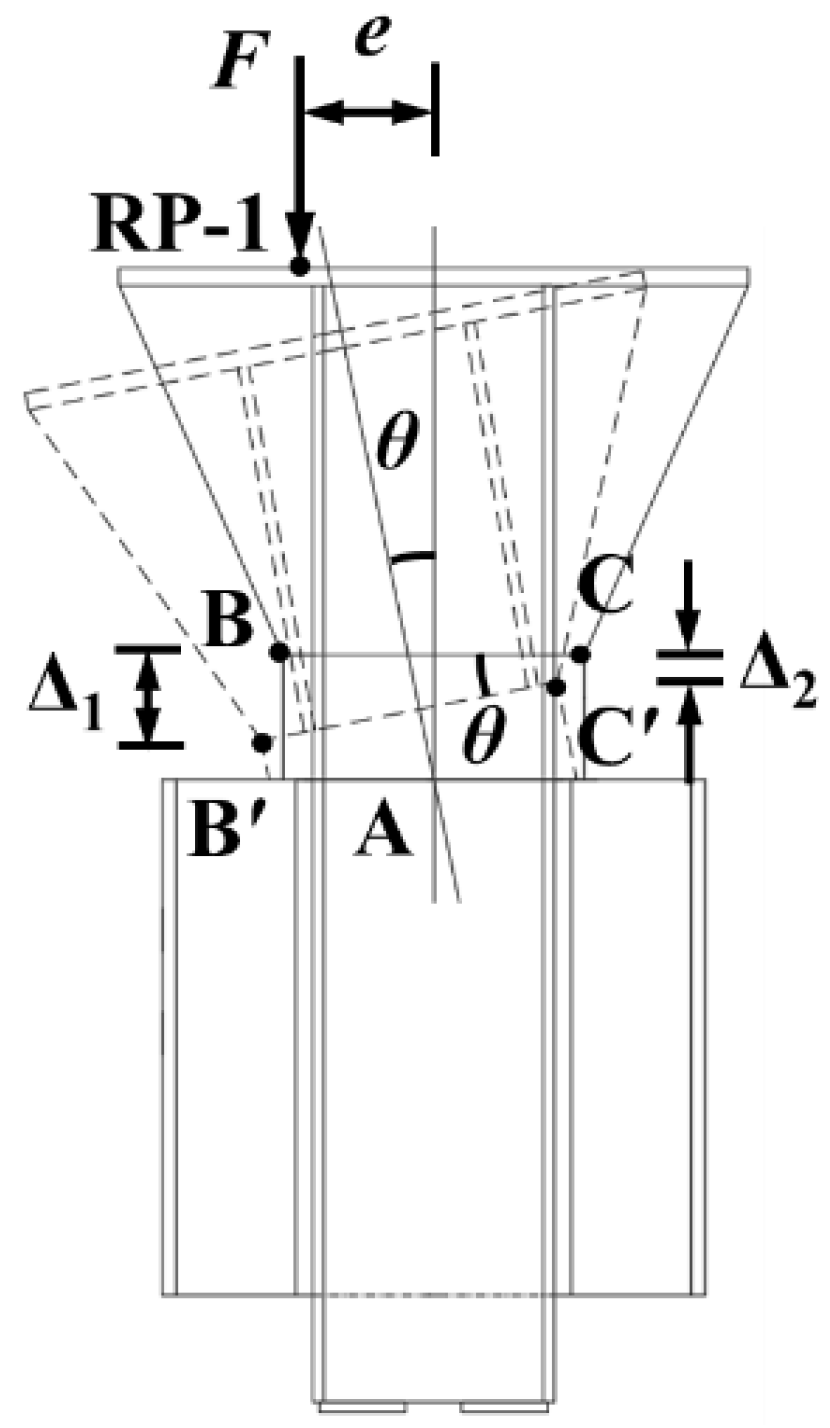
The deformation diagram of DC joints under eccentric load is shown in Figure 26. It can be found that the DC joint is a compression-flexure member. The bottom of the channel steel is free. The channel steel only bears the bending moment. Therefore, the following formula is satisfied for the DC joint:
F A + M i W = f y
Namely,
M i = A e W f y A e + W
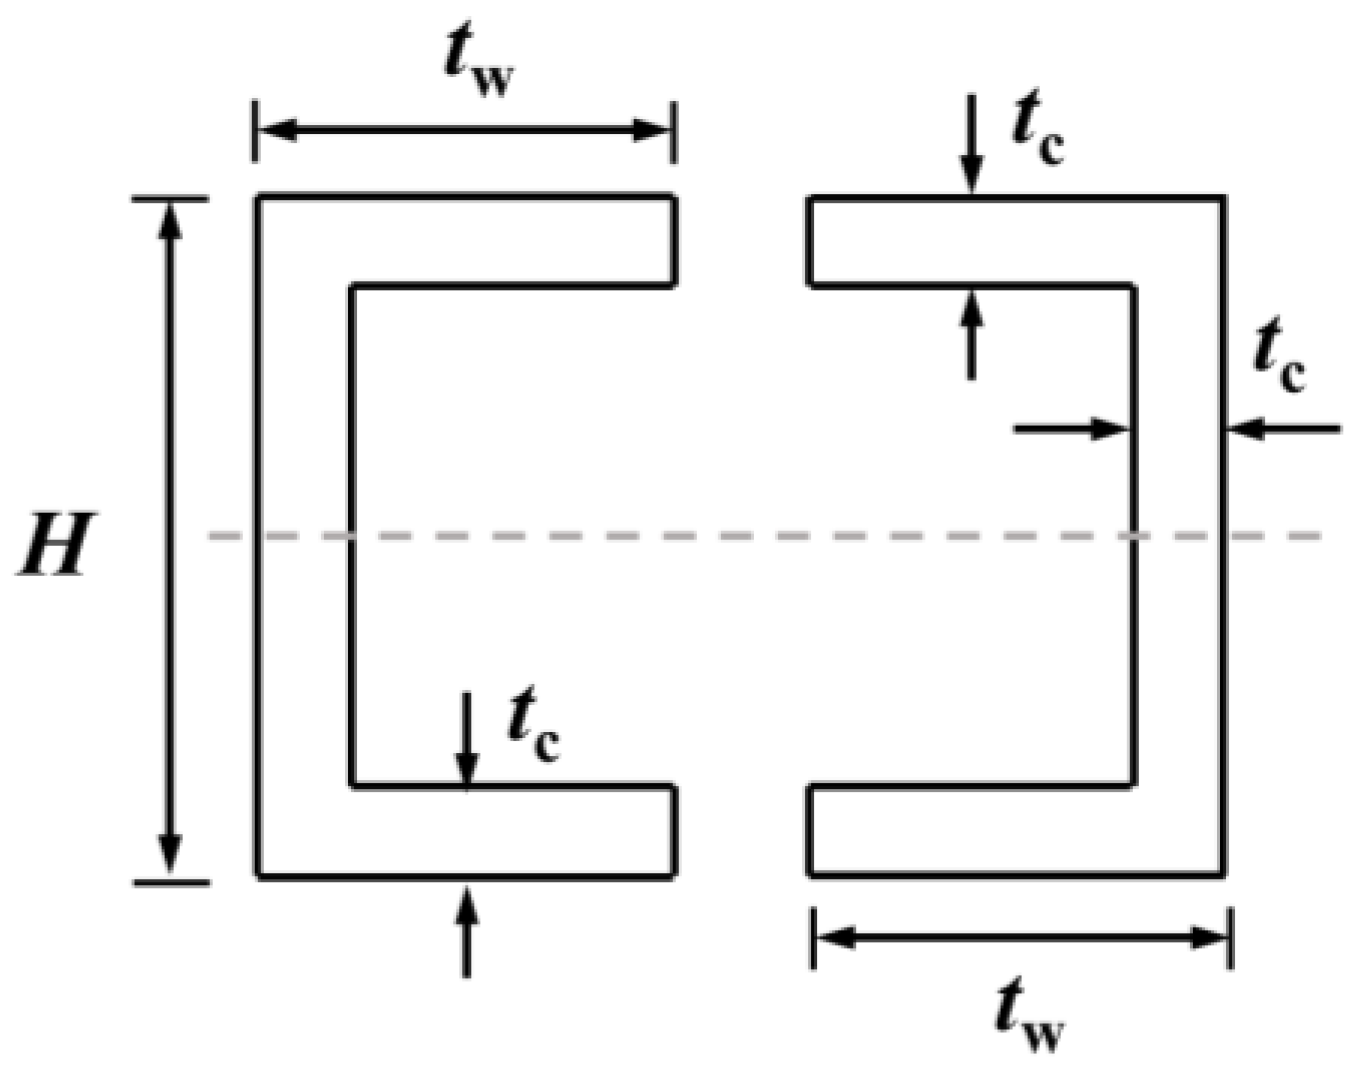
where W represents the bending section coefficient of the DC joints (the calculation formula of W is listed in Equation (6), some parameters of which are explained in Figure 27); fy represents the yield strength of the material; A means the effective compression area of steel wedges.
W = t c H 3 + t w t c 2 t c 3 + 6 t c H t c 2 3 H + w l 3 12

6.2.2. Determination of θ0

Because the deformation of the middle plate is slight, the point A is regarded as the rotation center. θ represents the angle of the axis rotating around point A; it equals the angle before and after the deformation of the upper surface of the steel wedge, as shown in Figure 26. If Δ1 is the vertical deformation at point B and Δ2 is the vertical deformation at point C, then θ meets the following requirements:
θ = arctan Δ 1 Δ 2 l
θ0 is the rotation angle as the joint begins to produce plastic strain. When the joint reaches θ0, the corresponding load is called the ultimate bending load. The ultimate bending load Fi meets the following formula:
F i = M i e
When the eccentricity is less than one-sixth of the steel wedge length, the DC joint is a small eccentric compression member. Otherwise, it is a large eccentric compression member. The different force forms of steel wedges under different eccentricities are shown in Figure 28. Figure 28a shows the force form with small eccentricity, and Figure 28b shows the force form with large eccentricity.
The parameters in Figure 28 are calculated using the following formulas:
P 0 = F w l 1 + 6 e l e l 6 P 0 = 2 F 3 a w e > l 6 P 1 = F w l 1 6 e l a = l 2 e
(1)
Calculation of Δ1
According to Boussinesq’s equation, the elasticity solution of the displacement at any point in the half-space can be obtained under the action of the vertical force, as follows:
ω ( x , y ) = 1 μ 2 π E A p ξ , η x ξ 2 + y η 2 d ξ d η
If the deformation of the steel wedges at point B is Δ1, and the coordinates x = 0 and y = 0 of point B are taken into Equation (9), the calculation of Δ1 is as follows:
Δ 1 = ω ( 0 , 0 ) = 1 μ 2 π E 0 w 0 b p ξ , η ξ 2 + η 2 d ξ d η
The result is as follows:
Δ 1 = 1 μ 2 π E 0 w P 0 ln b + b 2 + η 2 η d η + 1 μ 2 π E 0 w z η b 2 + η 2 d η
Order, Δ 1 , 1 = 1 μ 2 π E 0 w P 0 ln b + b 2 + η 2 η d η , Δ 1 , 2 = 1 μ 2 π E 0 w z η b 2 + η 2 d η .
According to the Gauss–Legendre quadrature formula, Δ1,1 can be obtained as follows:
Δ 1 , 1 = 1 μ 2 P 0 π E w 2 5 9 f 15 5 + 8 9 f 0 + 5 9 f 15 5
where f x = ln b + b 2 + w x 2 + w 2 2 w x 2 + w 2 .
Δ1,2 is further solved as follows:
Δ 1 , 2 = 1 μ 2 π E z w 2 2 w 2 b 2 + w 2 b 2 2 ln w + b 2 + w 2 b
Among them, z = P 0 3 a e > l 6 P 0 P 1 l e l 6 , b = 3 a e > l 6 l e l 6 .
(2)
Calculation of Δ2
Similarly, the deformation of the steel wedges at point C is Δ2, and the coordinates x = l and y = 0 of point C are taken into Equation (9), then the calculation of Δ2 is as follows:
Δ 2 = ω ( l , 0 ) = 1 μ 2 π E 0 w 0 b p ξ , η ξ 2 + l η 2 d ξ d η
The results are as follows:
Δ 2 = 1 μ 2 π E 0 w P 0 ln b + b 2 + l η 2 l η d η + 1 μ 2 π E 0 w z l η b 2 + l η 2 d η
Order,
Δ 2 , 1 = 1 μ 2 π E 0 w P 0 ln b + b 2 + l η 2 l η d η , Δ 2 , 2 = 1 μ 2 π E 0 w z l η b 2 + l η 2 d η
According to the Gauss–Legendre quadrature formula, Δ2,1 can be concluded as follows:
Δ 2 , 1 = 1 μ 2 P 0 π E w 2 5 9 f 15 5 + 8 9 f 0 + 5 9 f 15 5
where f x = ln b + b 2 + 2 l w 2 w x 2 2 l w 2 1 + x .
Δ2,2 is further solved to obtain as follows:
Δ 2 , 2 = 1 μ 2 π E z l w 2 b 2 + l w 2 l b 2 + l 2 2 + b 2 2 ln l b + b 2 + l w 2 l + b 2 + l 2 + l w w 2 2
Among them, z = P 0 3 a e > l 6 P 0 P 1 l e l 6 , b = 3 a e > l 6 l e l 6 .

6.2.3. Determination of n

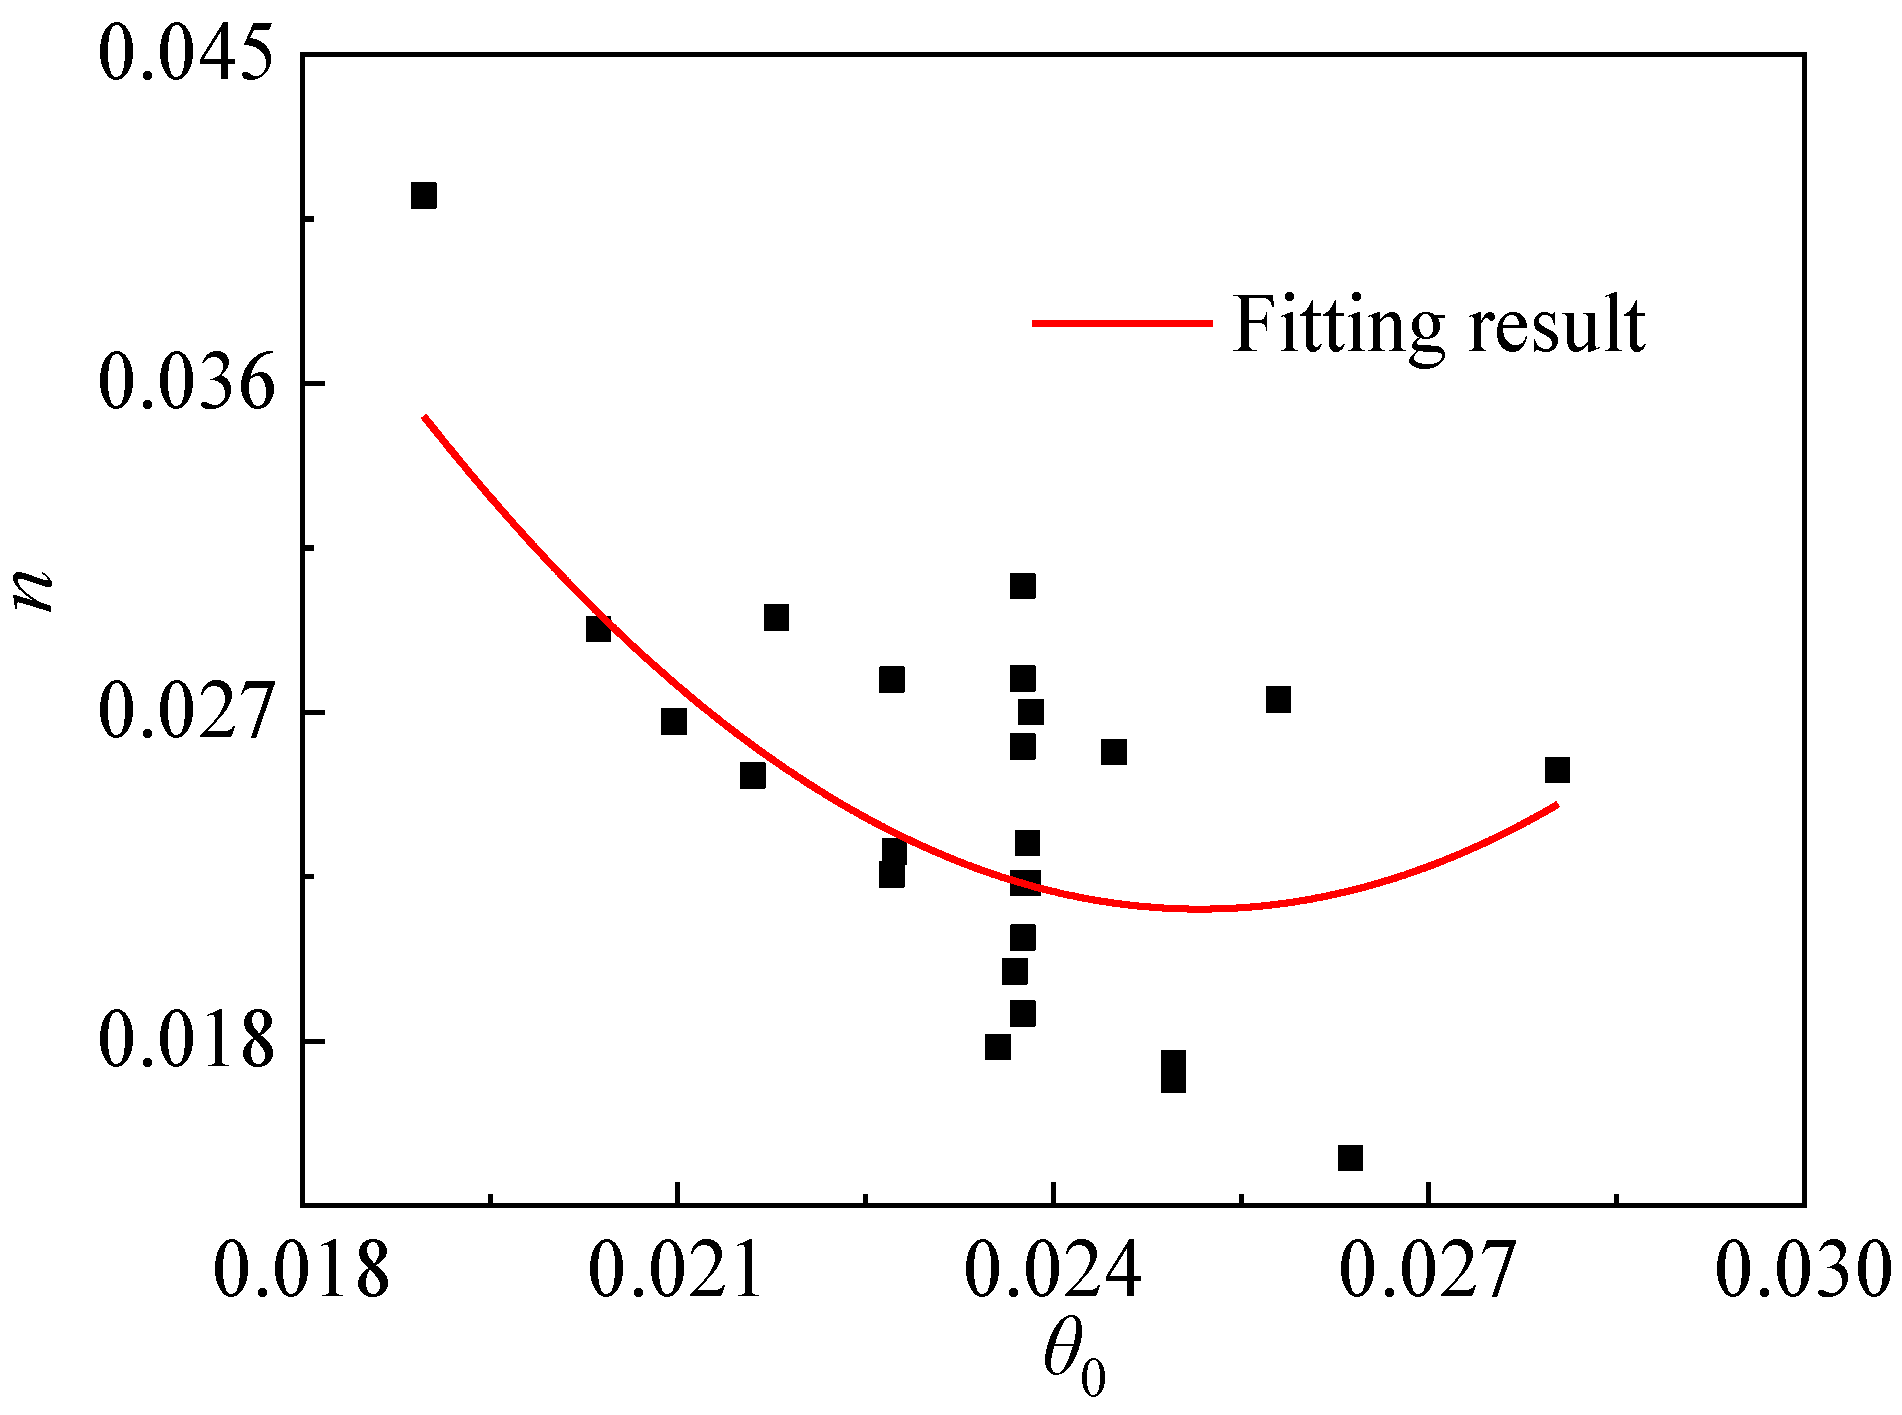
The analytical formula of the shape coefficient without specific physical meaning can not be deduced. Therefore, it is necessary to obtain an approximate solution for the fitting formula to solve the shape coefficient. Substituting the calculation results of Mi and θ0 into Equation (2), the value of n can be initially obtained. Therefore, the fitting curve can be performed according to the calculation results of n, as shown in Figure 29. n is only related to θ0, and the approximate calculation formula of n is fitted depending on the correlation between n and θ0, as follows:
n = 350.85 θ 0 2 17.66 θ 0 + 0.24

6.2.4. Determination of λ

λ is the introduced correction coefficient, which is related to the key position parameter of the DC joint. λ is an exponential function equation related to l/h, hm/w, e/(t + tc). The approximate solution of λ is obtained by fitting, as follows:
λ = 37.923 l h 0.237 h m w 0.108 e t + t c 1.097

6.3. Comparative Analysis of Numerical Results and Analytical Solutions

6.3.1. Comparative Analysis of Complete Curve

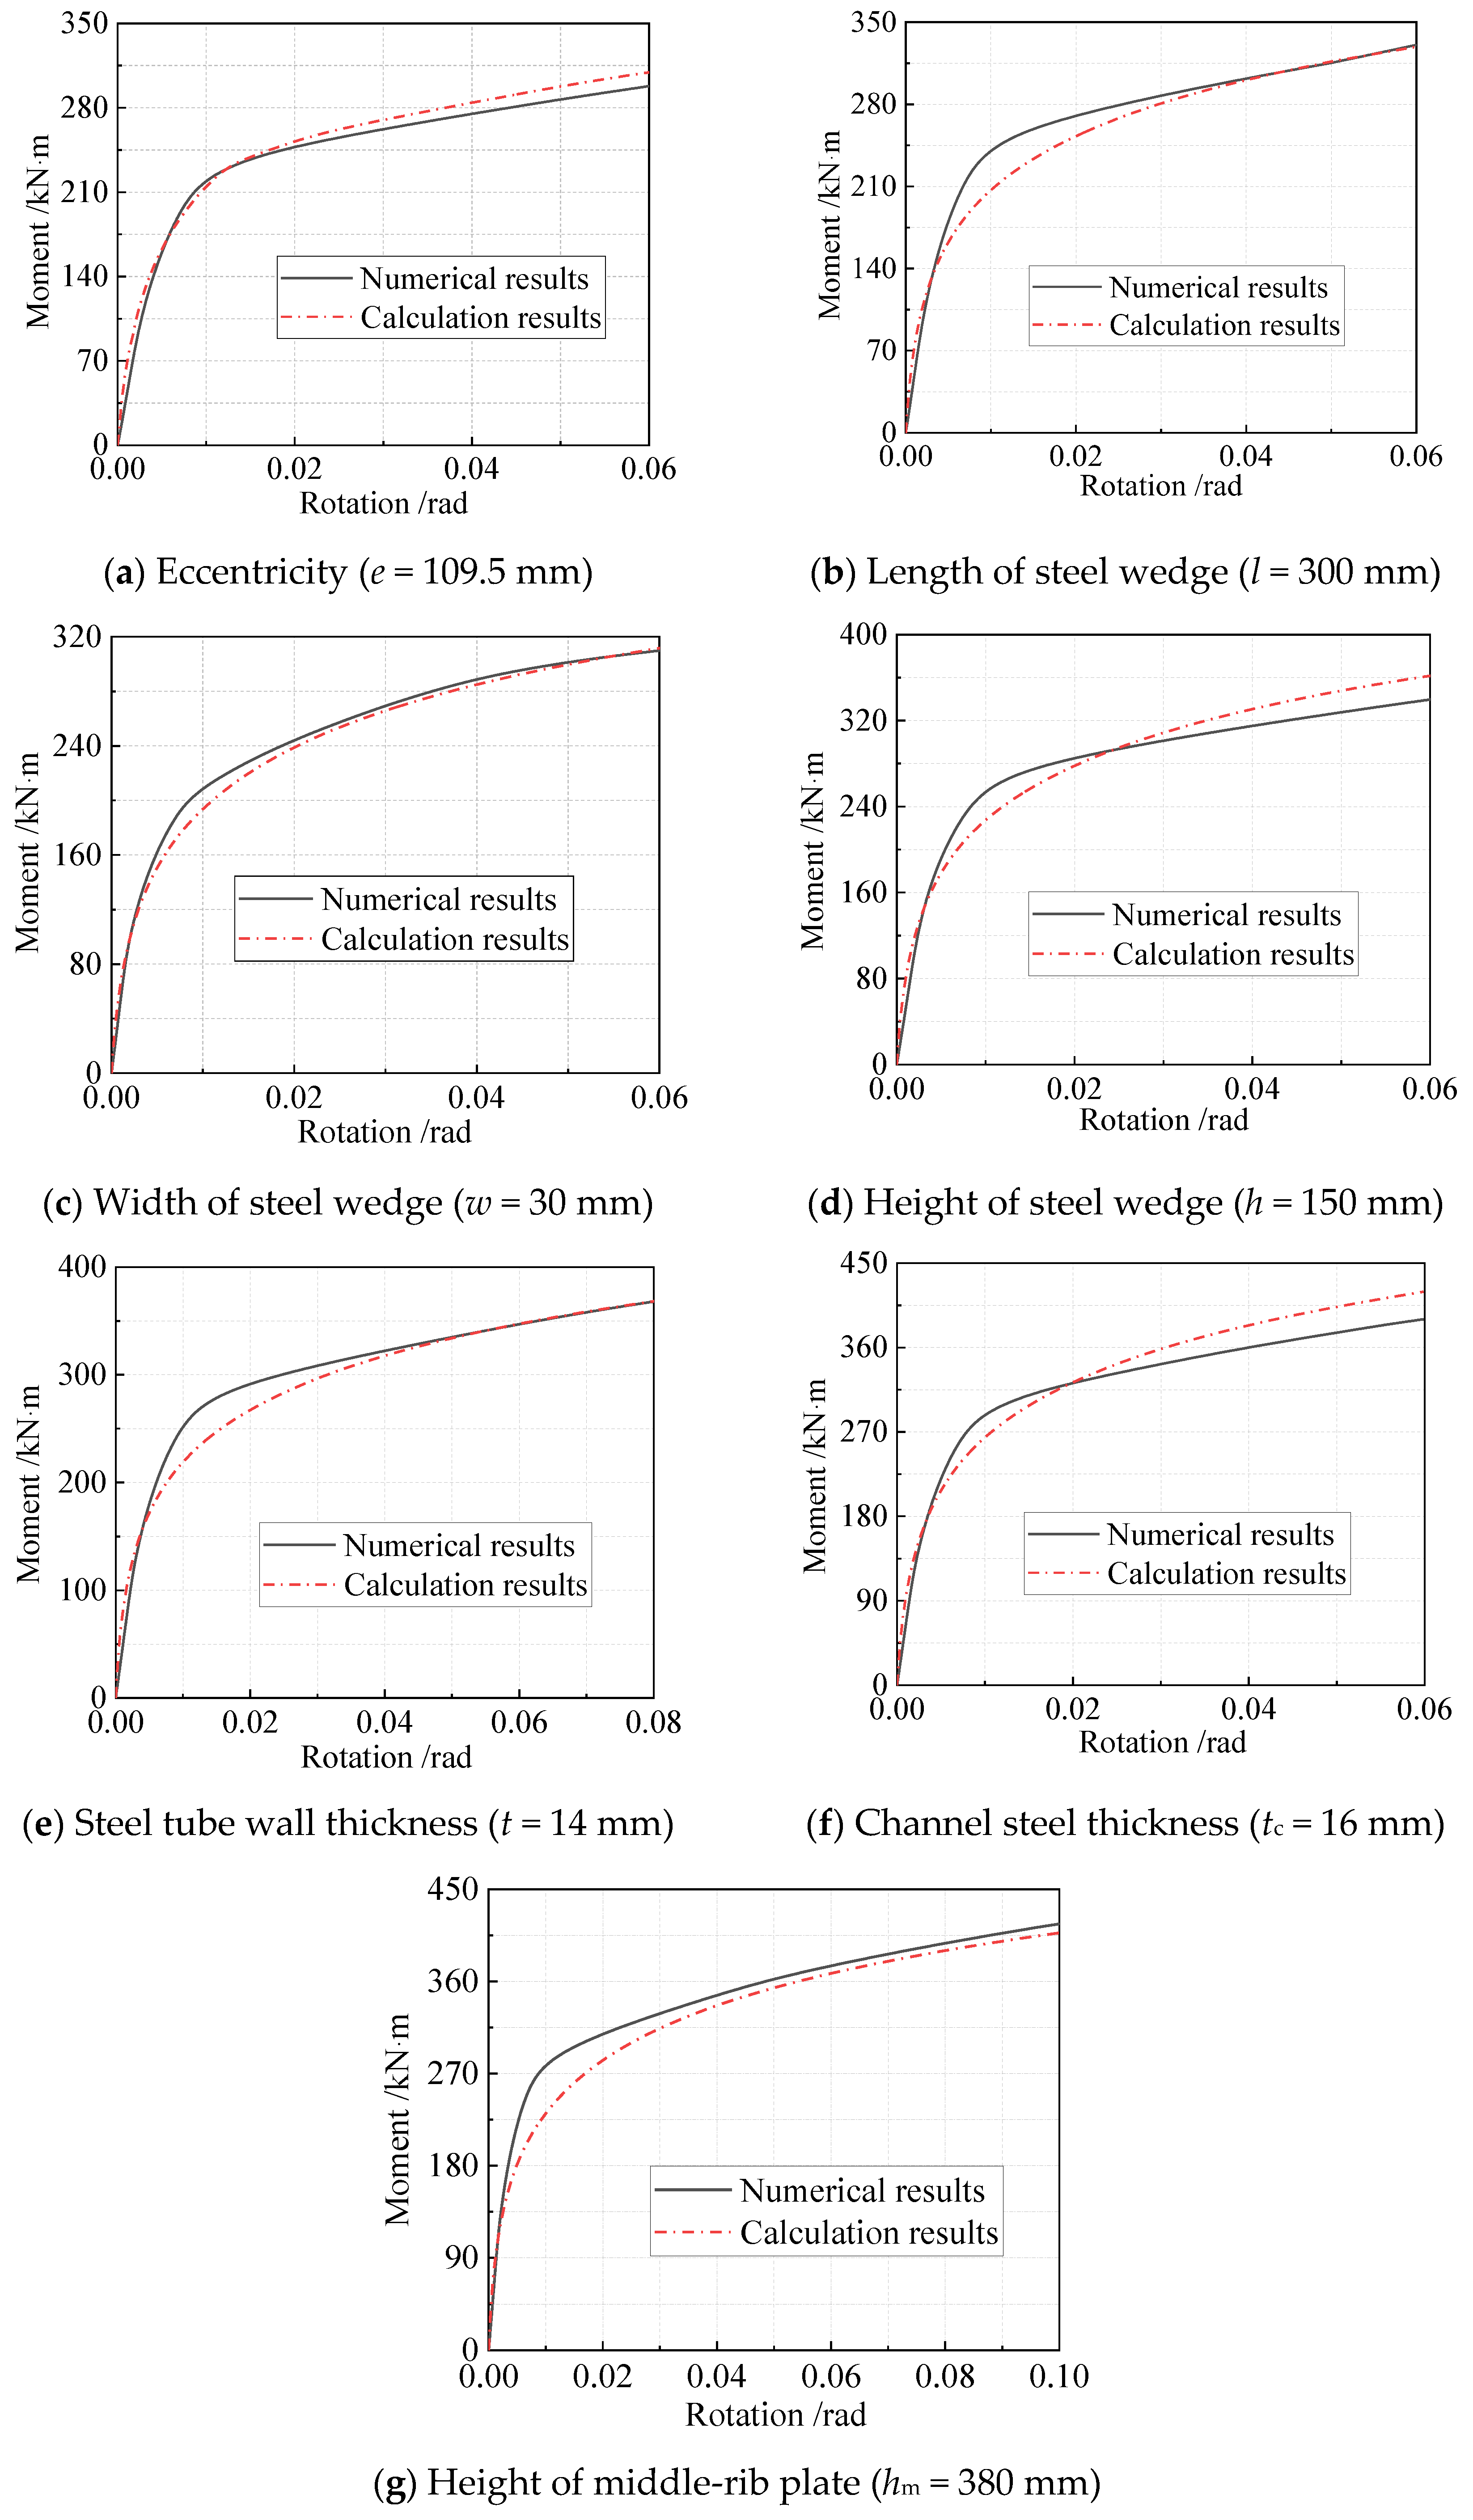
The moment–rotation curves of the 27 groups of models in Table 3 are obtained according to the established moment–rotation model. The calculation results and numerical results of a complete curve corresponding to each parameter are selected for comparative analysis, as shown in Figure 30. The full moment–rotation curves of the numerical results agree well with those of the calculation results. The agreement indicates the analytical formula can accurately and conveniently determine the moment–rotation curves of the DC joints, which is of value for engineering applications.

6.3.2. Comparative Analysis of Flexural Performance Indexes

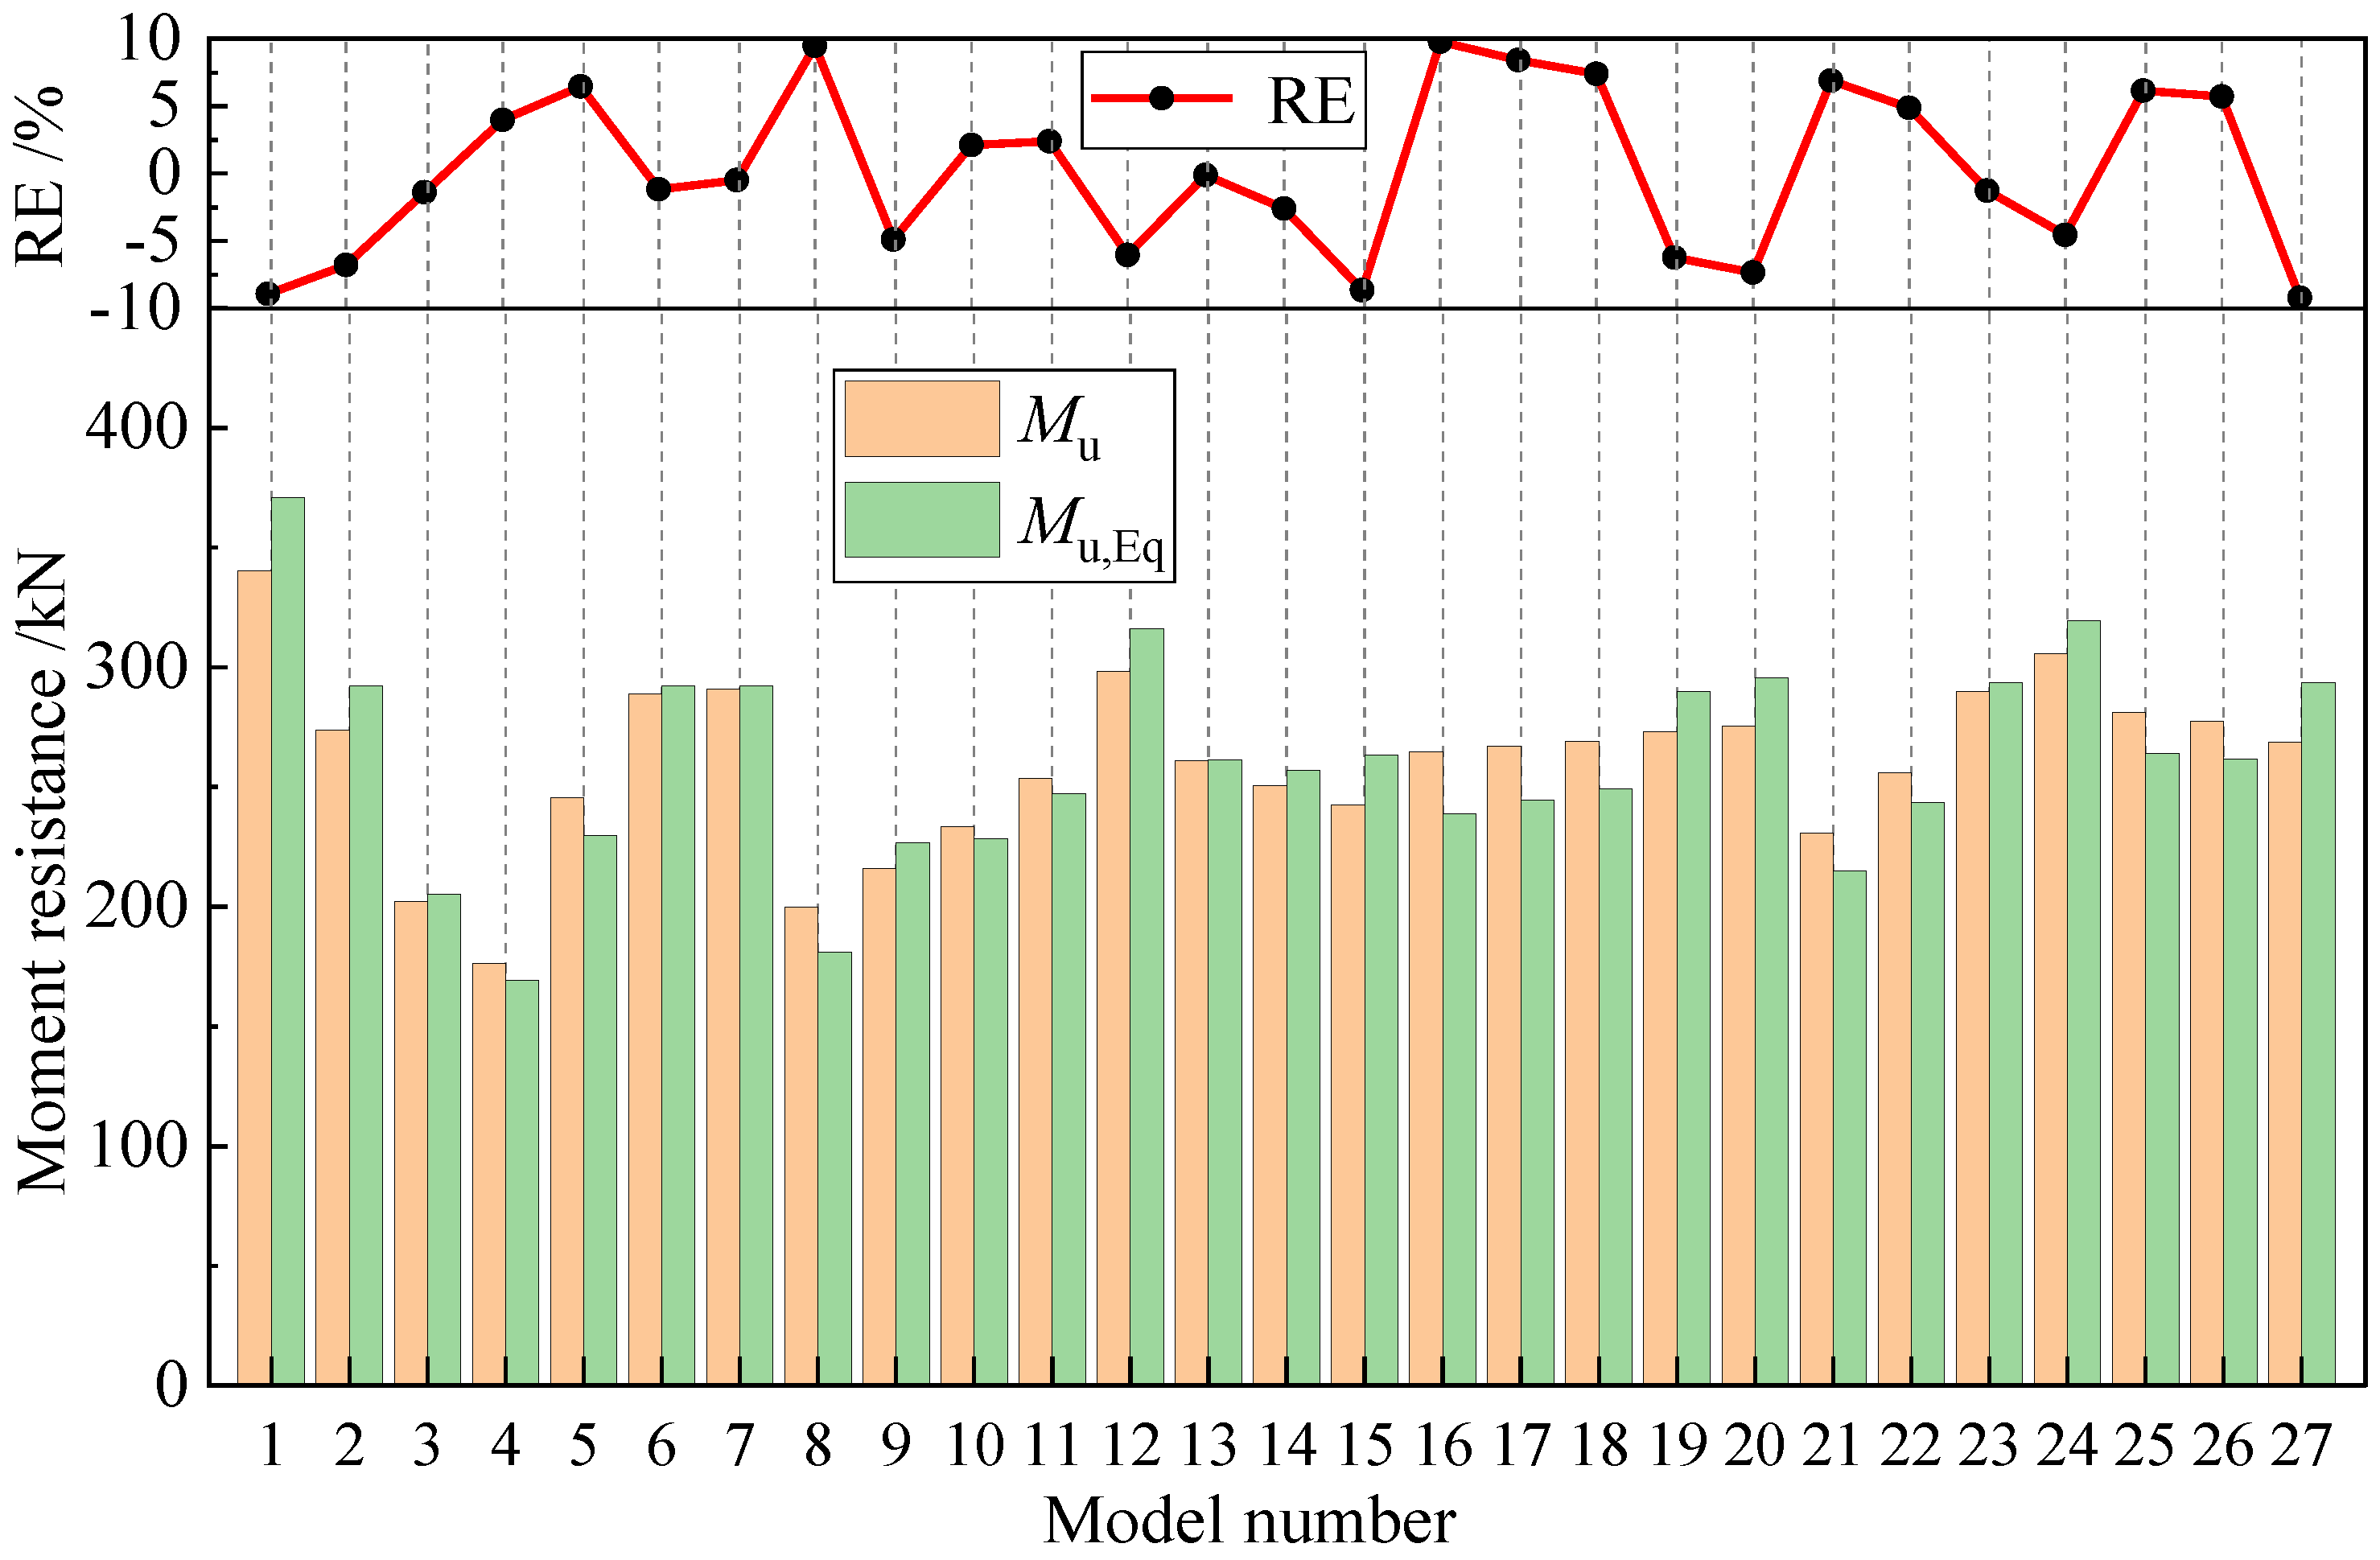
The flexural performance indexes of DC joints include initial rotational stiffness and moment resistance. The moment–rotation curves of the 27 numerical models can be calculated using Equation (3). The flexural performance indexes are determined according to the selection criteria in Section 4.1. The comparative analysis of moment resistance between the numerical results and the analytical results is shown in Figure 31, and the relative errors of the numeric and analytical results are calculated and listed in Figure 31. It was found that the analytical results are in good agreement with the numerical results, and all relative error is less than 10%. The relative error of more than 46% of the models is less than 5%. The maximum relative error is 9.7%, the minimum relative error is 0.1%, and the average is 5.3%. The comparative analysis and relative error of the numerical and analytical results of the initial connection stiffness are shown in Figure 32. The relative error of more than 85% of the models is less than 5%, the relative error of all models is less than 10%. The maximum relative error is 7.7%, the minimum relative error is 0.8%, and the average is only 3.3%. The analytical results of the flexural performance indexes agree well with the numerical results. The flexural performance indexes can be predicted accurately through the established moment–rotation model and the selection criteria, which is of application value.

7. Conclusions

Based on the axial compression test results of DC joints, a validated finite element simulation has been conducted, and then parameter analysis was performed through a series of numerical simulations. Furthermore, based on the numerical results, a moment–rotation model suitable for DC joints is proposed. The results are as follows:
(1)
The load-displacement curve and failure mode of DC joints obtained by numerical analysis are in good agreement with those of the experimental results. The finite element model can accurately simulate both the bearing capacity and flexural performance of DC joints under eccentric load.
(2)
Eccentricity significantly affects the flexural performance of DC joints. Flexural performance is reduced to 53% of the original, as eccentricity increases from 0 mm to 36.5 mm, so the effective control of eccentricity is beneficial in improving flexural performance.
(3)
The bearing capacity and flexural performance of DC joints decreases with eccentricity, steel wedge height and middle-rib plate height; they increase with steel wedge length, steel wedge width, channel steel thickness and steel tube wall thickness.
(4)
The calculation methods for both Mi and θ0 in the moment–rotation model are deduced, and the calculation formulas of both n and λ in the moment–rotation model are fitted. The correctness of the calculation formulas of the four parameters is verified by comparison with the bending resistance index of the numerical model of DC joints.
(5)
The thickness of channel steel has a significant effect on the flexural performance of DC joints. Therefore, in practical projects, appropriate strengthening of channel steel should be considered to effectively improve the flexural performance of DC joints.

Author Contributions

Conceptualization, X.N.; Methodology, Z.X.; Software, P.L.; Resources, M.Z.; Data curation, X.L. All authors have read and agreed to the published version of the manuscript.

Funding

The authors gratefully acknowledge the financial support provided by Natural Science Foundation of China under Grant Nos. 51978018, 51978019, 51538001 and 51627812.

Institutional Review Board Statement

Not applicable.

Informed Consent Statement

Not applicable.

Data Availability Statement

Data are contained within the article. The data presented in this study can be requested from the authors.

Conflicts of Interest

The authors declare no conflict of interest.

Nomenclature

eeccentricity
lsteel wedge length
wsteel wedge width
hsteel wedge height
twall thickness of steel pipe
tcchannel steel thickness
hmmiddle-rib plate height
Fyyield load
kinitial compression stiffness
Iinertial moment
Fconcentrated force
θrotation
Miidealized elastic-plastic mechanism moment
Siniinitial rotation stiffness
nshape parameter
Hweb height of channel
Sini, Eqinitial rotation stiffness of calculation
Mu, Eqmoment resistance of calculation
fuultimate stress
EYoung’s modulus
fyyield stress
δultimate deformation rate
ρdensity
υpoisson’s ratio
μcoefficient of friction
Lcalculated length of the bar
Wbending section coefficient
Mmoment
θ0reference rotation
Fiultimate bending load
Mumoment resistance
λcorrection coefficient
Aeffective compression area
twwidth of channel flange
RErelative errors
Spinnedlower limit of rotation stiffness

References

  1. Luo, Z.; Li, Y.; Zhou, S.; Di, H. Effects of vertical spatial variability on supported excavations in sands considering multiple geotechnical and structural failure modes. Comput. Geotech. 2018, 95, 16–29. [Google Scholar] [CrossRef]
  2. Cui, X.; Ye, M.; Zhuang, Y. Performance of a foundation pit supported by bored piles and steel struts: A case study. Soils Found. 2018, 58, 1016–1027. [Google Scholar] [CrossRef]
  3. Li, Z.; Han, M.; Liu, L.; Li, Y.; Yan, S. Corner and partition wall effects on the settlement of a historical building near a supported subway excavation in soft soil. Comput. Geotech. 2020, 128, 103805. [Google Scholar] [CrossRef]
  4. Ding, Z.; Wang, D.; Yu, X.F.; Wang, J.Y.; Jiang, J.Q. Monitoring and analysis of deep foundation pit at Xintang Road-JingfangRoad cross of Hangzhou metro. J. Geotech. Eng. 2013, 35, 445–451. (In Chinese) [Google Scholar]
  5. Lan, W.; Li, B.; Zhang, Z. Seismic performance of steel-concrete composite structural walls with prestressed internal bracing. J. Constr. Steel Res. 2018, 140, 11–24. [Google Scholar] [CrossRef]
  6. Zhang, M.J.; Yang, M.; Li, P.; Gao, Y.H. Mechanical behaviours of a symmetrical bolt fasten wedge active joint for braced excavations. Symmetry 2020, 12, 140. [Google Scholar] [CrossRef]
  7. Cheng, X.; Zheng, G.; Diao, Y.; Huang, T.; Deng, C.; Nie, D.; Lei, Y. Experimental study of the progressive collapse mechanism of excavations retained by cantilever piles. Can. Geotech. J. 2017, 54, 574–587. [Google Scholar] [CrossRef]
  8. Lam, E.S.-S.; Li, B.; Xue, Z.-H.; Leung, K.-T.; Lam, J.Y.-K. Experimental studies on reinforced concrete interior beam-column joints strengthened by unsymmetrical chamfers. Eng. Struct. 2019, 191, 575–582. [Google Scholar] [CrossRef]
  9. Yang, Y.; Xue, Y.; Wang, N.; Yu, Y. Experimental and numerical study on seismic performance of deficient interior RC joints retrofitted with prestressed high-strength steel strips. Eng. Struct. 2019, 190, 306–318. [Google Scholar] [CrossRef]
  10. Sasmal, S.; Voggu, S. Performance evaluation of differently designed beam-column joints under cyclic shear-torsion loading. Eng. Struct. 2019, 197, 109447. [Google Scholar] [CrossRef]
  11. Zeng, Q.; Guo, X.; Huang, Z.; Zong, S. Uniaxial compression bearing capacity of bolted ball-cylinder joint. Eng. Struct. 2019, 183, 976–986. [Google Scholar] [CrossRef]
  12. Özkılıç, Y.O. Cyclic and monotonic performance of unstiffened extended end-plate connections having thin end-plates and large-bolts. Eng. Struct. 2023, 281, 115794. [Google Scholar] [CrossRef]
  13. Özkılıç, Y.O. Interaction of flange and web slenderness, overstrength factor and proposed stiffener arrangements for long links. J. Constr. Steel Res. 2022, 190, 107150. [Google Scholar] [CrossRef]
  14. Feng, R.; Lin, J.; Mou, X. Experiments on hybrid tubular K-joints with circular braces and square chord in stainless steel. Eng. Struct. 2019, 190, 52–65. [Google Scholar] [CrossRef]
  15. Jin, D.; Hou, C.; Shen, L.; Han, L.-H. Numerical investigation of demountable CFST K-joints using blind bolts. J. Constr. Steel Res. 2019, 160, 428–443. [Google Scholar] [CrossRef]
  16. Pandey, M.; Young, B. Tests of cold-formed high strength steel tubular T-joints. Thin-Walled Struct. 2019, 143, 106200. [Google Scholar] [CrossRef]
  17. Özkılıç, Y.O. The capacities of unstiffened T-stubs with thin plates and large bolts. J. Constr. Steel Res. 2021, 186, 106908. [Google Scholar] [CrossRef]
  18. Özkılıç, Y.O. The capacities of thin plated stiffened T-stubs. J. Constr. Steel Res. 2021, 186, 106912. [Google Scholar] [CrossRef]
  19. Chen, Y.; Hu, Z.; Guo, Y.; Wang, J.; Tong, G.; Liu, Q.; Pan, Y. Effects of chord pre-load on strength of CHS X-joints stiffened with external ring stiffeners and gusset plates. Eng. Struct. 2019, 195, 125–143. [Google Scholar] [CrossRef]
  20. Zhang, M.J.; Xie, Z.T.; Liu, Y.X.; Li, P.F.; Yang, M. Mechanical properties and improvement measures of the active node in steel braced foundation pit engineering for subway. J. Beijing Jiaotong Univ. 2019, 43, 66–73. (In Chinese) [Google Scholar]
  21. Wang, S.J.; Zhang, Y.Y.; Li, J.W.; Huang, D. Field test verification of new flexible head steel support and deep foundation excavation support effect. Constr. Technol. 2019, 48, 72–77. (In Chinese) [Google Scholar]
  22. Zhang, M.; Xie, Z.; Li, P. Experimental and numerical investigation on the bearing capacity of disconnectable coupling (DC) joints for prestressed internal bracing in subway excavations. Tunn. Undergr. Space Technol. 2020, 104, 103501. [Google Scholar] [CrossRef]
  23. Ye, S.H.; Ding, S.H.; Gong, X.N.; Gao, S. Monitoring and numerical simulation of deep foundation pit of a subway station in Lanzhou. Chin. J. Geot. Eng. 2018, 40, 177–182. (In Chinese) [Google Scholar]
  24. Halder, K.; Chakraborty, D. Effect of inclined and eccentric loading on the bearing capacity of strip footing placed on the reinforced slope. Soils Found. 2020, 60, 791–799. [Google Scholar] [CrossRef]
  25. Franza, A.; Sheil, B. Pile groups under vertical and inclined eccentric loads: Elastoplastic modelling for performance based design. Comput. Geotech. 2021, 135, 104092. [Google Scholar] [CrossRef]
  26. Liu, J.; Shi, C.; Cao, C.; Lei, M.; Wang, Z. Improved analytical method for pile response due to foundation pit excavation. Comput. Geotech. 2020, 123, 103609. [Google Scholar] [CrossRef]
  27. Sun, J.C.; Bai, T.H. Research on the bearing capacity of the flexible head of the steel support system of the subway foundation excavation. Constr. Technol. 2020, 49, 119–125. (In Chinese) [Google Scholar]
  28. Zhang, M.J.; Yuan, Y.; Wang, X.J. Mechanical properties of BFW active node of steel brace in foundation pit engineering under eccentric load. J. Beijing Univ. Technol. 2018, 44, 251–258. (In Chinese) [Google Scholar]
  29. Lui, E.; Chen, W.-F. Analysis and behaviour of flexibly-jointed frames. Eng. Struct. 1986, 8, 107–118. [Google Scholar] [CrossRef]
  30. Wu, F.-H.; Chen, W.-F. A design model for semi-rigid connections. Eng. Struct. 1990, 12, 88–97. [Google Scholar] [CrossRef]
  31. Ang, K.M.; Morris, G.A. Analysis of three-dimensional frames with flexible beam–column connections. Can. J. Civ. Eng. 1984, 11, 245–254. [Google Scholar] [CrossRef]
  32. Shi, G.; Shi, Y.Y.; Wang, Y.Q. Calculation method on moment-rotation curves ofbeam-to-column semirigid end-plate connections. Eng. Mech. 2006, 23, 67–73. (In Chinese) [Google Scholar] [CrossRef]
  33. GB/T 700–2006; Carbon Structural Steels. China Architecture and Building Press: Beijing, China, 2006. (In Chinese)
  34. Guo, X.; Huang, Z.; Xiong, Z.; Yang, S.; Peng, L. Numerical studies on behaviour of bolted ball-cylinder joint under axial force. Steel Compos. Struct. 2016, 20, 1323–1343. [Google Scholar] [CrossRef]
  35. Tian, F.; Liu, C.X.; Liu, F. Research on the true stress-strain curves of Q235 steel. J. Cent. South Univ. For. Technol. 2011, 31, 182–186. (In Chinese) [Google Scholar]
  36. Xia, Z.B.; Yao, J. Principle and Design of Steel Structure, 2nd ed.; China Construction Industry Press: Beijing, China, 2011; pp. 9–10. (In Chinese) [Google Scholar]
  37. BS EN 1993-1-8:2005; CEN Eurocode 3: Design of Steel Structures-Part 1-8: Design of Joints. British Standards Institution: London, UK, 2005; pp. 54–56.
  38. Guo, X.N.; Zeng, Q.; Huang, Z.W.; Peng, L.; Chen, Y. Numerical study on flexural behavior of bolted ball-cylinder joint. J. Hunan Univ. 2020, 47, 53–65. (In Chinese) [Google Scholar]
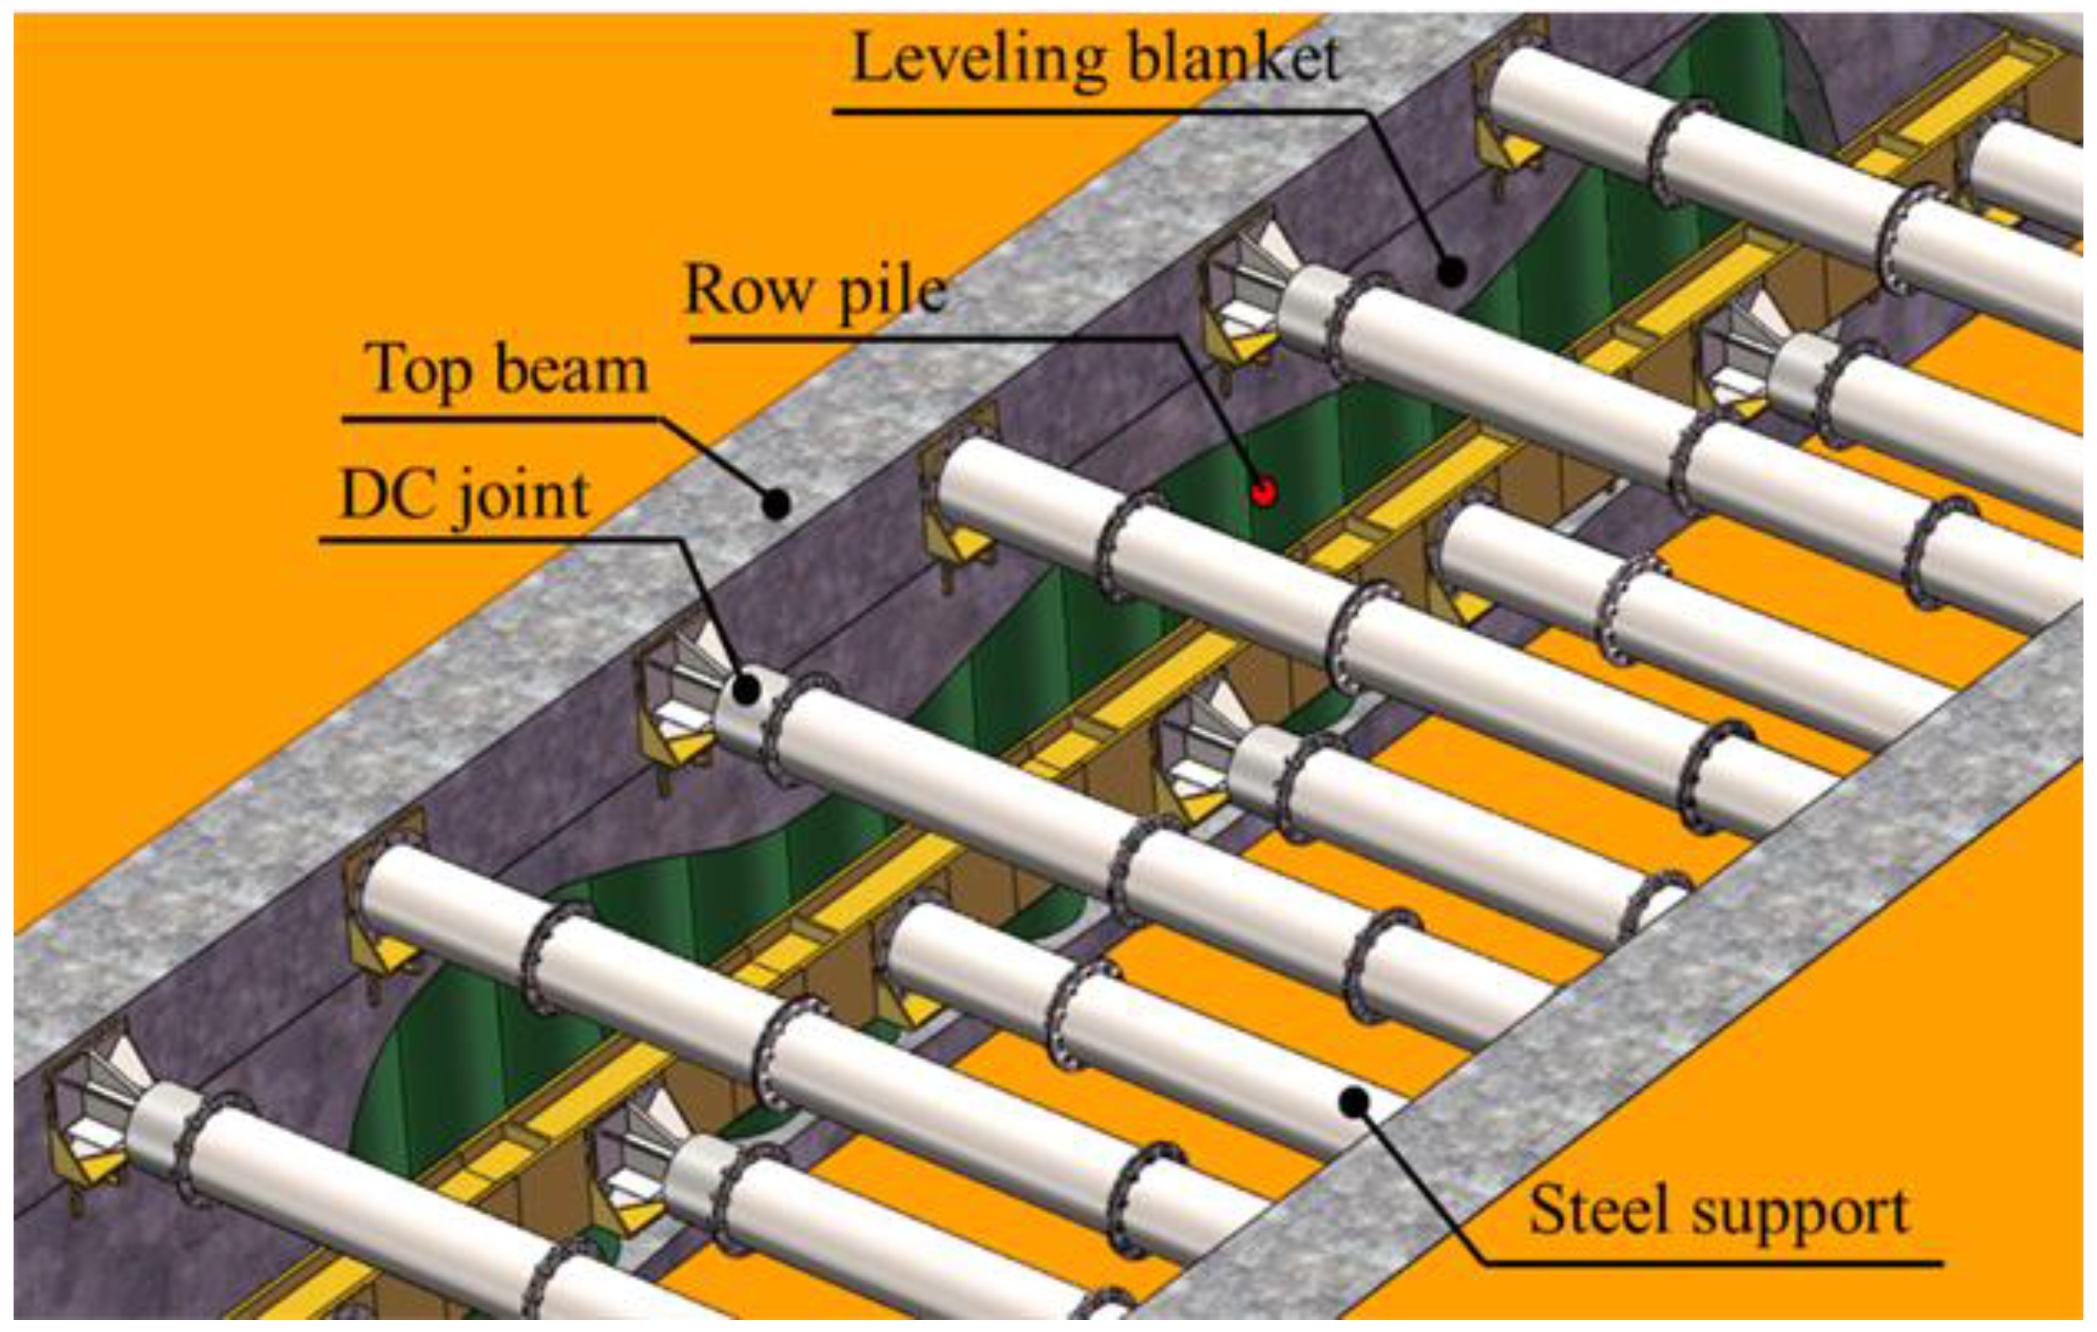
Figure 1. Steel bracing system [22].
Applsci 13 05596 g001
Figure 2. Composition of a DC joint.
Applsci 13 05596 g002
Figure 3. Dimensions of joint specimens.
Applsci 13 05596 g003
Figure 4. Finite element model of the DC joint.
Applsci 13 05596 g004
Figure 5. Comparisons on failure modes (Unit: MPa).
Applsci 13 05596 g005
Figure 6. Comparison of load-displacement curves [22].
Applsci 13 05596 g006
Figure 7. Application of eccentric load.
Applsci 13 05596 g007
Figure 8. Deformation diagram in vertical direction.
Applsci 13 05596 g008
Figure 9. Diagram of stress distribution.
Applsci 13 05596 g009
Figure 10. Instructions of parameter and eccentricity.
Applsci 13 05596 g010
Figure 11. Impact of eccentricity on bearing capacity.
Applsci 13 05596 g011
Figure 12. Impact of steel wedge length on bearing capacity.
Applsci 13 05596 g012
Figure 13. Impact of steel wedge width on bearing capacity.
Applsci 13 05596 g013
Figure 14. Impact of steel wedge height on bearing capacity.
Applsci 13 05596 g014
Figure 15. Impact of steel tube wall thickness on bearing capacity.
Applsci 13 05596 g015
Figure 16. Impact of channel steel thickness on bearing capacity.
Applsci 13 05596 g016
Figure 17. Impact of middle-rib plate height on bearing capacity.
Applsci 13 05596 g017
Figure 18. Criterion of flexural performance index.
Applsci 13 05596 g018
Figure 19. Impact of eccentricity on flexural performance.
Applsci 13 05596 g019
Figure 20. Impact of the steel wedge length on flexural performance.
Applsci 13 05596 g020
Figure 21. Impact of the steel wedge width on flexural performance.
Applsci 13 05596 g021
Figure 22. Impact of the steel wedge height on flexural performance.
Applsci 13 05596 g022
Figure 23. Impact of the thickness of steel tube on flexural performance.
Applsci 13 05596 g023
Figure 24. Impact of the channel steel thickness on flexural performance.
Applsci 13 05596 g024
Figure 25. Impact of middle-rib plate height on flexural performance.
Applsci 13 05596 g025
Figure 26. Deformation of DC joint.
Applsci 13 05596 g026
Figure 27. Parameters of channel steel.
Applsci 13 05596 g027
Figure 28. Force form of steel wedge.
Applsci 13 05596 g028
Figure 29. Fitting curve of n.
Applsci 13 05596 g029
Figure 30. Comparison of moment–rotation curves.
Applsci 13 05596 g030
Figure 31. Comparison of moment resistance and RE.
Applsci 13 05596 g031
Figure 32. Comparison of initial rotational stiffness and RE.
Applsci 13 05596 g032
Table 1. Physical and mechanical parameters of model material.
MaterialE (GPa)fy (MPa)fu (MPa)δ (%)ρ (g/cm3)υμ
Q235209.511235.737214.37.850.30.2
Table 2. Stress–strain relationship of steel.
Stress (MPa)0215.7250325372402
Strain00.10.31017.734.3
Table 3. Parameters of finite element models.
Numbere/mmh/mml/mmw/mmt/mmtc/mmhm/mm
136.5100350451613430
273
3109.5
4146
573100300451613430
6400
7450
873100350251613430
930
1035
1140
127350350451613430
13150
14200
15250
1673100350451013430
1712
1814
1918
2020
217310035045167430
2210
2316
2419
2573100350451613330
26380
27480
Disclaimer/Publisher’s Note: The statements, opinions and data contained in all publications are solely those of the individual author(s) and contributor(s) and not of MDPI and/or the editor(s). MDPI and/or the editor(s) disclaim responsibility for any injury to people or property resulting from any ideas, methods, instructions or products referred to in the content.