Abstract
Connected and automated vehicles (CAVs) involving massive advanced sensors and electronic control units (ECUs) bring intelligentization to the transportation system and conveniences to human mobility. Unfortunately, these automated vehicles face security threats due to complexity and connectivity. Especially, the existing in-vehicle network protocols (e.g., controller area network) lack security consideration, which is vulnerable to malicious attacks and puts people at large-scale severe risks. In this paper, we propose a novel anomaly detection model that integrates a continuous wavelet transform (CWT) and convolutional neural network (CNN) for an in-vehicle network. By transforming in-vehicle sensor signals in different segments, we adopt CWT to calculate wavelet coefficients for vehicle state image construction so that the model exploits both the time and frequency domain characteristics of the raw data, which can demonstrate more hidden patterns of vehicle events and improve the accuracy of the follow-up detection process. Our model constructs a two-dimensional continuous wavelet transform scalogram (CWTS) and utilizes it as an input into our optimized CNN. The proposed model is able to provide local transient characteristics of the signals so that it can detect anomaly deviations caused by malicious behaviors, and the model is effective for coping with various vehicle anomalies. The experiments show the superior performance of our proposed model under different anomaly scenarios. Compared with related works, the average accuracy and F1 score are improved by 2.51% and 2.46%.
1. Introduction
With the rapid development of information and communication technology, connected and automated vehicles (CAVs) are becoming more and more popular in the modern vehicle field. CAVs, with plentiful intelligent in-vehicle sensors and electronic control units (ECUs), are capable of monitoring vehicle states and performing complex functions. All of the ECUs transmit messages with each other to harmonize and control the different components of a modern vehicle via in-vehicle networks [1]. Such networks are connected to external networks by vehicle-to-everything (V2X) technologies [2] to provide advanced vehicle features.
Though these rapid improvements of complexity and connectivity in CAVs bring convenience to our daily life, increasing attacks surfacing make CAVs more vulnerable to various cyber-attacks and faults. In addition, the in-vehicle network, the controller area network (CAN) bus, lacks security mechanisms by design, which has made CAVs increasingly attacked targets. Malicious adversaries can implement attacks through the approaches of a physical interface or a remote wireless approach. There have been increasing demonstrated attacks on modern CAVs in recent years, which has attracted wide attention on modern vehicle security. In 2019, Amat Cama, and Richard Zhu hacked a Tesla Model 3 through its infotainment system [3]. In 2020, a security researcher at Belgian university KU Leuven entered a Tesla Model X and drove the car off by utilizing the Bluetooth vulnerability on its key fob [4]. Several security mechanisms such as encryption technologies [5] and message authentication technologies [6] have been proposed to reduce the security hazards of in-vehicle networks. However, these countermeasures are not always practical for the CAVs environment as they all require modifications of the CAN protocol or hardware equipment and will occupy communication and computation resources [1].
Anomaly detection is considered the effective and practical solution for overcoming such limitations due to its capability of detecting anomalies in an early period and due to the backward compatibility of the existing vehicle systems. For instance, Sagong et al. [7] proposed a motion-based intrusion detection system (MIDS) by using time domain information, i.e., modeling the vehicle movement states. Weber et al. [8] utilized the replicator neural network to capture the time domain series features of CAN signals. The optimized network was used to reconstruct the signal, and its difference to the input signal was used to identify anomaly behaviors. In fact, considering the nonstationarity in vehicle sensor signals and environmental noises, some features of the vehicle’s normal/abnormal state cannot be captured by time domain-based methods [9], so that there may be a risk of anomalies going undetected when only relying on time domain characteristics. In addition, though deep learning technology (e.g., convolutional neural networks (CNN)) has led to considerable success in two-dimensional visual signals feature exaction, its application for non-image signals, including in the vehicle anomaly behavior detection field, introduces new challenges. A naturally conceivable way is to convert the in-vehicle sensor signal into a two-dimensional form after interception [10]. However, since the raw in-vehicle sensor signals are usually composed of different frequency components and have abundant noise, using the raw data can weaken the learning ability of CNN-based anomaly detection methods [11]. Therefore, there is a great desire for a vehicle anomaly detection method that is capable of providing sufficient time and frequency domain information of the in-vehicle sensor signal and one that has the powerful ability of features extraction to obtain a higher detection accuracy.
In this paper, we propose a time-frequency domain features-based vehicle anomaly detection model (CWT-CNN) via the integration of continuous wavelet transform (CWT) and convolutional neural network (CNN) methods. The anomaly deviation of in-vehicle sensor signals caused by malicious behavior is the key indicator of different attacks or faults occurrence. In order to exploit the characteristics of the deviation and detect anomalies, we used CWT to transform in-vehicle sensor signals into a vehicle state image, i.e., wavelet transform scalogram (CWTS), by calculating the wavelet coefficients. Due to CWT’s powerful capability of decomposing a signal in different segments locally, the image features contain more complete time and frequency domain properties of in-vehicle sensor signals so that it can provide more hidden aspects of the vehicle behavior characteristics. We employed the CNN method to learn normal/abnormal vehicle sensor behaviors from the constructed CWTS due to CNN’s classification ability of two-dimensional data. CNN extracts features automatically by exploiting the time and frequency characteristics of the in-vehicle sensor data to detect anomaly events with a higher accuracy.
The proposed model not only fully exploits the individual advantages of CWT and CNN, but also forms an overall anomaly detection method with more excellent performance due to the integrated configuration. For CWT, the inherent powerful capabilities of signal time-frequency process can provide more complete information for the in-vehicle sensor for anomaly analyses. In addition, CWT converts the raw sensor data into two-dimensional CWTS as the input of the CNN rather than inputting the raw sensor signals; thus, the influence of noise and different frequency components in the vehicle sensor signal can be reduced, which allows for our model to inherit the advantages of deep learning. For CNN, its powerful abilities of feature exaction and classification of two-dimensional signals help build the explicit relationship between CWTS and normal/anomaly driving states, so that the information contained in the CWTS can be fully exploited. We implemented our anomaly detection model on a real-world vehicle driving dataset to evaluate its detection performance. The experimental results demonstrate the superior performance of the proposed model under different anomaly scenarios with various evaluation criteria. Compared with the related research, the average accuracy and F1 score of the anomaly detection are improved by 2.51% and 2.46%, respectively.
The contributions of this paper are as follows:
- 1.
- We present a novel vehicle anomaly detection model (CWT-CNN) that integrates CWT with CNN, which is expected to detect various anomaly types through the use of the time and frequency domain characteristics of in-vehicle sensor signals. This model takes full advantage of the CWT and CNN methods and forms an overall anomaly detection model with excellent performance.
- 2.
- We propose a data preprocessing method that converts the raw in-vehicle sensor signal into a two-dimensional CWTS. The constructed CWTS can provide more complete local time and frequency characteristics of a signal and can make the detection model inherit the advantages of deep learning so that anomaly deviations caused by different anomalies or faults can be detected.
- 3.
- We exploit the CNN model to learn vehicle behavior patterns automatically from the constructed CWTS. Its powerful capability of feature extraction on two-dimensional data enables the model to exploit sufficient characteristics of CWTS to detect anomaly events.
- 4.
- We conduct an extensive experiment and evaluate the detection performance of the proposed model with a real-world vehicle dataset. The experimental results demonstrate that our model can detect various anomalies with high accuracy, sensitivity, and F1 score. Compared with the related work, the average accuracy and F1 score of anomaly detection are increased by 2.51% and 2.46%, respectively.
In the remainder of this paper, we first provide the related work in Section 2. In Section 3, we introduce preliminaries and anomaly scenarios. Section 4 describes the proposed CWT-CNN model. In Section 5, we show the experimental evaluations and result analysis. In the last section, we sum up this paper.
2. Related Work
Several anomaly detection methods have been proposed to enhance the information security of automated vehicles. Existing works on vehicle anomaly detection can be categorized into transmission characteristic-based and data content-based according to the objects of detection.
Transmission characteristic-based methods analyze the information that describes the transmission state of the CAN message itself to detect anomaly behaviors, such as the ID field information, periodicity features, clock skew, and in-vehicle network channel features, etc. Marchetti et al. [12] proposed an intrusion detection algorithm that observes the recurring patterns in the sequence of the CAN message ID and constructed the ID transformation matrix to detect intrusions. Moore et al. [13] proposed a data-driven anomaly detection algorithm that exploits the frequency regularity of CAN bus messages and models inter-signal arrival times. Halder et al. [14] designed a novel intrusion detection system called COIDS to detect anomaly behaviors. The authors utilized active learning to form the normal clock behavior of ECUs and used the cumulative sum method to monitor any anomalous deviation in the clock offset. Wu et al. [15] designed a novel information entropy characteristic-based anomaly detection system. The authors used a fixed number of messages-based sliding window and improved the decision conditions to increase the detection performance. In fact, the methods mentioned above observe the changes in the transmission characteristics of CAN messages and raise alarms when the anomalous vehicle behaviors deviate from the normal baseline. However, these transmission characteristic-based methods may fail if the attacks are slight [16], the metadata or transmission features of it are imitated through proper crafting [17], or if they suffer from message alteration/falsification attacks [18].
Data content-based methods observe the information carried by the data field of CAN messages to detect vehicle anomalies. Ganesan et al. [19] explored and verified the relationship between in-vehicle sensor signals and utilized the pairwise correlation between the messages of key vehicular sensors to design anomaly intrusion systems. Sagong et al. [7] proposed a novel intrusion detection system by using the time domain information of in-vehicle sensor signals to construct the vehicle movement states. In addition, with the rapid development of machine learning/deep learning technology and the data that are becoming more readily available, these technologies have been recently employed in many anomaly detection works. For instance, Li et al. [18] presented a regression learning-based intrusion detection system (IDS). The authors utilized pairwise raw in-vehicle sensor signals on the time domain to train detection models and detect anomalies by monitoring the deviations between the true and estimated values. Kang et al. [20] used a deep neural network (DNN) to discriminate normal and attack packets based on feature vectors, which are constructed to convey the statistical behaviors from binary CAN messages. He et al. [21] designed an unsupervised deep learning anomaly detection method. The authors used an artificial neural network and deep autoencoder to learn a behavior pattern from normal sensor messages and compare it with vehicle observations according to the constructed nominal behavior for vehicle anomaly detection.
For data content-based methods, considering that the CAV is a typical cyber-physical system (CPS) [1] and that the data content of messages on the CAN bus always contains plentiful amounts of significant vehicle motion information, processing the sensor data well, e.g., sensor fusion, etc., is critical for enhancing CAV security in intelligent transportation systems. For instance, Wang et al. [22] proposed an anomaly detection method by utilizing an edge-based sensor data fusion method named VeAnDe. Xia et al. [23] introduced a vehicle sensor data processing method by integrating IMU with the onboard sensor to estimate the yaw misalignment of the IMU in the automobile without the assistance of any external information. Liu et al. [24] presented a novel sensor fusion method that utilized the visual-aided strategy to complement the sensor information based on the lane line data obtained from an onboard camera in intelligent vehicles. Xiong et al. [25] illustrated a novel sensor processing method by fusing the information of a global navigation satellite system (GNSS) with IMU in automated vehicles. Liu et al. [26] proposed a GNSS and IMU fusion-based method, which overcame the measurement signal delay and addressed errors induced by the low sampling rate of GNSS. Gao et al. [27] proposed a sensor fusion framework based on vehicle chassis sensors and GNSS. Xia et al. [28] introduced a novel sensor fusion strategy in the autonomous vehicle field by integrating the vehicle dynamic model with GNSS-IMU fusion-based methods. In addition, there are some works that have focused on potential insecurity scenarios identified and recovered by sensor fusion, which greatly enhances the vehicle security, especially due to the recoverability of hazards. For instance, Alsuwian et al. [29] proposed a novel advanced emergency braking system (EBS) using sensor fusion that has the capability of autonomously detecting insecurity driving states and subsequently triggering the vehicle’s braking system to prevent or alleviate the collision. Alsuwian et al. [30] also presented an active fault-tolerant control (AFTC) approach for autonomous vehicles using a fuzzy neural network. The AFTC can effectively detect any abnormality in wheel speed, thereby preventing potential instability problems that may arise in CAVs.
Relative to the works mentioned above, we also used the data content of CAN messages to develop our anomaly detection model for conquering various sophisticated attacks. Different from the other models, we utilized CWT to obtain more complete time and frequency domain information from the data content of in-vehicle messages, and our proposed model aims to take full advantage of the advanced classifier to obtain a better performance of anomaly detection. In addition, we considered that the raw in-vehicle sensor signals contain plentiful noise and have nonstationary characteristics, which increase the difficulty for the deep learning model to extract the more abstract features, causing errors in the anomaly detection performance [9]; in this study, we proposed a data preprocessing method that converts the raw vehicle sensor data into a two-dimensional CWTS and then use the constructed CWTS as the input of our deep learning model rather than using the raw sensor signals, which we performed to inherit the advantages of deep learning technologies for a better detection performance.
3. Background
In this section, we provide the background necessary to better illustrate our work. We first introduce the in-vehicle network protocol CAN bus. Then, we describe the related theories, the continuous wavelet transform (CWT), and the convolutional neural network (CNN). Finally, we illustrate the adversary models considered in our study.
3.1. Controller Area Network (CAN)
Controller area network (CAN) is the communication protocol of the vehicular network, which enables vehicle ECUs to communicate with each other via CAN messages [31]. The ID field in each CAN message is used to identify which signal is encoded in it, such as vehicle speed, acceleration, engine temperature, etc. In addition, the ID field represents the message transmission priority to address the conflict of multiple ECU nodes being able to send messages on the CAN bus simultaneously. The data field of the CAN frame represents the different payload data according to the CAN ID field. All of the ECUs are connected in a central CAN bus for information exchanges via broadcast communication. Any ECU node can obtain and send the messages on the bus. Although the broadcast communication mechanism of the CAN protocol is suitable for the resource-constrained CAV environment, it is vulnerable to malicious adversaries implementing attacks. In addition, the OBD system connected to the CAN bus is also a commonly attacked target. Considering the characteristics of the in-vehicle network, it is suitable for the anomaly detection system deployment to detect anomaly behaviors by collecting the information of various ECUs on the CAN bus as it would not interfere with the normal communication of the CAN bus.
3.2. Continuous Wavelet Transform (CWT)
A continuous wavelet transform (CWT) is a powerful time and frequency features analysis tool [32,33]. CWT has the ability of localization decomposition using methods such as short-time Fourier transform (STFT). Moreover, the adjustable scale and translation parameter of the mother wavelet function enable it to decompose a signal with different resolutions [34]. The adjustment of the two parameters constitutes the family of the time-scale waveform, which can be described as:
is the analytic function, referred to as the mother wavelet function, in the continuous wavelet transform; a is the scale parameter; and b represents the translation parameter. Then, the continuous wavelet transform of the given signal is defined as:
are the wavelet coefficients at scale a and translation b, and denotes the complex conjunction of .
Due to the ability of a local analysis with high time and frequency resolution, the continuous wavelet transform can provide the hidden information of a signal that other analysis techniques fail to reveal [35]. In this paper, the CWT technique is utilized to extract time and frequency domain features through the approach of converting raw in-vehicle sensor signals to two-dimensional images as the input for the CNN model for anomaly detection.
3.3. Convolutional Neural Network (CNN)
A convolutional Neural Network (CNN) is a type of fully connected feedforward neural networks that utilizes convolutional operations to automatically extract features of data [36]. CNN is widely used in various scenarios such as image pattern recognition and classification due to its powerful feature extraction capabilities on data with a grid structure [37]. A standard CNN architecture usually contains three types of layers involving linear and nonlinear operations, namely the convolution layer, subsampling layer, and fully connected layer. In the convolution layer, the output of the previous layer is convolved with the learnable kernels and obtains a sets of arrays called feature maps. Each element of the feature maps will pass through a non-linear activation function. The parameter-sharing mechanism used in the CNN network reduces the weights and number of connections. The subsampling layer is used to reduce the computation by producing low-resolution maps. In the fully connected layer, the feature maps are transformed into a one-dimensional array, and the layer outputs the classes of the respective objects. In this study, we utilized trained CNN models to detect the vehicle anomaly behaviors by classifying the constructed continuous wavelet transform scalograms of sensor signals.
3.4. Adversary Models
An ever-greater variety of attack surfaces and approaches make it easier for adversaries to launch serious intrusions. Adversaries can implement attacks through the approach of a physical interface, e.g., on-board diagnostic (OBD) connector and USB slot [38,39]. Attackers can also invade a vehicle by the way of a remote wireless method, such as Wi-Fi [40,41], Bluetooth [38,40,42,43,44], cellular [38,40,41,42,44], radio data system [38,40,43,45], and telematics [38,40]. Moreover, sensor failures can also cause the anomalous behaviors of a vehicle. Therefore, in this study, we took into account the attacks and sensor failures that result in the anomalous behaviors on vehicles. According to the related literature [46,47,48], the anomalous behaviors can be represented as the following five main scenarios:
Hijack: Adversaries hijack the sensors or ECUs and report the false messages. The adversaries attempt to simulate the normal messages’ sending frequency and transmit the continuous tampered messages on the CAN bus.
Bias: Sensor signals slightly deviate from the true value over a period of time. This anomalous behavior means the vehicle is suffering some attacks or that the sensor is faulty, which cannot reflect the accurate signal reading.
Injection: This means that the vehicle suffers from a wireless message injection attack. The attacker transmits false or invalid messages on the the CAN bus randomly, which is the easiest approach for the adversary to implement attacks.
DOS: Denial of Service (DOS) aims to result in the unavailable service or intended function of vehicular systems. An attacker can flood the in-vehicle network with high-frequency messages in a short period to launch a DOS attack.
Replay: Attackers store the valid signal at a previous time and replay them at a later intrusion stage. The real values are overwritten with recorded message values of the same signal over a period of time.
The visualization of the anomaly scenarios are shown in Figure 1, and the red rectangles refer to the anomaly intervals. In this study, we aimed to develop a vehicle anomaly detection model that could detect the five anomaly types above under different durations with a high accuracy.
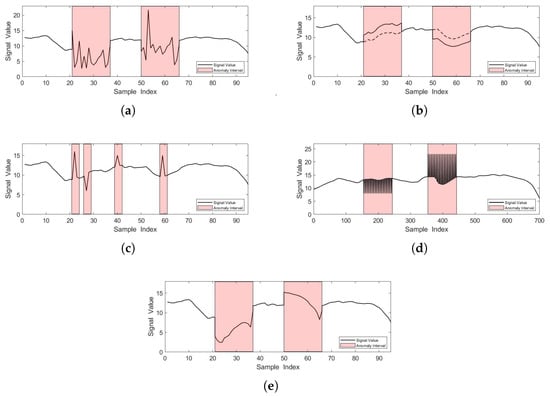
Figure 1.
Visualization of anomaly scenarios. (a) is hijack, (b) is bias, (c) is injection, (d) is DOS, and (e) is replay.
4. Methods
In this section, we propose a time and frequency features-based anomaly detection model by integrating a continuous wavelet transform scalogram with a convolutional neural network. The process of anomaly detection contains two procedures: CWTS generation and CNN-based anomaly detection. We first introduce the CWTS generated from the raw in-vehicle sensor signals. The real-time data are maintained by using the sliding window strategy. Then, we illustrate the CNN structure that we use to classify the normal/abnormal vehicle behaviors from the CWTS input. The framework of the CWT-CNN model is shown in Figure 2.
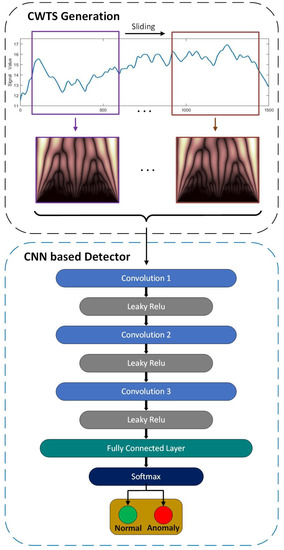
Figure 2.
The framework of the proposed anomaly detection model.
4.1. CWTS Generation
In order to apply the continuous wavelet transform to obtain the more complete signal information scalogram as the input of CNN, we first used the sliding window strategy to maintain the real-time input in-vehicle sensor data, as is shown in Figure 2. The rectangular sliding window box with a fixed window size and sliding step was used to collect the data required for each anomaly detection. We set the window step to be shorter than the window size to ensure the detection sensitivity. As the sliding window moves toward the direction of time, new observations enter in and the previous exits. Every movement of the window represents an execution of detection.
The in-vehicle sensor data in each detection window can be expressed as , where T represents the length of the detection window. According to Equation (2), the real-time sensor data maintained in the detection windows can be decomposed using the continuous wavelet transform as:
are the wavelet coefficients ranging from scale 1 to l, where and . Putting the wavelet coefficients into a matrix, the matrix can be regarded as a two-dimensional scalogram of in-vehicle sensor signals in the time-frequency domain.
Figure 3 shows the time domain waveforms and CWTS of the normal and anomaly in-vehicle sensor signals. Each sensor signal has 512 data samples and is decomposed by a Morlet wavelet with the scale parameter set to 128. The red rectangles in the raw signal waveform represent the anomaly intervals. The horizontal axis of the CWTS represents the time resolution of signals, and the vertical axis is the scale parameter. Each element in the CWTS describes the magnitude of the wavelet coefficients via the brightness of color.
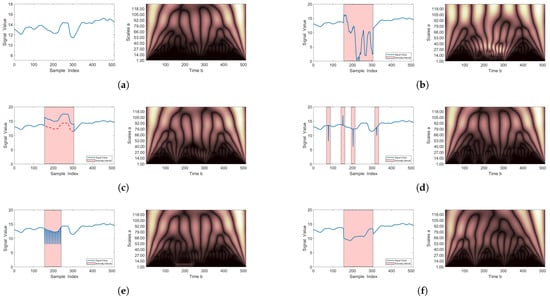
Figure 3.
The time domain waveforms and CWTS of the normal and anomaly in-vehicle sensor signals. (a) is the normal driving state. (b) is the hijack scenario. (c) is the bias scenario. (d) is the injection scenario. (e) is the DOS scenario. (f) is the replay scenario.
In Figure 3, it can be observed that there are some obvious differences in the CWTS between the normal vehicle driving state and each scenario of anomalous vehicle behaviors. These distinctions indicate the possibility to identify normal or anomalous vehicle behaviors using CWTS. However, it is difficult to completely capture the explicit and precise information from the CWTS to make a distinction between the conditions of normal and anomalous vehicle behavior patterns. To overcome this problem, we utilized the CNN to automatically extract the features of the normal/anomalous behaviors from the CWTS for anomaly detection by taking advantage of its excellent capability of classification for two-dimensional data.
4.2. Anomaly Detection Based on CNN
After generating the vehicle sensor CWTS, the CNN was trained to obtain detection models to classify a vehicle that is normal or anomalous. Specifically, we used the sliding window to maintain the sensor data that was converted to the CWTS. Then, these observations after conversion to the CWTS are fed into the CNN for model training and testing. We used the labeled input, i.e., CWTS, to train the CNN models for the classification of normal/anomalous. That is, if anomalies occur in a CWTS, the corresponding input is set to 1; otherwise, it is set to 0.
The CNN’s structures and its parameter values were selected and tuned through a large amount of experiments in order to enhance the anomaly detection capability on a validation set. In this study, the structure of the CNN is shown in Figure 4. To illustrate the structure clearly, the convolution layer and activation unit are visually combined into a convolution stage. We used three convolution layers with a set of kernels to extract the relevant high-level features. The weights and bias of the convolution kernels were trained using the backpropagation (BP) error algorithm. The leaky rectified linear unit (LeakyRelu) was chosen as the activation function to achieve nonlinear capabilities, and the Adam optimizer was used to minimize the cross-entropy. Finally, the feature map’s output was transformed into a one-dimensional array, called the fully connected layer, for input to the Softmax classifier to provide the detection results. The model parameters of the CNN are shown in Table 1.
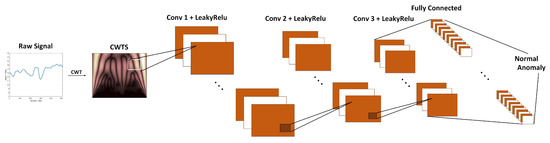
Figure 4.
The structure of the CNN.

Table 1.
The model parameters of our CNN architecture.
During model training, the learning rate of the optimizer was set as 0.001. Furthermore, a batch size of 128 and epoch number of 500 were used. In order to reduce the risk of overfitting, we used a dropout method with 0.2 probability and the early stopping strategy. The process of hyperparameter tuning in the training phase is illustrated in Table 2.
Table 2.
Hyperparameter tuning.
The proposed anomaly detection model uses CWTS to completely describe the time and frequency domain features of the in-vehicle sensor signals. A CNN-based detection model can not only extract the features of every elements in the CWTS but also the features among them, which could make the model perform better under different anomaly types. By inputting the converted CWTS instead of the raw data, the CNN could learn more abstract features and obtain a better detection performance. We point out that this method of generating the CWTS-combining CNN classifier has other application scenarios beyond vehicle anomaly detection, such as for intrusion detection in other fields.
5. Experimental Results and Analysis
In this section, we analyze the detection performance of our proposed model via various experiments. Specifically, we first investigate the detection performance of the proposed model under a single anomaly scenario. Then, we present the experimental results of the model under mixed anomaly scenarios. Finally, we compare the detection performance with the related research.
In our study, the specifications of the experimental equipment include an Intel(R) Core(TM) i7-11700K CPU @3.60 GHz and NVIDIA GeForce GTX3080Ti GPU. For developing the algorithm, we used the continuous wavelet transform analysis tools in Matlab 2020b [49] for the CWTS construction and Python 3.6 with the Pytorch framework for the deep learning methods.
The evaluation criteria used in this experiment included accuracy (Acc), sensitivity (Sens), precision (Prec), and F1 score (F1), which we calculated from TN (true negatives), TP (true positives), FP (false positives), and FN (false negatives). The evaluation criteria were defined as follows:
Accuracy describes the overall ratio of correct detection for normal and anomalous signal readings.
Sensitivity measures the proportion of correctly detected anomalous signal readings from the total number of anomalous signal readings.
Precision assesses the number of true anomalous sensor readings to the total number of anomalies detected by an approach.
F1 score is used to balance sensitivity and precision by calculating the harmonic mean of them.
We chose these metrics because they can evaluate the capability of the detection models to correctly differentiate between normal and abnormal vehicle behaviors.
5.1. Dataset
The dataset used in this study is from 223 GB of Open Sourcing driving data [50], which was collected by driving a Lincoln MKZ car in Mountain View under various weather conditions for 70 min with more than 150 variables. The ECU messages of the car were collected and recorded by the robot operate system (ROS) automatically. We extracted the in-vehicle ECU data in the ROS and eliminated the pictures and other non-significant data. The data variables used in this study included vehicle speed (denoted as signal 1), wheel speed (signal 2), GPS speed (signal 3), acceleration (signal 4), and torque of wheel (signal 5). The reason for choosing these in-vehicle sensor variables is that we tend to pay more attention to the variables related to vehicle speed, acceleration, and torque because these variables are crucial to a vehicle. If they are attacked or at fault, the safety of vehicles and people will face great threats. Moreover, there are existing works which have illustrated that these sensors are vulnerable to attacks and faults [51,52].
5.2. Performance under a Single Anomaly Scenario
In this section, we investigate and analyze the detection performance of the proposed CWT-CNN model with five in-vehicle sensor signals under five anomaly scenarios, respectively, as discussed in Section 3.4; namely, we examine the performance under hijack, bias, injection, DOS, and replay.
Table 3 illustrates the anomaly detection performance of the five signals under the hijack anomaly scenario. As shown in Table 3, for each in-vehicle sensor signal, our proposed model performs reasonably well, with the average accuracy and F1 score being 95.90% and 95.86%, respectively. The high sensitivity means that when attacks occur, our proposed model can detect almost all of them.
Table 3.
Detection performance of the proposed model under the hijack scenario.
As can be seen from Table 4, the proposed model can achieve an average accuracy of 95.53% and an F1 score of 95.48% for all five sensor signals under the bias anomaly scenario. Compared with the performance of the hijack scenario, the model performs slightly worse; this is because the bias scenario causes smaller deviations from true values, which increases the difficulty of anomaly detection. However, the performance shown in the table is practical for anomalies in the bias scenario because small deviations have negligible effects on sensors and vehicles.
Table 4.
Detection performance of the proposed model under the bias scenario.
Table 5 shows the result of our proposed model under the injection scenario. Under the injection scenario, the model has a better detection performance with an average accuracy of 97.93% and F1 score of 97.91% compared with those under the hijack and bias scenarios. This is because a greater number of anomaly magnitudes within the detection window is caused by injection behavior, which will make the attacks much easier to be detected by anomaly detection models.
Table 5.
Detection performance of the proposed model under the injection scenario.
Table 6 shows the anomaly detection performance of the model in the DOS scenario. It can be observed that the proposed model can achieve an average accuracy of 98.99% and has an F1 score of 98.98%. In addition, it can be observed that the performance of the model for the DOS scenario is better than that of the other four attack types, which is because the high-frequency changes caused by DOS attacks will cause a large number of deviations from the normal behavior pattern in the detection window, thus making this attack easier to be captured by the model and detected.
Table 6.
Detection performance of the proposed model under the DOS scenario.
Table 7 shows the detection performance under the replay scenario. It can be seen that the model also has a good performance. However, compared with the other scenarios, the performance of replay is slightly weakened because the CAN message recorded by the attacker before the attack and the replay message are likely to be similar, which will increase the difficulty of model detection, meaning that the detection ability will be reduced. In conclusion, the proposed model can achieve a better detection result for different attack scenarios.
Table 7.
Detection performance of the proposed model under the replay scenario.
Figure 5 illustrates the graphical depiction results of the CWT-CNN model under different anomaly scenarios of five different signals, respectively. It can be seen that the detection performance generally varies among the different sensor signals. Specifically, for signal 4 and signal 5 (i.e., acceleration and torque of wheel), across all five anomaly scenarios, the evaluation metrics of the two signals are lower than those of signal 1, 2, and 3. This is partly because there is the possibility of a large variation between consecutive acceleration signal observations compared with the other three speed-related sensor signals, which have a relatively steady variation over time. The torque of wheel signal has a similar phenomenon of detection performance to acceleration signals due to the two being correlated in terms of the physical invariant [53].
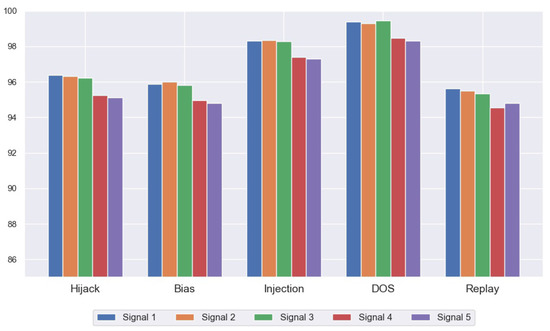
Figure 5.
Detection performance of the proposed model of different in-vehicle sensor signals under different anomaly scenarios.
5.3. Performance under Mixed Anomaly Scenarios
In Section 5.2, we investigate the detection results of the proposed model under a single anomaly scenario. In a practical way, we expect to develop a model or system that can conquer various anomaly situations with different in-vehicle sensor signals. Therefore, in this section, we take into consideration the mixed sensor signals and anomaly scenarios mentioned in Section 3.4 to construct an overall detection model. The dataset used to train the CNN model in this section contains five sensor signals with five anomaly scenarios.
The detection results are shown in Table 8; it can be seen that the proposed model performs well at detecting various anomaly scenarios of different in-vehicle sensor signals, with 96.28% accuracy, 95.30% sensitivity, 97.21% precision, and 96.24% F1 score. Though the complexity and diversity of the datasets increase the difficulty of feature extraction, the experimental result shows that our proposed model perform reasonably well at detecting vehicle anomaly behaviors, which means that our model can deal with various complex anomaly situations.
Table 8.
Detection performance of the proposed model under mixed anomaly scenarios.
5.4. Evaluation of Real-Time Requirements
In this section, we conduct the experiments of time consumption to evaluate the real-time performance. The United States (US) Department of Transportation illustrated that the highest priority vehicle safety services, such as over-taking and collision warnings, should meet the real-time requirements of 10 to 100 ms [54]. Furthermore, for V2X safety applications scenarios including autonomous driving, 10 to 50 ms time consumption is required [55]. Thus, the time consumption of vehicle anomaly detection methods should require a latency of 10 ms at the utmost for real-time requirements.
Table 9 shows the detection time of our proposed model. The average time required for performing an anomaly detection of CWTS generation and CNN detection is 6.08 ms and 1.87 ms, respectively. The detection time of the CWT-CNN model is 7.98 ms overall. Thus, the proposed model satisfies the vehicular security timeliness requirements (10 ms).
Table 9.
Detection time of the proposed model.
5.5. Comparison Overview
In this section, we compare the proposed method with a vehicular motion-based intrusion detection system named MIDS [7] and a replicator neural network-based vehicle anomaly detection system named RNet [8] to further evaluate the capability of our proposed anomaly detection model. Specifically, we first implement the detection methods under mixed anomaly scenarios with fixed anomaly samples (150 anomaly samples), i.e., the anomaly duration, to investigate their overall detection performance. Then, we set anomaly signals with different numbers of anomaly durations (50, 100, 150, and 200 anomaly samples) to evaluate the performance under different anomaly extents.
The results in Table 10 shows that compared with the other methods, our CWT-CNN model has a better detection performance. Figure 6 shows the graphical depiction of the detailed comparison between the proposed model and other methods. It can be seen that our proposed model outperforms the compared methods under all evaluation criteria. This is partially because the MIDS method only extracts the time domain information, i.e., the signals correlation; there are always some unseen patterns that the method cannot capture and thus, it underperforms compared with our model. In addition, though MIDS uses CUSUM as a detector module to improve the detection accuracy, it requires setting an appropriate update threshold, sensitivity threshold, and detection threshold, which also brings hand-crafted uncertainty and bias and increases the difficulties of model designing. Considering the RNet method, inputting the raw in-vehicle sensor signals in the neural network will decrease the feature learning capability, as the signals have plentiful noise and different frequency components. Our proposed model uses the CWTS to obtain the complete time and frequency domain information, and the CNN model enables the method to take full advantage of its powerful learning ability to extract more abstract features from each element in the CWTS for a better anomaly detection performance.
Table 10.
Comparison with other methods under the fixed anomaly duration.
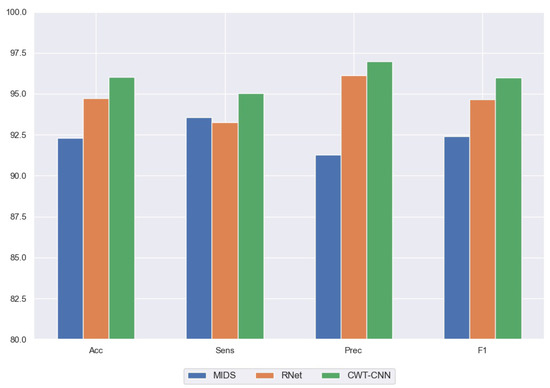
Figure 6.
Detection performance comparison of our proposed model with MIDS and RNet.
Table 11 shows the comparison results of different anomaly durations. For each method, we first intercept the real-time in-vehicle sensor data into each detection window by using sliding window strategy. Then, in each detection window, we set anomaly sample numbers of 50, 150, 200, and 250 to evaluate the detection performance under different anomaly severities. It is seen that the detection performance of MIDS considerably drops as the anomaly duration decreases; it reaches the worst performance, with an 83.58% accuracy at the shortest duration, i.e., row 1. This is because the MIDS method requires a large number of anomaly sample accumulation in a detection window to result in a severe variation in the detector indicator to conduct anomaly detection. Thus, in the case of a shorter anomaly duration, it will not cause large magnitude changes within the detector, so the performance will be relatively poor. Because RNet utilizes changes in the reconstructed signal value to detect, though its performance slightly weakens as the anomaly duration decreases, its overall detection performance is worse than our proposed model. As is seen from the result of our proposed model, our method perform reasonably better compared with the other methods under both short and long durations. As our method detects anomalies by discovering deviations, any deviations caused by anomaly behaviors at the early stage will be detected.
Table 11.
Comparison with other methods under different anomaly durations.
Figure 7 illustrates the comparison results and variation trend with respect to the duration changing in an intuitive way. It is seen that our CWT-CNN model outperforms the other methods under all different anomaly durations with respect to the evaluation criteria of accuracy, sensitivity, precision, and F1 score. Moreover, it can be observed that as the anomaly duration decreases from 200 samples to 50 samples, the detection performance of MIDS quickly drops, while our proposed model remains almost unchanged, with a slight decrease. As is shown in Table 11, at the shortest duration, our model can achieve a high F1 score of 94.44% compared with the 83.67% F1 score of the MIDS approach.
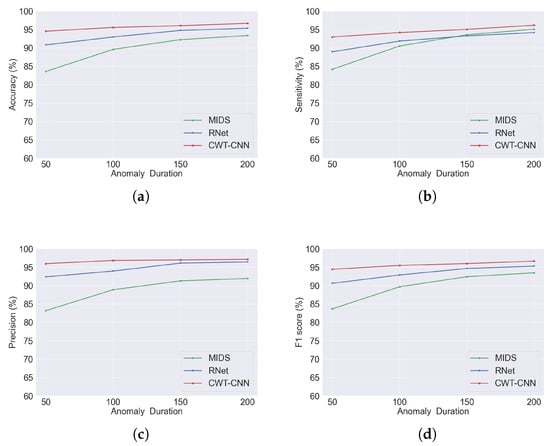
Figure 7.
Comparison under different anomaly durations with the evaluation criteria of (a) accuracy, (b) sensitivity, (c) precision, and (d) F1 score.
6. Conclusions and Future Work
In this paper, we proposed a novel anomaly detection model based on the time and frequency domain characteristics of in-vehicle sensor messages. The CWT method was used to convert the raw sensor signal into the two-dimensional CWTS for obtaining the complete time and frequency domain information with high scales. We exploited CNN to extract the features of vehicle behavior patterns to detect vehicle anomalies from the input CWTS to take advantage of its powerful capability of classifying two-dimensional data. We implemented various experiments on a real-world driving dataset to evaluate the detection performance of our proposed model. The results show that our model can achieve high accuracy, sensitivity, precision, and F1 score under different anomaly scenarios. Compared with the related research, the average accuracy and F1 score of anomaly detection were improved by 2.51% and 2.46%, respectively.
Our work confirmed the effectiveness, superiority, and broad application prospects of using a wavelet transform time-frequency analysis method combined with a CNN for vehicle anomaly detection. To the best of our knowledge, this is the first work that exploits a signal analysis method with deep learning technology in the CAVs anomaly detection field. However, there are some limitations in this work, which can be improved in our future work. First, the continuous wavelet transform technique has some redundancy in signal processing. In a future work, we will optimize the data processing and analysis method for the time-frequency domain to enhance the performance in real-time. In addition, due to the requirement of using sliding windows to maintain the real-time CAN data as the input of the detection system, there will be an edge effect when the finite length data sequence is subjected to the continuous wavelet transform, which may potentially affect the detection performance based on CNN. In a future work, we will take the impact of the edge effect into consideration and optimize the feature maps and CNN models so that our method can achieve a better detection performance.
Author Contributions
L.W. performed the data preprocessing, contributed to the design and construction the model, performed the experiments, executed the detailed result analysis, and wrote some sections. X.Z. set the objectives of the research, wrote some sections, and proofread the manuscript. All authors have read and agreed to the published version of the manuscript.
Funding
This research was funded by the National Natural Science Foundation of China under Grant No. 61802252.
Institutional Review Board Statement
Not applicable.
Informed Consent Statement
Not applicable.
Data Availability Statement
Data are available from the author upon request.
Conflicts of Interest
The authors declare no conflict of interest.
References
- Wu, W.; Li, R.; Xie, G.; An, J.; Bai, Y.; Zhou, J.; Li, K. A survey of intrusion detection for in-vehicle networks. IEEE Trans. Intell. Transp. Syst. 2019, 21, 919–933. [Google Scholar] [CrossRef]
- Al-Jarrah, O.Y.; Maple, C.; Dianati, M.; Oxtoby, D.; Mouzakitis, A. Intrusion detection systems for intra-vehicle networks: A review. IEEE Access 2019, 7, 21266–21289. [Google Scholar] [CrossRef]
- Tesla Car Hacked at pwn2own Contest. Available online: https://www.zdnet.com/article/tesla-car-hacked-at-pwn2own-contest/ (accessed on 28 March 2023).
- Wouters, L.; Gierlichs, B.; Preneel, B. My other car is your car: Compromising the Tesla Model X keyless entry system. IACR Trans. Cryptogr. Hardw. Embed. Syst. 2021, 4, 149–172. [Google Scholar] [CrossRef]
- Wang, E.; Xu, W.; Sastry, S.; Liu, S.; Zeng, K. Hardware module-based message authentication in intra-vehicle networks. In Proceedings of the 8th International Conference on Cyber-Physical Systems, New York, NY, USA, 18 April 2017; pp. 207–216. [Google Scholar]
- Van Herrewege, A.; Singelee, D.; Verbauwhede, I. CANAuth-a simple, backward compatible broadcast authentication protocol for CAN bus. In Proceedings of the ECRYPT Workshop on Lightweight Cryptography, Louvain-la-Neuve, Belgium, 28–29 November 2011; p. 20. [Google Scholar]
- Sagong, S.U.; Poovendran, R.; Bushnell, L. Inter-message correlation for intrusion detection in controller area networks. In Proceedings of the 17th ESCAR Europe Conference, Stuttgart, Germany, 19–20 November 2019; pp. 215–229. [Google Scholar]
- Weber, M.; Pistorius, F.; Sax, E.; Maas, J.; Zimmer, B. A Hybrid Anomaly Detection System for Electronic Control Units Featuring Replicator Neural Networks. In Advances in Information and Communication Networks; Advances in Intelligent Systems and Computing; Arai, K., Kapoor, S., Bhatia, R., Eds.; Springer International Publishing: Cham, Switzerland, 2019; Volume 887, pp. 43–62. [Google Scholar]
- Yoo, Y.; Baek, J.-G. A Novel Image Feature for the Remaining Useful Lifetime Prediction of Bearings Based on Continuous Wavelet Transform and Convolutional Neural Network. Appl. Sci. 2018, 8, 1102. [Google Scholar] [CrossRef]
- Zeng, X.; Zhang, X.; Yang, S.; Shi, Z.; Chi, C. Gait-Based Implicit Authentication Using Edge Computing and Deep Learning for Mobile Devices. Sensors 2021, 21, 4592. [Google Scholar] [CrossRef]
- Wang, J.; Zhuang, J.; Duan, L.; Cheng, W. A multi-scale convolution neural network for featureless fault diagnosis. In Proceedings of the 2016 International Symposium of Flexible Automation (ISFA), Cleveland, OH, USA, 1–3 August 2016; pp. 1–6. [Google Scholar]
- Marchetti, M.; Stabili, D. Anomaly detection of CAN bus messages through analysis of ID sequences. In Proceedings of the 2017 IEEE Intelligent Vehicles Symposium (IV), Los Angeles, CA, USA, 11–14 June 2017; pp. 1577–1583. [Google Scholar]
- Moore, M.R.; Bridges, R.A.; Combs, F.L.; Starr, M.S.; Prowell, S.J. Modeling inter-signal arrival times for accurate detection of can bus signal injection attacks: A data-driven approach to in-vehicle intrusion detection. In Proceedings of the 12th Annual Conference on Cyber and Information Security Research, Oak Ridge, TN, USA, 4–6 April 2017; p. 11. [Google Scholar]
- Halder, S.; Conti, M.; Das, S.K. COIDS: A clock offset based intrusion detection system for controller area networks. In Proceedings of the 21st International Conference on Distributed Computing and Networking, Kolkata, India, 4–7 January 2020; pp. 1–10. [Google Scholar]
- Wu, W.; Huang, Y.; Kurachi, R.; Zeng, G.; Xie, G.; Li, R.; Li, K. Sliding window optimized information entropy analysis method for intrusion detection on in-vehicle networks. IEEE Access 2018, 6, 45233–45245. [Google Scholar] [CrossRef]
- D’Angelo, G.; Castiglione, A.; Palmieri, F. A cluster-based multidimensional approach for detecting attacks on connected vehicles. IEEE Internet Things J. 2020, 8, 12518–12527. [Google Scholar] [CrossRef]
- Sagong, S.U.; Ying, X.; Clark, A.; Bushnell, L.; Poovendran, R. Cloaking the Clock: Emulating Clock Skew in Controller Area Networks. In Proceedings of the 9th ACM/IEEE International Conference on Cyber-Physical Systems, ICCPS ’18, Porto, Portugal, 11–13 April 2018; IEEE Press: Piscataway, NJ, USA, 2018; pp. 32–42. [Google Scholar]
- Li, H.; Zhao, L.; Juliato, M.; Ahmed, S.; Sastry, M.R.; Yang, L.L. POSTER: Intrusion Detection System for In-vehicle Networks using Sensor Correlation and Integration. In Proceedings of the ACM SIGSAC Conference on Computer and Communications Security (CCS ’17), Dallas, TX, USA, 30 October–3 November 2017; Association for Computing Machinery: New York, NY, USA, 2017; pp. 2531–2533. [Google Scholar]
- Ganesan, A.; Rao, J.; Shin, K. Exploiting Consistency among Heterogeneous Sensors for Vehicle Anomaly Detection; Technical Report, SAE Technical Paper; SAE International: Detroit, MI, USA, 2017. [Google Scholar]
- Kang, M.J.; Kang, J.W. Intrusion Detection System Using Deep Neural Network for In-Vehicle Network Security. PLoS ONE 2016, 11, e0155781. [Google Scholar] [CrossRef]
- He, T.; Zhang, L.; Kong, F.; Salekin, A. Exploring inherent sensor redundancy for automotive anomaly detection. In Proceedings of the 2020 57th ACM/IEEE Design Automation Conference, San Francisco, CA, USA, 20–24 July 2020; pp. 1–6. [Google Scholar]
- Wang, Z.; Guo, F.; Meng, Y.; Li, H.; Zhu, H.; Cao, Z. Detecting vehicle anomaly by sensor consistency: An edge computing based mechanism. In Proceedings of the Global Communications Conference (GLOBECOM), Abu Dhabi, United Arab Emirates, 9–13 December 2018; pp. 1–7. [Google Scholar]
- Xia, X.; Xiong, L.; Huang, Y.; Lu, Y.; Gao, L.; Xu, N.; Yu, Z. Estimation on IMU yaw misalignment by fusing information of automotive onboard sensors. Mech. Syst. Signal Process. 2022, 162, 107993. [Google Scholar] [CrossRef]
- Liu, W.; Xiong, L.; Xia, X.; Lu, Y.; Gao, L.; Song, S. Vision-aided intelligent vehicle sideslip angle estimation based on a dynamic model. IET Intell. Transp. Syst. 2020, 614, 1183–1189. [Google Scholar] [CrossRef]
- Xiong, L.; Xia, X.; Lu, Y.; Liu, W.; Gao, L.; Song, S.; Yu, Z. IMU-Based Automated Vehicle Body Sideslip Angle and Attitude Estimation Aided by GNSS Using Parallel Adaptive Kalman Filters. IEEE Trans. Veh. Technol. 2020, 69, 10668–10680. [Google Scholar] [CrossRef]
- Liu, W.; Xia, X.; Xiong, L.; Lu, Y.; Gao, L.; Yu, Z. Automated vehicle sideslip angle estimation considering signal measurement characteristic. IEEE Sens. J. 2021, 21, 21675–21687. [Google Scholar] [CrossRef]
- Gao, L.; Xiong, L.; Xia, X.; Lu, Y.; Yu, Z.; Khajepour, A. Improved vehicle localization using on-board sensors and vehicle lateral velocity. IEEE Sens. J. 2022, 22, 6818–6831. [Google Scholar] [CrossRef]
- Xia, X.; Hashemi, E.; Xiong, L.; Khajepour, A. Autonomous Vehicle Kinematics and Dynamics Synthesis for Sideslip Angle Estimation Based on Consensus Kalman Filter. IEEE Trans. Control Syst. Technol. 2023, 31, 179–192. [Google Scholar] [CrossRef]
- Alsuwian, T.; Saeed, R.B.; Amin, A.A. Autonomous Vehicle with Emergency Braking Algorithm Based on Multi-Sensor Fusion and Super Twisting Speed Controller. Appl. Sci. 2022, 12, 8458. [Google Scholar] [CrossRef]
- Alsuwian, T.; Usman, M.H.; Amin, A.A. An Autonomous Vehicle Stability Control Using Active Fault-Tolerant Control Based on a Fuzzy Neural Network. Electronics 2022, 11, 3165. [Google Scholar] [CrossRef]
- Corrigan, S. Introduction to the Controller Area Network (CAN). In Texas Instruments Application Report; Texas Instruments Incorporated, SLOA101B: Dallas, TX, USA, 2002. [Google Scholar]
- Wang, Y.; He, Z.; Zi, Y. Enhancement of signal denoising and multiple fault signatures detecting in rotating machinery using dual-tree complex wavelet transform. Mech. Syst. Signal Process. 2010, 24, 119–137. [Google Scholar] [CrossRef]
- Sanz, J.; Perera, R.; Huerta, C. Fault diagnosis of rotating machinery based on auto-associative neural networks and wavelet transforms. J. Sound Vib. 2007, 302, 981–999. [Google Scholar] [CrossRef]
- Wang, T.; Lu, C.; Sun, Y.; Yang, M.; Liu, C.; Ou, C. Automatic ECG Classification Using Continuous Wavelet Transform and Convolutional Neural Network. Entropy 2021, 23, 119. [Google Scholar] [CrossRef]
- Kaji, M.; Parvizian, J.; Van De Venn, H.W. Constructing a Reliable Health Indicator for Bearings Using Convolutional Autoencoder and Continuous Wavelet Transform. Appl. Sci. 2020, 10, 8948. [Google Scholar] [CrossRef]
- Krizhevsky, A.; Sutskever, I.; Hinton, G.E. ImageNet Classification with Deep Convolutional Neural Networks. Commun. ACM 2017, 60, 84–90. [Google Scholar] [CrossRef]
- LeCun, Y.; Kavukcuoglu, K.; Farabet, C. Convolutional networks and applications in vision. In Proceedings of the IEEE 2010 IEEE International Symposium on Circuits and Systems, Paris, France, 30 May–2 June 2010; pp. 253–256. [Google Scholar]
- Checkoway, S.; McCoy, D.; Kantor, B.; Anderson, D.; Shacham, H.; Savage, S.; Koscher, K.; Czeskis, A.; Roesner, F.; Kohno, T. Comprehensive Experimental Analyses of Automotive Attack Surfaces. In Proceedings of the 20th USENIX Conference on Security, SEC’11, San Francisco, CA, USA, 8–12 August 2011; USENIX Association: Berkeley, CA, USA, 2011; p. 6. [Google Scholar]
- Cho, K.-T.; Shin, K.G. Error handling of in-vehicle networks makes them vulnerable. In Proceedings of the 2016 ACM SIGSAC Conference on Computer and Communications Security, Vienna, Austria, 24–28 October 2016; pp. 1044–1055. [Google Scholar]
- Miller, C.; Valasek, C. A survey of remote automotive attack surfaces. In Proceedings of the Black Hat, Las Vegas, NV, USA, 2–7 August 2014; p. 94. [Google Scholar]
- Nie, S.; Liu, L.; Du, Y. Free-Fall: Hacking Tesla From Wireless To CAN Bus. In Proceedings of the Black Hat USA, Las Vegas, NV, USA, 26–27 July 2017; Black Hat: San Francisco, CA, USA, 2017; pp. 1–6. [Google Scholar]
- Othmane, L.B.; Weffers, H.; Mohamad, M.M.; Wolf, M. A survey of security and privacy in connected vehicles. In Wireless Sensor and Mobile Ad-Hoc Networks; Springer: New York, NY, USA, 2015; pp. 217–247. [Google Scholar]
- Hoppe, T.; Kiltz, S.; Dittmann, J. Security threats to automotive CAN networks–practical examples and selected short-term countermeasures. In Proceedings of the International Conference on Computer Safety, Reliability, and Security, Newcastle upon Tyne, UK, 22–25 September 2008; pp. 235–248. [Google Scholar]
- Woo, S.; Jo, H.J.; Lee, D.H. A Practical Wireless Attack on the Connected Car and Security Protocol for In-Vehicle CAN. IEEE Trans. Intell. Transp. Syst. 2014, 16, 1–14. [Google Scholar] [CrossRef]
- Rouf, I.; Miller, R.; Mustafa, H.; Taylor, T.; Oh, S.; Xu, W.; Gruteser, M.; Trappe, W.; Seskar, I. Security And Privacy Vulnerabilities Of In-car Wireless Networks: A Tire Pressure Monitoring System Case Study. In Proceedings of the 19th USENIX Conference on Security, USENIX Security’10, Washington, DC, USA, 11–13 August 2010; USENIX Association: Berkeley, CA, USA, 2010; p. 21. [Google Scholar]
- Guo, F.; Wang, Z.; Du, S.; Li, H.; Zhu, H.; Pei, Q.; Cao, Z.; Zhao, J. Detecting vehicle anomaly in the edge via sensor consistency and frequency characteristic. IEEE Trans. Veh. Technol. 2019, 68, 5618–5628. [Google Scholar] [CrossRef]
- Sun, H.; Chen, M.; Weng, J.; Liu, Z.; Geng, G. Anomaly detection for In-Vehicle network using CNN-LSTM with attention mechanism. IEEE Trans. Veh. Technol. 2021, 70, 10880–10893. [Google Scholar] [CrossRef]
- Comert, G.; Rahman, M.; Islam, M.; Chowdhury, M. Change Point Models for Real-time Cyber Attack Detection in Connected Vehicle Environment. IEEE Trans. Intell. Transp. Syst. 2021, 23, 12328–12342. [Google Scholar] [CrossRef]
- Continuous 1-D Wavelet Transform. Available online: https://ww2.mathworks.cn/help/wavelet/ref/cwt.html (accessed on 28 March 2023).
- Open Sourcing 223gb of Driving Data. Available online: https://medium.com/udacity/open-sourcing-223gb-of-mountain-view-driving-data-f6b5593fbfa5 (accessed on 28 March 2023).
- Trippel, T.; Weisse, O.; Xu, W.; Honeyman, P.; Fu, K. WALNUT: Waging Doubt on the Integrity of MEMS Accelerometers with Acoustic Injection Attacks. In Proceedings of the 2017 IEEE European Symposium on Security and Privacy (EuroS P), Paris, France, 26–28 April 2017; pp. 3–18. [Google Scholar]
- Petit, J.; Shladover, S.E. Potential Cyberattacks on Automated Vehicles. IEEE Trans. Intell. Transp. Syst. 2015, 16, 546–556. [Google Scholar] [CrossRef]
- Akowuah, F.; Kong, F. Physical invariant based attack detection for autonomous vehicles: Survey, vision, and challenges. In Proceedings of the Fourth International Conference on Connected and Autonomous Driving (MetroCAD), Detroit, MI, USA, 28–29 April 2021; pp. 31–40. [Google Scholar]
- Abualhoul, M.Y.; Shagdar, O.; Nashashibi, F. Visible Light inter-vehicle Communication for platooning of autonomous vehicles. In Proceedings of the 2016 IEEE Intelligent Vehicles Symposium (IV), Gothenburg, Sweden, 19–22 June 2016; pp. 508–513. [Google Scholar]
- Moubayed, A.; Shami, A. Softwarization, Virtualization, and Machine Learning For Intelligent and Effective V2X Communications. IEEE Intell. Transp. Syst. Mag. 2020, 14, 156–173. [Google Scholar] [CrossRef]
Disclaimer/Publisher’s Note: The statements, opinions and data contained in all publications are solely those of the individual author(s) and contributor(s) and not of MDPI and/or the editor(s). MDPI and/or the editor(s) disclaim responsibility for any injury to people or property resulting from any ideas, methods, instructions or products referred to in the content. |
© 2023 by the authors. Licensee MDPI, Basel, Switzerland. This article is an open access article distributed under the terms and conditions of the Creative Commons Attribution (CC BY) license (https://creativecommons.org/licenses/by/4.0/).