Article

Studies on Influence of Chromium Layer on Inner Surface of Steel Tube on Heat Transfer

Faculty of Mechatronics, Armament and Aerospace, Military University of Technology, 2 gen. S. Kaliskiego Street, 00-908 Warsaw, Poland
*
Author to whom correspondence should be addressed.
Appl. Sci. 2023, 13(9), 5523; https://doi.org/10.3390/app13095523
Submission received: 5 April 2023 / Revised: 24 April 2023 / Accepted: 27 April 2023 / Published: 28 April 2023
(This article belongs to the Special Issue Fluid Flow and Heat Transfer: Latest Advances and Prospects)

Abstract

:
This paper presents the results of numerical calculations of heat transfer in the steel wall of a tube with different chromium layer thicknesses on the inner surface for a single and a sequence of heat impulses. In modeling the thermal phenomenon, the tube material was assumed to be homogeneous, and the inner surface of the tube had a protective chromium layer. The calculations were performed for temperature-dependent parameters of the 30HN2MFA steel and chromium. The tube was divided into 30 zones. The time varying the heat transfer coefficient and the heat flux density on the inner surface of the tube in each zone were calculated. The numerical simulations of heat transfer in the tube wall were performed using the FEM implemented in COMSOL Multiphysics software. On account of the high thermal conductivity of chromium, after the first and subsequent heat impulses, as the thickness of the chrome layer increases, the highest peak temperature drops, while the temperature inside the steel wall of the tube increases. After the first heat impulse, the temperature of the wall at a depth 0.5 mm below the inner surface is twice as high for a tube with a 200 µm thick chrome coating compared to a tube without this coating. This paper showed that, after seven heat impulses, the temperature of the steel tube substrate does not exceed 750 °C, at which the shrinkage of the material occurs, causing cracks in the chrome coating.

1. Introduction

The low service life of a tube loaded with an intense heat impulse is related to the erosion of its internal surface caused by mechanical and chemical factors [1,2,3,4,5,6,7,8,9,10,11]. Studies have demonstrated that the tube’s wear mechanism is directly influenced by the maximum temperature of its surface [12]. It is important to keep the temperature of the tube wall below the value of approximately 800 °C specified by the producers [12,13]. The maximum temperature limit of the internal surface of the tube in operation is dictated by the tube’s steel grade characteristics. In 30HN2MFA steel, a temperature above 750 °C causes allotropic change related to the reconstruction of the crystal lattice of the alloy, which is manifested by material shrinkage [14,15,16]. The inner surface of the tube is exposed to temperature, which changes the volume of the surface layer and leads to the formation of cracks. The depth of the cracks on the inner surface of the tube can be as high as 0.3 mm, e.g., for a tube composed of 30HN2MFA steel with a thin layer of chrome after 1000 heat impulses [17]. The presence of cracks on the inner surface of the tube can lead to degradation of the protective coating, which is typically composed of electroplated chromium in older manufacturing methods or nitride in newer designs. The erosion of the protective coating is attributed to changes in the structure of the underlying material, which are related to the phase transition between ferrite and austenite [3,15,18]. To simulate heat transfer, both the constant thermophysical properties of the tube steel and temperature-dependent properties are assumed [12,18,19,20,21,22,23,24].
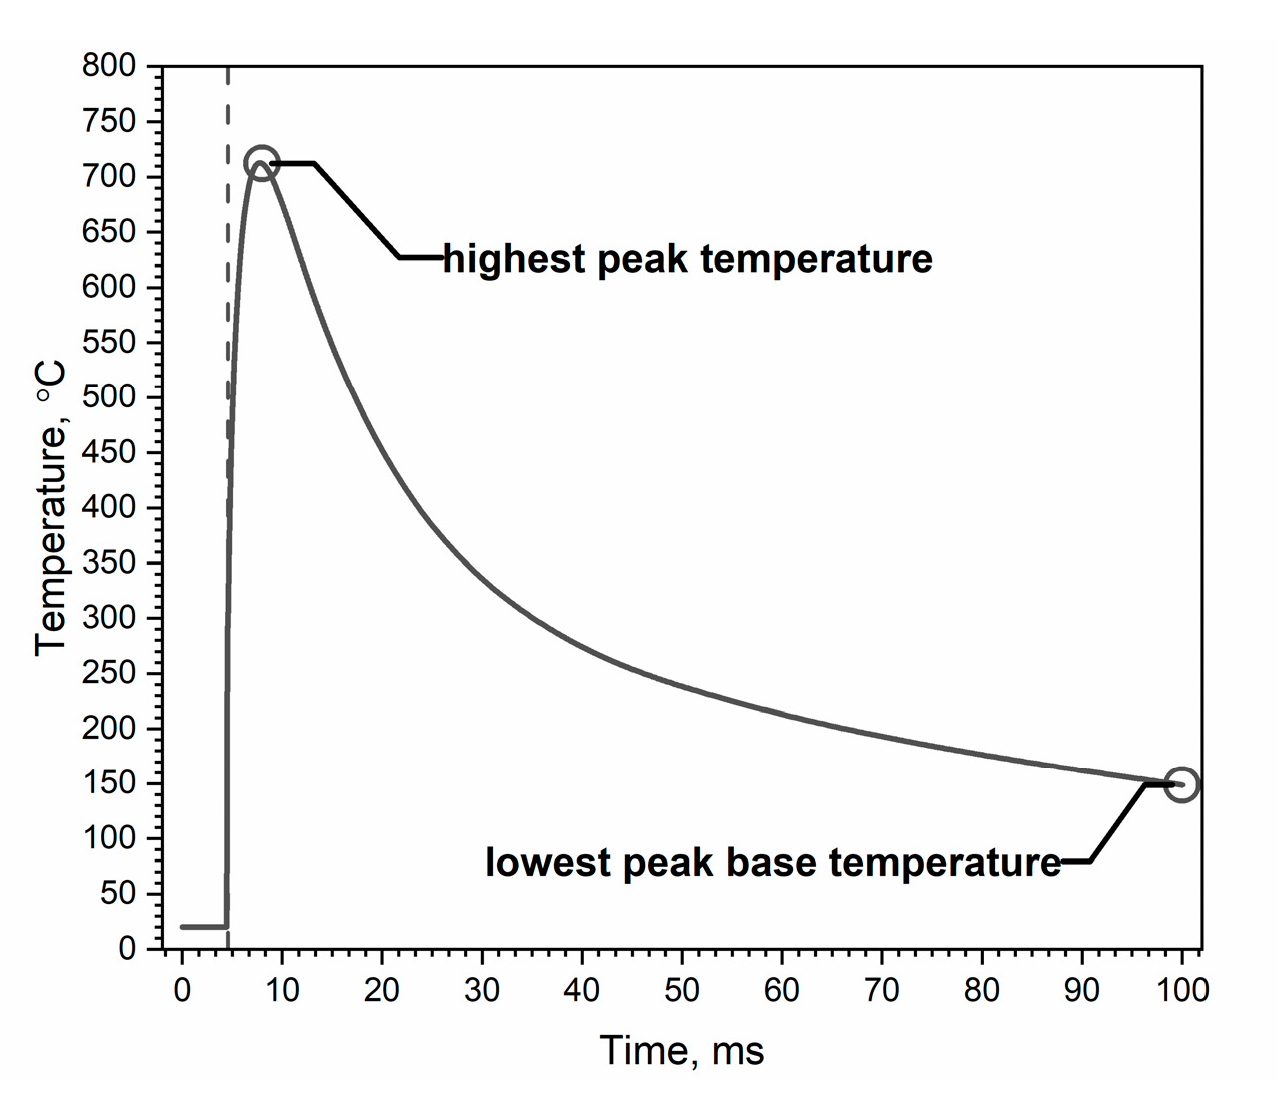
Typically, changes in the density of tube materials due to temperature are small and, therefore, neglected [21]. The correct thermophysical properties of the new steel grades are important, as input data for tube heat-transfer calculations are critical to obtain accurate results. The authors recommend considering only the phase change of thermal conductivity [25]. During a series of heat impulses, the temperature of the tube material will steadily increase. On each temperature curve, we can determine the so-called highest peak temperature and lowest temperature of the peak base (the temperature of the inner surface of the tube) [25].
It seems important to consider the chromium layer’s influence on the tube’s heat transfer. Authors of some articles believe that the thermal contact resistance of the interlayer between the steel tube and the chrome coating can be neglected [25,26,27,28]. Other publications assume that the thermal contact resistance R exists and is constant, for example, R = 0.00053 m2·°C/W, which leads to the adoption of the join conductance (precisely: the constriction conductance from the contact spots) at the level of approx. 1900 W/(m2·°C) [29,30,31,32,33]. It seems that, both for thin chromium layers and for layers above 100 µm, the constant values of thermal contact resistance are unreliable, leading to overestimation of the temperature results of the inner surface of the tube. According to the authors, in the case of thin chromium layers where we can talk about the plastic deformation of surface asperities, the pressure of the gas virtually eliminates thermal contact resistance [31]. In the case of thick chromium layers, we can talk about the elastic deformation of surface asperities, which also depends on the pressure of the gas. In this case, due to the lack of reliable data, the authors also assumed no thermal contact resistance of the interlayer between the steel cylinder and the chrome coating. In this work, an initial boundary value problem (IBVP) of heat transfer in the wall of a 35 mm inner diameter tube was solved for a single and a sequence of seven heat impulses. The tube was divided into 30 zones—Figure 1. The heat transfer coefficient h i t and the gas temperature T g ( t ) were calculated in 30 cross-sections, P1 to P30, in the middle of zones S1 to S30 (Table 1). The functions h i t in cross-sections Pi are valid in the zones Si (e.g., function h 1 t in section P1 is valid in zone S1). The zone in the range from 0 to 216 mm, which requires a different heat transfer model, was omitted in the calculations. It was assumed that there is a galvanic protective chrome coating on the inner surface of the tube. The calculations were performed taking into account thermal conductivity, specific heat and density as a function of temperature (from room temperature—RT to 1000 °C) of 30HN2MFA steel and galvanic chromium Cr [15,34,35,36]. Various chromium layer thicknesses were considered in the calculations, i.e., 10, 20, 30 and 200 µm. Particular attention was paid to the numerical calculations of the heat transfer in the wall of the tube with protective coatings of different thicknesses for a single and a sequence of heat impulses. An additional idea was to perform numerical simulations of the temperature distribution along the entire length of the tube after sequences of seven heat impulses.
When operating the considered tube, destruction of the inner surface of the tube due to overheating is often observed. This damage is manifested by a network of cracks and degradation of the protective chrome coating [4,14,15,16,17]. Thermal loads in the tube of 30HN2MFA steel lead to changes in its structure, which then cause a change in the mechanical properties of the tube. These structural changes are related to the ferrite–austenite phase transition in the tube steel at temperatures above 750 °C [14,15]. As is known, such a transition during the heating of steel is associated with a sharp change in volume. In the above case, the shrinkage is caused by the phase transition from the BCC crystallographic lattice to the FCC [37]. As the heat impulses are repeated, the cracks appearing in the tube grow bigger. After a series of heat impulses, the tube is cooled, and the austenite is converted back to ferrite. In addition, high pressure shifts the transformation of austenite to ferrite towards a lower temperature. In summary, the combined action of heat and pressure causes deeper cracks to form and spread in the steel of the tube and, consequently, leads to the destruction of the chrome coating. Early authors’ tests of the temperature-dependent thermophysical characteristics of 30HN2MFA steel showed that the ferrite–austenite phase transition occurs at a temperature of approximately 750 °C [15]. In this paper, it was checked whether the temperature of the substrate of the tube with a chrome coating of various thicknesses would exceed 750 °C after a series of heat impulses. According to the manufacturer’s suggestion, the number of heat impulses was limited to seven. The literature query showed that shrinkage of the substrate material of a steel tube covered with a layer of chromium subjected to a series of heat impulses had not been analyzed so far.
Numerical simulations of heat transfer in a tube composed of 30HN2MFA steel obtained a temperature distribution on the inner surface of the tube. An exemplary temperature distribution on the inner surface of the tube during a single heat impulse is shown in Figure 2. This paper shows that the lowest peak base temperature of the inner surface of the chrome-plated tube is actually the temperature of the inner wall of the tube to a depth of 0.5 mm.

2. Material and Numerical Methods

2.1. Heat Transfer Coefficient and Gas Temperature

The heat transfer coefficient is calculated in the cross-section P1 to P30 of the tube from an expression [38]:
h = 6.1 D 0.2 ρ ( t ) w ( t ) 0.8
where:
D—the inner diameter of the tube,
ρ—density of gas,
w—velocity of gas.
Velocity w(t), density ρ(t) and gas temperature Tg(t) are calculated by solution of the internal ballistics model [39,40,41]:
  • when the piston is inside the tube:
d R T g d t = f R T g m p d z p d t γ 1 φ m v d v d t m p z p
where:
z p —fraction of mass burned of propulsion material,
v —velocity of piston,
ρ = m p z p V 0 + s l m p ρ p 1 z p η m p z p
assuming a linear variation of the velocity of the gas in the tube
w = l i l 0 + l v
where: l i —distance from the bottom of the tube to the cross-section Pi,
l 0 —distance from the bottom of the tube to the first zone boundary (PS1 = 216 mm),
l —travel of piston in tube,
  • when the tube is open (piston leaves the tube):
d R T g d t = f R T g d z p d t γ 1 R T g d ζ d t z p ζ
ρ = m p z p ζ V 0 + s l m m p ρ p 1 z p η m p z p ζ
where: ζ —fraction of the mass of gas that flowed out from the tube.
Assuming that the gas flowing out of the tube reaches critical parameters
w = l i l 0 + l m w c r
where w c r = γ R T c r = 2 γ γ + 1 R T g ; w c r , T c r —critical velocity and critical temperature of gas at the tube outlet.
Calculations were carried out until the gas pressure dropped to 0.18 MPa [42]. The main parameters for the calculations [25] are shown in Table 2.
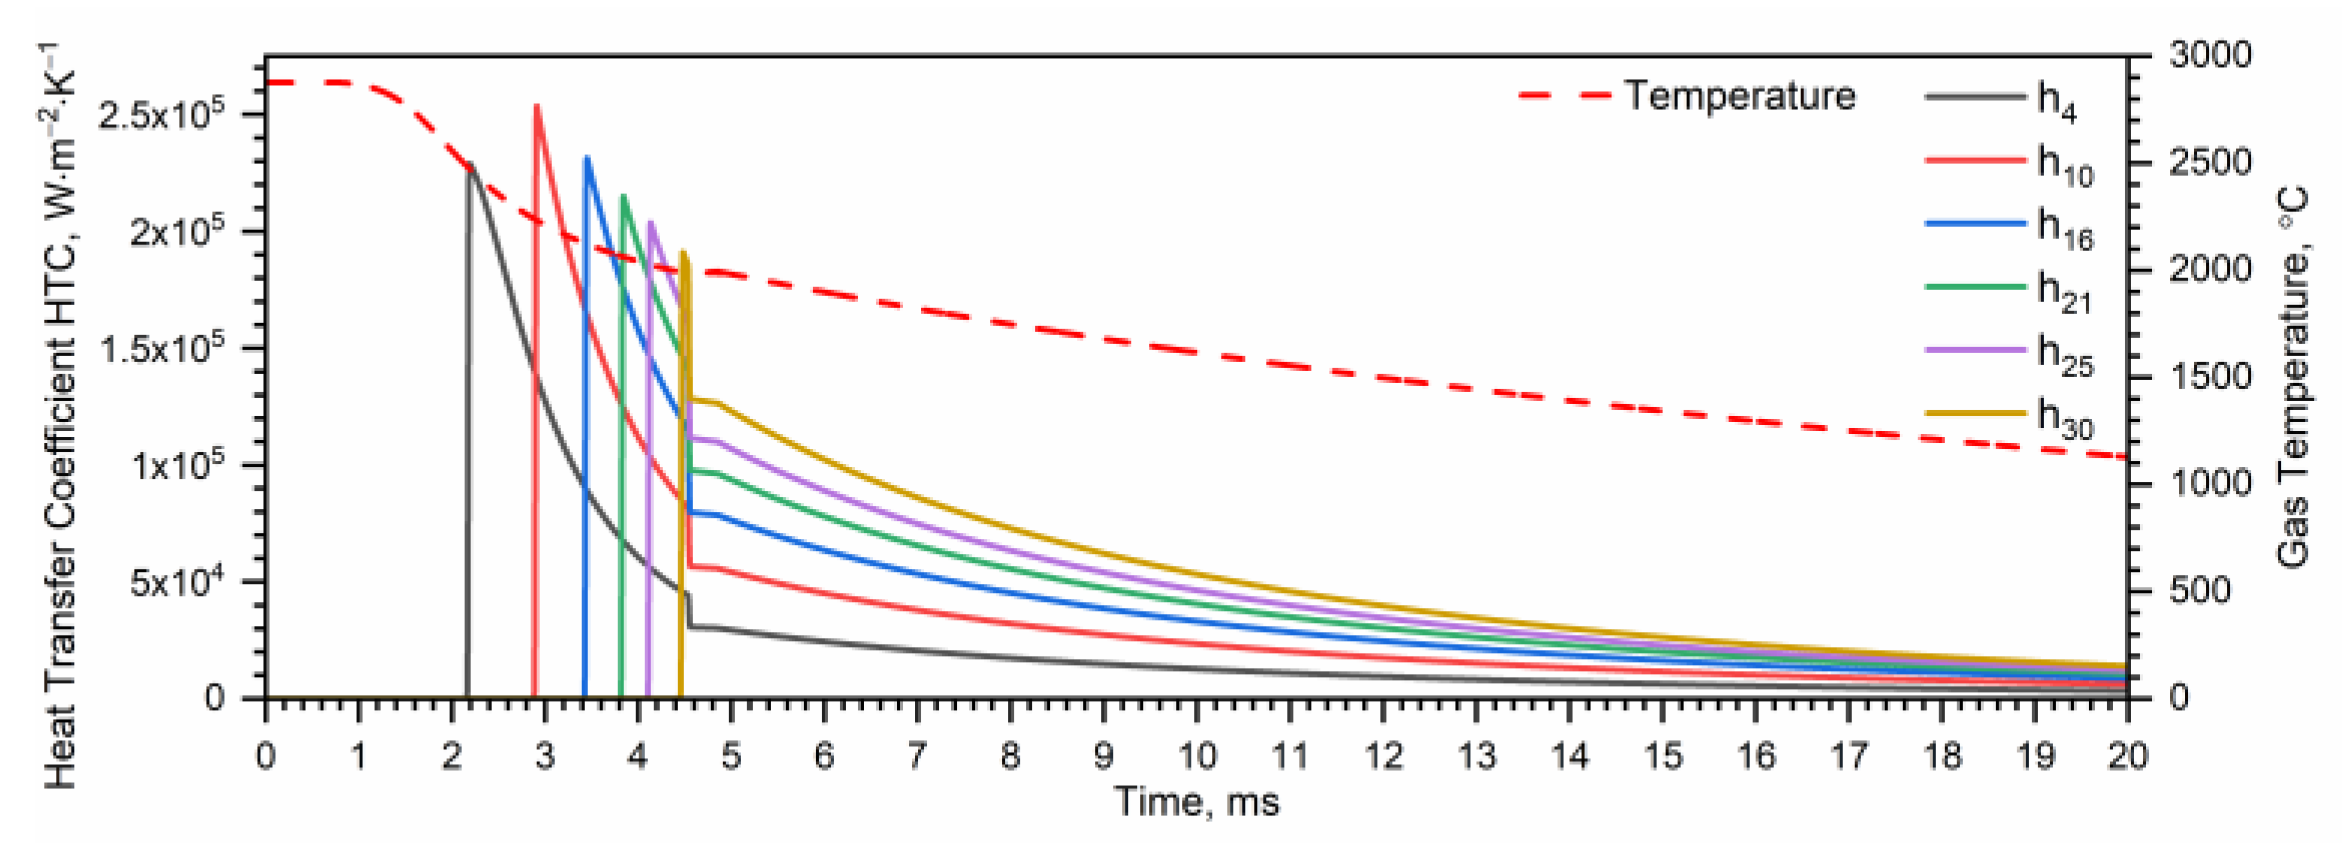
An example of the calculation results of the heat transfer coefficient h i ( t ) in the 6 cross-sections, P4, P10, P16, P21, P25 and P30, and the gas temperature T g ( t ) are shown in Figure 3.
For t = 4.54 ms, the heat transfer coefficient h i ( t ) sharply drops in each of the 6 chosen cross-sections. This is the moment when the piston leaves the tube.
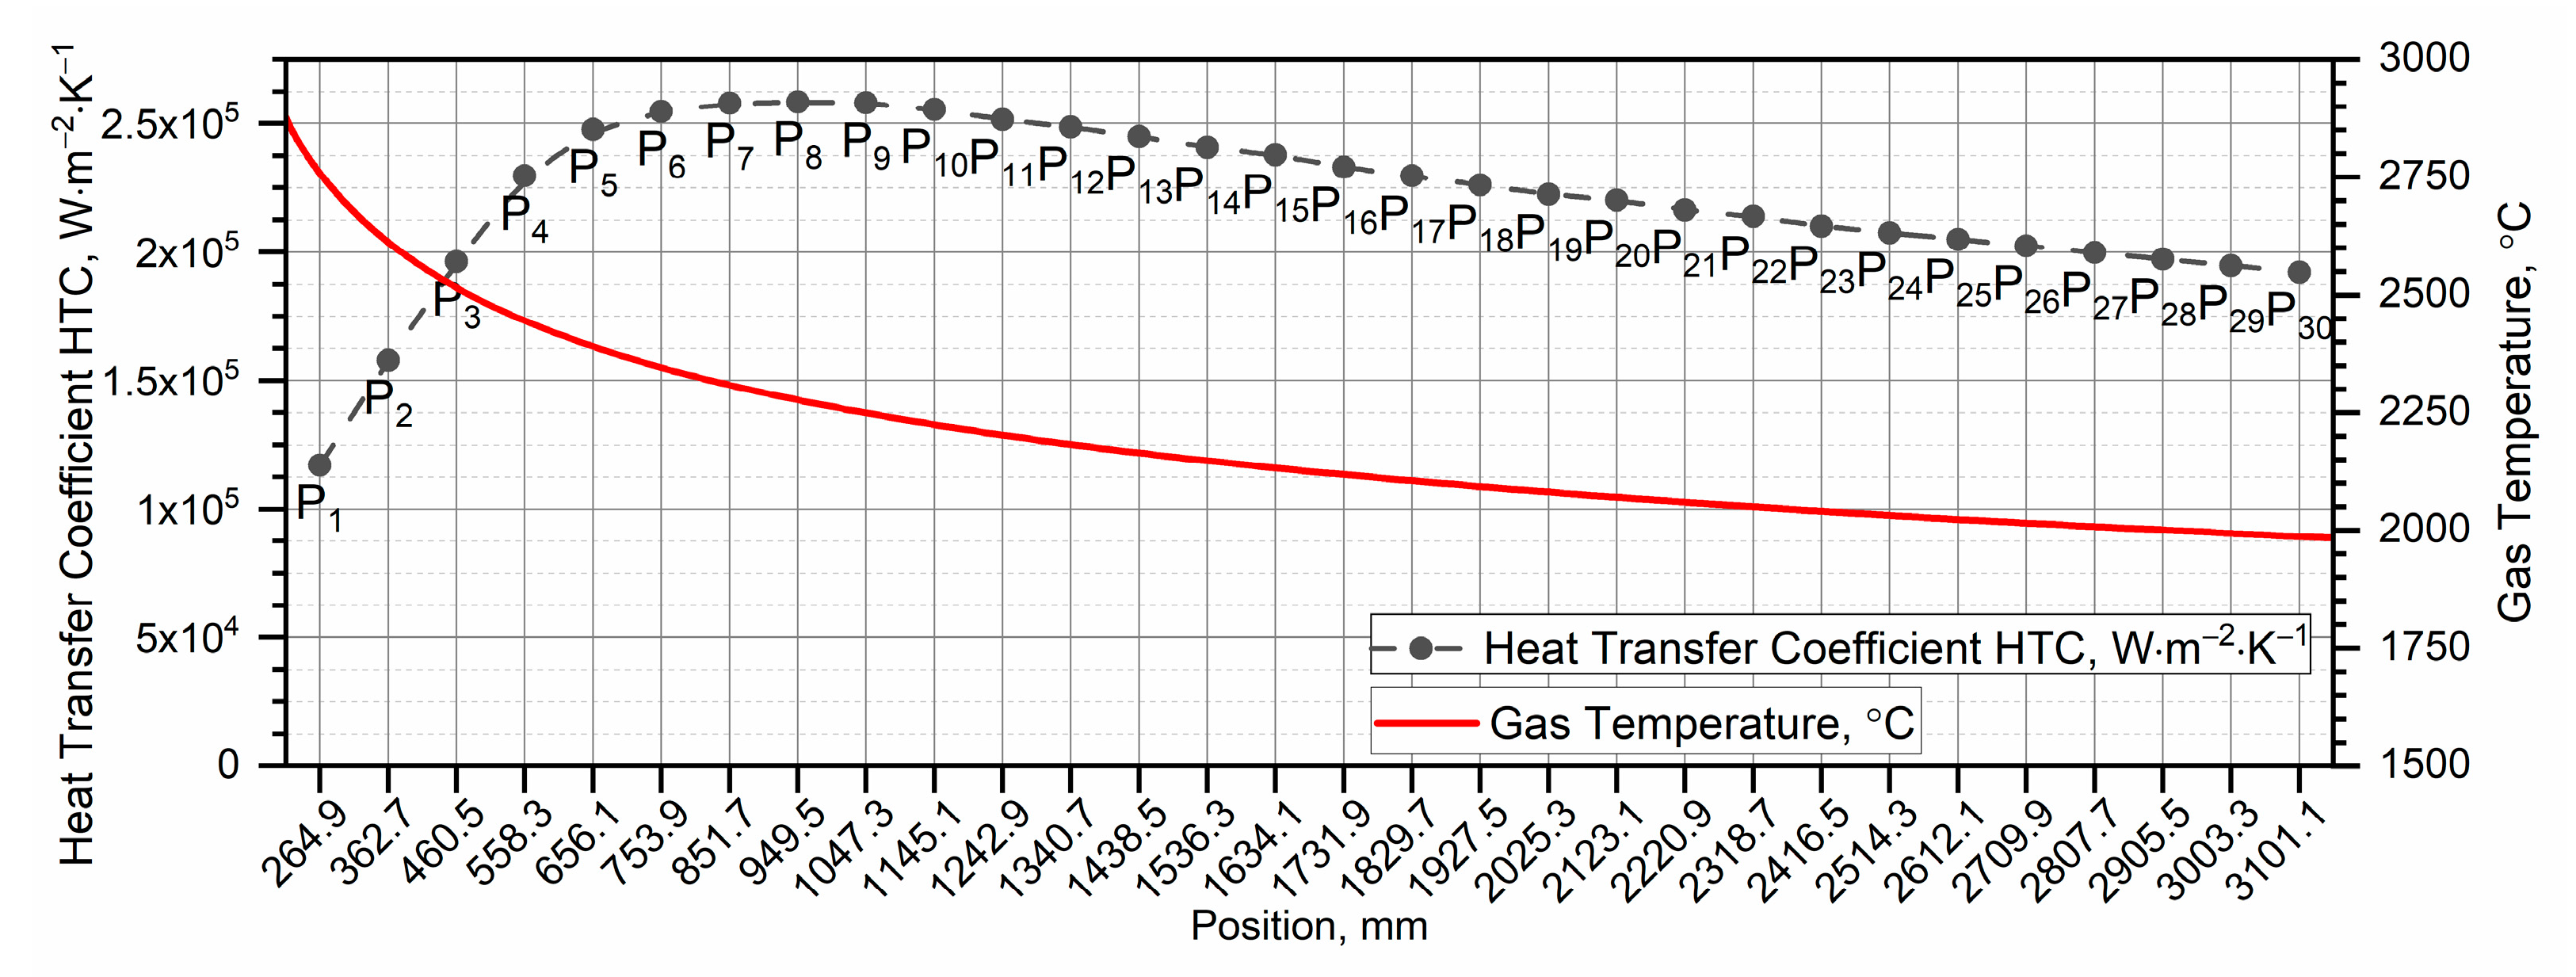
The envelopes of the maxima h i in all zones are shown in Figure 4. The highest value is achieved by the heat transfer coefficient in the S7, S8 and S9 zones. In the following zones, the values of h i begin to slowly decrease.

2.2. Thermophysical Properties of Steel and Chromium

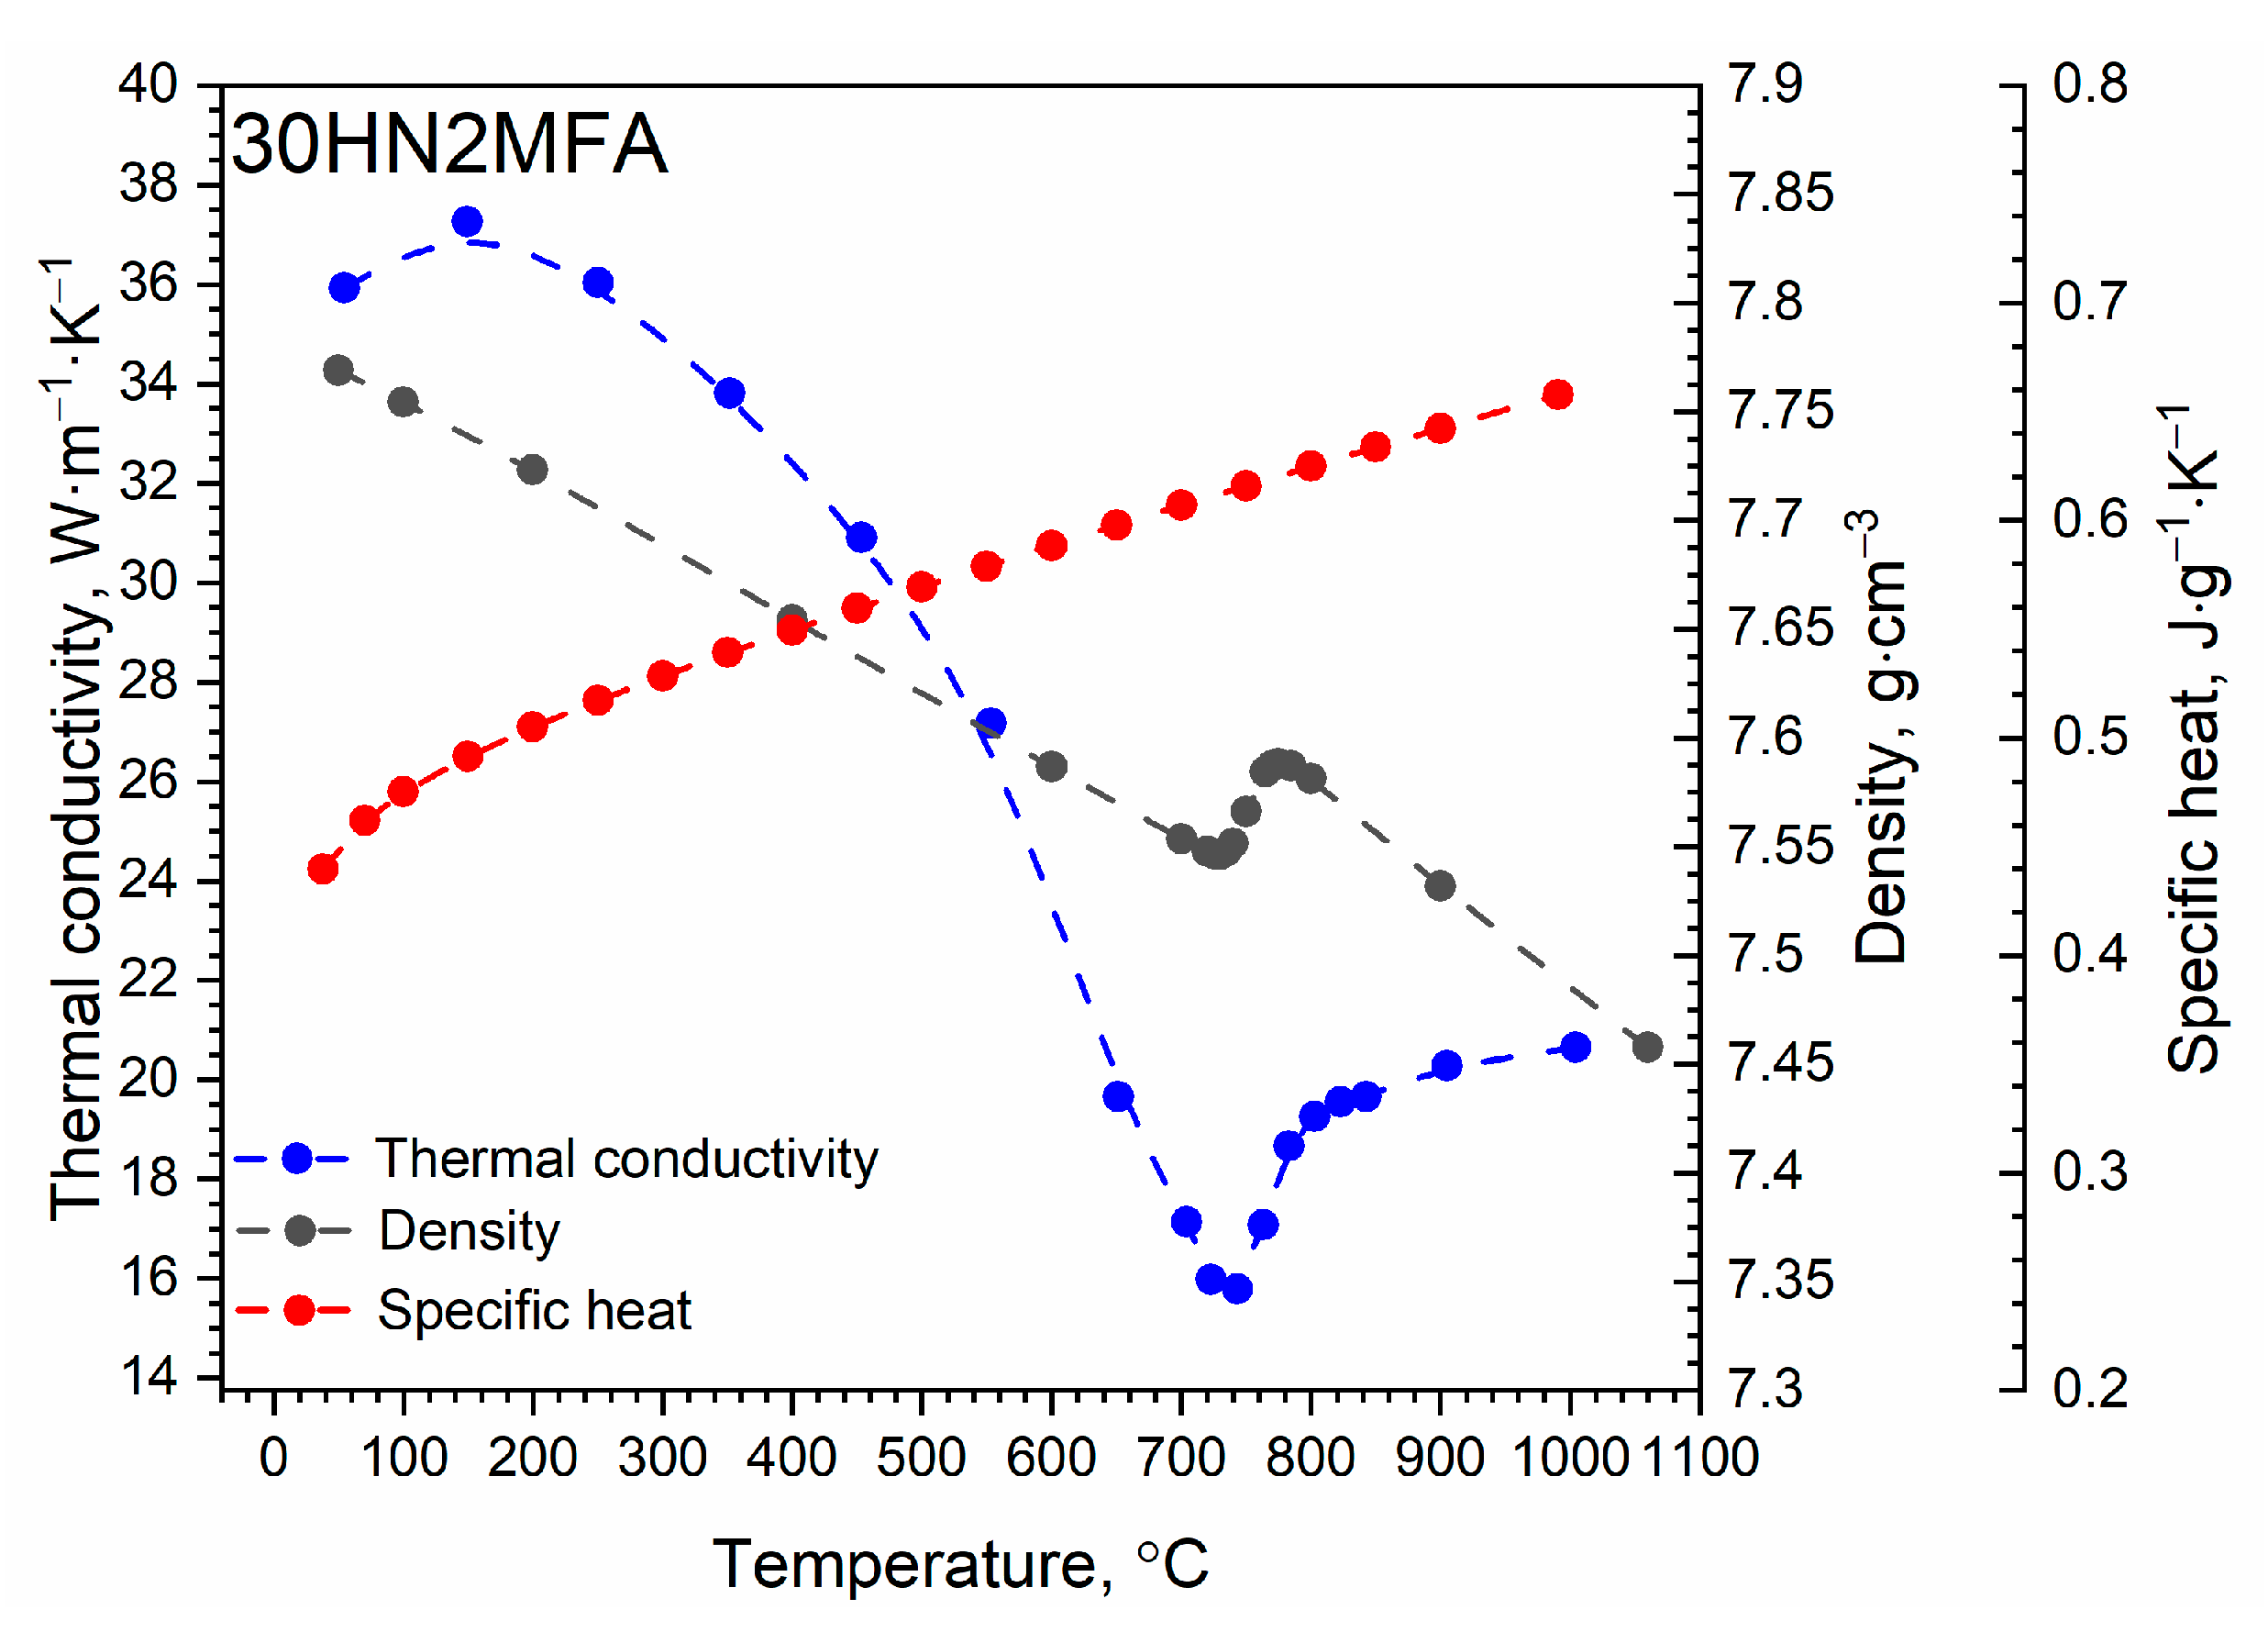
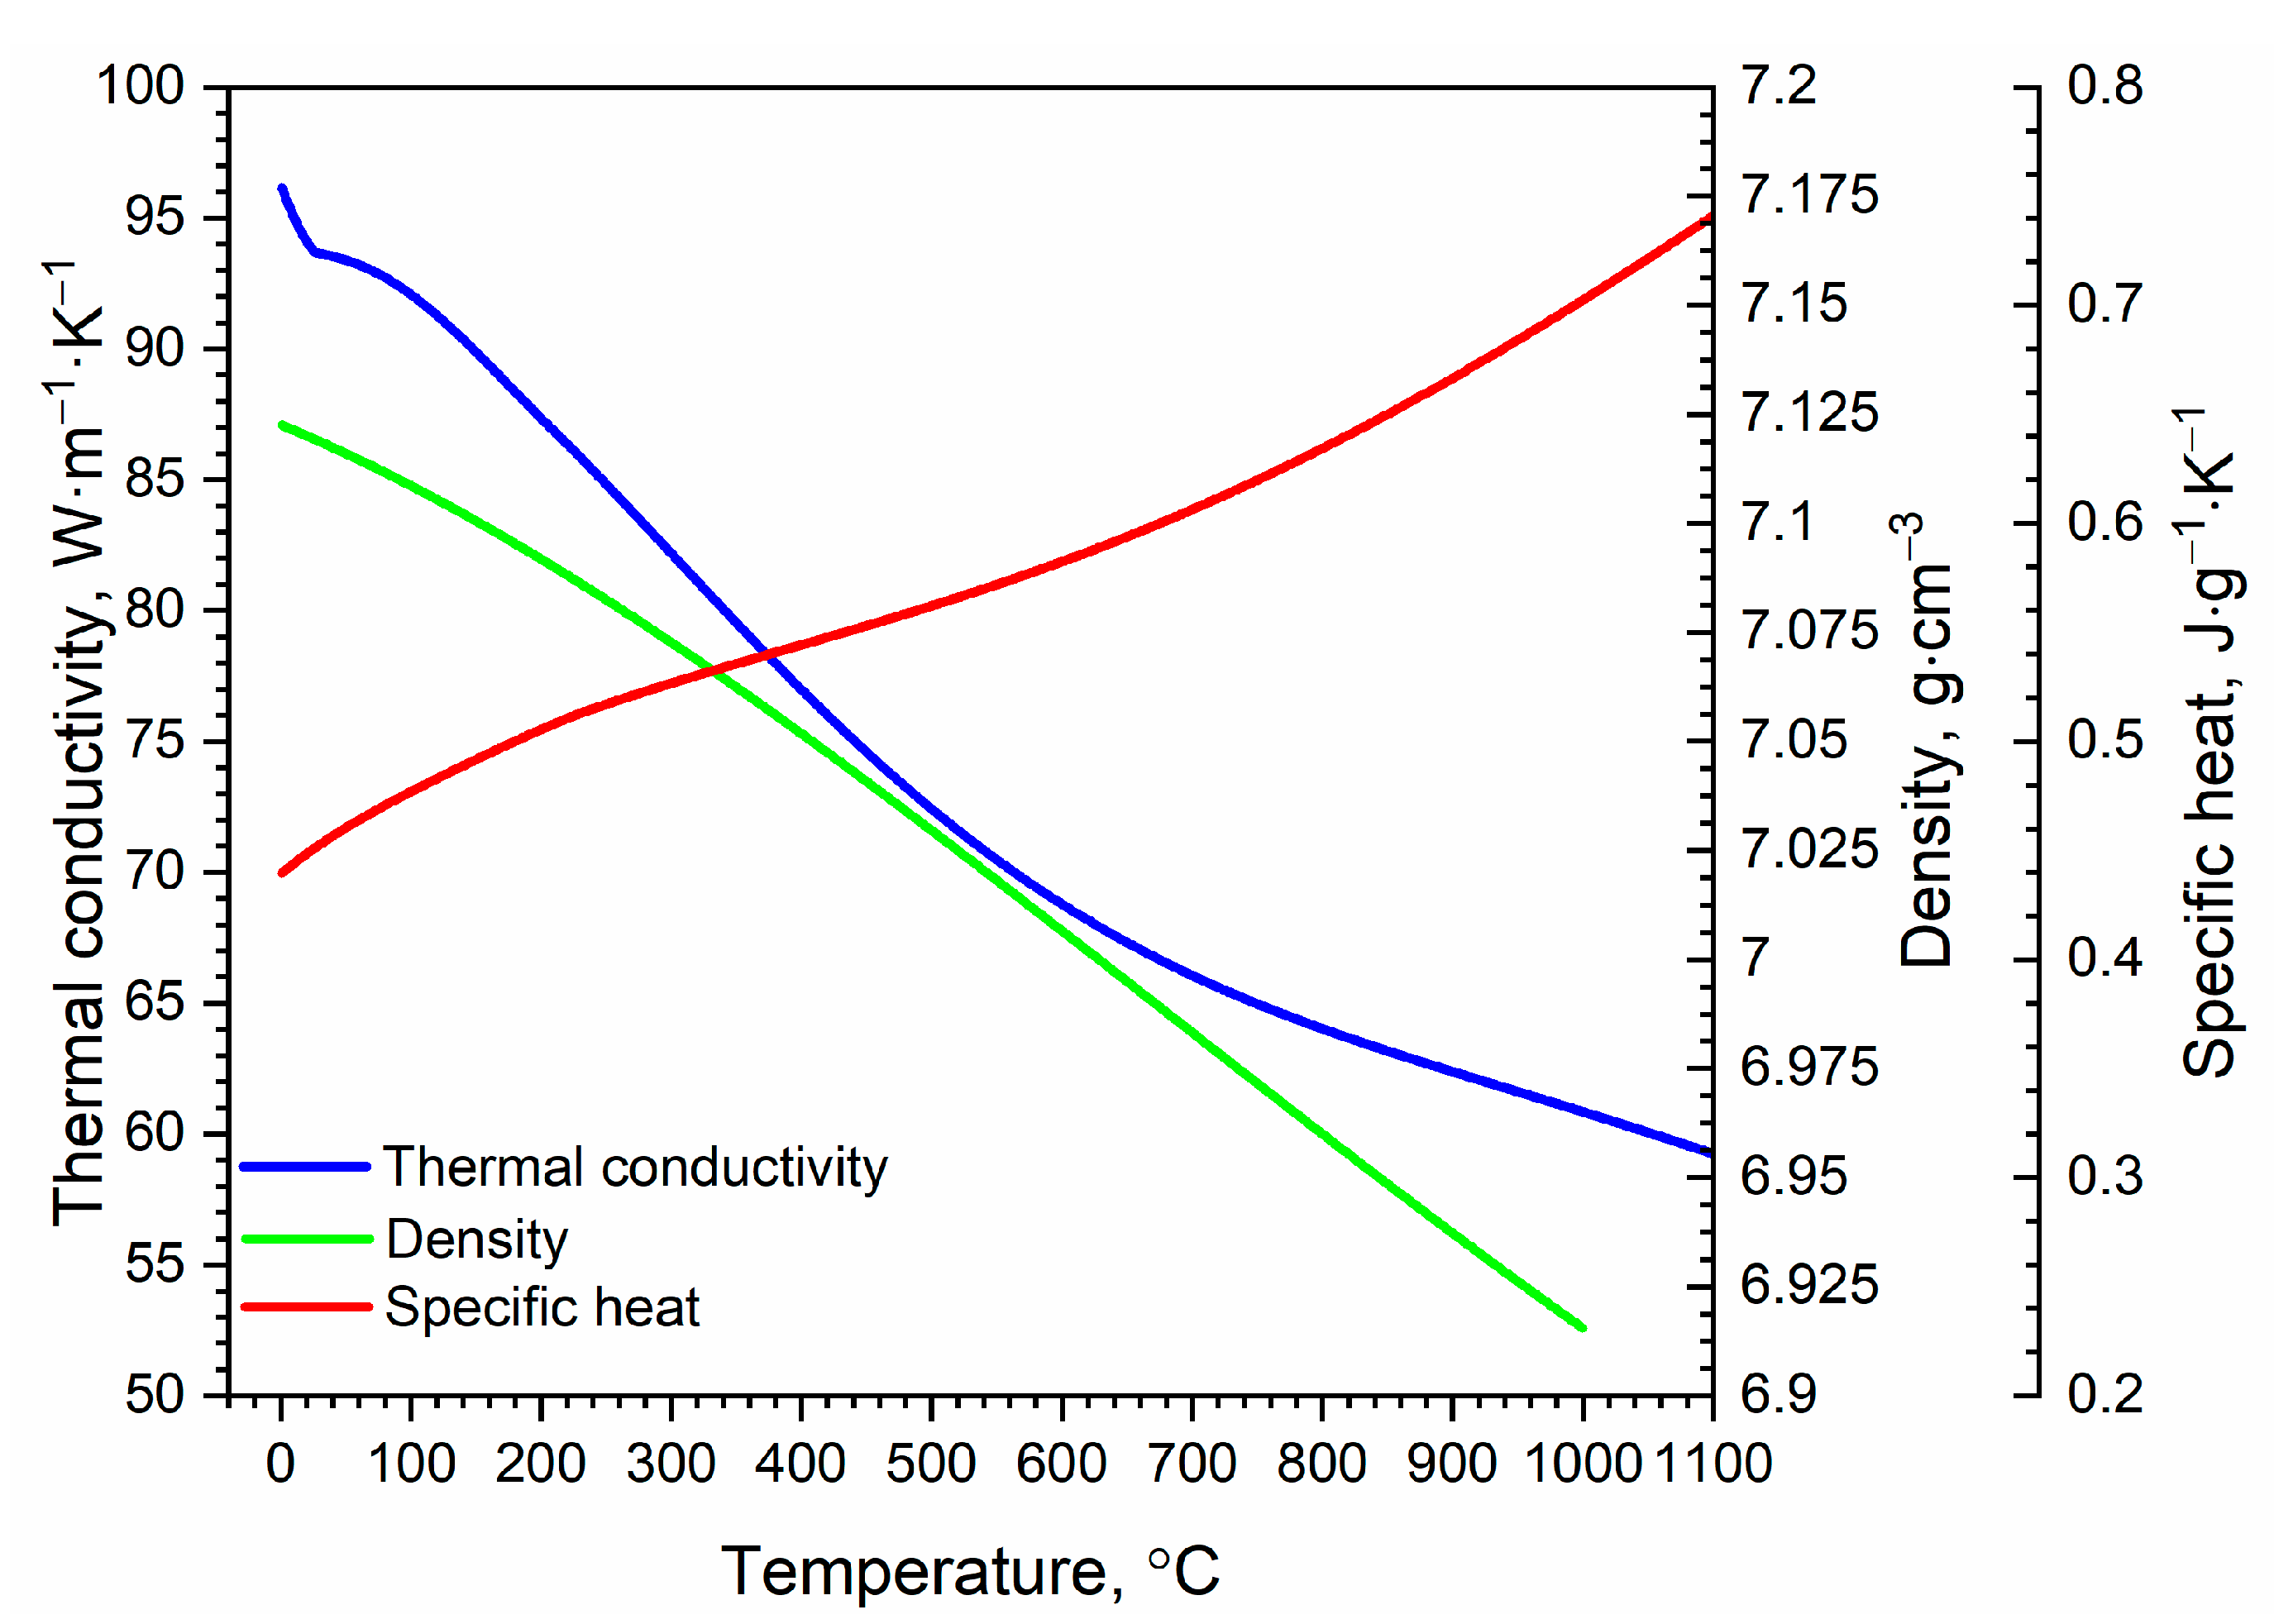
Thermal conductivity k s , specific heat c s and density ρ s as a function of temperature in the range from RT to 1000 °C of 30HN2MFA steel and galvanic chromium were adopted as a contribution to IBVP of heat transfer in the wall of the considered tube, as shown in Figure 5 and Figure 6 [15]. The data for steel between measurement points were approximated using splines in the COMSOL program. The same procedure was performed for chromium. The data for chromium with a resolution of 1 °C were taken from [34,35,36]. While the density ρ C r and specific heat c C r of chromium as a function of temperature are comparable with these parameters for the 30HN2MFA steel, the thermal conductivity k C r of chromium is approximately three times higher.
For the 30HN2MFA steel at approximately 740 °C, there was a ferrite–austenite phase transition responsible for the material shrinkage [15]—Figure 5. The energy of the phase transition was included only in the material density and thermal conductivity, while in the specific heat, this energy was ignored. This problem was extensively discussed in [43].

2.3. Initial Boundary Value Problem

The material of the tube is 30HN2MFA steel (outer layer), and the inner wall is coated by a thin layer of chromium. The radius of the inner wall, the interface between the chromium and the steel, and the outer wall are defined as r i n , r m and r o u t , respectively—Figure 7.
Finally, the temperature-dependent thermophysical parameters of steel ( k s , c s , ρ s ) and chromium ( k C r , c C r , ρ C r ) were used. The initial temperature of the tube was T 0 = 20   ° C . The heat transfer on the tube’s outer surface was q ˙ o u t = h o u t · T t , r z , z T 0 . A substitutive heat transfer coefficient value of h o u t = 9.2   W / m 2 · K was identical along the entire tube’s outer surface length. The contact thermal resistance at the interface between the inner and outer layers was neglected. The governing equations for nonlinear and axially symmetrical 2D IBVP, initial condition and boundary conditions of a two-layer tube are given as follows:
ρ C r T c C r T T t = 1 r r k C r T r T r + z k C r T T z r i n < r < r m ,   0 < z < l m ,   t > 0
k C r T T r = q ˙ i t , r = r i n , z q ˙ i t , r = r i n , z = h i t · T t , r i n , z T g t , r i n , z i = 1 , , 30   ( i a   z o n e   n u m b e r   f r o m   S 1   t o   S 30 )
k C r T T r = k s T T r ,   T C r = T s ,   r = r m
ρ s T c s T T t = 1 r r k s T r T r + z k s T T z r m < r < r o u t ,   0 < z < l m , t > 0
k s T T r = q ˙ o u t q ˙ o u t = h o u t · T t , r o u t , z T 0
T 0 , r , z = T 0 ,   r i n < r < r o u t ,   0 < z < l m
where r i n = 35 2 m m , and r o u t is dependent on the variable zFigure 1.
The simulations were carried out using the finite elements method in the COMSOL Multiphysics software ver. 5.6. The duration of a single heat impulse was 100 ms. The calculations were performed on 30 zones. The mesh compaction was carried out at the border of the zonal division and near the inner surface of the tube. Along the length of the tube at the border of the zone division, the mesh compaction with a geometric sequence a n = a 1 · q n 1 , where n = 15 to the boundary of the zone and 15 beyond, a 1 = 0.135   m m , and q = 1.9 , was performed—Figure 8 (border between S8 and S9). The zone division boundary requires the mesh compaction because each zone has a different heat transfer coefficient h i t . Near the inner surface of the tube in the radial direction r:
(a)
in the range r i n < r 17.51   m m —the mesh compaction with a geometric sequence a n = a 1 · q n 1 , where n = 25, a 1 = 4.328277505 · 10 5   m m , and q = 1.155 , was performed;
(b)
in the range 17.51   m m < r 17.52   m m —the equal division into 5 cells was performed;
(c)
in the range 17.52   mm < r 17.53   m m —the equal division into 5 cells was performed;
(d)
in the range 17.53   m m < r 17.7   m m —the mesh compaction with a geometric sequence a n = a 1 · q n 1 , where n = 9, a 1 = 7 · 10 3   mm , and q = 1.25 , was performed;
(e)
in the range 17.7   m m < r 18.5   m m —the mesh compaction with a geometric sequence a n = a 1 · q n 1 , where n = 9, a 1 = 0.0735   m m , and q = 1.25 , was performed;
(f)
in the range 18.5   m m < r 30   m m —the mesh compaction with a geometric sequence a n = a 1 · q n 1 , where n = 9, a 1 = 0.5   m m , and q = 1.25 , was performed;
(g)
in the range 30   m m < r r o u t —the equal division into 8 cells was performed;
Near the inner surface of the tube in the radial direction r:
-
in case (a)—the compaction of the mesh is due to the large temperature gradient along the thickness of the tube—Figure 8C;
-
in case (d)—mesh compaction shortens the calculation time in relation to the uniform mesh;
-
in case (e)—the compaction of the mesh is due to the large temperature gradient between Cr—steel interface—Figure 8D;
-
in case (f)—mesh compaction shortens the calculation time in relation to the uniform mesh.
Figure 8. Meshed cells with quad elements of a tube (shown in Figure 1).
Applsci 13 05523 g008
The same IBVP was solved for the subsequent heat impulses. The temperature distribution in the wall after the end of the heat impulse is the initial condition for the next heating cycle, i.e., T t j , r , z = T 0 , r , z , with j—number of heat impulses. The boundary conditions are the same for each heat impulse.
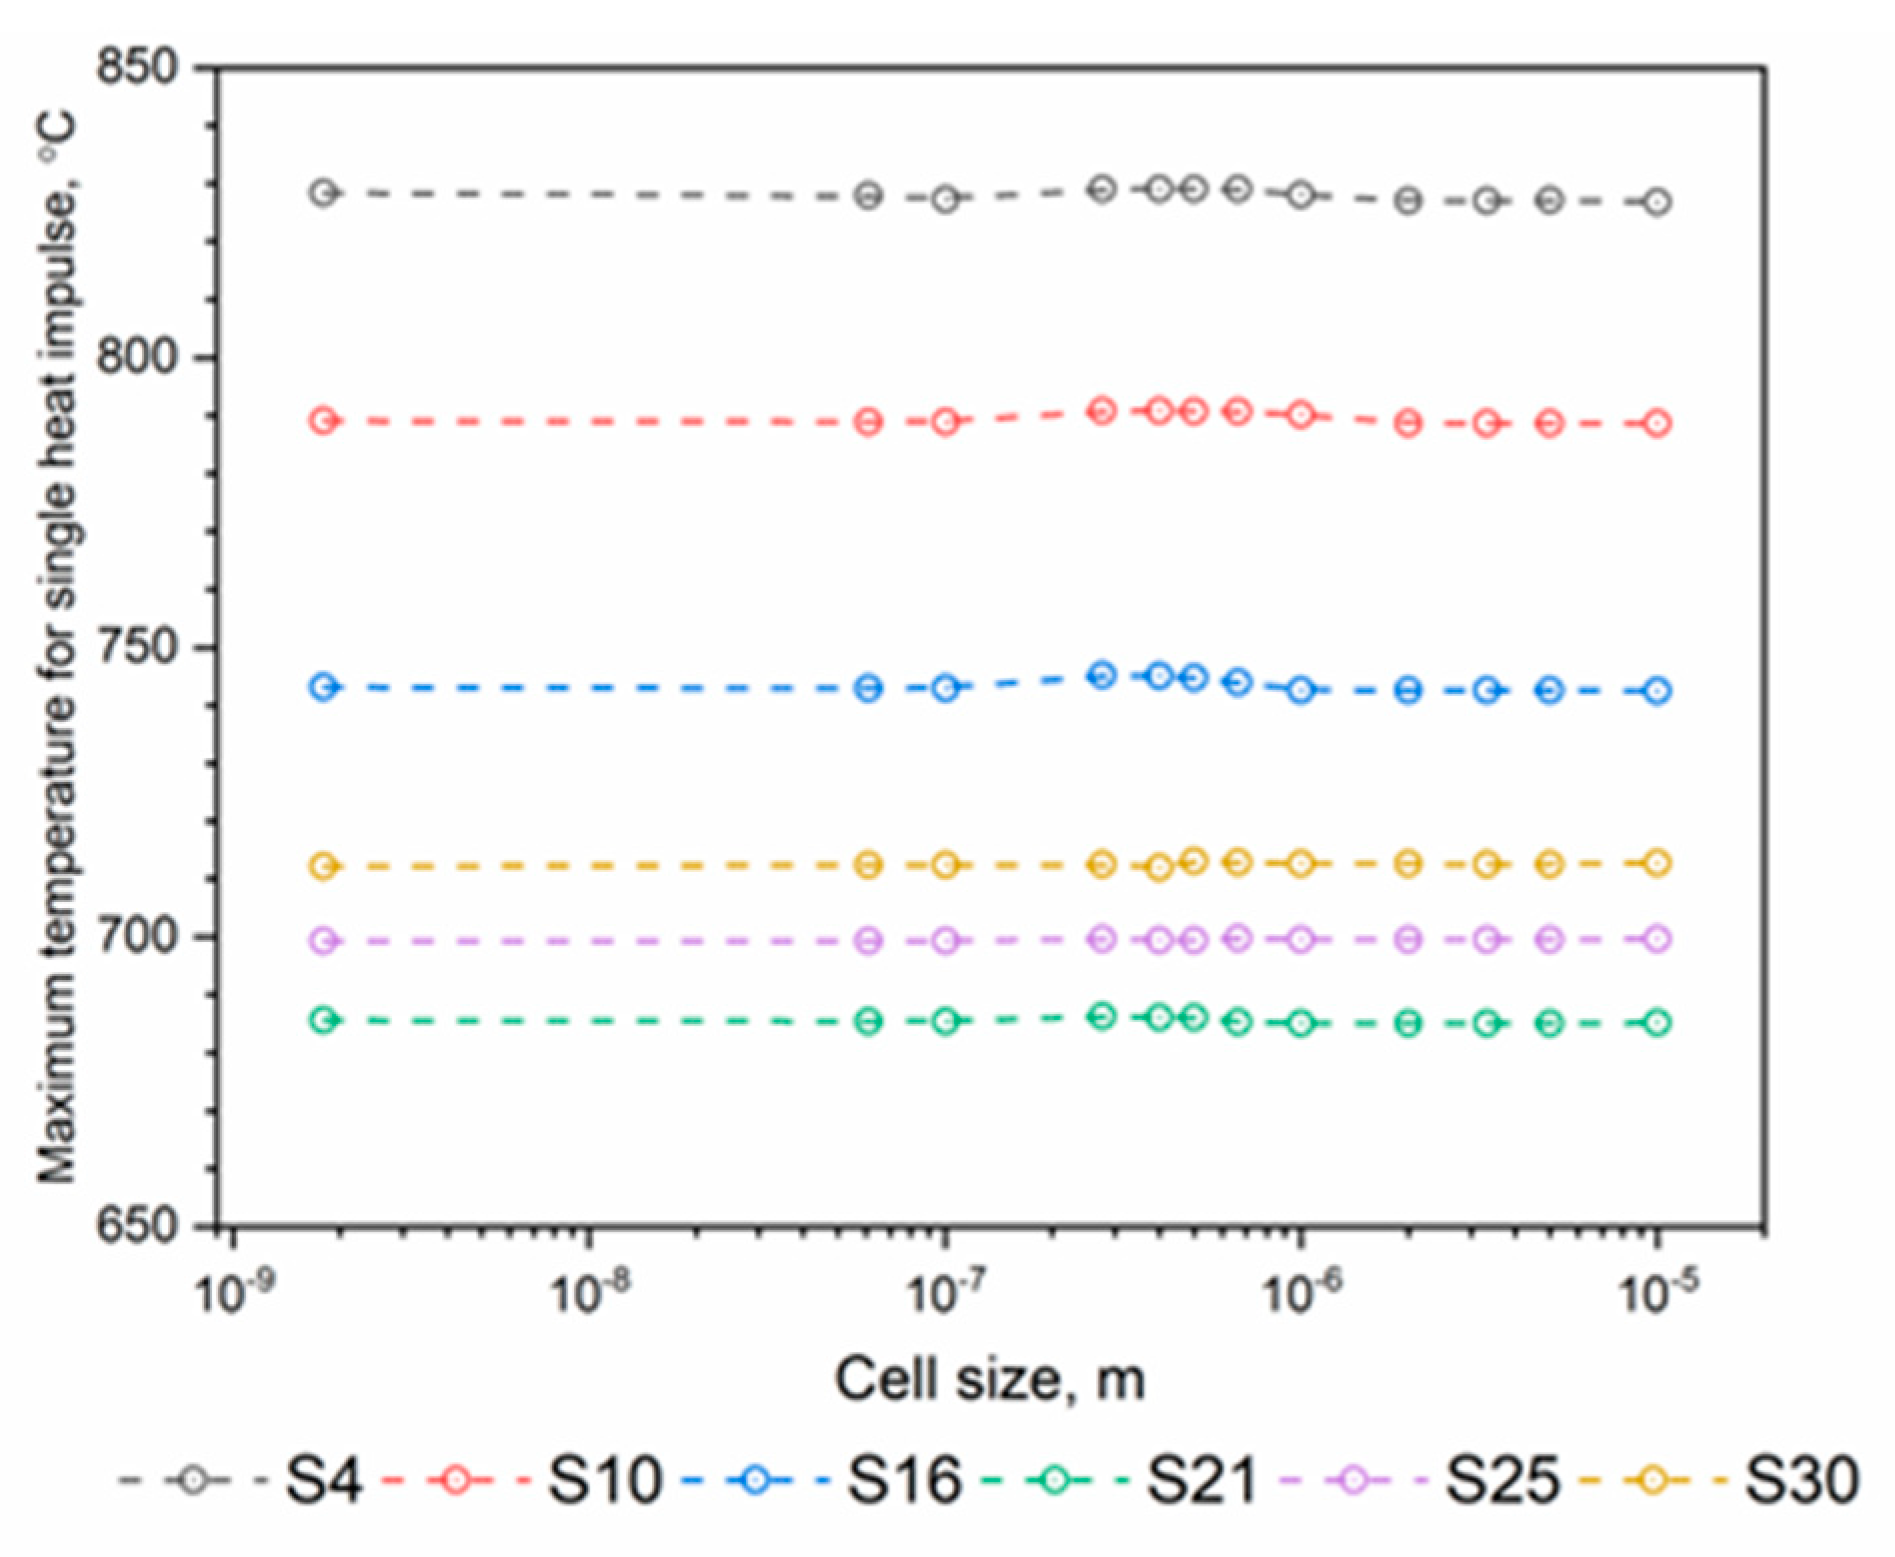
The mesh size sensitivity analysis conducted for a single heat impulse allowed for the assumption of the element size applied during the simulations. The results of the influence of the mesh size on the maximum temperature on the inner surface of the tube (obtained during preliminary numerical tests), which is the most sensitive to the mesh size, are shown in Figure 9. Our research showed no significant influence of the mesh size on the calculation results. Finally, the smallest mesh size in the form of a quad element of 0.1 µm was adopted—Figure 9.
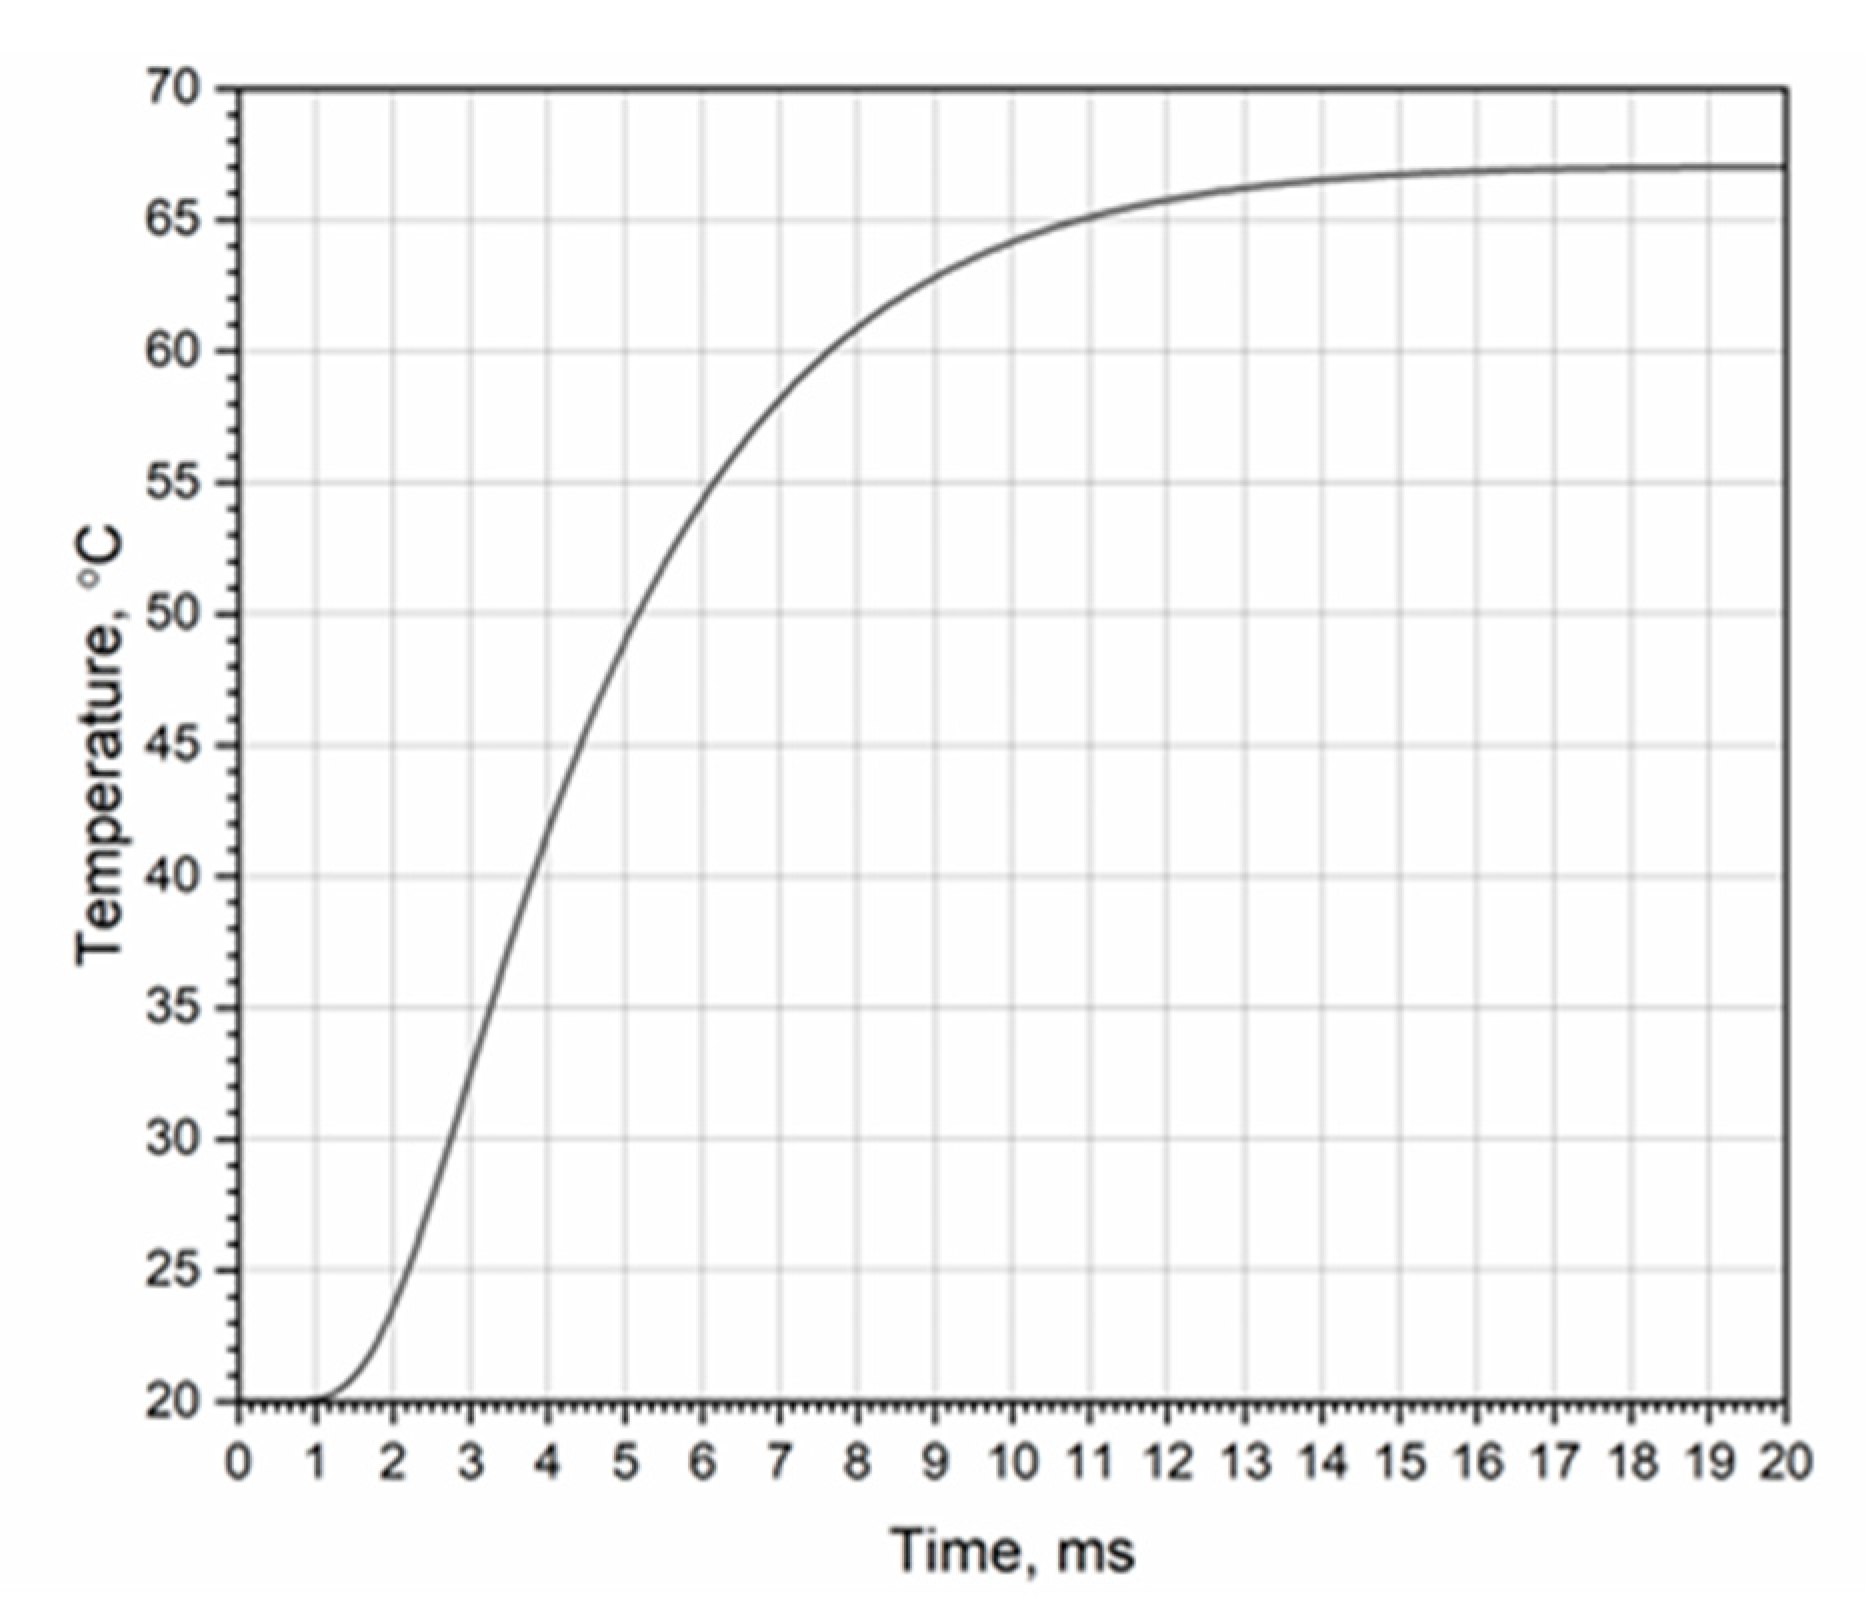
Validation of the calculation results was carried out in the form of a comparison of the temperature increase after six heat impulses in relation to the RT on the outer surface of the tube in zone 26 with analogous results for such a tube in the same zone [9]. The course of the temperature of the outer surface of the tube in zone 26 obtained in the validation of the model is shown in Figure 10.

3. Numerical Simulation and Results Analysis

3.1. Temperature Distribution in the Tube for a Single Heat Impulse

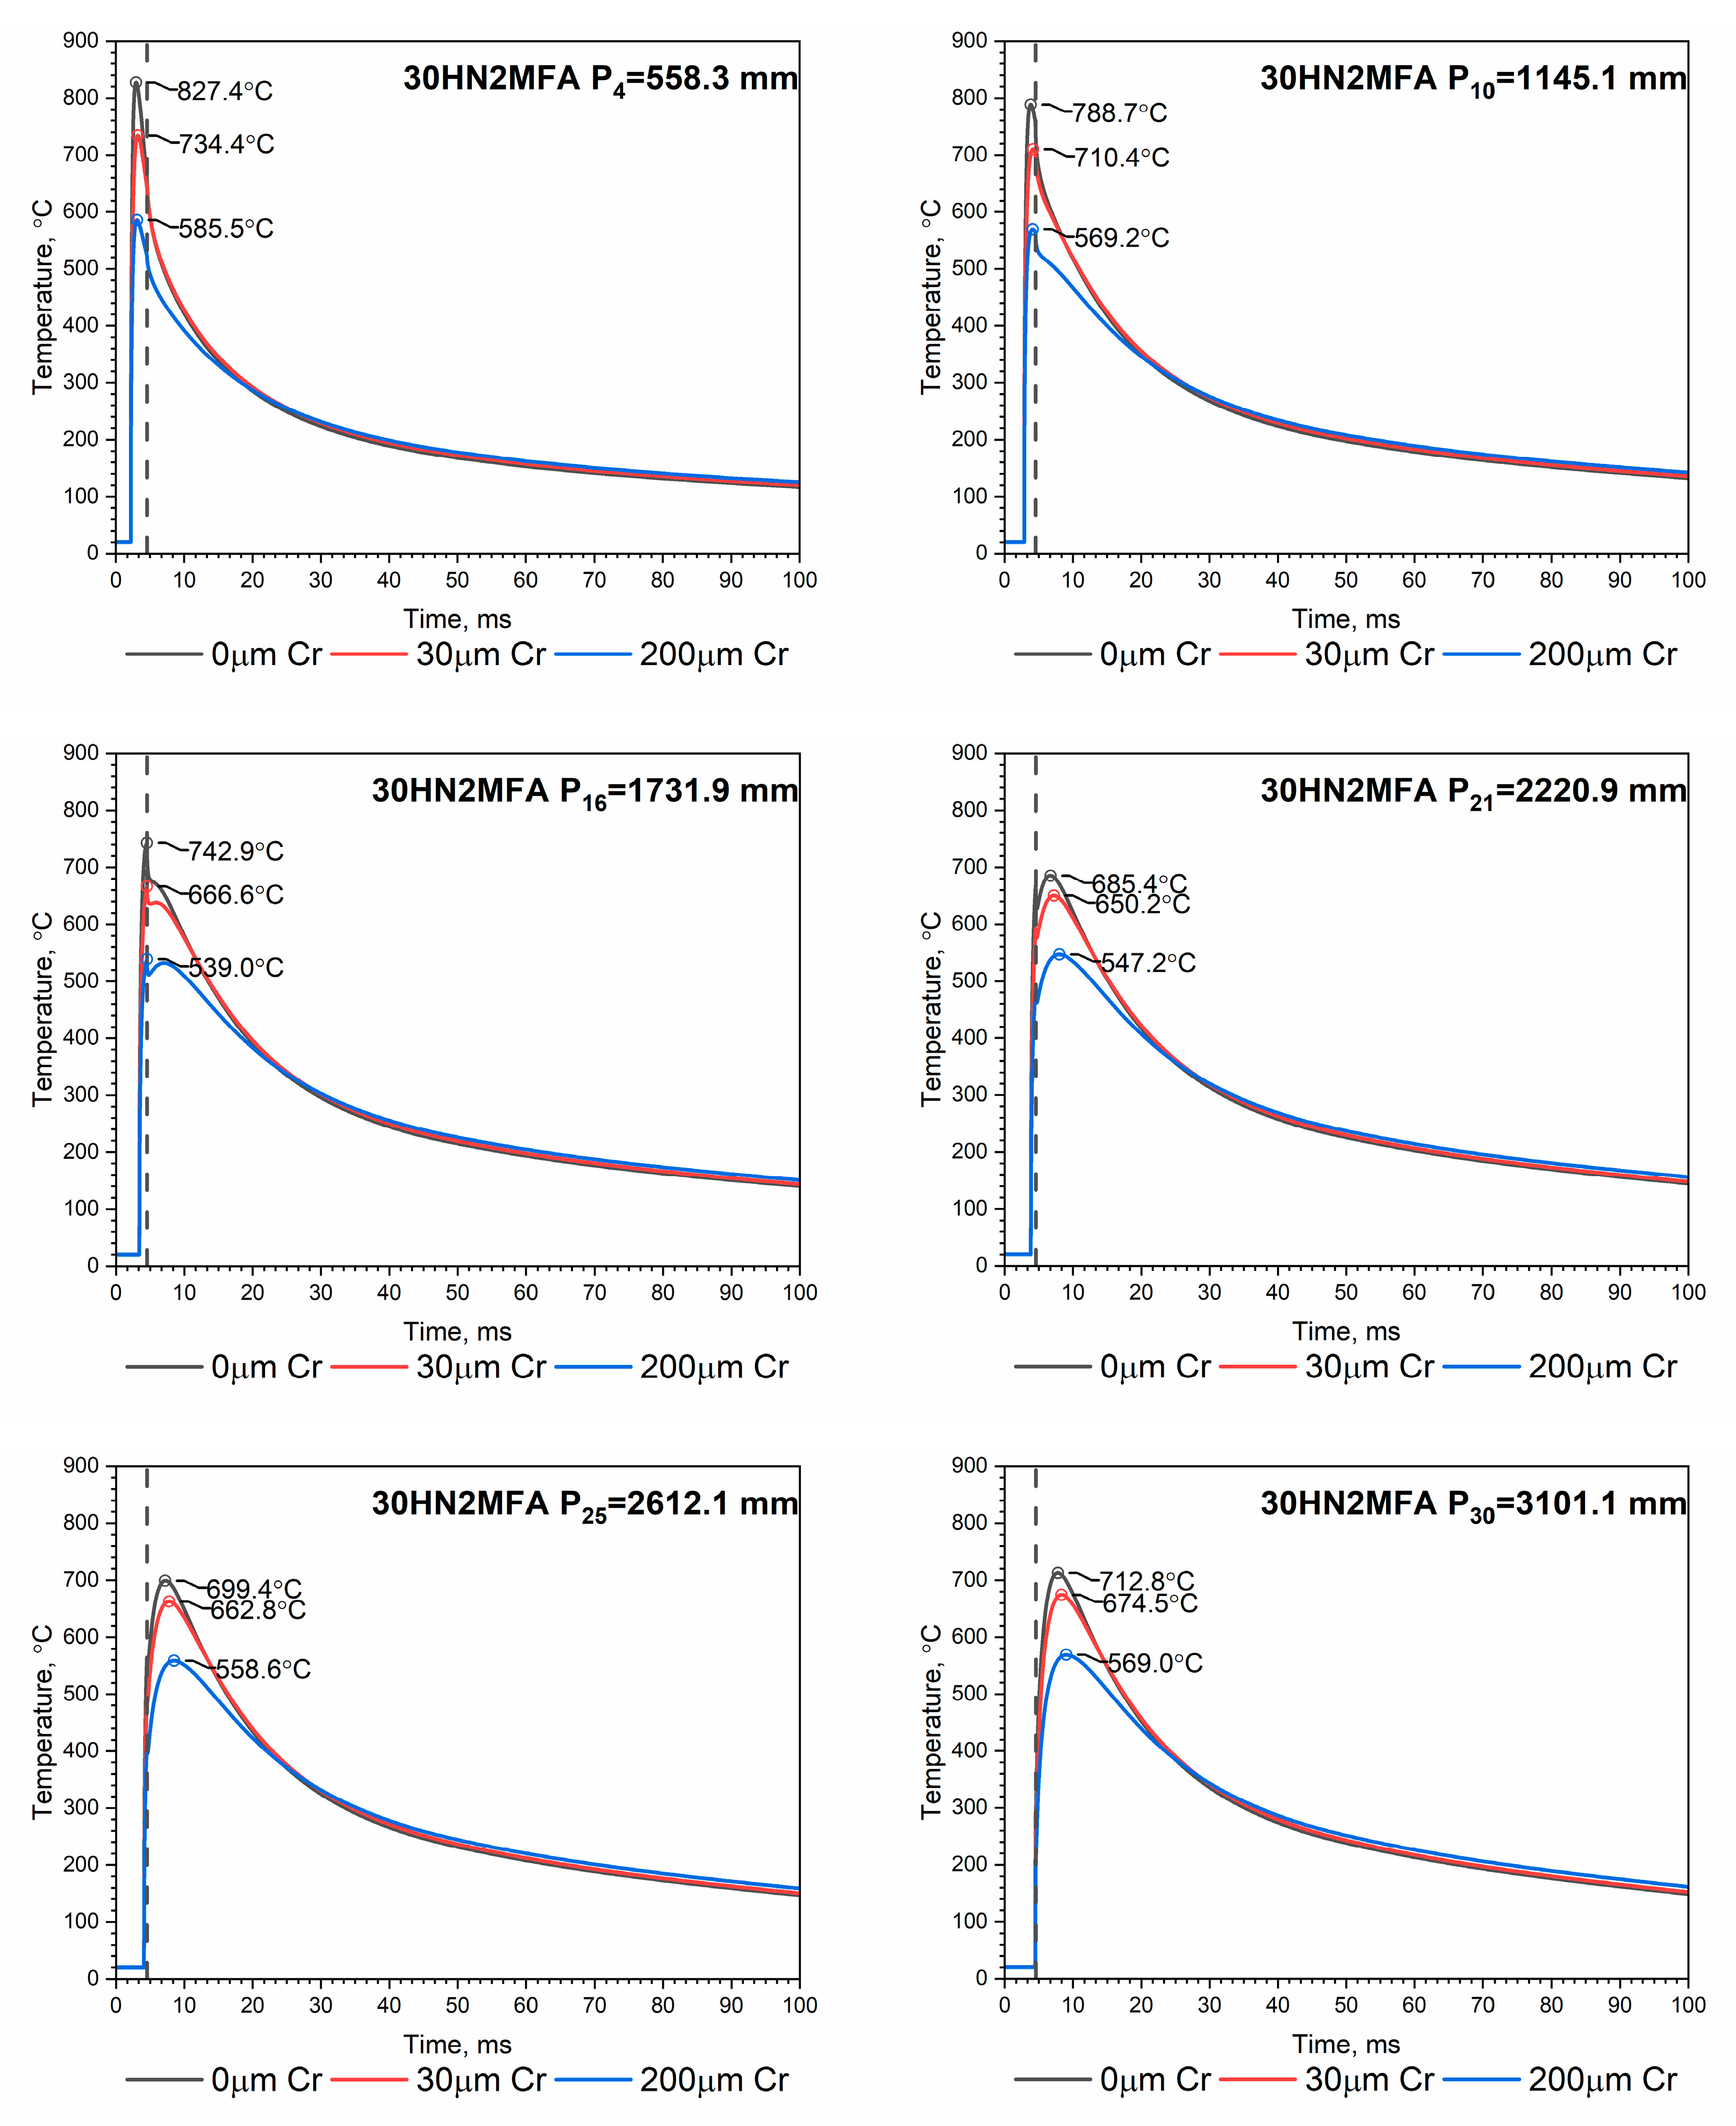
The temperature distributions T i t , r i n , z of the inner surface of the tube in six selected zones for different thicknesses of the chromium layer are shown in Figure 11 for a single heat impulse. In each zone, the heat transfer coefficient h i ( t ) is different—Figure 3. The dashed line on each figure indicates the time the piston left the tube (t = 4.54 ms).
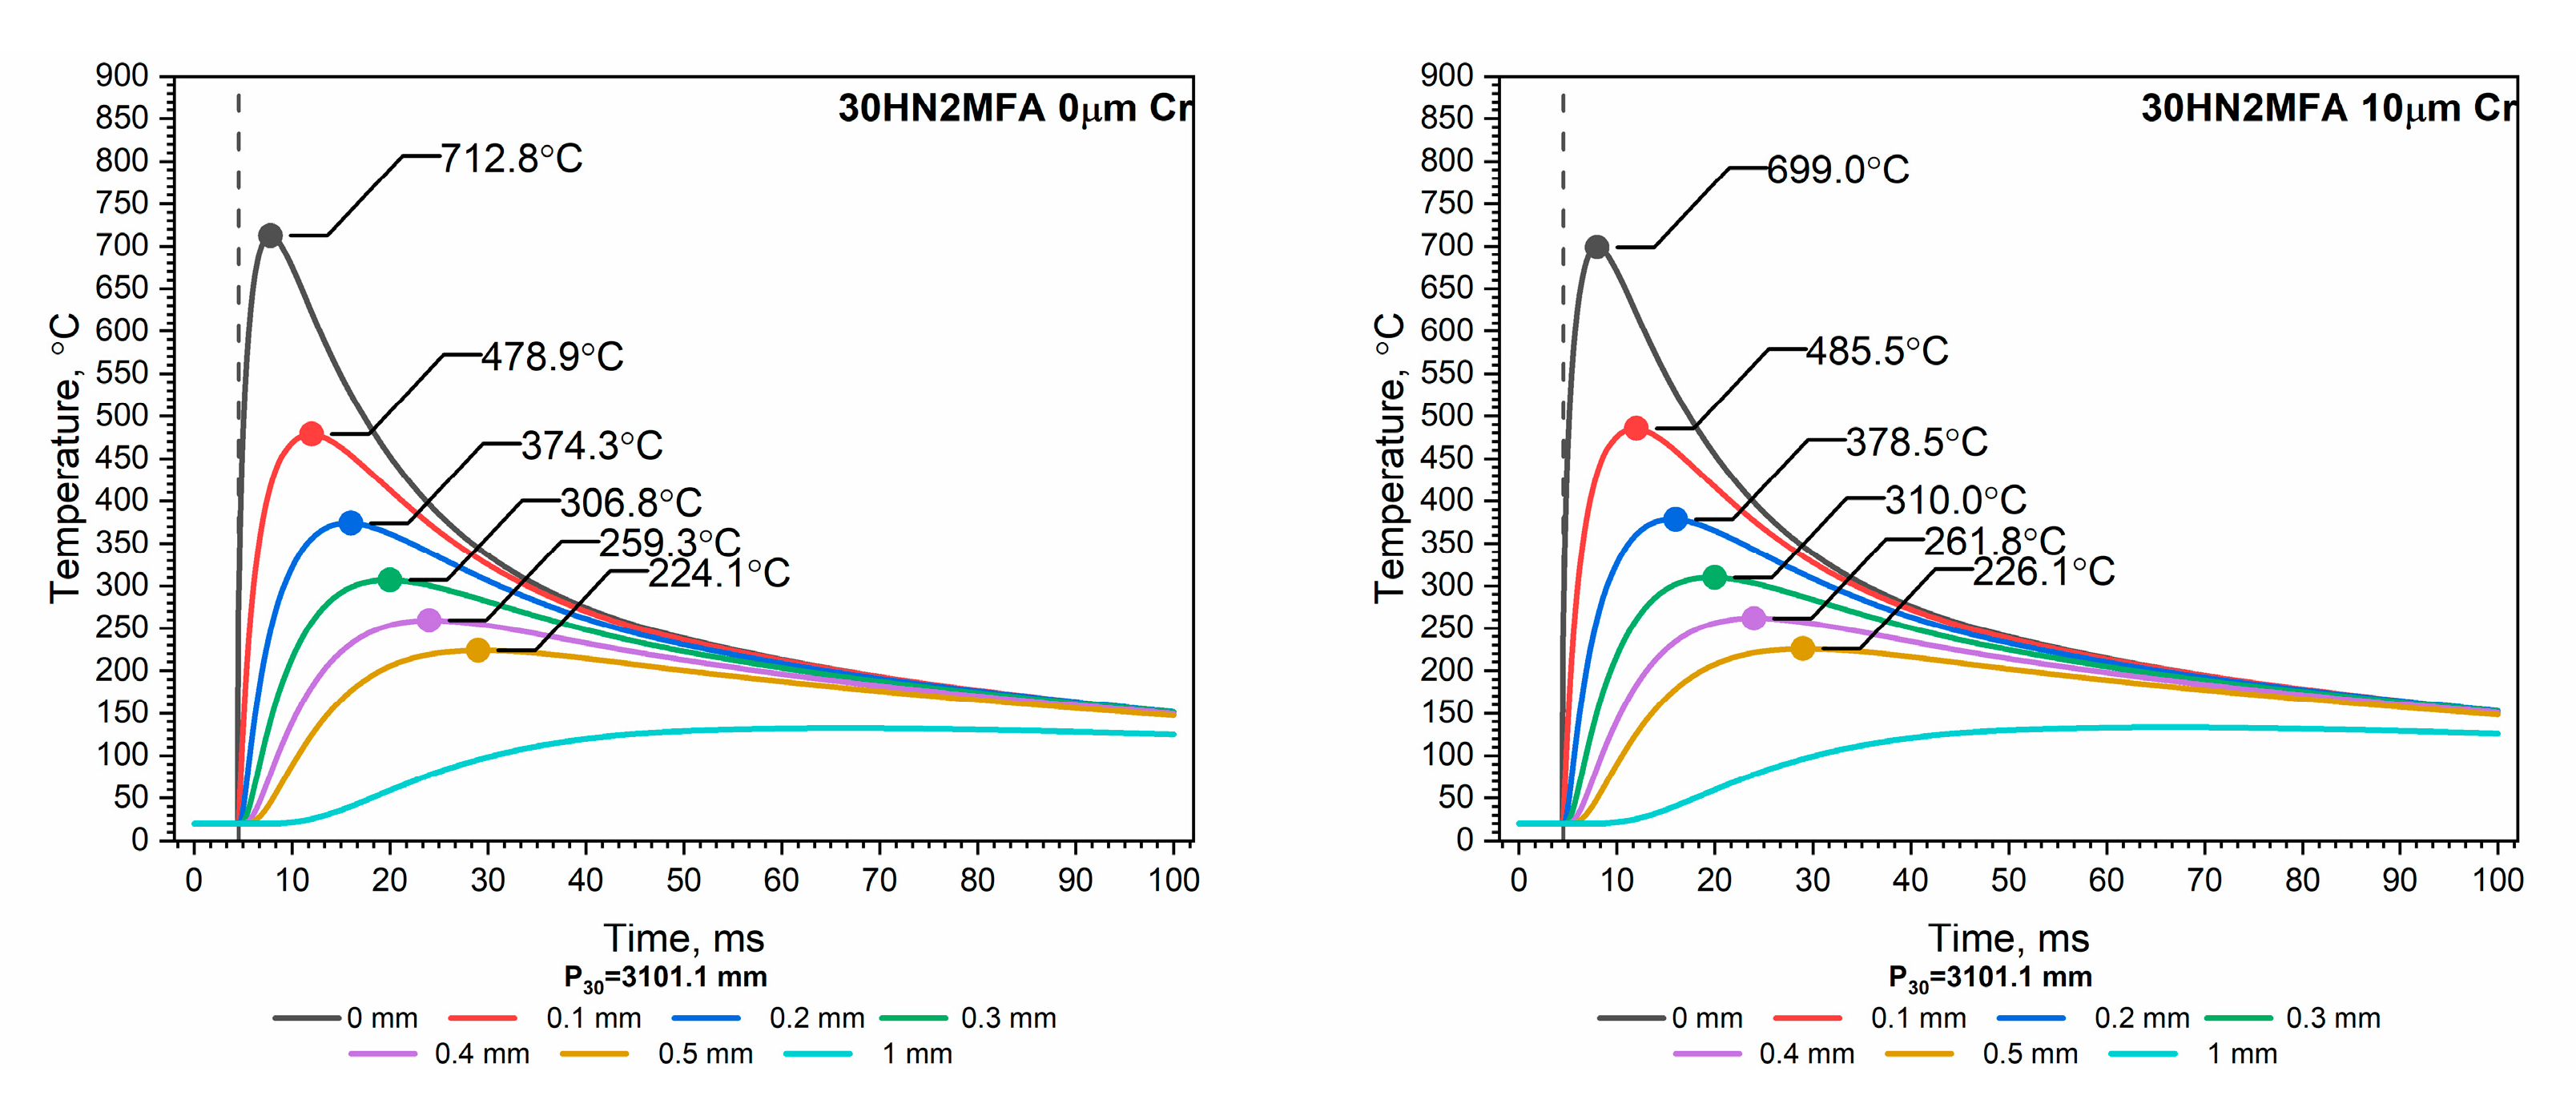
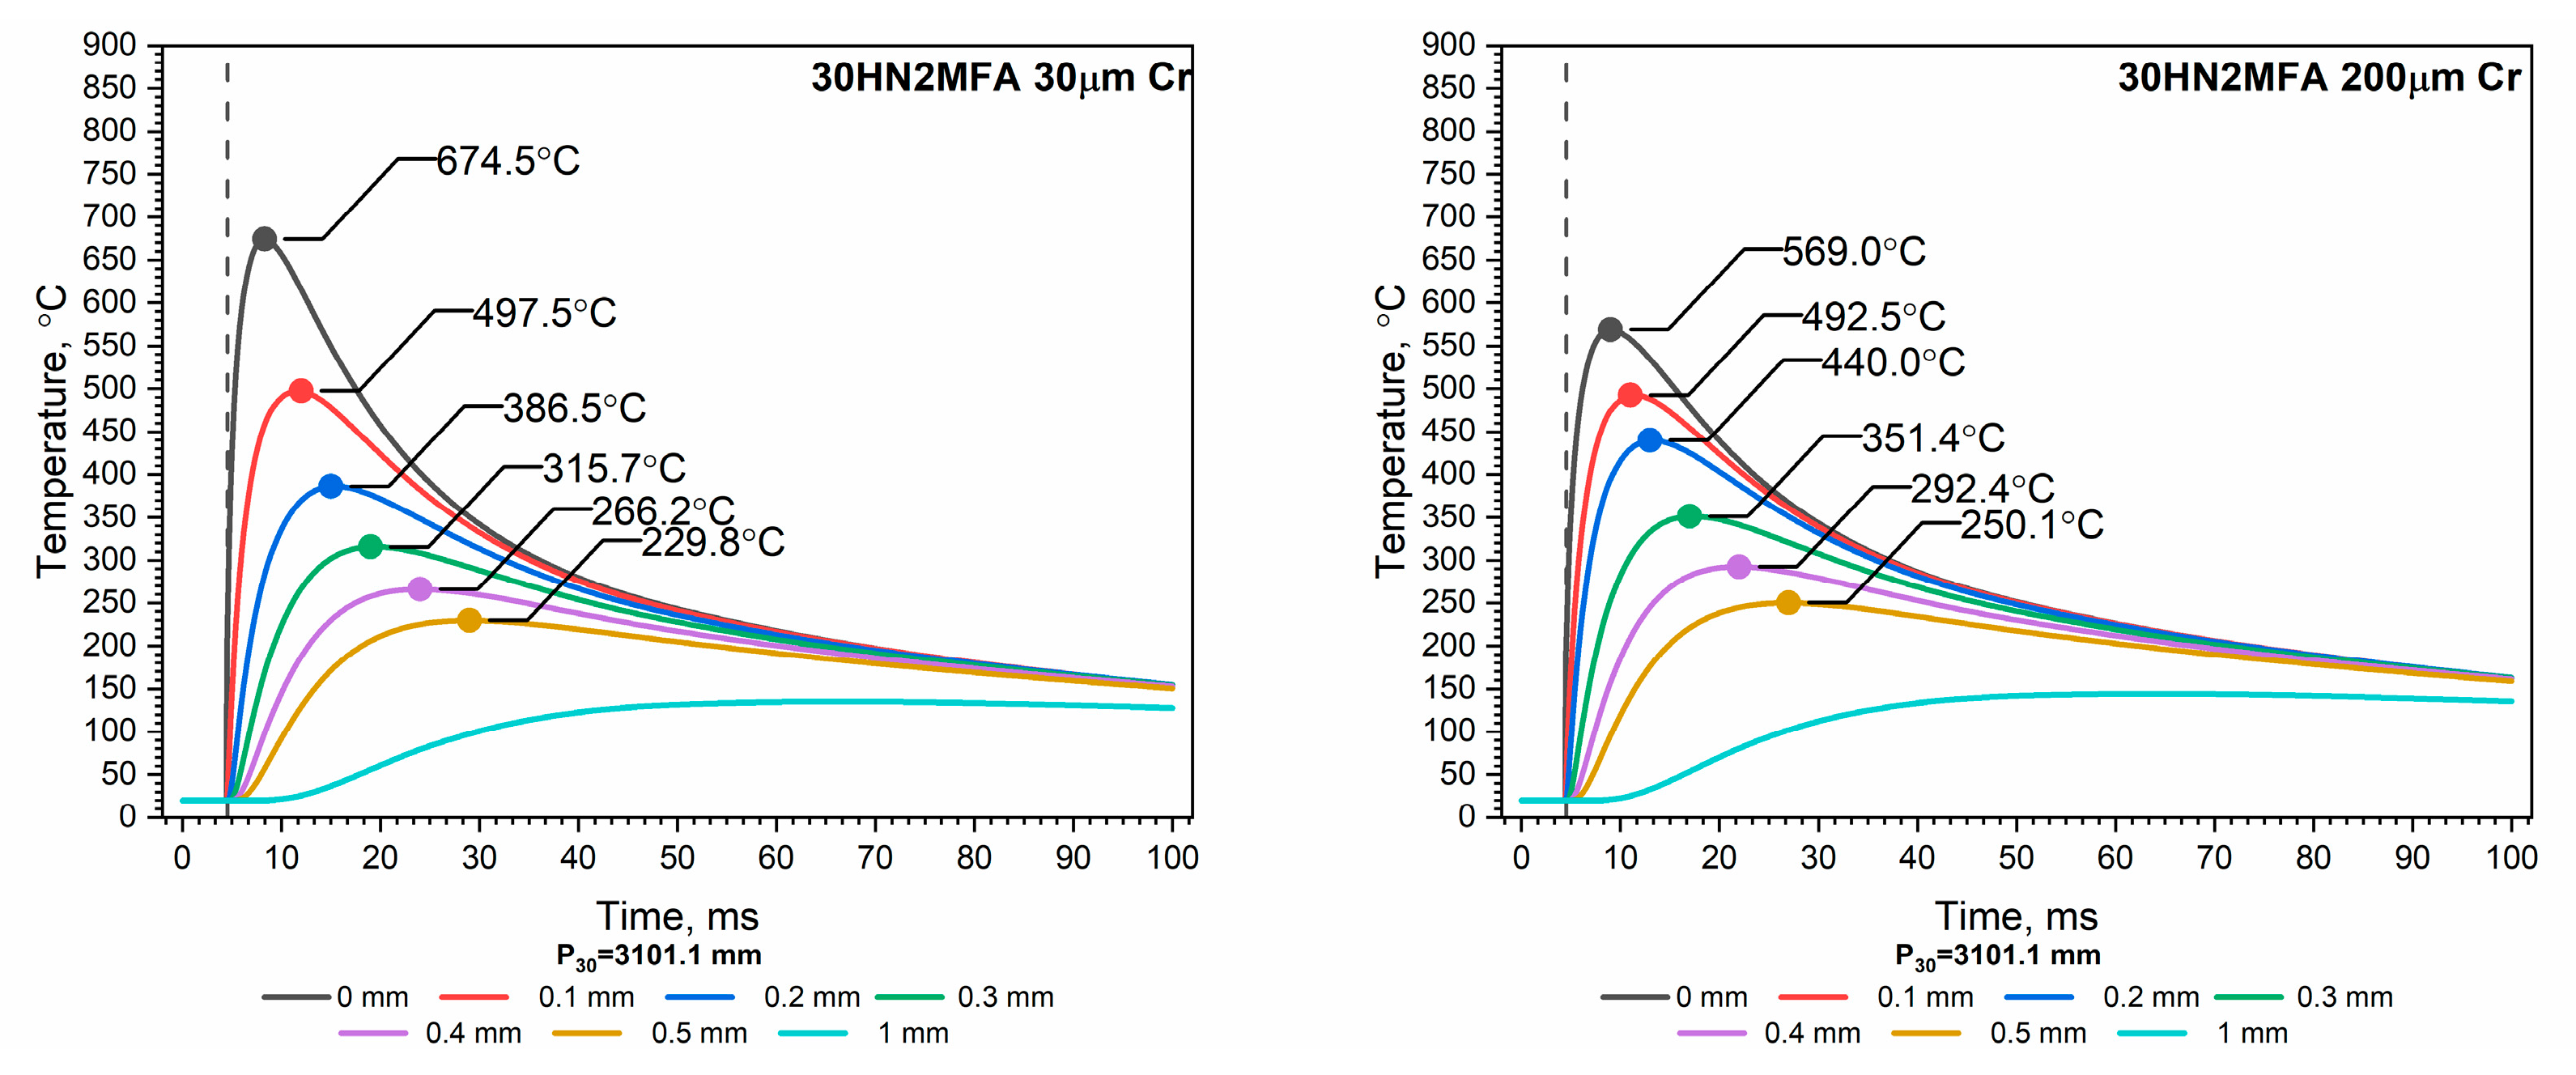
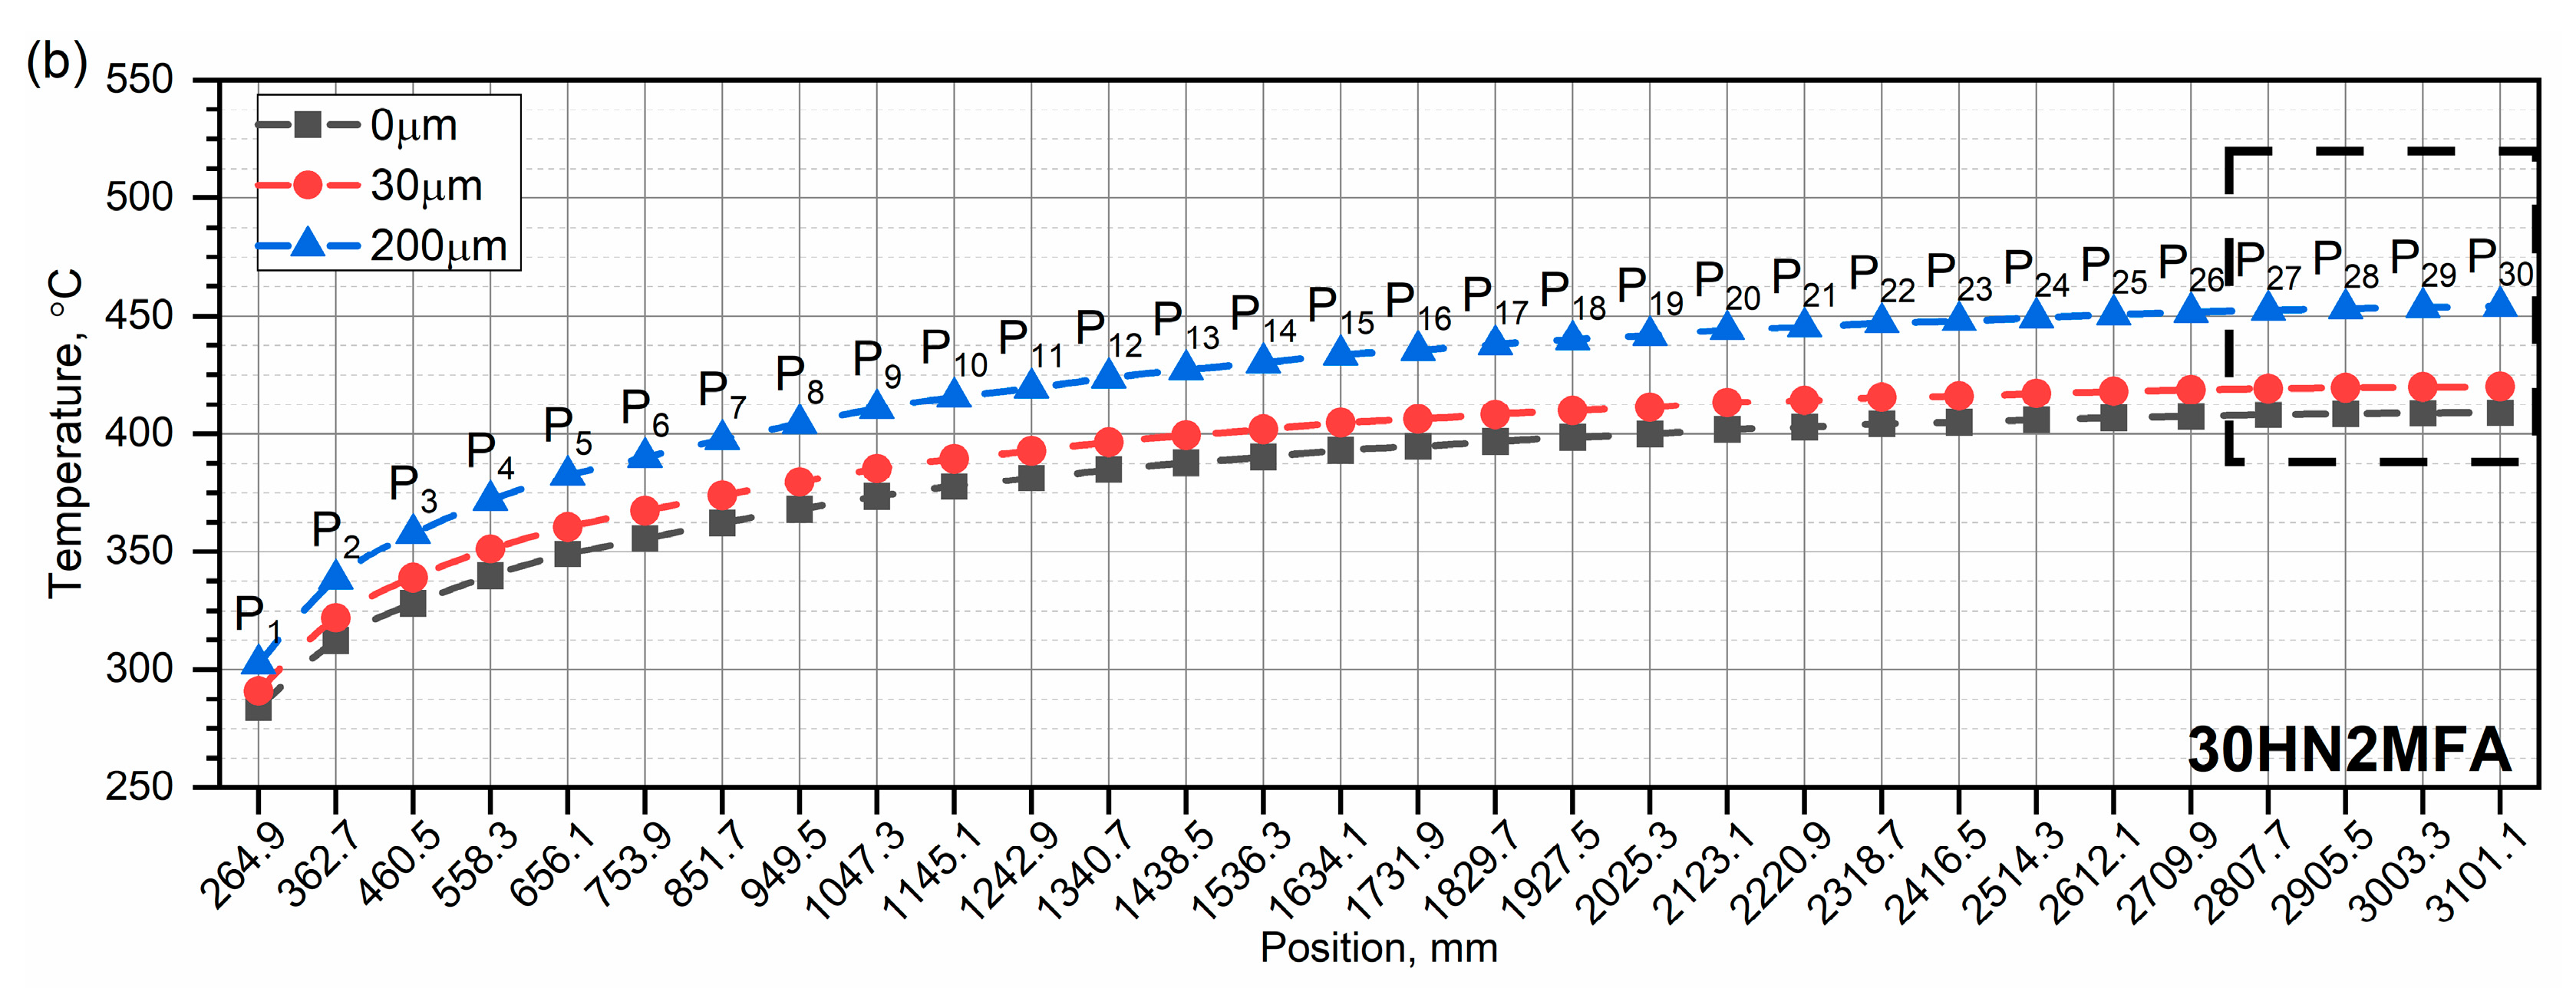
The highest temperature occurs in the S4 zone. As the thickness of the chromium layer increases, the highest temperature in each zone drops. The fluctuation of the temperature T i t , r i n , z of the inner surface in zones S10, S16 and S21 (Figure 11) is caused by a sharp decrease in the heat transfer coefficient h i ( t ) at the moment the piston leaves the tube—Figure 3. Temperature distributions along the tube length for a single heat impulse are shown in Figure 12. The lowest peak base temperature is read after each heat impulse, i.e., t = 100 ms for the first impulse, 200 ms for the second impulse, etc.
It can be assumed that the lowest temperature of the inner surface of the tube is actually the temperature to a depth of approximately 0.5 mm below its surface—Figure 13. Already after the first heat impulse, we can observe that the wall reaches the highest temperature in the last zone, i.e., S30—Figure 12b. The temperature distributions T i t , r , z along the wall thickness for different thicknesses of the chromium layer for a single heat impulse in the S30 zone are shown in Figure 13.
As the thickness of the chrome layer increases, the highest peak temperature drops, while the temperature under the inner surface of the wall increases—Figure 13. The highest peak temperature and the lowest peak base temperature for different chromium layer thicknesses at the zone S30 are summarized in Table 3.

3.2. Temperature Distribution in the Tube for a Series of Seven Heat Impulses

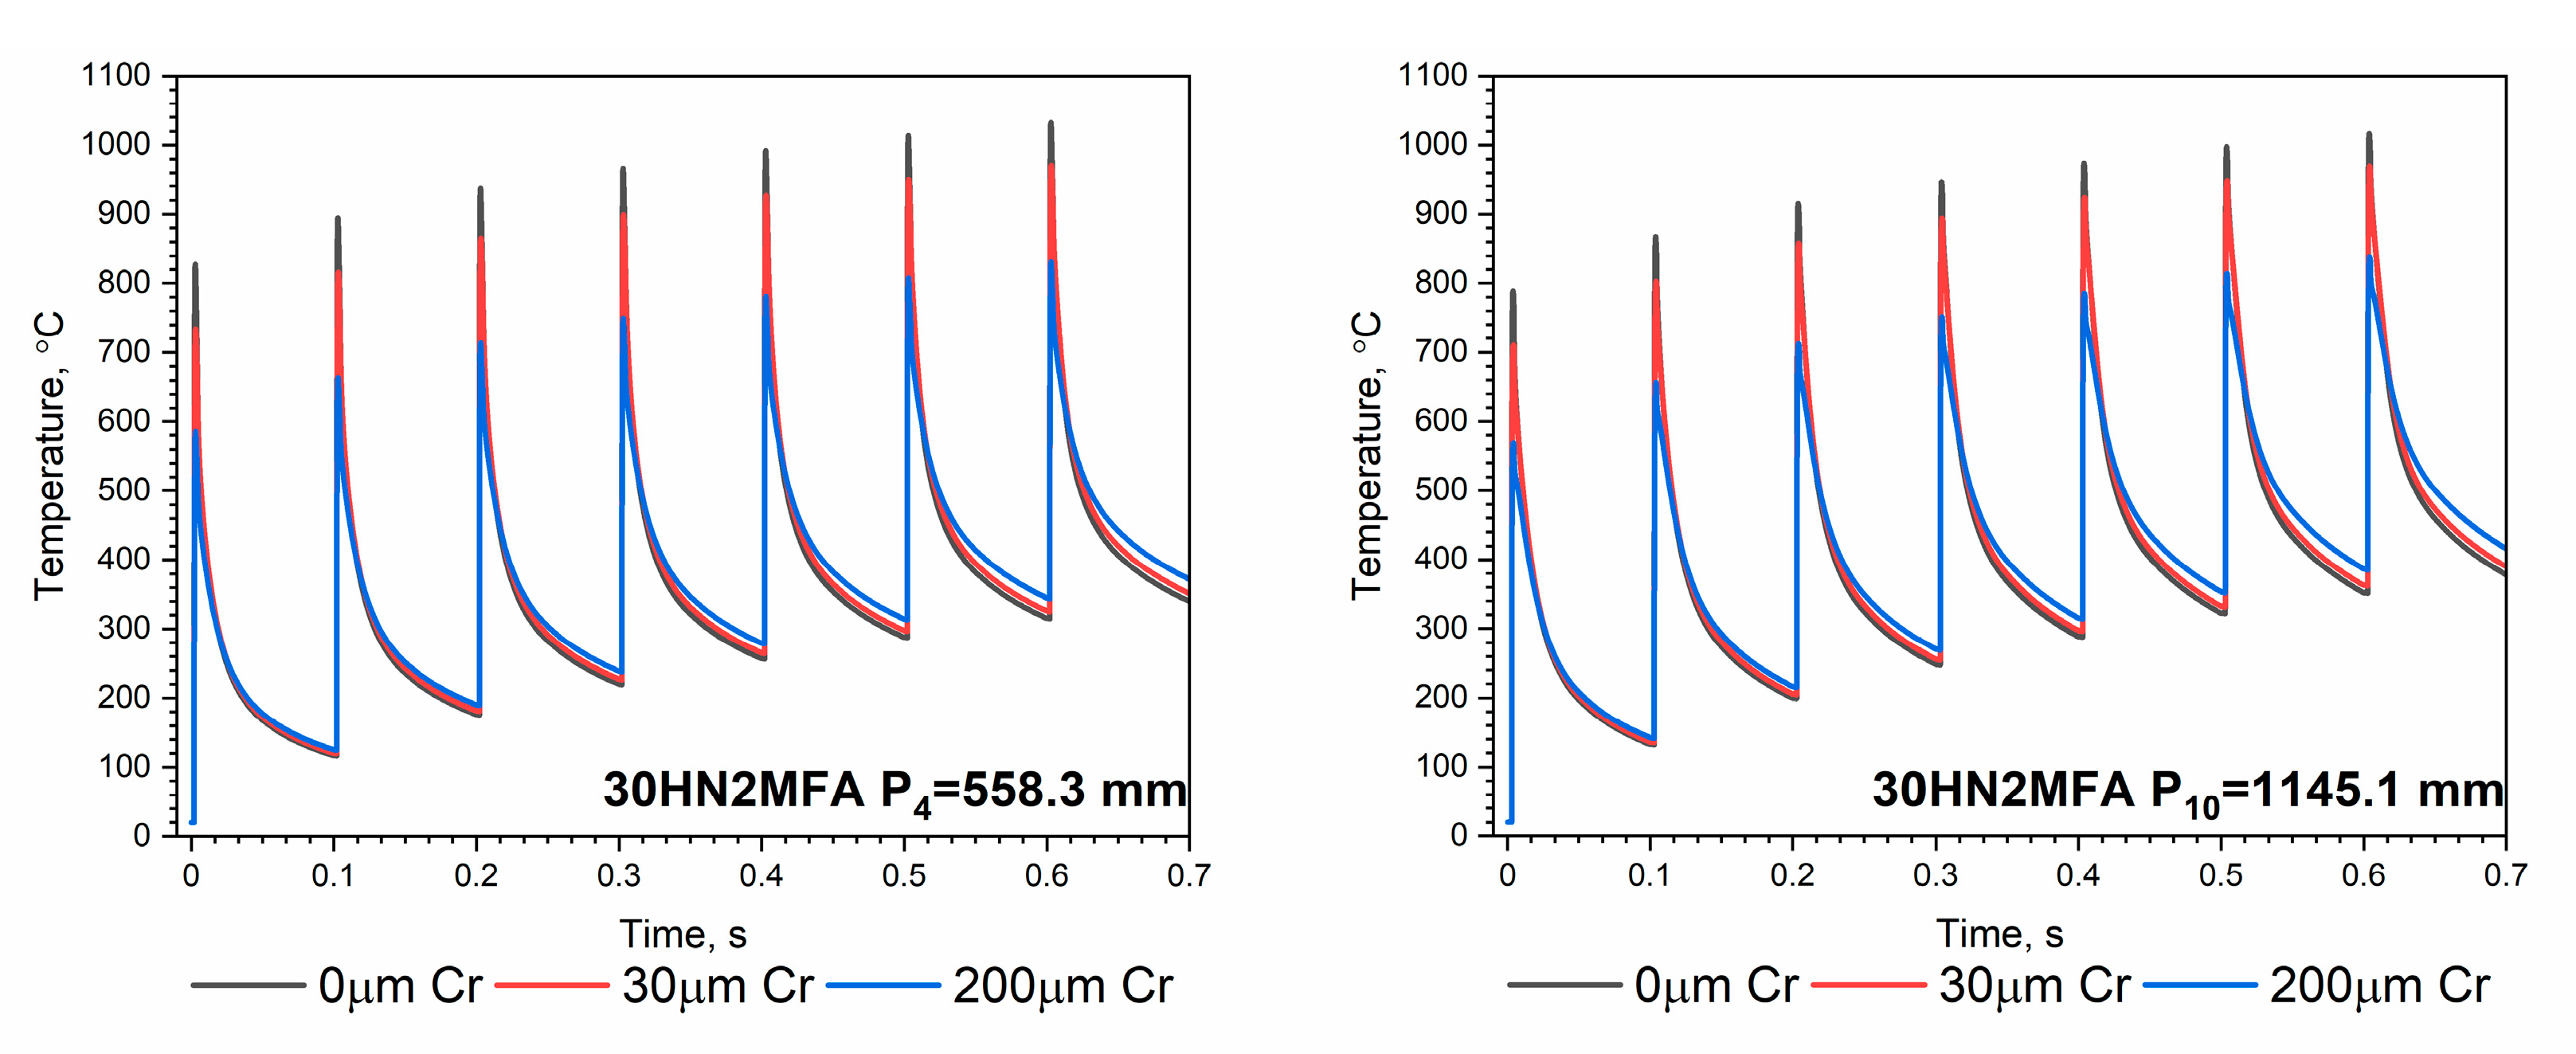
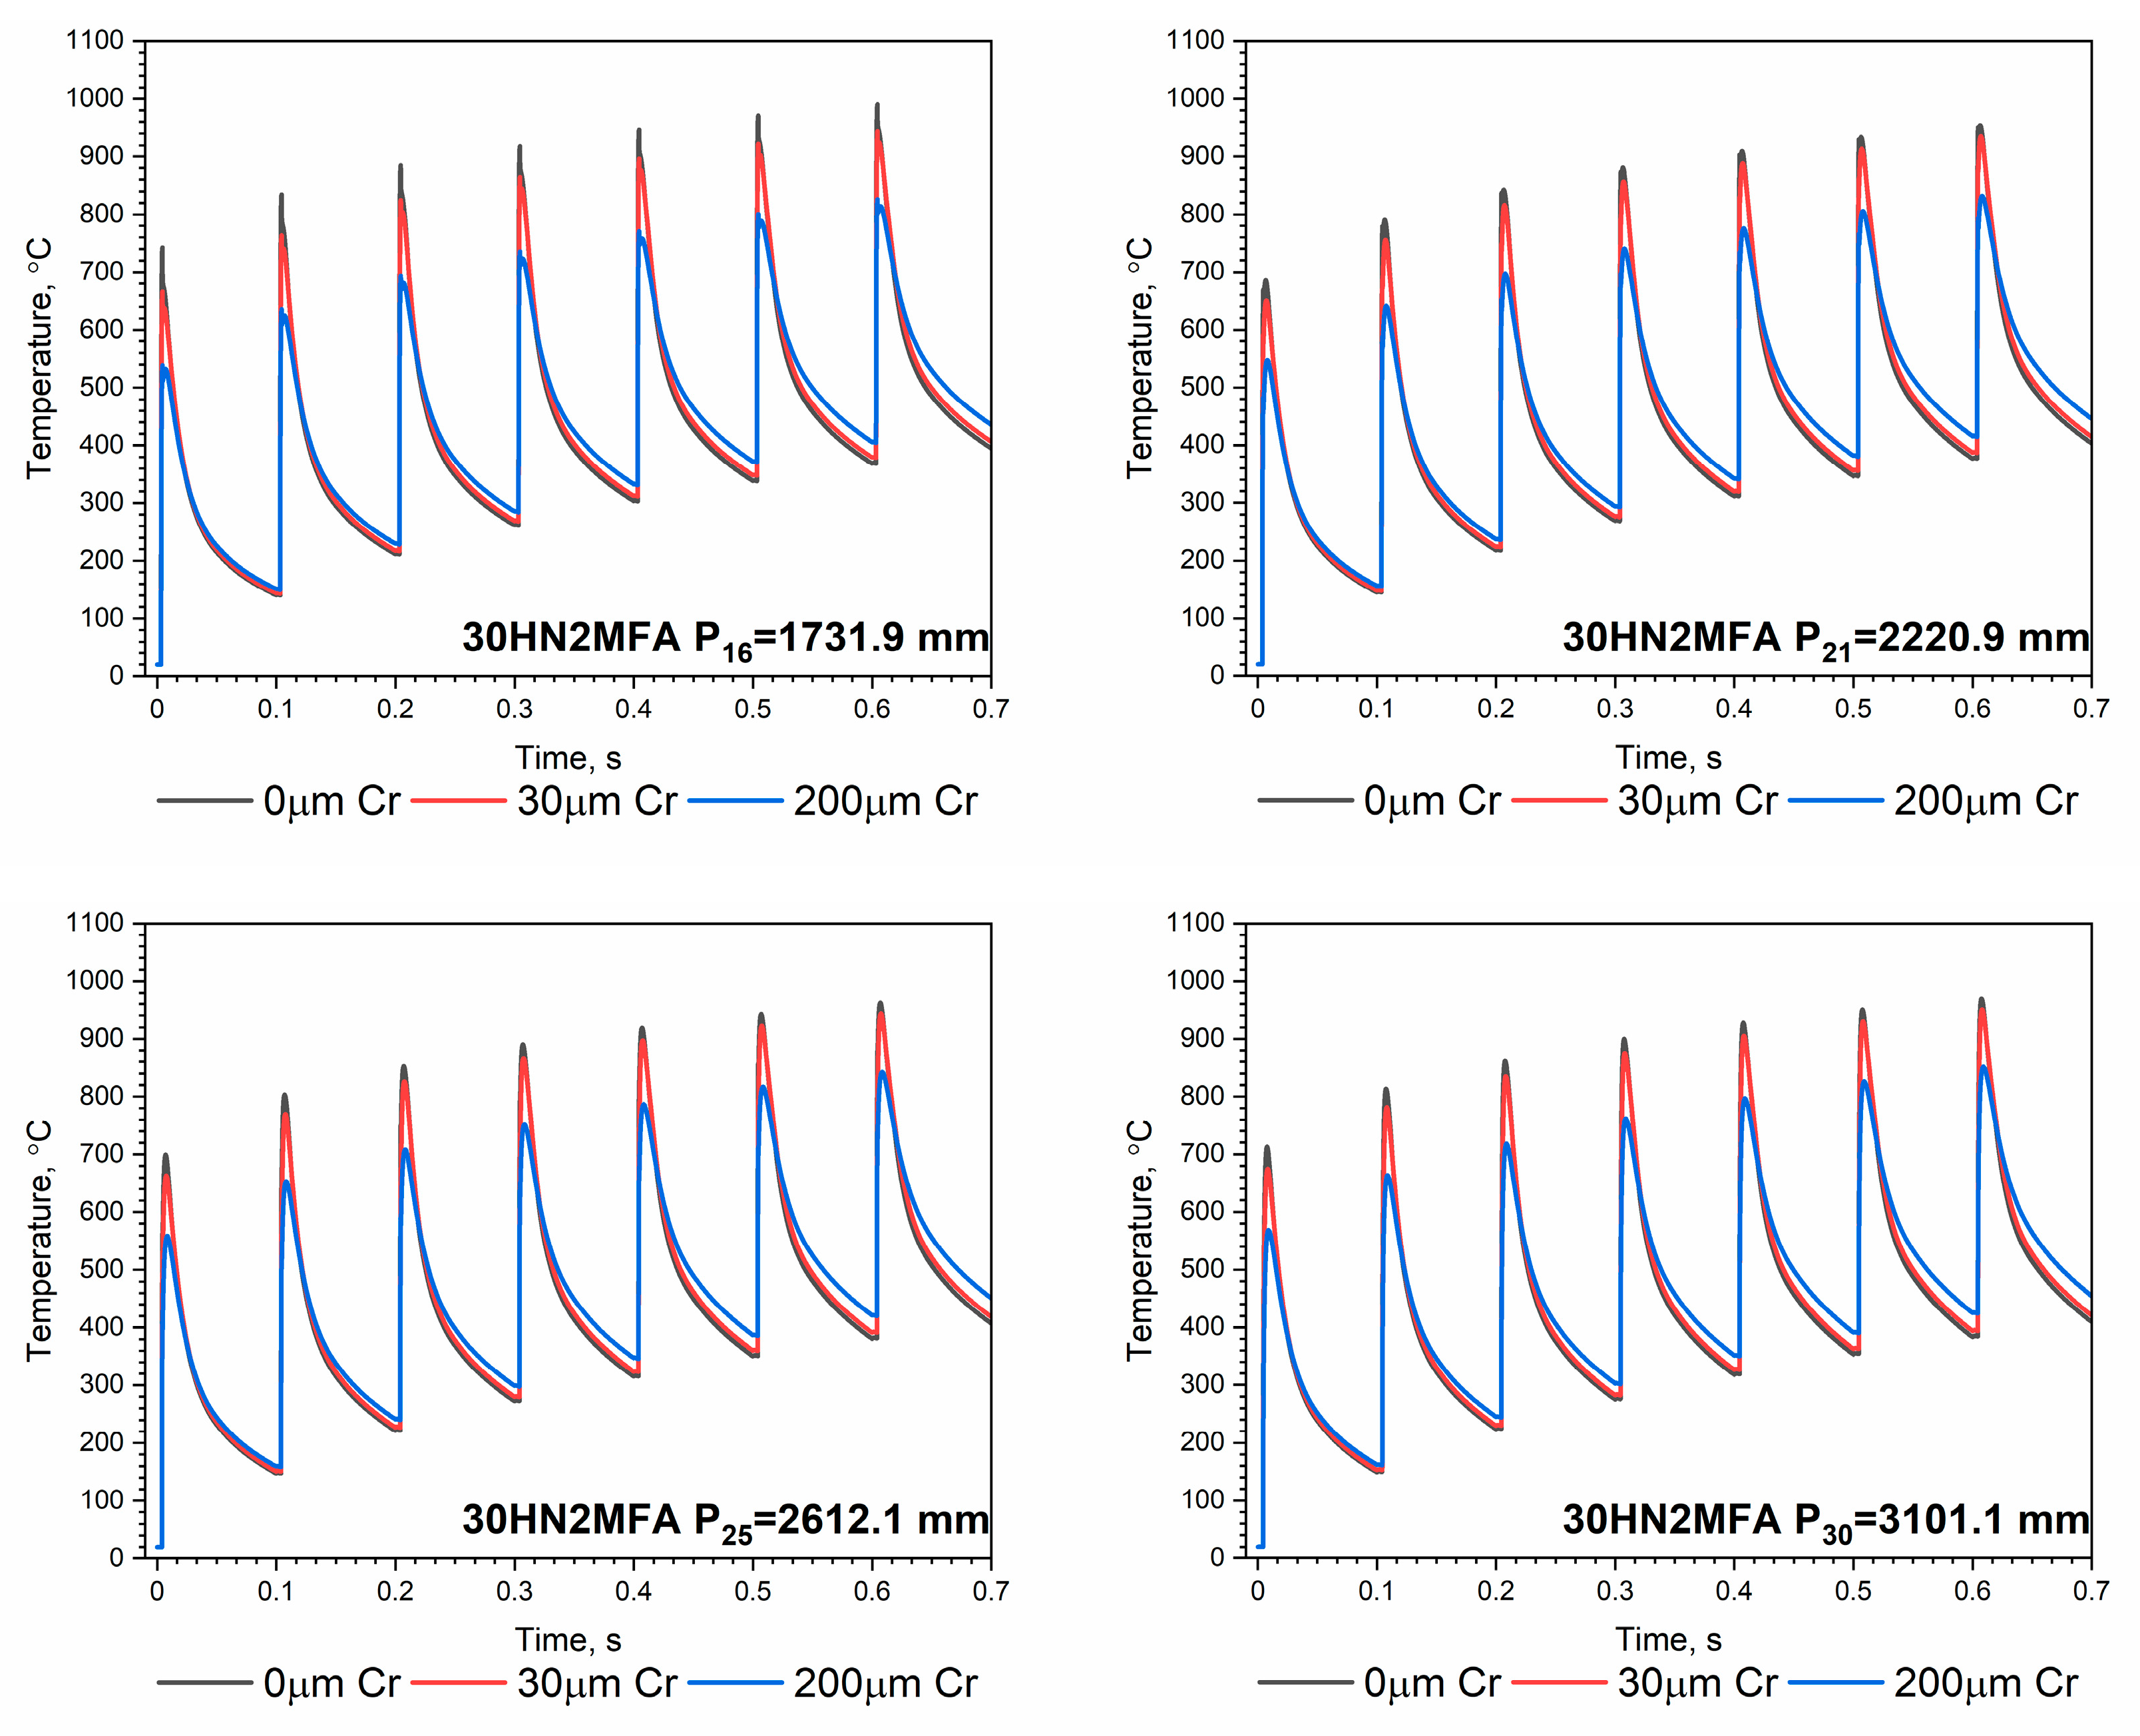
As the wall temperature increases, the heat flux density on the inner surface of the tube changes as a function of time for the first and subsequent heat impulses. The temperature distribution T i t , r i n , z of the tube’s inner surface for different chromium layer thicknesses at the six chosen zones, S4, S10, S16, S21, S25 and S30, for the series of seven heat impulses is shown in Figure 14.
As the thickness of the chromium layer increases, the highest peak temperature decreases, while the lowest peak base temperature increases. Such a heat transfer mechanism is related to the high thermal conductivity of chromium, which is almost three times greater than that of the 30HN2MFA steel—Figure 5 and Figure 6. With each subsequent heat impulse, the lowest peak base temperature of the chrome-plated inner surface of the tube increases relative to the same temperature of the non-chrome-plated inner surface.

3.3. Temperature Distribution along the Tube Thickness for a Series of Seven Heat Impulses

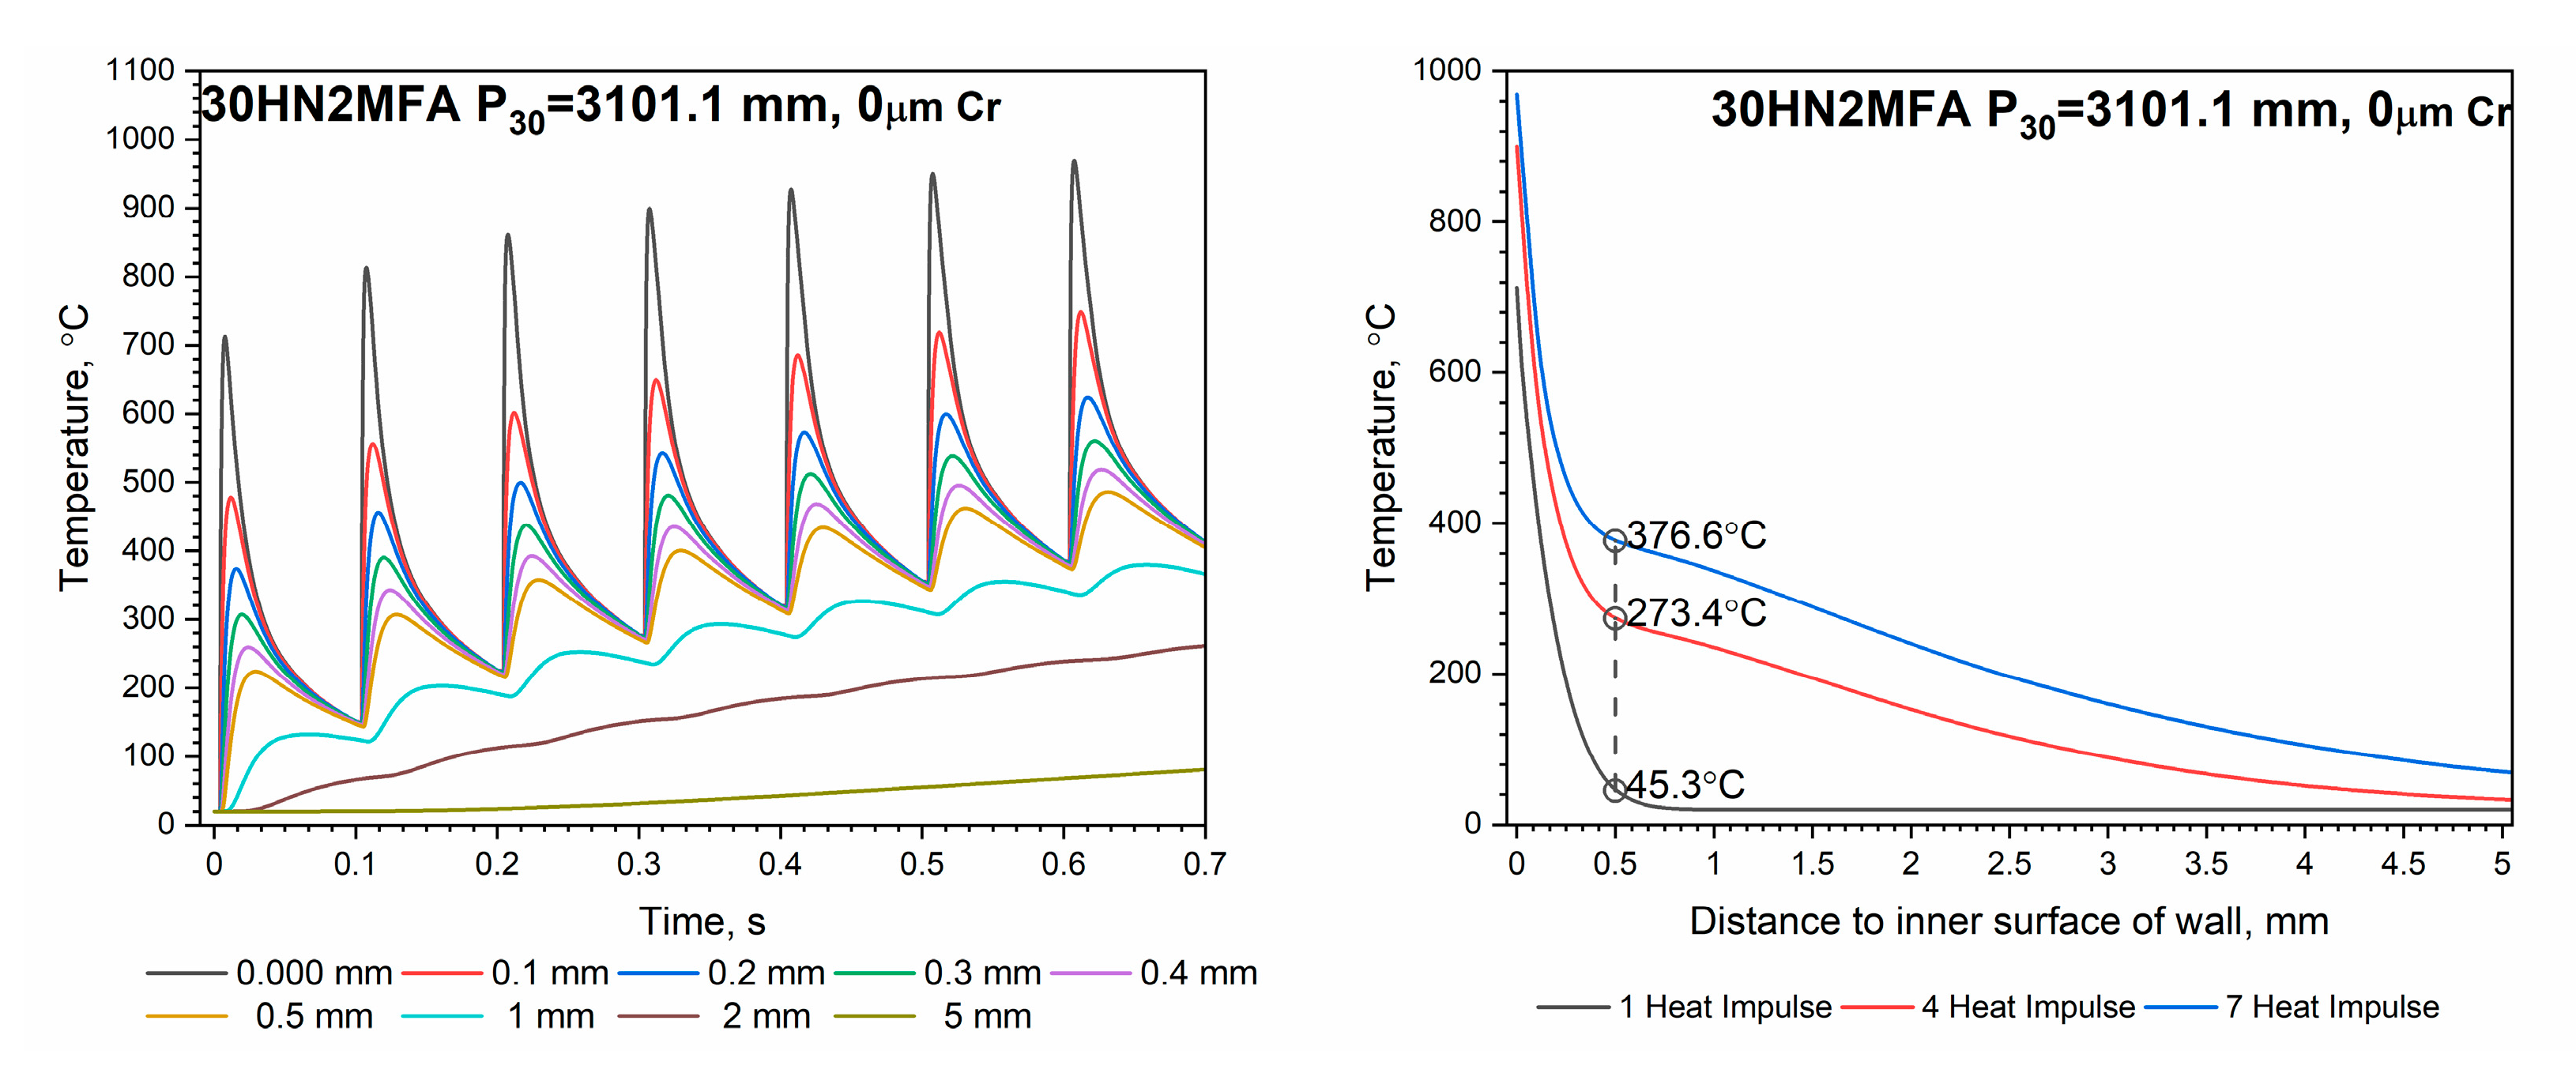
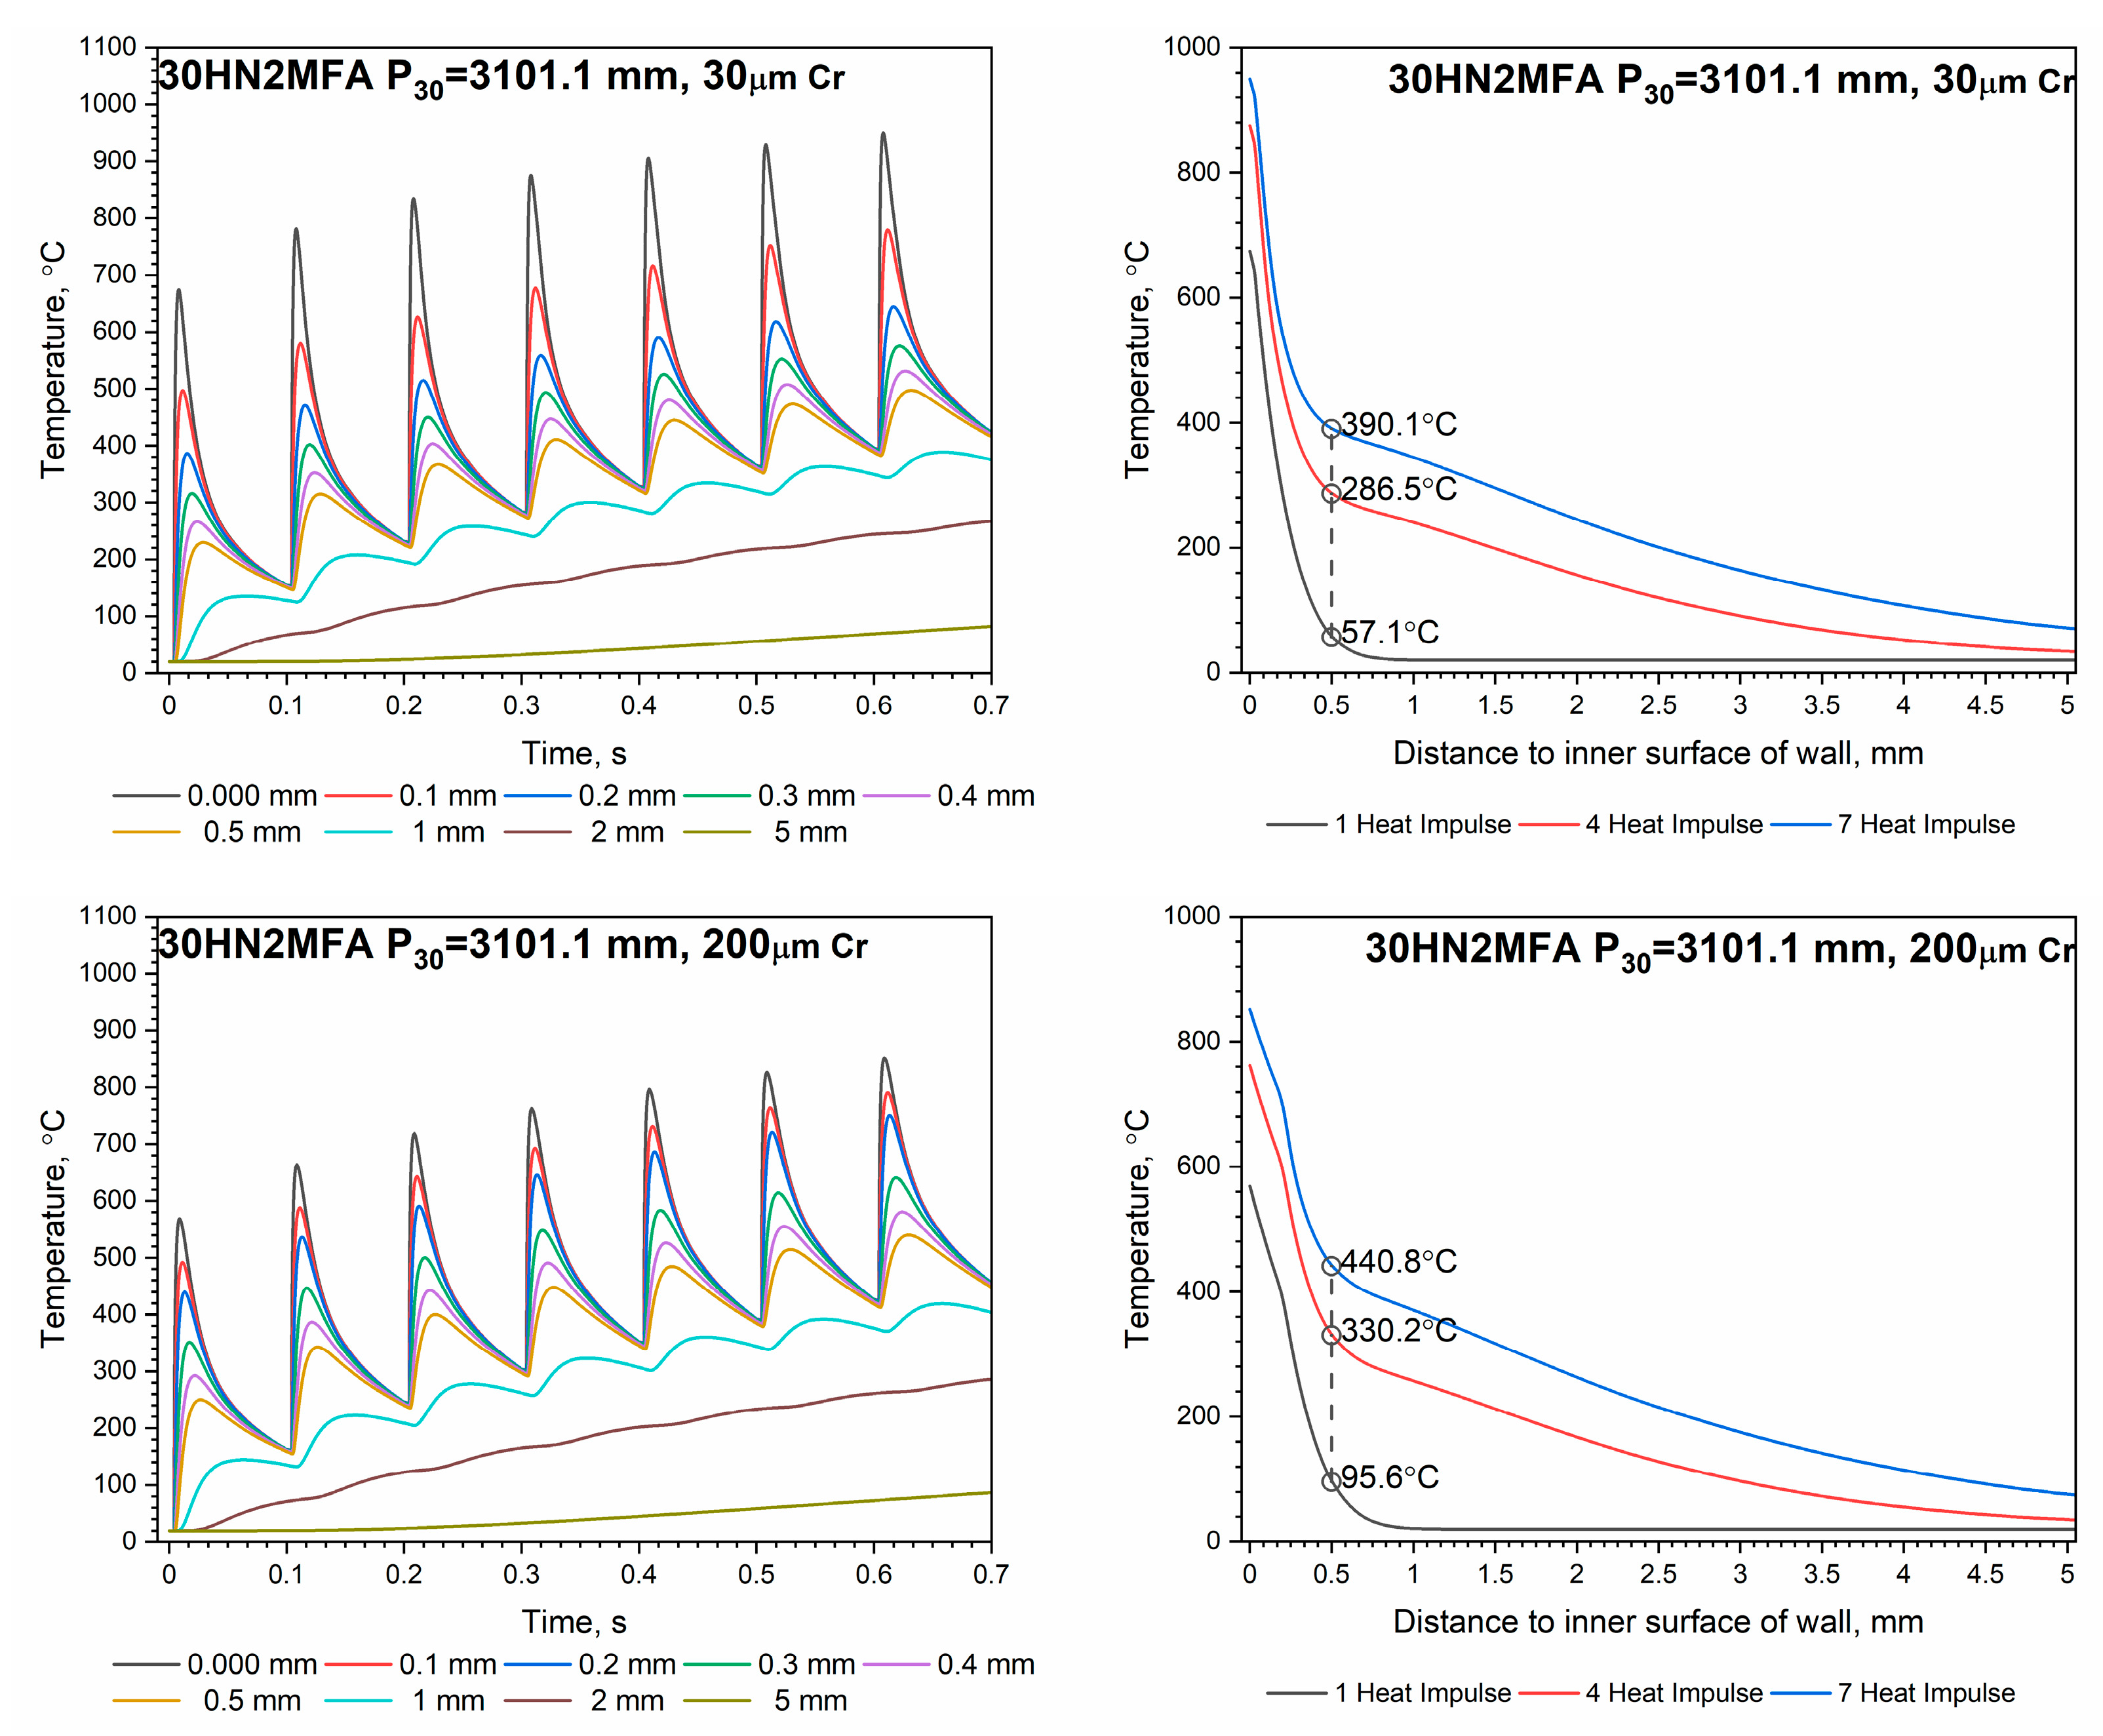
The temperature T i t , r , z along the wall thickness for different chromium layer thicknesses for a sequence of seven heat impulses in zone S30 and after one, four and seven heat impulses in zone S30 are shown in Figure 15.
Temperature distributions T i t , r , z shown in Figure 15 (right side) were visualized at the time of the heat impulse, i.e., when the so-called highest temperature occurs. Already after the first impulse, the temperature of the wall at a depth of 0.5 mm below the inner surface is twice as high for a tube with a 200 µm thick chrome coating compared to a tube without this coating—Figure 15 (right side). After the fourth impulse, the temperature difference stabilizes and amounts to approximately 60 °C and, after the seventh impulse, a little more, i.e., 65 °C.
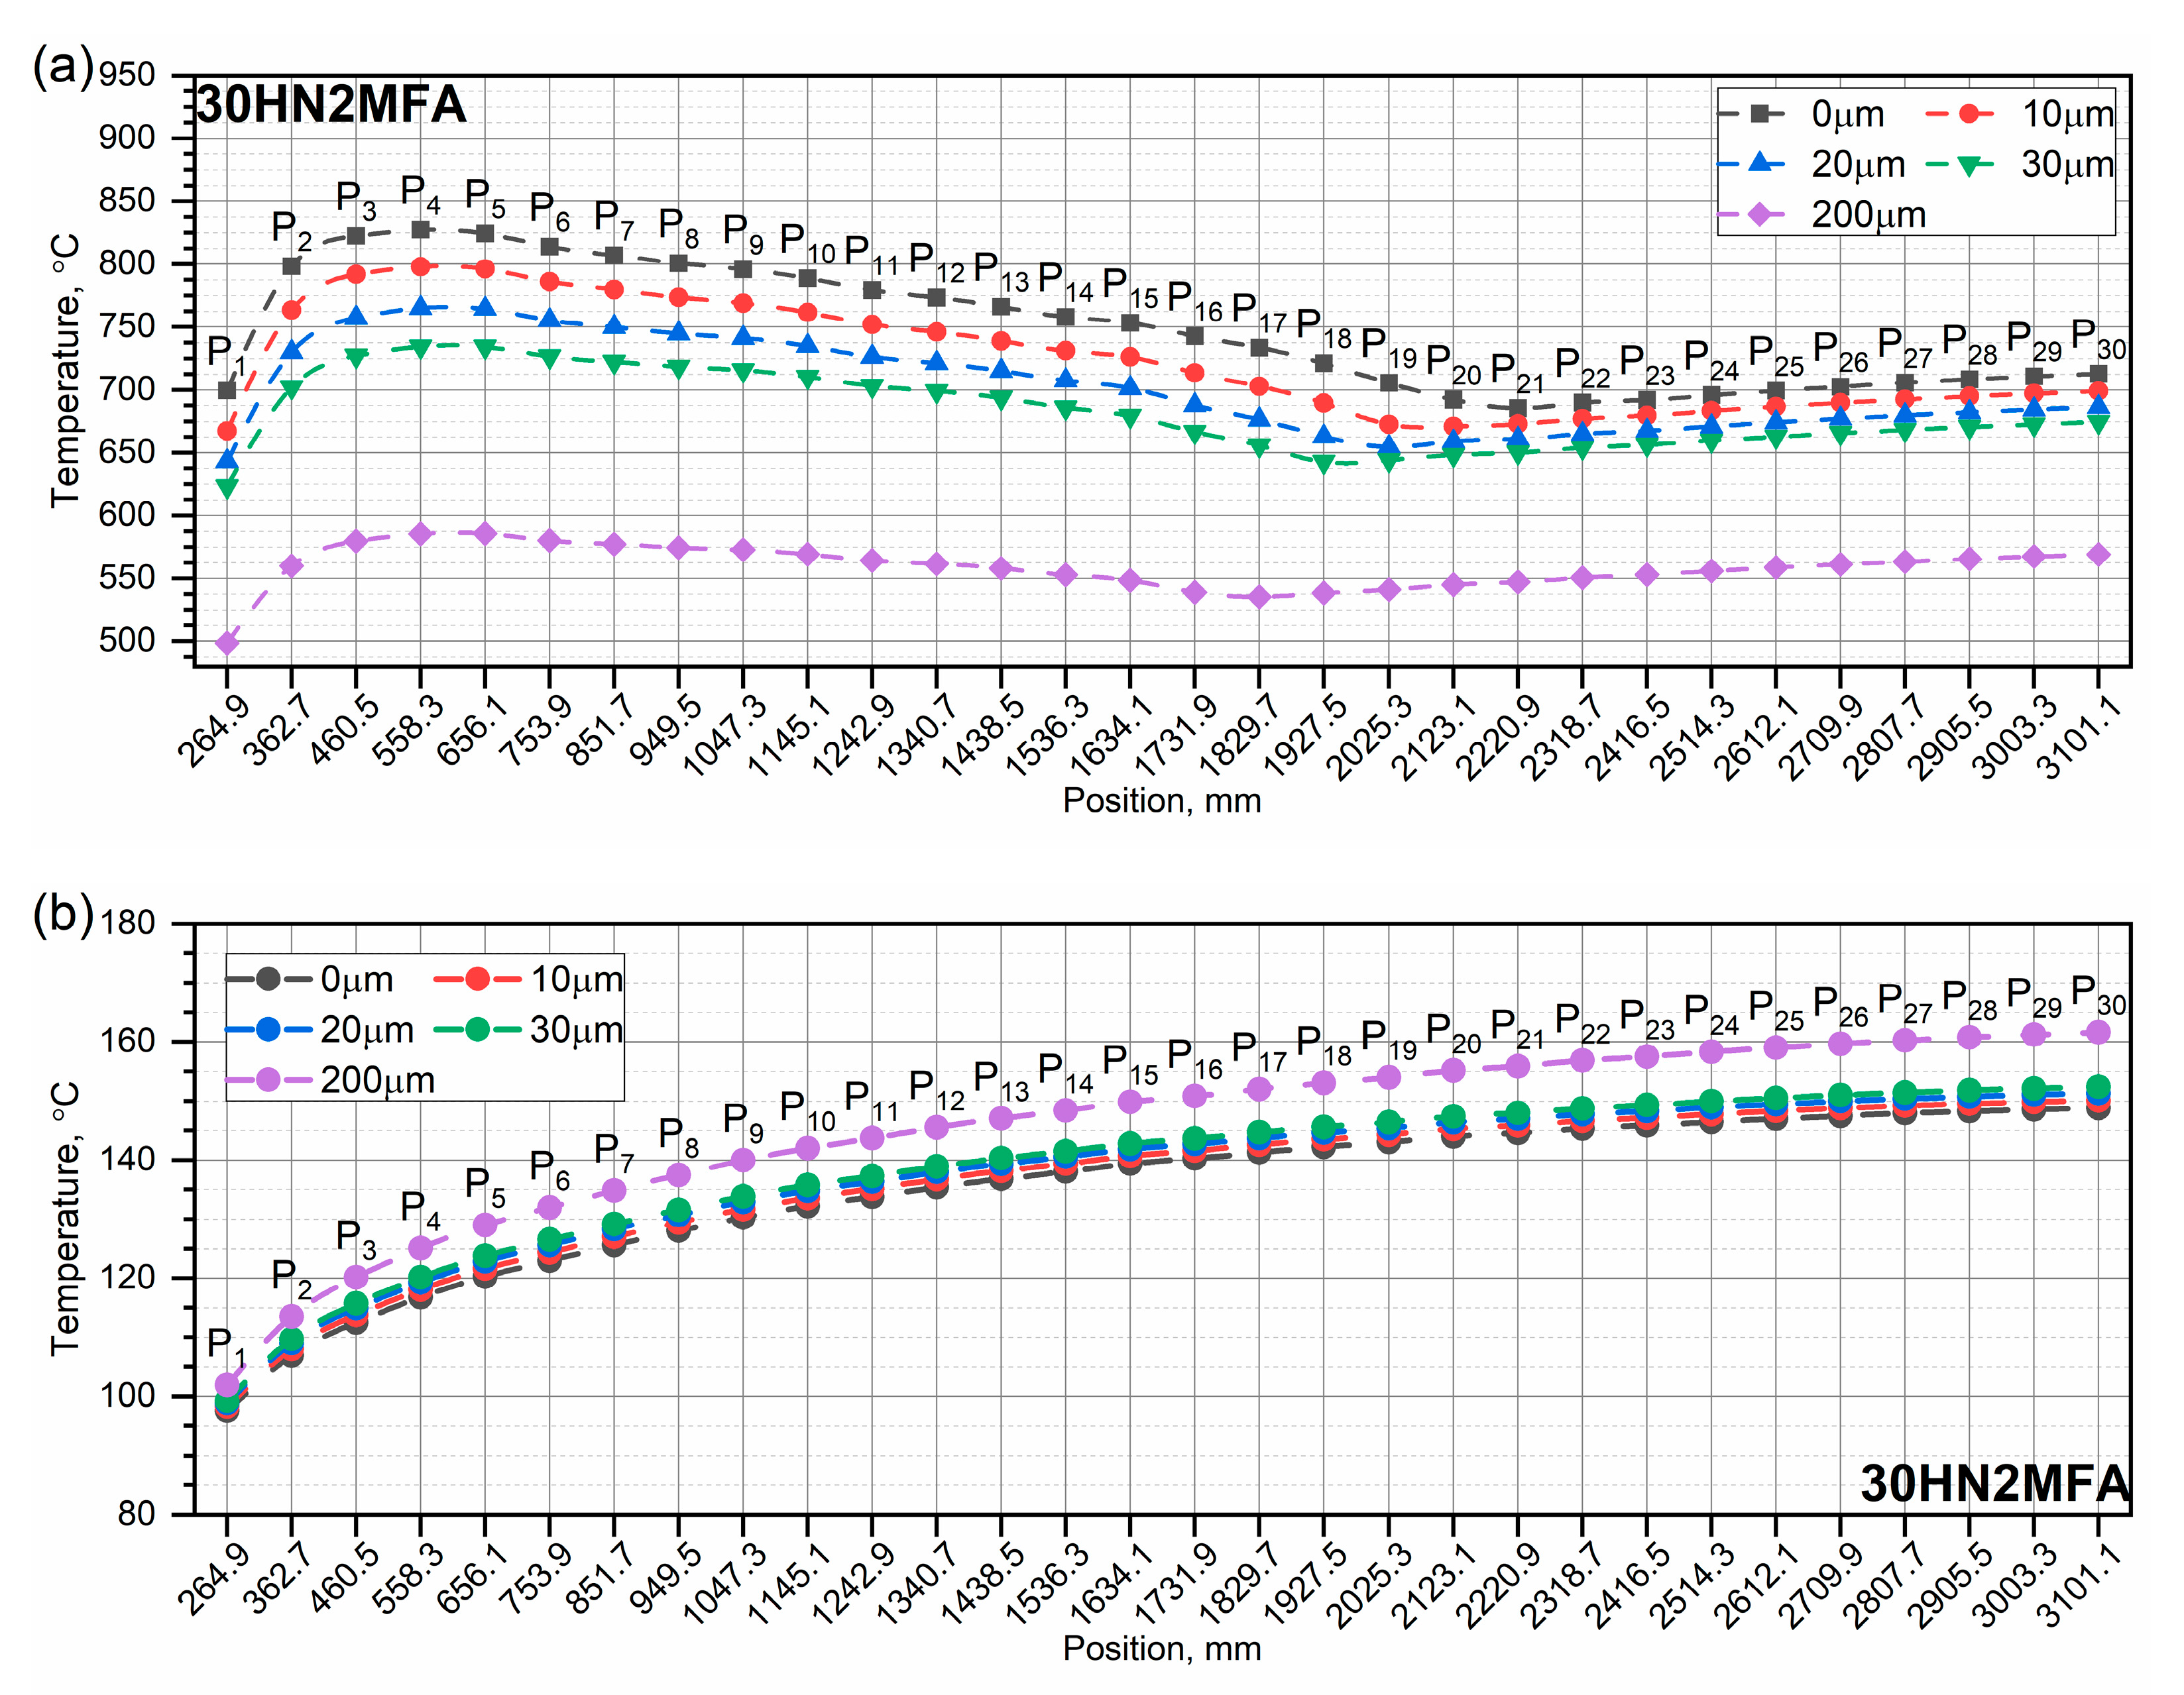
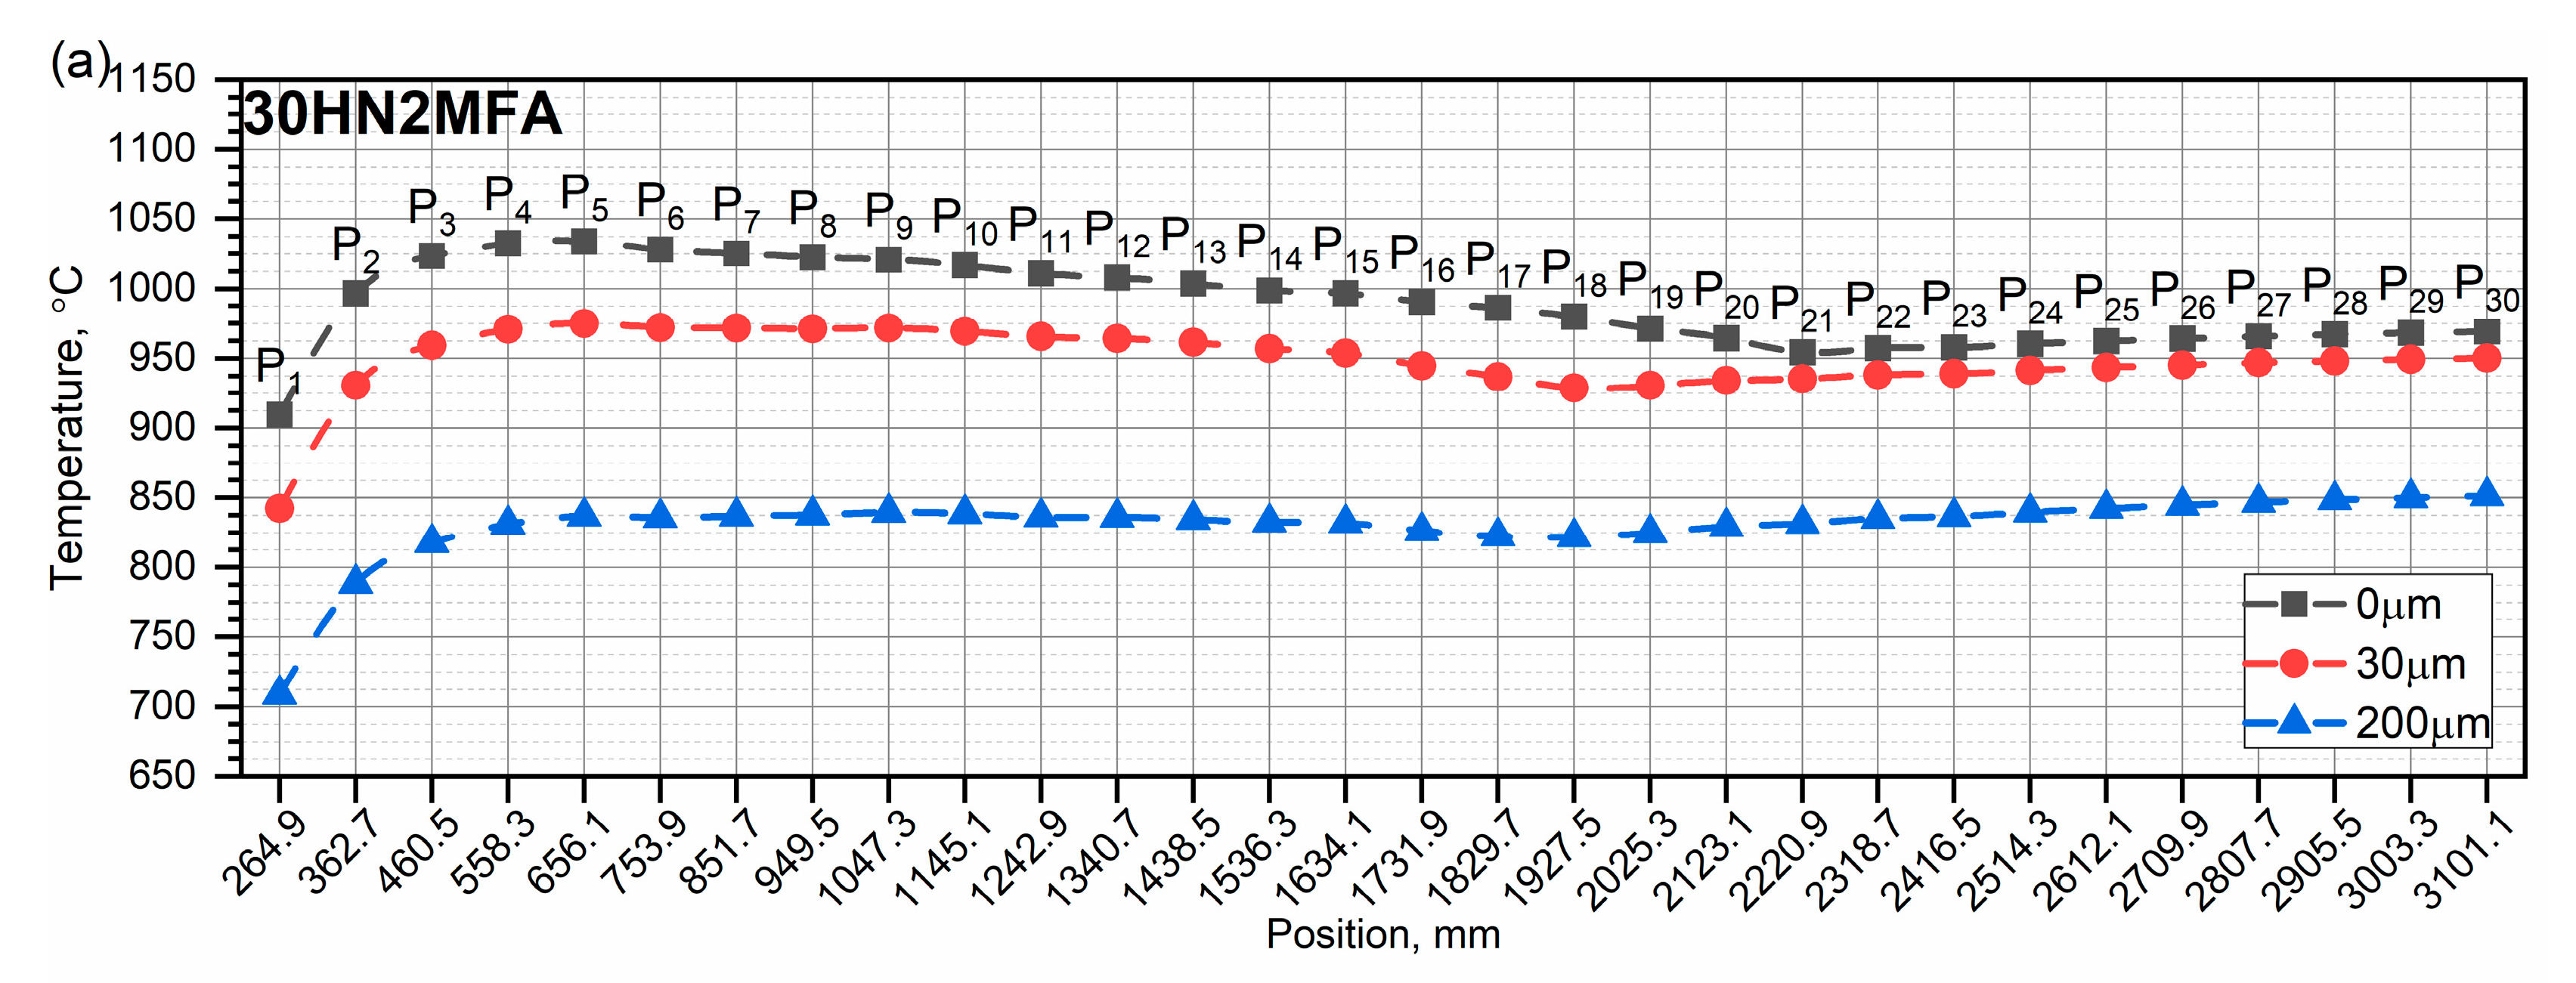
Distribution of the highest peak temperatures (upper figure) and the lowest temperatures of the peak base (lower figure) along the tube length with different chromium layer thicknesses after seven heat impulses are shown in Figure 16. After seven impulses, the distribution of the lowest peak base temperatures along the tube length is an ascending curve, and the highest temperature value is in the S27–S30 zones—Figure 16.
For the 30HN2MFA steel, for which a phase transition takes place, the temperature of 750 °C will appear the fastest for a tube with a protective coating of 200 μm in thickness—Figure 16. This means that the tube with 200 μm Cr will be the most exposed to wear.

4. Discussion

In this study, the results of numerical calculations of the heat transfer in the wall of a tube composed of 30HN2MFA steel with different thicknesses of the chrome layer, i.e., 0, 10, 20, 30 and 200 µm, on its inner surface are presented. The calculations were carried out for thermophysical parameters of the steel as a function of temperature for a tube divided into 30 zones. An interior ballistics code was developed to compute in each zone the heat transfer coefficient h i ( t ) and gas temperature T g t .
The division of the 3150 mm long tube into 30 zones made it possible to determine the temperature distribution along the length of the tube covered with a chrome layer.
The thermal resistance of the contact between the chromium and steel layers was not taken into account, as there are no reliable values for this resistance [25,32]. According to M.M Yovanovich, such a case could only be considered for a chromium layer with a thickness greater than 100 µm [31,32]. Adopting a constant value of the so-called constriction conductance from the contact spots at the level of approx. 1900   W · m 2 · K 1 , as is the case in the cited works, inflates the calculation results and is non-physical because this parameter depends on the value of the gas pressure, which changes as a function of time [25,32].
For a single heat impulse—temperature distribution in the tube with different chromium layer thicknesses:
It can be assumed that the distribution of the lowest peak base temperatures along the tube length (Figure 12) is actually the temperature distribution of the tube’s inner surface T i t , r i n , z , where I = 1, …, 30, up to a depth of approximately 0.5 mm below its surface—Figure 13. This assumption covers all cases of the thickness of the chromium layers on the inner surface of the tube, i.e., 10, 20, 30 and 200 µm, and the maximum crack depth of the 30HN2MFA steel, which was assumed to be 0.3 mm [17]. The 200 µm thick chrome layer lowers the highest peak temperature the most but, at the same time, increases the lowest temperature of the peak base the most, i.e., the temperature of the inner surface of the tube—Table 3.
For a sequence of seven heat impulses—the temperature on the inner surface of the tube:
The influence of the thickness of the chromium layer on the highest peak temperatures and the lowest peak base temperatures of the inner surface of the tube is particularly visible in the analysis of the first heat impulse—Figure 14. Then, for the inner surface of the tube without a chrome layer and with a chrome layer of 200 µm, the differences between the highest peak temperatures are the greatest. These differences in the temperatures decrease with each successive impulse. The opposite is true for the lowest peak base temperatures. With each successive impulse, for the inner surface of the tube without a chrome layer and with a chrome layer of 200 µm, these differences of temperatures are bigger and bigger.
For a sequence of seven heat impulses—the calculation of heat transfer along the wall thickness:
On each curve of the temperature distribution T i t , r , z along the wall thickness for a tube with different thicknesses of the chromium layer for a sequence of seven heat impulses, we can distinguish the so-called maximum peak temperature and the minimum base temperature, which is equivalent to the temperature of the inner wall of the tube. This temperature is practically identical to the temperature of the wall at a depth of 0.5 mm below its inner surface regardless of the thickness of the chrome layer—Figure 15. The lowest peak base temperature is read after each heat impulse, i.e., t = 100 ms for the first impulse, 200 ms for the second impulse, etc.
The distribution of the lowest peak base temperatures along the length of the tube for all thicknesses of the chrome layer shows that the highest temperature occurs at the end of the tube regardless of the thickness of the chrome layer—Figure 12 (lower figure) and Figure 16 (lower figure).

5. Conclusions

Calculations of the heat transfer in a tube with different layers of chromium, i.e., 0, 10, 20, 30 and 200 µm, on its inner surface were carried out for temperature-dependent thermophysical parameters, i.e., thermal conductivity, specific heat and density (in the range from RT to 1000 °C), of 30HN2MFA steel and Cr. The results are summarized as follows:
(1)
The calculations of the heat transfer indicate that the division of the tube into 30 zones allows for a reasonable time of several hours to calculate the temperature distribution over the entire length of the tube.
(2)
After the first and subsequent heat impulses, as the thickness of the chrome layer increases, the highest peak temperature in each zone drops, while the temperature inside the steel wall of the tube increases. Such a heat transfer mechanism is related to the high thermal conductivity of chromium. With each subsequent impulse, the lowest peak base temperature of the inner surface of the chrome-plated tube increases relative to the same temperature of the inner surface of the non-chrome-plated tube. Additionally, it can be assumed that the so-called minimum temperature of the peak base is actually the temperature of the tube to a depth of approximately 0.5 mm below its surface.
(3)
Already after the first heat impulse, the temperature of the wall at a depth of 0.5 mm below the inner surface is twice as high for a tube with a 200 µm thick chrome coating compared to a tube without this coating. After the fourth heat impulse, the temperature difference stabilizes and amounts to approximately 60 °C and, after the seventh impulse, a little more, i.e., 65 °C.
(4)
The presented model of heat transfer calculation in a tube with an inner channel covered with a thin layer of protective material can be used for the analysis of heat engines, internal combustion engines, etc.

Author Contributions

Conceptualization, M.Z., P.K. and Z.S.; methodology, P.K., M.Z. and Z.S.; software, M.Z. and Z.S.; validation, P.K. and M.Z.; formal analysis, P.K., M.Z. and Z.S.; writing—original draft preparation, P.K., M.Z. and Z.S.; writing—review and editing, P.K., M.Z. and Z.S. All authors have read and agreed to the published version of the manuscript.

Funding

The methods and results presented in this paper were obtained thanks to funding from the university research project UGB-821 of the Military University of Technology, in 2023 (Warsaw, PL) entitled “Numerical simulations of heat transfer in the barrel of a 30HN2MFA steel, the inner surface of which was covered with a layer of chromium of various thicknesses. Complementary tests of thermophysical properties of Maraging 350 and WCL steels”.

Institutional Review Board Statement

Not applicable.

Informed Consent Statement

Not applicable.

Data Availability Statement

Not applicable.

Conflicts of Interest

The authors declare no conflict of interest.

References

  1. Sopok, S.; Rickard, C.; Dunn, S. Thermal–chemical–mechanical gun bore erosion of an advanced artillery system part one: Theories and mechanisms. Wear 2005, 258, 659–670. [Google Scholar] [CrossRef]
  2. Sopok, S.; Rickard, C.; Dunn, S. Thermal–chemical–mechanical gun bore erosion of an advanced artillery system part two: Modeling and predictions. Wear 2005, 258, 671–683. [Google Scholar] [CrossRef]
  3. Cote, P.J.; Rickard, C. Gas–metal reaction products in the erosion of chromium-plated gun bores. Wear 2000, 241, 17–25. [Google Scholar] [CrossRef]
  4. Stiefel, L. (Ed.) Gun Propulsion Technology; American Inst. of Aeronautics and Astronautics: Washington, DC, USA, 1988; ISBN 0930403207. [Google Scholar]
  5. Feng, G.-T.; Zhou, K.-D.; Zhang, Y.-Q.; He, L.; Li, J.-S.; Wang, J. The Study of Gun Barrel’s Two-Dimensional Nonlinear Thermal Conduction. Int. J. Thermophys. 2019, 40, 37. [Google Scholar] [CrossRef]
  6. Ebihara, W.T.; Rorabaugh, D.T. Mechanisms of Gun-Tube Erosion and Wear. In Gun Propulsion Technology; Stiefel, L., Ed.; American Inst. of Aeronautics and Astronautics: Washington, DC, USA, 1988; pp. 357–376. ISBN 0930403207. [Google Scholar]
  7. Ahmad, I. The Problem of Gun Barrel Erosion: An Overview. In Gun Propulsion Technology; Stiefel, L., Ed.; American Inst. of Aeronautics and Astronautics: Washington, DC, USA, 1988; pp. 311–356. ISBN 0930403207. [Google Scholar]
  8. Baracuti, A.J. Wear-Reduction Additives—Role of Propellant. In Gun Propulsion Technology; Stiefel, L., Ed.; American Inst. of Aeronautics and Astronautics: Washington, DC, USA, 1988; pp. 377–412. ISBN 0930403207. [Google Scholar]
  9. Fikus, B.; Dorochowicz, A.; Surma, Z.; Kijewski, J.; Leciejewski, Z.; Michalski, J.; Trębiński, R. Investigations of Middle-Caliber Anti-Aircraft Cannon Interior Ballistics including Heat Transfer Problem in Estimation of Critical Burst Length. Processes 2022, 10, 607. [Google Scholar] [CrossRef]
  10. Lawton, B. Thermo-chemical erosion in gun barrels. Wear 2001, 251, 827–838. [Google Scholar] [CrossRef]
  11. Woodley, C.; Critchley, R.; Wallington, D. QinetiQ Studies on Wear and Erosion in Gun Barrels. Available online: https://www.semanticscholar.org/paper/QinetiQ-Studies-on-Wear-and-Erosion-in-Gun-Barrels-Woodley-Critchley/1e6ebf62df3ecc6b2b064737ee69ce45b659fcdf (accessed on 1 April 2023).
  12. Mishra, A.; Hameed, A.; Lawton, B. A Novel Scheme for Computing Gun Barrel Temperature History and Its Experimental Validation. J. Press. Vessel. Technol. 2010, 132, 444. [Google Scholar] [CrossRef]
  13. Dębski, A.; Koniorczyk, P.; Leciejewski, Z.; Preiskorn, M.; Surma, Z.; Zmywaczyk, J. Analysis of Heat Transfer in a 35 mm Barrel of an Anti-Aircraft Cannon. Probl. Mechatron. Armament Aviat. Saf. Eng. 2016, 7, 71–86. [Google Scholar] [CrossRef]
  14. Koniorczyk, P.; Zmywaczyk, J.; Dębski, A.; Zieliński, M.; Cegła, M. Investigations of thermal diffusivity and thermal expansion for three types of the barrel steel. In Thermophysics 2019: 24th International Meeting of Thermophysics and 20th Conference REFRA, Smolenice, Slovakia, 22–24 October 2019; Koniorczyk, P., Zmywaczyk, J., Dębski, A., Zieliński, M., Cegła, M., Eds.; AIP Publishing: Melville, NY, USA, 2019; p. 20006. [Google Scholar]
  15. Koniorczyk, P.; Zmywaczyk, J.; Dębski, A.; Zieliński, M.; Preiskorn, M.; Sienkiewicz, J. Investigation of Thermophysical Properties of Three Barrel Steels. Metals 2020, 10, 573. [Google Scholar] [CrossRef]
  16. Koniorczyk, P.; Sienkiewicz, J.; Zmywaczyk, J.; Dębski, A.; Zieliński, M.; Preiskorn, M. Effect of Microstructure on Thermophysical Properties of Heat-Treated Duplex Steel. Materials 2021, 14, 6043. [Google Scholar] [CrossRef]
  17. Dębski, A.; Surma, Z.; Koperski, W. Material and Technological Optimization Research in Terms of Increasing the Durability of Small Arms; Military University of Technology: Warsaw, Poland, 2009. [Google Scholar]
  18. Zhen, W.; Jin, W. Heat Transfer Simulation of Large Caliber Gun Barrel. IOP Conf. Ser. Earth Environ. Sci. 2020, 546, 42039. [Google Scholar] [CrossRef]
  19. Keith Clutter, J.; Shyy, W. Computation of high-speed reacting flow for gun propulsion applications. Numer. Heat Transf. Part A Appl. 1997, 31, 355–374. [Google Scholar] [CrossRef]
  20. Wu, Y.-H. Analysis of the Temperature Field of a Gun Tube Based on Thermal-Solid Coupling. RJASET 2013, 5, 4110–4117. [Google Scholar] [CrossRef]
  21. Akçay, M.; Yükselen, M.A. Unsteady Thermal Studies of Gun Barrels during the Interior Unsteady Thermal Studies of Gun Barrels during the Interior Ballistic Cycle with Non-Homogenous Gun Barrel Material Thermal Characteristics. J. Therm. Sci. Technol. 2014, 34, 75–81. [Google Scholar]
  22. Ding, C.; Liu, N.; Zhang, X. A mesh generation method for worn gun barrel and its application in projectile-barrel interaction analysis. Finite Elem. Anal. Des. 2017, 124, 22–32. [Google Scholar] [CrossRef]
  23. Hill, R.; McLeod, L. Methodology for Transient Thermal Analysis of Machine Gun Barrels Subjected to Burst Firing Schedules. Available online: https://nts.com/content/uploads/2017/12/Methodology-for-Transient-Thermal-Analysis-of-Machine-Gun-Barrels-Subjected-to-Burst-Firing-Schedules.pdf (accessed on 1 April 2023).
  24. Hill, R.D.; Conner, J.M. Transient Heat Transfer Model of Machine Gun Barrels. Mater. Manuf. Process. 2012, 27, 840–845. [Google Scholar] [CrossRef]
  25. Zieliński, M.; Koniorczyk, P.; Surma, Z.; Zmywaczyk, J.; Preiskorn, M. Numerical Study of Heat Transfer in a Gun Barrel Made of Selected Steels. Energies 2022, 15, 1868. [Google Scholar] [CrossRef]
  26. Chen, T.-C.; Liu, C.-C.; Jang, H.-Y.; Tuan, P.-C. Inverse estimation of heat flux and temperature in multi-layer gun barrel. Int. J. Heat Mass Transf. 2007, 50, 2060–2068. [Google Scholar] [CrossRef]
  27. Gu, Z.C.; Lu, H.T.; Wang, S.; Yan, W.M.; Xu, C. Numerical simulation of 3D barrel system based on thermal-structural coupling under continuous firing. J. Phys. Conf. Ser. 2020, 1507, 82052. [Google Scholar] [CrossRef]
  28. Qu, P.; Li, Q.; Yang, S.F. Temperature Field and Thermal Stress Analysis of Large Caliber Gun Barrel. AMM 2014, 518, 150–154. [Google Scholar] [CrossRef]
  29. Lee, H.-L.; Yang, Y.-C.; Chang, W.-J.; Wu, T.-S. Estimation of heat flux and thermal stresses in multilayer gun barrel with thermal contact resistance. Appl. Math. Comput. 2009, 209, 211–221. [Google Scholar] [CrossRef]
  30. Yang, Y.-C.; Lee, H.-L.; Hsu, J.-C.; Chu, S.-S. Thermal Stresses in Multilayer Gun Barrel with Interlayer Thermal Contact Resistance. J. Therm. Stress. 2008, 31, 624–637. [Google Scholar] [CrossRef]
  31. COMSOL Documentation: Theory for Thermal Contact. Available online: https://doc.comsol.com/6.0/docserver/#!/com.comsol.help.heat/heat_ug_theory.07.01.html (accessed on 22 June 2022).
  32. Bejan, A.; Kraus, A.D. Heat Transfer Handbook; Wiley: Hoboken, NJ, USA, 2003; ISBN 0471390151. [Google Scholar]
  33. Zhang, L.; Chen, Z.; Wen, D.; Wang, X.; Zhang, D.; Liang, J. Estimation of the Time-Varying High-Intensity Heat Flux for a Two-Layer Hollow Cylinder. Energies 2018, 11, 3332. [Google Scholar] [CrossRef]
  34. Ho, C.Y.; Powell, R.W.; Liley, P.E. Journal of Physical and Chemical Reference Data: Thermal Conductivity of the Elements: A Comprehensive Review. Available online: https://srd.nist.gov/JPCRD/jpcrdS1Vol3.pdf (accessed on 22 June 2022).
  35. McBride, B.J.; Gordon, S.; Reno, M.A. NASA Technical Paper 3287: Thermodynamic Data for Fifty Reference Elements. Available online: https://ntrs.nasa.gov/api/citations/20010021116/downloads/20010021116.pdf (accessed on 22 June 2022).
  36. Chromium Thermal Properties from Material Properties Database (MPDB) by JAHAM Software. Available online: https://www.jahm.com/demo_version.html (accessed on 22 June 2022).
  37. Koniorczyk, P.; Zieliński, M.; Sienkiewicz, J.; Zmywaczyk, J.; Dębski, A. Experimental Studies of Thermophysical Properties and Microstructure of X37CrMoV5-1 Hot-Work Tool Steel and Maraging 350 Steel. Materials 2023, 16, 1206. [Google Scholar] [CrossRef]
  38. Wiśniewski, S.; Wydawnictwo Naukowe PWN. Wymiana Ciepła, 61st ed.; Wydawnictwo Naukowe PWN: Warszawa, Poland, 2017; ISBN 9788301194437. [Google Scholar]
  39. Corner, J. Theory of the Interior Ballistics of Guns; John Wiley & Sons: New York, NY, USA, 1950. [Google Scholar]
  40. Serebryakov, M.E. Internal Ballistics of Gun Systems and Solid Rockets; Oborongiz: Moscow, Russia, 1962. [Google Scholar]
  41. Carlucci, D.E. Ballistics: Theory and Design of Guns and Ammunition, 2nd ed.; CRC Press: Hoboken, NJ, USA, 2013; ISBN 9781466564374. [Google Scholar]
  42. Fikus, B.; Surma, Z.; Trembiński, R. Preliminary Application Correctness Assessment of Physical Burning Law in Interior Ballistics Phenomena Modeling in Small-Caliber Guns. In Proceedings of the 31st International Symposium on Ballistics, Hyderabad, India, 4–8 November 2019; DEStech Publications, Inc.: Lancaster, PA, USA, 2019. ISBN 978-1-60595-610-7. [Google Scholar]
  43. Chen, H.; Yue, Z.; Ren, D.; Zeng, H.; Wei, T.; Zhao, K.; Yang, R.; Qiu, P.; Chen, L.; Shi, X. Thermal Conductivity during Phase Transitions. Adv. Mater. 2019, 31, 1806518. [Google Scholar] [CrossRef] [PubMed]
Figure 1. Heat transfer zones S1 to S30 input to the calculations.
Applsci 13 05523 g001
Figure 2. The maximum and minimum peak temperatures of a single heat impulse, i.e., the highest peak temperature and the so-called lowest peak base temperature.
Applsci 13 05523 g002
Figure 3. Heat transfer coefficient hi and the gas temperature Tg in the 6 chosen zones.
Applsci 13 05523 g003
Figure 4. Envelopes of the maxima hi in all zones and the gas temperature Tg at the moment of maximum hi.
Applsci 13 05523 g004
Figure 5. Thermal conductivity ks, apparent specific heat cs and density ρs of the 30HN2MFA steel. Data from [15].
Applsci 13 05523 g005
Figure 6. Thermal conductivity kCr, apparent specific heat cCr and density ρCr of Cr. Data from [34,35,36].
Applsci 13 05523 g006
Figure 7. Simplified model of the cross-section of a tube and one-dimensional heat transfer model along the radial r direction.
Applsci 13 05523 g007
Figure 9. Influence of tube mesh size on the maximum temperature of the tube inner surface for a single heat impulse.
Applsci 13 05523 g009
Figure 10. Temperature distribution of the outer surface of the tube in zone 26.
Applsci 13 05523 g010
Figure 11. Temperature distribution T i t , r i n , z of the tube’s inner surface with different chromium layer thicknesses at the 6 zones S4, S10, S16, S21, S25 and S30, for the single heat impulse.
Applsci 13 05523 g011
Figure 12. Distribution of the highest peak temperatures (a) and the lowest temperatures of the peak base (b) along the tube length with different chromium layer thicknesses for a single heat impulse.
Applsci 13 05523 g012
Figure 13. Temperature distributions T i t , r , z along the wall thickness with different chromium layer thicknesses for a single heat impulse in zone S30.
Applsci 13 05523 g013aApplsci 13 05523 g013b
Figure 14. Temperature distribution T i t , r i n , z of the tube’s inner surface with different chromium layer thicknesses at the 6 zones S4, S10, S16, S21, S25 and S30, for the sequence of seven heat impulses.
Applsci 13 05523 g014aApplsci 13 05523 g014b
Figure 15. Temperature distribution T i t , r , z : left side—along the wall thickness for the tube with different chromium layer thicknesses for a sequence of seven heat impulses (color-coded for the distance from the inner surface of the wall); right side—for the 1, 4 and 7 heat impulses.
Applsci 13 05523 g015aApplsci 13 05523 g015b
Figure 16. Distribution of the highest peak temperatures (a) and the lowest temperatures of the peak base (b) along the tube length with different chromium layer thicknesses after 7 heat impulses.
Applsci 13 05523 g016aApplsci 13 05523 g016b
Table 1. Heat transfer zones S1 to S30 input to the calculations: PSi—zone boundaries, Rout,PSi—outer radius of the tube in zone boundary i, zi—distance from the bottom of the tube to the cross-section Pi.
Number of Zone iS1S2S3S4S5S6S7S8S9S10
P S i   [ m m ] 216.0313.8411.6509.4607.2705.0802.8900.6998.41096.2
R o u t , P S i   [ m m ] 55.0055.0055.3555.6657.5258.2358.9459.2457.9456.72
z i   [ m m ] 264.9362.7460.5558.3656.1753.9851.7949.51047.31145.1
Number of Zone iS11S12S13S14S15S16S17S18S19S20
P S i   [ m m ] 1194.01291.81389.61487.41585.21683.01780.81878.61976.42074.2
R o u t , P S i   [ m m ] 55.4754.2152.9351.7050.4449.1847.9346.6745.4144.16
z i   [ m m ] 1242.91340.71438.51536.31634.11731.91829.71927.52025.32123.1
Number of Zone iS21S22S23S24S25S26S27S28S29S30
P S i   [ m m ] 2172.02269.82367.62465.42563.22661.02758.82856.62954.43052.2
R o u t , P S i   [ m m ] 42.7541.3339.9038.4837.0635.6434.2232.7931.3731.00
z i   [ m m ] 2220.92318.72416.52514.32612.12709.92807.72905.53003.33101.1
P S 31   [ m m ] 3150
Table 2. Main parameters for the calculations.
mass of pistonm, kg0.380
mass of propulsion materialmp, kg0.376
cross-sectional area of tube’s holes, m29.98 × 10−4
volume of propulsion material chamberV0, m3373 × 10−6
total travel of piston in tubelm, m2.9342
coefficient of secondary works of gasφ1.37
“force” of the propulsion materialf, J·kg−11.071 × 10⁶
covolume of gasη, m3∙kg−11.064 × 10⁻³
ratio of specific heats of gasγ1.2
gas constantR, J·kg−1·K−1340
density of propulsion materialρp, kg∙m−31600
Table 3. The highest peak temperature and the lowest peak base temperature as a function of the chromium layer thickness at the zone S30 for a single heat impulse.
0   μ m   C r 10   μ m   C r 30   μ m   C r 200   μ m   C r
highest peak temperature [°C]712.8699.0674.5569.0
lowest temperature of the peak base [°C]224.1226.1229.8250.1
Disclaimer/Publisher’s Note: The statements, opinions and data contained in all publications are solely those of the individual author(s) and contributor(s) and not of MDPI and/or the editor(s). MDPI and/or the editor(s) disclaim responsibility for any injury to people or property resulting from any ideas, methods, instructions or products referred to in the content.