Article

Improvement of Auxiliary Diagnosis of Diabetic Cardiovascular Disease Based on Data Oversampling and Deep Learning

College of Electronic Information and Automation, Tianjin University of Science and Technology, Tianjin 300202, China
*
Author to whom correspondence should be addressed.
These authors contributed equally to this work.
Appl. Sci. 2023, 13(9), 5449; https://doi.org/10.3390/app13095449
Submission received: 13 March 2023 / Revised: 24 April 2023 / Accepted: 25 April 2023 / Published: 27 April 2023
(This article belongs to the Special Issue Deep Learning and Machine Learning in Biomedical Data)

Abstract

:
Diabetic cardiovascular disease is a common complication of diabetes, which can lead to high-mortality diseases such as diabetic cardiomyopathy and atherosclerosis in serious cases. Therefore, effective prevention and management of diabetic cardiovascular disease is demanded. Clinical medical data officers are faced with a situation of a small amount of data and uneven data distribution. In this paper, we propose data oversampling synthesis techniques based on weight and extension algorithms. It can combine 1D-convolutional neural networks and long short-term memory neural networks to solve the problem of a lack of original data. First of all, a few samples based on feature weight are synthesized to make the original unbalanced data evenly distributed. Secondly, the original data are extended and corrected to expand the number of samples. Finally, the deep learning algorithm is used to extract features and classify whether the data have diabetic cardiovascular disease. Data synthesis based on weight and extension algorithms was evaluated on the actual medical datasets and obtained an accuracy of 93.53% and specificity of 94.37%, which confirms that it is an improved solution compared to the other algorithms. Hence, this paper contributes not only a substantial saving of human resources but also improves the efficiency of the clinical diagnosis of diabetic cardiovascular disease, which is conducive to the early detection and treatment of diseases.

1. Introduction

1.1. Background

The occurrence of diabetic cardiovascular disease is due to the impaired function of arterial endothelial cells caused by high blood sugar, which increases the risk of atherosclerosis [1]. Atherosclerosis is a disease with increased thickness, decreased elasticity, increased brittleness and easy rupture of the artery wall, which is the main pathological basis of cardiovascular diseases. Cardiovascular disease is the most serious and prominent problem of diabetes. The risk of cardiovascular disease in diabetic patients is two to four times higher than that in non-diabetic patients. Therefore, effective preventive and management measures should be taken [2]. Researchers worldwide frequently study the treatment and detection of diabetic cardiovascular diseases. Hematological and urological parameters are used to judge disease conditions and the effectiveness of therapeutic methods [3], which makes it possible to make a clinical diagnosis according to these parameters.
With people’s attention to health and the continuous progress of medical technology, the development of the medical level is more rapid and extensive, which has made a greater contribution to human health [4]. Artificial intelligence is superior to human experts in the field of data processing [5], and it has great potential to promote the further development of medical diagnosis technology. Although deep learning technology has an excellent performance in the field of automatic diagnostic medical images, it still faces great challenges in terms of interpretability and analysis of textual biological data [6,7].
That patients suffering from diseases are detected accurately is an important problem in the work of medically assisted diseases. However, the actual medical data we used have the characteristic of unbalanced distribution, which affects the generalization performance of the supervised learning algorithm [8,9]. For example, a rare disease may occur in the population of special cases compared with other clinically normal diagnostic criteria in the differential diagnosis activities of special problems, such as the clinical differential diagnosis of auxiliary medical diseases.
Another challenge in medically assisted diseases using deep learning models is the amount of data. At present, electronic health records are widely used in medical research, but there is no effective and unified method to evaluate the quality of data recorded in electronic health records. It leads to the limitation of the accuracy of disease classification using the data of electronic health records [10]. In the training process, if the data are too few, it is difficult for the model to extract the features effectively and make an accurate classification. Conversely, over-fitting the characteristics of the training set makes it difficult to show good robustness on the verification set.
Traditional automatic diagnosis methods need to extract features manually so they are subjective and one-sided. In addition, the traditional automatic diagnosis does not adapt to complex data, which affects the accuracy of classification results to a certain extent. The proposed artificial intelligence algorithm can improve the efficiency of the diagnosis of diseases, which realizes the function of the pre-triage of patients, save social resources and medical resources and reduce the period of medical treatment.

1.2. Related Work

Although deep learning technology has shown a strong competitive advantage in the field of automatic diagnostic medical images, it still faces many major challenges such as the processing of text-based medical information. At present, many researchers are committed to developing better resampling methods to reduce the data imbalance ratio to improve the performance of the classifier [11]. Douzas et al. proposed a simpler and more effective oversampling method based on the K-mean clustering method and SMOTE method. It avoided the noise and effectively overcame the inter-class and intra-class imbalance [12]. Jedrzejowicz et al. made the GEP classifier adapt to the requirements of an unbalanced data environment by reusing a few class instances and applying an incremental learning paradigm [13].
Many studies have been reported on the further integration of deep learning techniques with medical diagnostics. Liu et al. proposed that high-frequency ultrasound based on complete convolutional neural network processing has high diagnostic value for peripheral neuropathy in patients with type 2 diabetes. It is suggested that high-frequency ultrasound can be used to evaluate the morphological changes of peripheral nerves in patients with type 2 diabetes [14]. Lipton et al. built an LSMT prediction model based on 80,000 multi-label electronic outpatient cases for the multi-label disease prediction of outpatient case data [15]. Yi et al. built a learning model using RNN to extract drug interactions [16]. Antoniou et al. verified the feasibility of GAN for training sample data enhancement through experiments [17].
In the process of actual clinical diagnosis, in addition to the diseases that can be diagnosed through medical images, many diseases need to be diagnosed through text medical data, such as diabetes and its complications. Further research is needed on the accuracy of the deep learning model, especially when the biological samples of text clinical medical data are unbalanced and small.

1.3. Contributions

This study strives to improve the classification effect using a small sample of unbalanced text biological data of diabetic cardiovascular disease from the data level and algorithm level. It can make an accurate judgment on the diagnosis results of each piece of medical data. Therefore, we put forward data synthesis based on weight and extension algorithms, which can automatically judge the health condition of patients and carry out the preliminary diagnosis of diabetic cardiovascular diseases. This research saves medical resources and labor costs, which is of positive significance for medical development. The main contributions of this work are as follows:
(1)
At the data level, we use the weighted Minkowski distance to define the IOWA operator SMOTE for some sample spacing [18]. From the eigen weights, the weighted Minkowski distance of the IOWA operator can be obtained to calculate the distance to the nearest neighboring point. Then, by SMOTE interpolation, increase the distribution density of a few samples and combine a few samples to achieve sample balance.
(2)
At the algorithmic level, extended learning, the 1D-CNN and LSTM networks are proposed [19,20,21,22] for data classification. Extended learning has been proven to be a fast and effective technique, especially in the case of very limited raw data [23]. We combine the 1D-CNN with LSTM to process the encoded data searching for the features hidden in the original data, and also introduce attention mechanisms in memory neurons to learn associative features of distant data.
(3)
We used human hematology data and human urine data to illustrate the algorithm initially and compared the performance of different algorithms. Compared with electronic health records, medical testing information with unified standards has higher reliability [24]. The human hematology tests used in this paper include blood glucose tests, blood routine tests, urine routine tests and biochemical tests. Different parameters are often obtained by different methods, which can reflect different health conditions of the human body [25,26,27]. The proposed data synthesis based on weight and extension algorithms has been preliminarily applied to the diagnosis of diabetic cardiovascular disease using textual data from Human Hematology and Urology.
The rest of this article is organized as follows: Section 2 introduces the data synthesis based on weight and extension algorithms proposed in this paper. Section 3 describes the actual clinical dataset and experimental results used in this paper. Section 4 discusses the performance of the proposed method in the context of real clinical data on diabetic cardiovascular disease and the comparative results of different losses. Section 5 provides the conclusion of this paper.

2. Materials and Methods

We proposed data synthesis based on weight and extension algorithms. It can use biological data of human urine parameters and hematology parameters to automatically assist a diagnosis of cardiovascular disease based on deep learning. First of all, a few samples based on feature weight are synthesized to make the original unbalanced data evenly distributed. Secondly, the original data are extended and corrected to expand the number of samples. Finally, the deep learning algorithm is used to extract features and classify whether the data have diabetic cardiovascular disease. The proposed algorithm can be used for data synthesis and enhancement which provides accurate and rapid decision support for the prediction of diabetic cardiovascular disease, even when the distribution of original data is uneven and the number of samples is small. The system has positive significance for the development of auxiliary diagnosis technology using text medical data, as it can automatically judge the health status according to the input medical data which improves the efficiency of disease diagnosis.

2.1. Data Synthesis Based on Weight and Extension Algorithms

Figure 1 shows the flow chart of data synthesis based on weight and extension algorithms. First, we determine whether the datasets for diabetic cardiovascular disease are unbalanced. If they are unbalanced, the samples of a few classes based on feature weight should be combined to make the original samples evenly distributed. Secondly, the data are enhanced and the number of samples is expanded by extending and modifying the algorithm. Finally, the deep learning algorithm is used for feature extraction and classification of the dataset to preliminarily obtain the results of diabetic cardiovascular disease.
Since the task of the classification layer is a binary classification task, we adopt the sigmoid classification function. Each neuron in the output layer represents a kind of health condition and corresponds to a unique heat vector. The sigmoid function is shown in Equation (1):
s i g m o i d x = 1 1 e x

2.2. SMOTE Algorithm Based on IOWA Operator

The synthetic minority oversampling technique (SMOTE) [28], which uses the interpolation method, is used to balance the unbalanced dataset by inserting the new minority samples over the line between each minority sample and its K neighbor sample. The classic SMOTE method uses the Euclidean distance (Equation (2)) to calculate the nearest neighbor set of the minority sample set. Then, the new synthesizing samples are inserted between the minority sample set and the k-nearest neighbor sample set until an appropriate number of the new sample set is obtained:
D = i = 1 n X i X k 2
where there are n samples in the minority sample set X, Xi is the i-th sample of X, Xk is the k-th nearest neighbor sample of Xi and D is the distance between the calculated minority sample Xi and its nearest neighbor Xk.
The classical OWA operator assumes that the values of the elements to be aggregated are related to the defined weights, but the weights for each item of high-dimensional data are not balanced. So, the IOWA (induced ordered weighted average) algorithm was introduced [29]. The basic principle of the IOWA operator is to calculate the accuracy of each moment through the predicted value and assign weight coefficients to every single model in the order of accuracy from high to low. The predicted value and the actual value are from the sum of the square’s error function. As follows, it establishes the combined prediction model with the minimum value as the target.
Let a 1 , x 1 , a 2 , x 2 , , a n , x n be n two-dimensional arrays, then the IOWA operator can be obtained from Equation (3):
IOWA W a 1 , x 1 , a 2 , x 2 , , a n , x n = i = 1 n w i b i
where, IOWA W is the n-dimensional-induced ordered weighted average operator generated by a 1 , a 2 ,     , a n , b i is the i-th largest input vector in a 1 , a 2 ,   , a n in order from the largest to the smallest, W = ( w 1 , w 2 , , w n ) T is the weighted vector of OWA which satisfies i = 1 n w i = 1 , w i 0 . The IOWA operator is an orderly weighted average of the corresponding values of induction value x 1 , x 2 ,   , x n sorted from large to small. The sizes of w i and x i are independent of their positions but are related to their positions.
The SMOTE process based on the IOWA operator is as follows:
Fisher scores of each feature variable in dataset X were calculated to obtain the weight matrix w for all features by Equation (4):
w = i = 1 C n i n μ i m μ m ¯ 2 1 n i = 1 C x w i x m μ i m 2
where the total of N samples in the dataset belongs to C categories, and each category contains n i samples. x m represents the value of sample x on the m-th feature, μ i m represents the mean value of class i samples on the m-th feature and μ m ¯ represents the mean value of all classes of samples on the m-th feature.
The minority samples in the training set were taken out. The variant form of Minkowski distance weighted by the IOWA was considered to define the neighborhood using Equation (5):
D I O W A = i = 1 n w i b i p 1 p
where the well-known options for this parameter are p 1 , 2 , ,   p 1 , , it is the traditional Euclidean norm when p = 2. Similar to the IOWA operator, b i is the value of the i-th larger input vector sampled from X. In addition, it satisfies i = 1 n w i = 1 and w j [ 0 , 1 ] . The nearest neighbor D I O W A of each minority sample in the minority sample was calculated.
According to the preset sampling ratio, several samples are randomly selected from D I O W A , then the new samples are inserted into these samples.
Repeat steps two and three until the dataset has the appropriate number of samples.

2.3. Data Enhancement

In this experiment, data amplification techniques were used to solve the problem of the lack of original data. We added a random disturbance matrix to the original training matrix to amplify the original data to form an amplification matrix, as shown in Equation (6):
E = X + D
where E is the amplified matrix, X is the original training matrix, and D is the random disturbance matrix. The element value of the random disturbance matrix D should be much smaller than that of the original training matrix X , and the scale should be the same as that of the original training matrix.
We also studied the effect of data quantification on model performance in the experiment. We quantify the physiological parameters that test negative using a smaller value near zero instead of zero.

2.4. 1D-Convolutional Neural Network

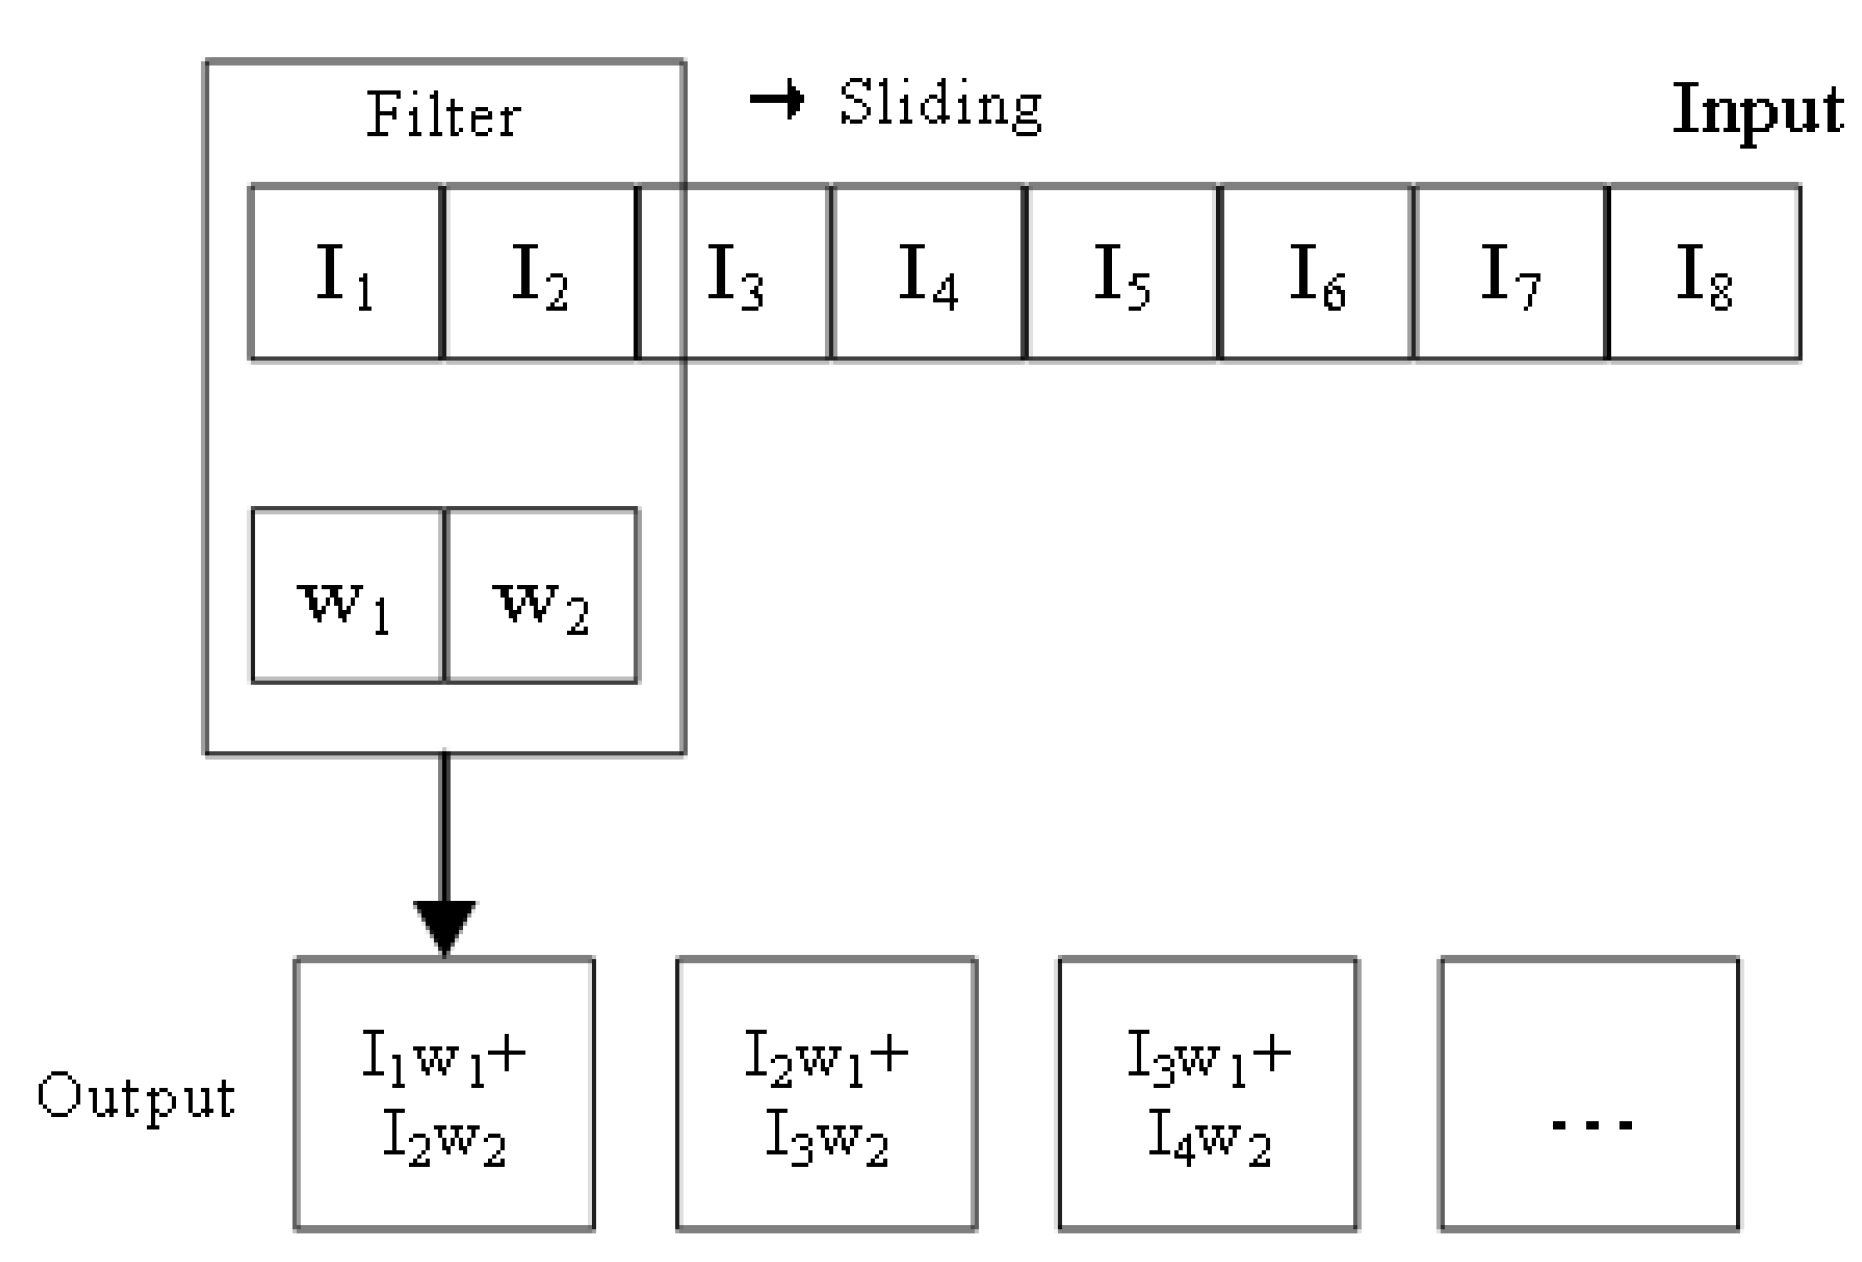
The 1D-convolutional neural network (1D-CNN) is the core of feature extraction for data synthesis based on weight and extension algorithms. We use it to effectively process text data with certain regularity. The schematic diagram of the 1D-CNN algorithm is shown in Figure 2.
Filter uses the method of shared weight to learn the input characteristics. When the trained filter detects that a particular feature is present in the data, the corresponding filter is activated. The principle is shown in Equation (7):
O k = σ b i a s + m = 1 N w m I x + m 1
where O is the output of the k neuron in the feature graph, σ is the ReLu activation function, b i a s is the shared bias, w m is the m weight in the weight matrix, I x + m - 1 is the input of the x + m 1 neuron and N is the filter length.
A kind of filter can extract one of the characteristics of the input data. The 1D-CNN can effectively extract the characteristics of biomedical data.

2.5. Long Short-Term Memory Networks

The cell structure of the LSTM is shown in Figure 3. Three gates are placed in a unit including the input gate, the oblivion gate and the output gate. The gate determines whether the entered information is useful. Only the information that meets the algorithm authentication is left. We use LSTM to dig deep into long-term dependencies and trends in a limited sample of data.
The updated recursive Equation of LSTM is Equations (8)–(12):
Input gate:
I t = σ W x i X t + W h i H t 1 + b i
Forget gate:
F t = σ W x f X t + W h f h t 1 + b f
Output gate:
O t = σ W x o X t + W h o H t 1 + b o
Memory unit structure:
C t = F t C t 1 + I t tanh ( W x c X t + W h c H t 1 + b c )
H t = O t tanh C t
in Equations (8)–(12), I t , F t and O t represent the gating information of the input, forgetting and output gates, respectively. “ · ” represents dot product operation, W is the weight matrix, b is the bias weight vector and σ stands for sigmoid activation function. H t gives t moment output values and the result by tanh nonlinear function gives a value between −1 to 1; C t is the long-term state of the cell, namely, the long-term memory of the LSTM neural network.
We use LSTM for feature classification to overcome the gradient disappearance and gradient explosion in the training process, and by introducing the attention mechanism of neurons with memory function to learn the joint features of data separated by a long distance, the memory ability of the long-term series is better realized.

3. Experiments

3.1. Dataset and Preprocessing

The biological data of diabetic cardiovascular disease used in this experiment are from the metabolic disease hospital of Tianjin Medical University, and the data collection time is from 15 December 2017 to 20 January 2018. All samples in the experiment came from patients who went to the hospital for health checks. Before analyzing the data, we anonymized the names and other basic information of the patients and obtained the patients’ knowledge and also obtained the patients’ written informed consent. The clinical samples in the experiment excluded the data of pregnant women, lactating women and patients suffering from cardiovascular diseases. Data on 698 pieces of patient physiological information were initially obtained from different patients. Each piece of data was composed of patient physiological information and physician diagnosis results, and all hematological parameters were obtained by professionally trained clinical examiners according to the gold standard. All diagnoses were made by a metabolic pathologist with 6–10 years of clinical experience. We use the doctor’s diagnosis to make the label. The heat map shows the correlation coefficient distribution of variables of data by means of a contingency table. The heat map (Figure 4) can intuitively show the correlation of the 49 indicators, which results from blood routine, urine routine, biochemical examination and glycosylated hemoglobin.
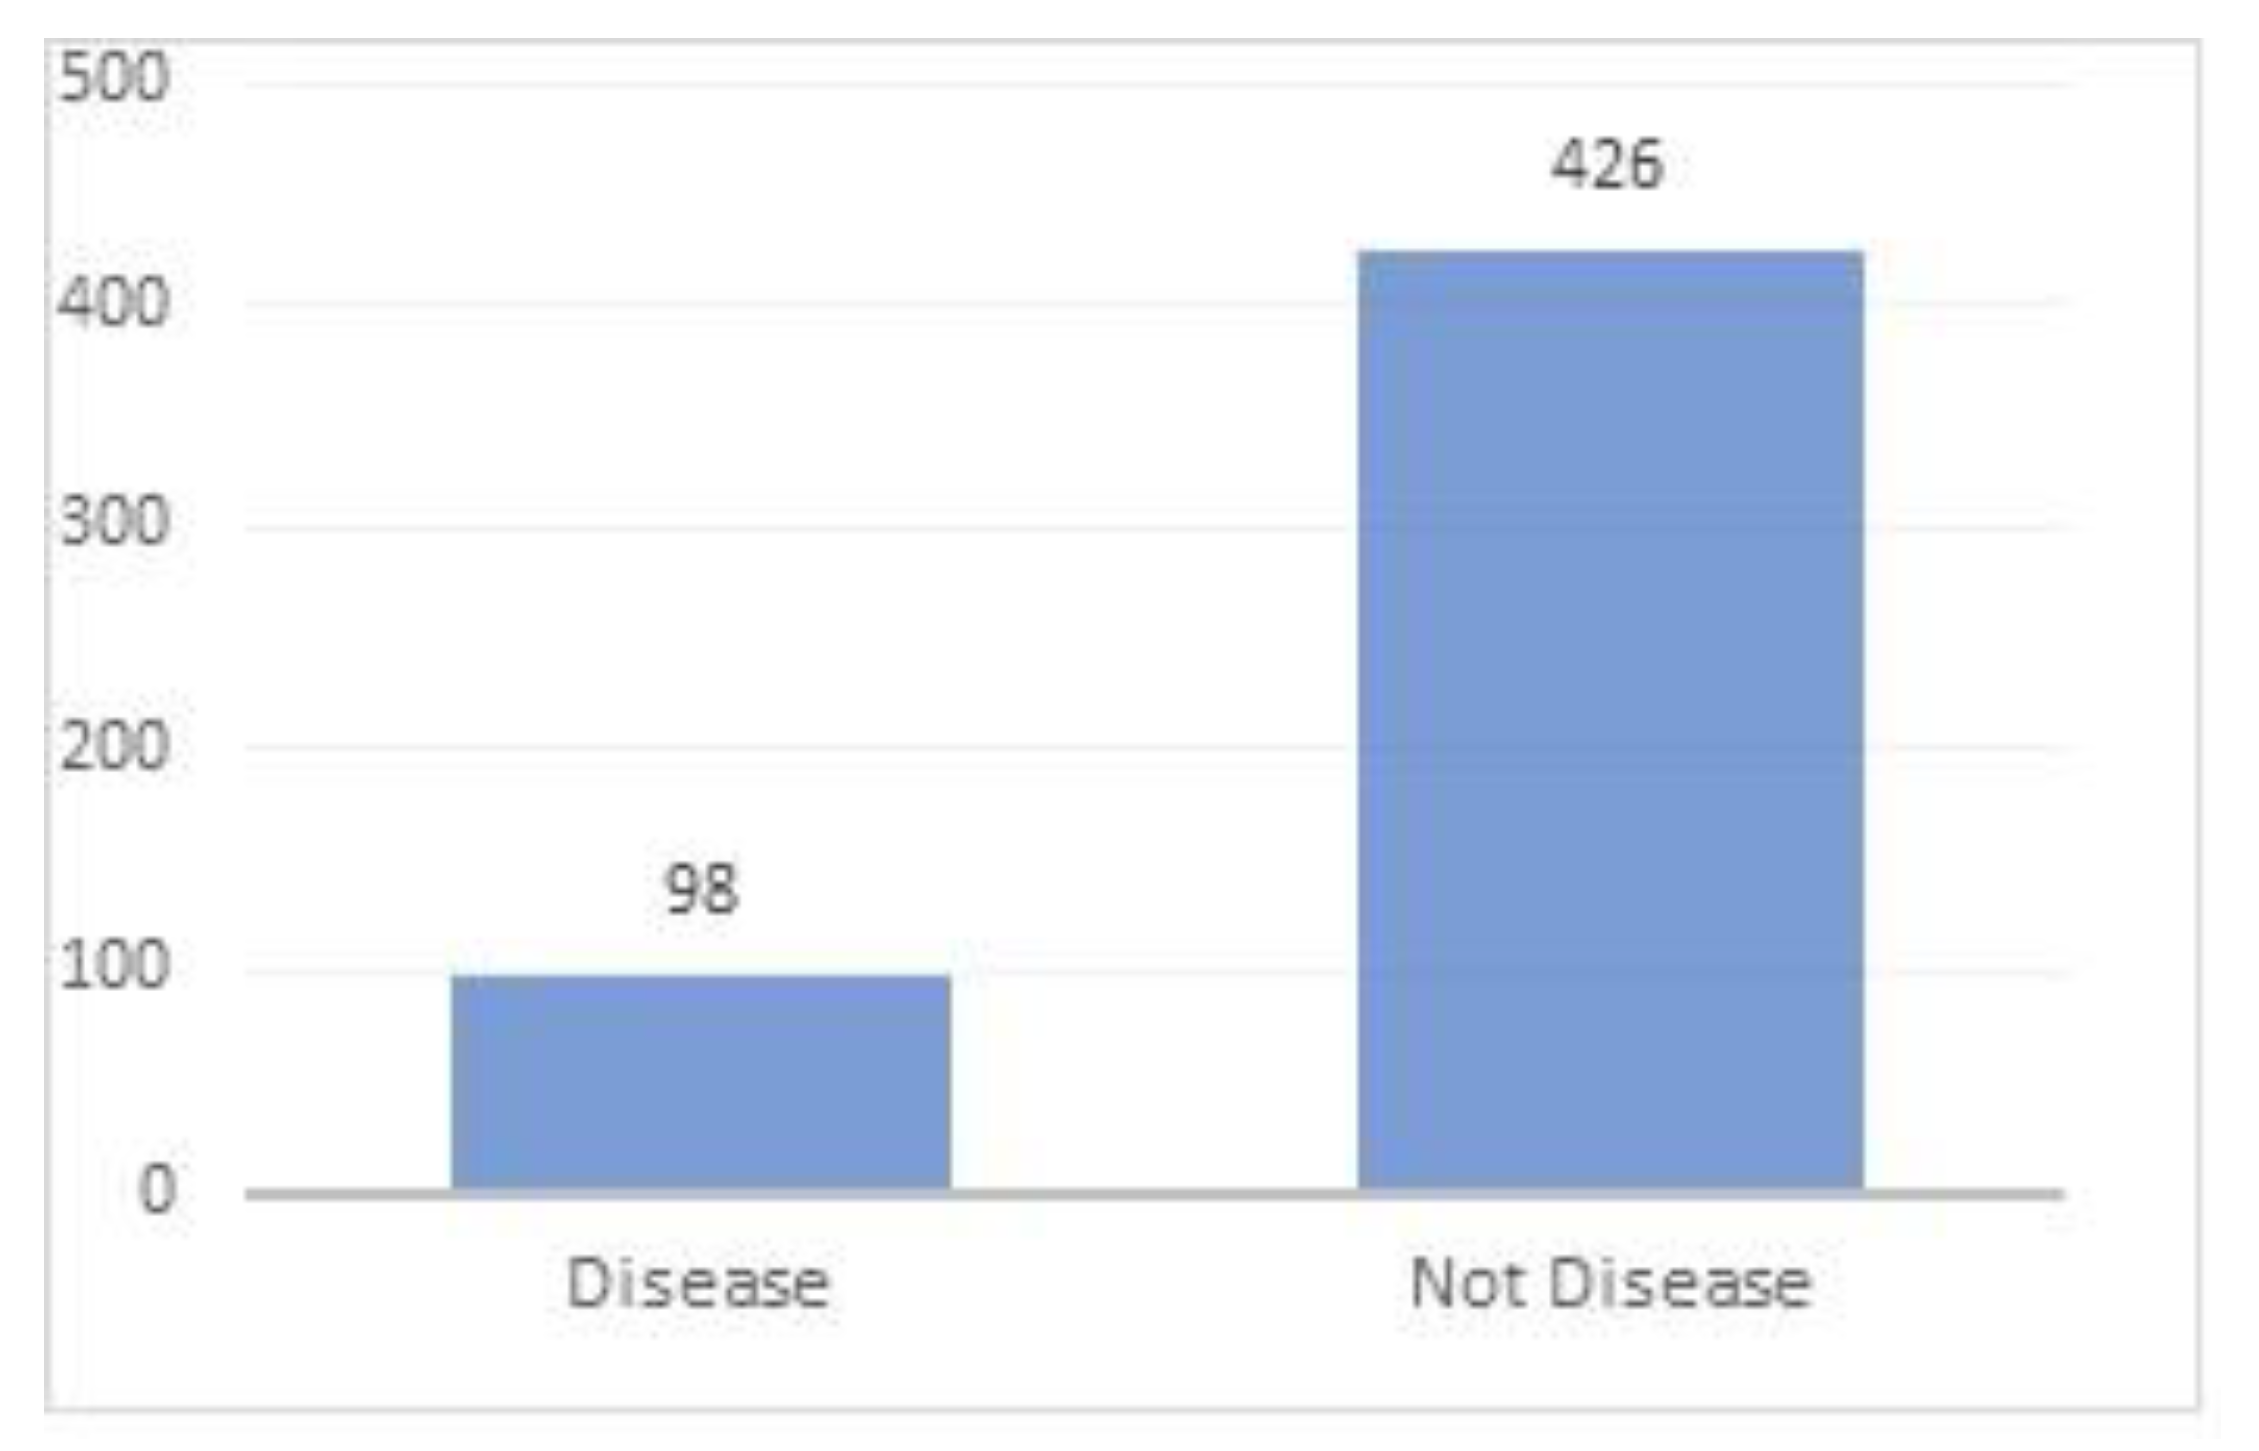
The dataset of diabetic cardiovascular disease after data collation contains 524 data samples, of which 98 are diabetic cardiovascular disease patients and 426 are not diabetic cardiovascular disease patients. The proportion of minority samples to majority samples is 0.23, which belongs to the unbalanced dataset (Figure 5).
We adopt one-hot encoding technology in the process of data preprocessing. N states of discrete data are represented by n-dimensional vectors that different elements in the vector represent different health conditions. Each state has an independent vector, that is, only the corresponding elements in the vector are 1, and the rest are 0. As shown in Table 1, the discrete data are converted to 001, 010, 100 and other data that can be read by the computer which solves the problem that the classifier cannot process the discrete attribute data. It can improve the generalization ability and the recognition accuracy of the model. Through the above methods, we code the diagnosis of health as 10, and the diagnosis of diabetic cardiovascular disease as 01.

3.2. Results

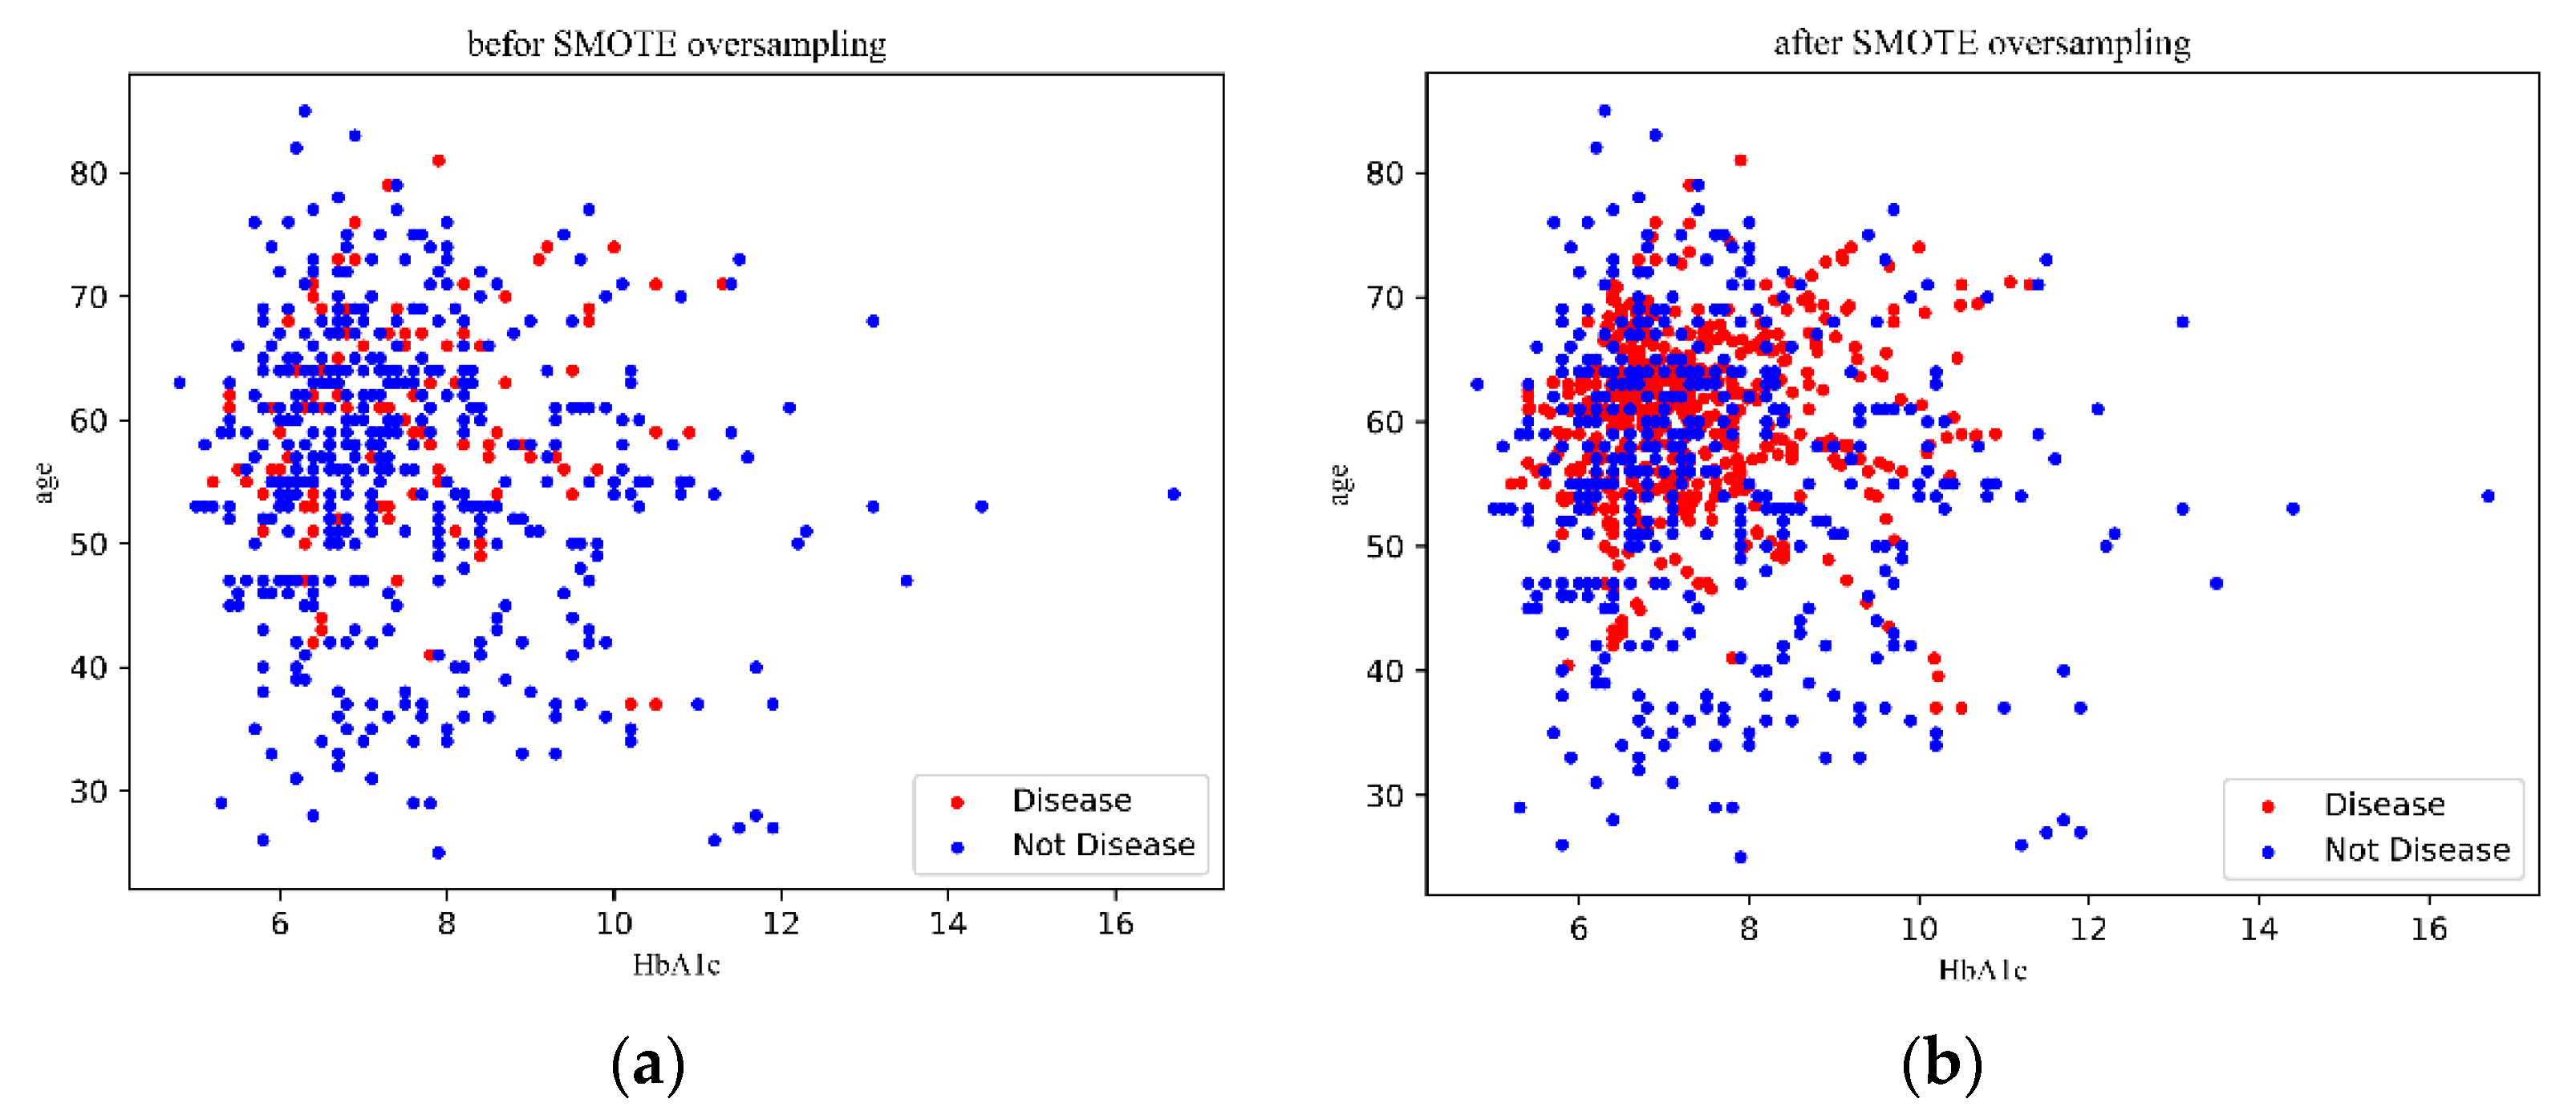
In order to observe the change of data quantity more directly, we choose to use a two-dimensional coordinate graph to display the change of data quantity. Glycosylated hemoglobin (HbA1C) is a common indicator for patients and is often used as a monitoring indicator for diabetes control in clinical practice. In addition, the age of patients is also one of the statistical variables in this paper. Therefore, we selected HbA1c and age from 49 indicators as the x-coordinate and y-coordinate, respectively, to plot the effects of oversampled data based on the IOWA operator SMOTE algorithm (Figure 6). There were 846 pieces of over-sampled data, including 420 pieces of diseased samples and 426 pieces of non-diseased data. The degree of imbalance was 0.986, close to 1, proving that the dataset was relatively balanced. We only randomly selected 140 pieces of data from the original data to test the effect of model training. The remaining 706 pieces of data, including raw data and amplified data, were used to train the extension model. The test data and training data are completely independent and do not cross each other.
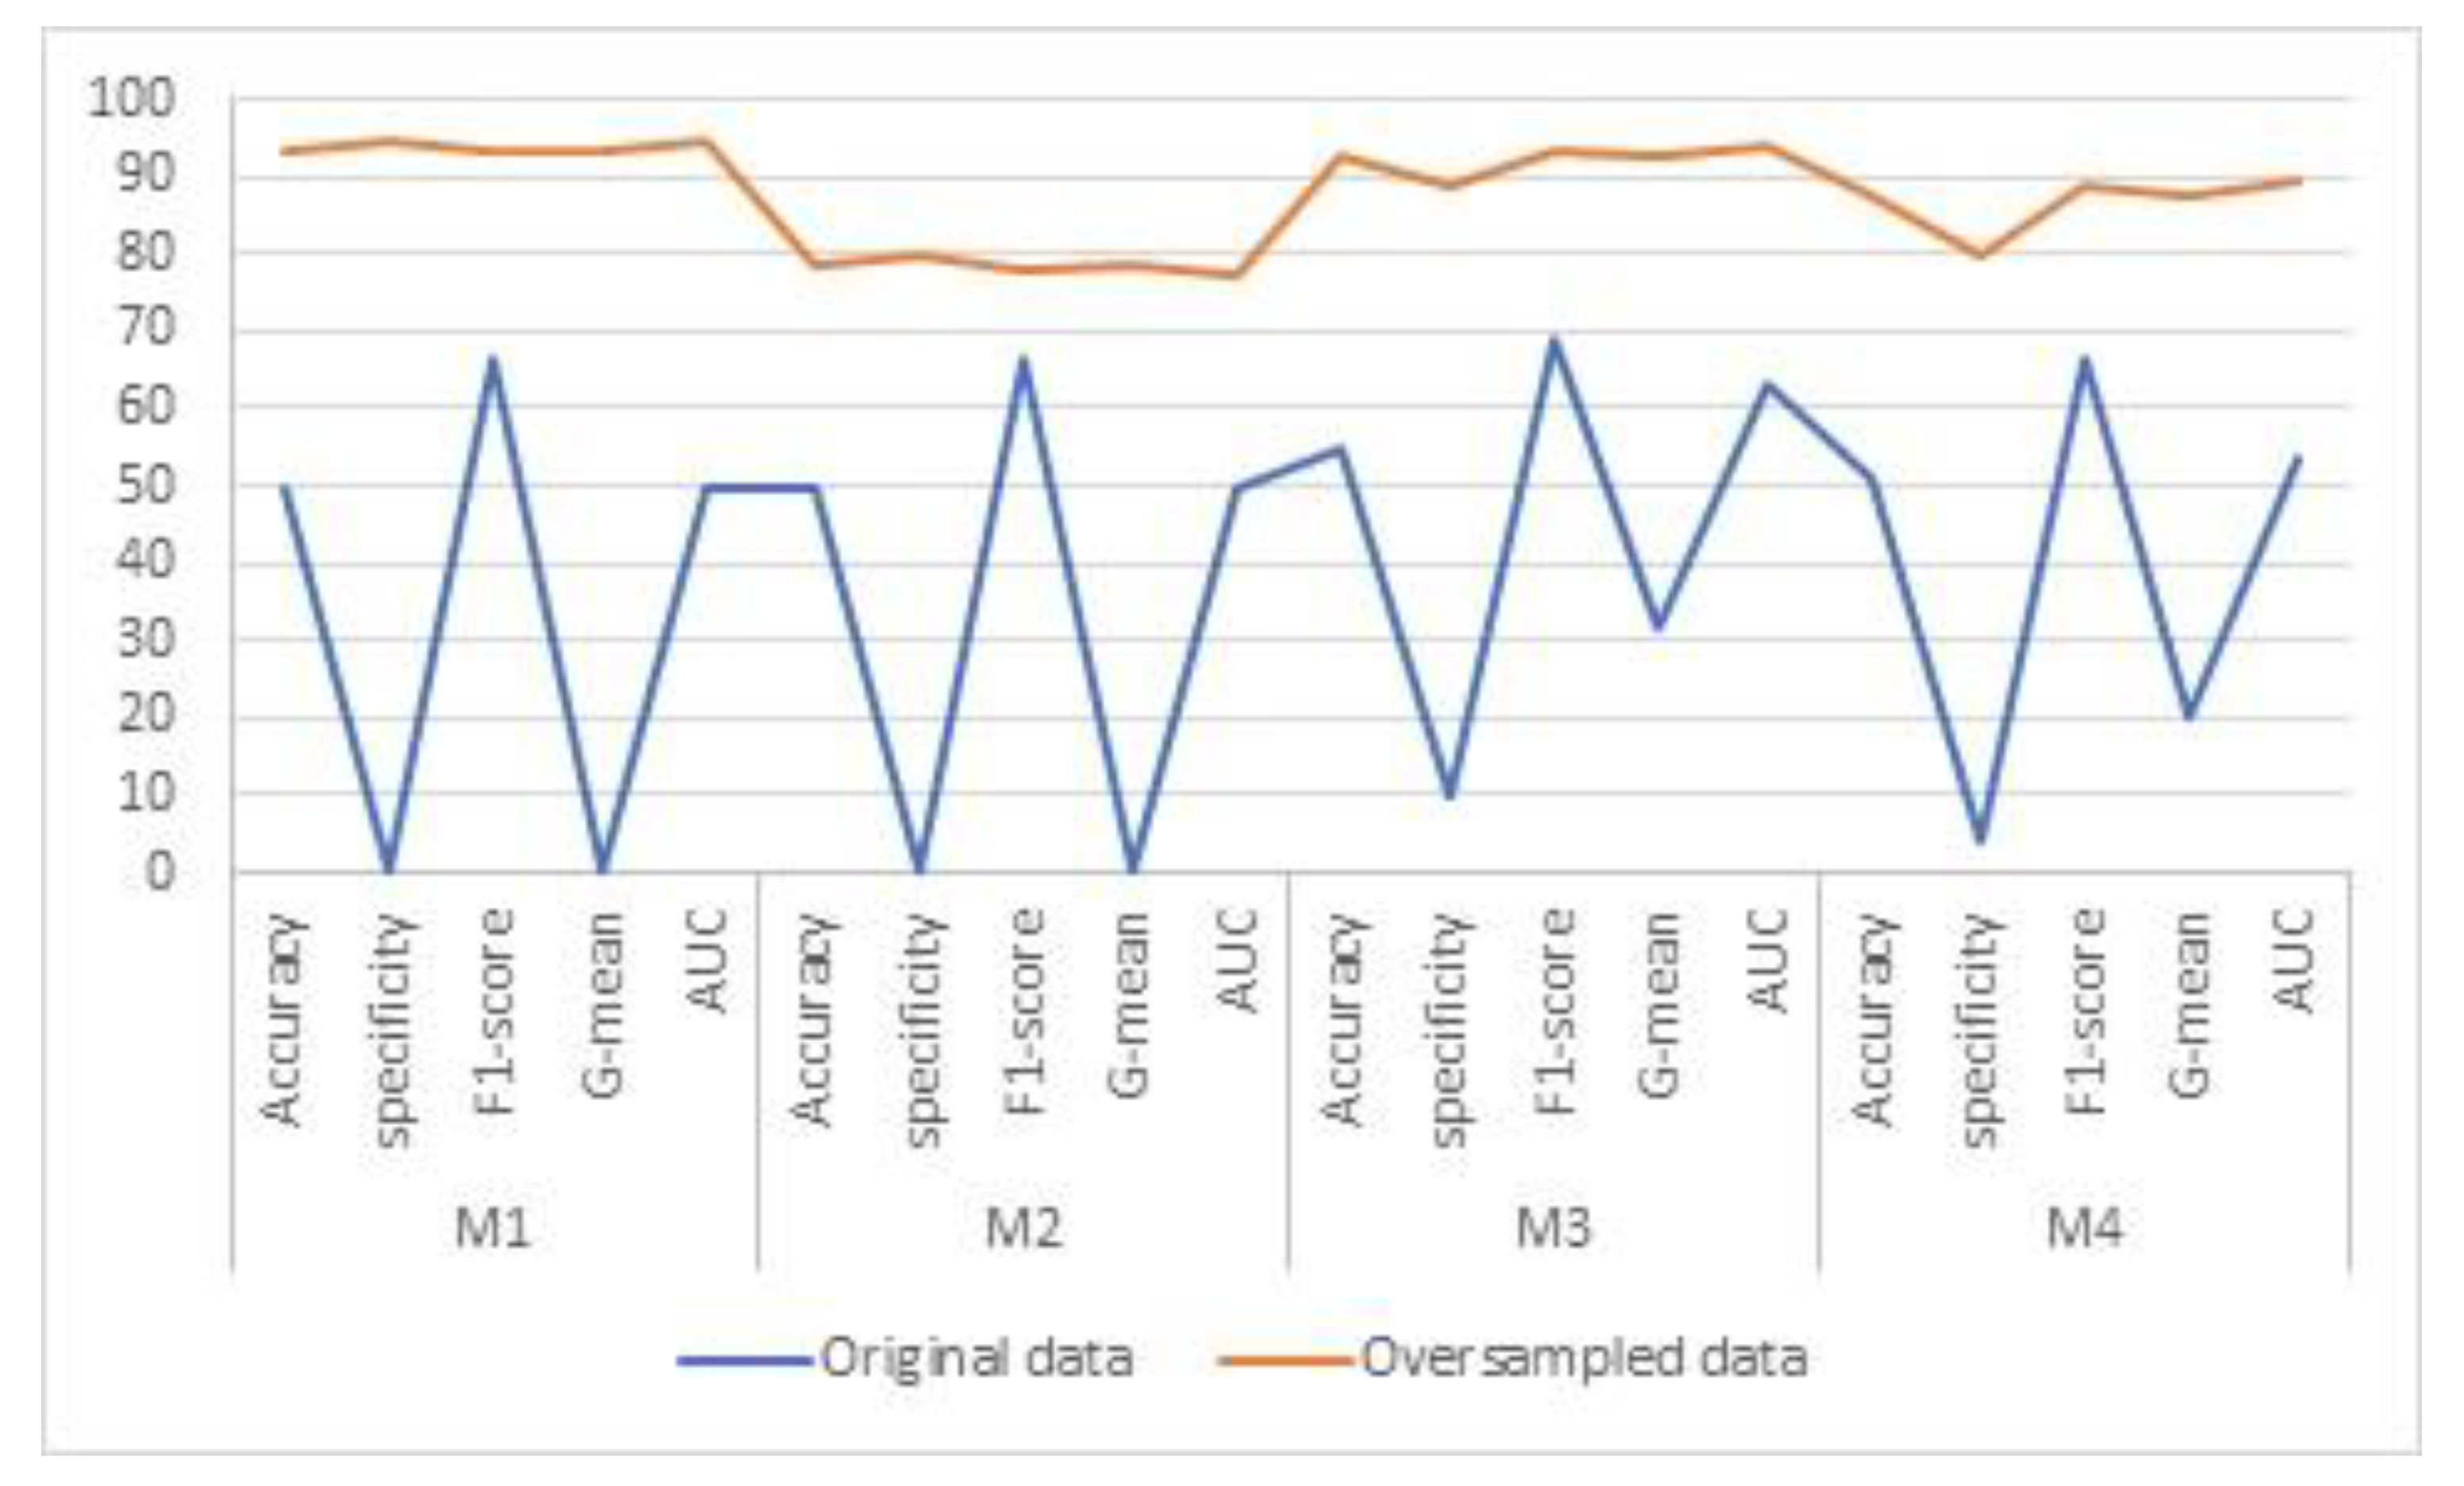
Figure 7 shows the result of different classification algorithms of original data and oversampled data. M1 is data synthesis based on weight and extension algorithms, M2 is the FCNN model, M3 is the SVM algorithm, and M4 is the LSTM network model. The effects of data quantification on model performance were also included in the experiment instead of using zero. Physiological parameters are quantified with a small value close to zero. The data in the figure is the result of data extension and correction.
Table 2 shows the experimental results of all oversampling methods, including the random oversampling algorithm, the ADASYN algorithm, the classic SMOTE algorithm and oversampling methods that improved on SMOTE. A0 does not use any oversampling algorithm, A1 is a random oversampling algorithm, A2 is a classic SMOTE algorithm, A3 is a Borderline SMOTE algorithm, A4 is a K-Means SMOTE algorithm, A5 is an SVM SMOTE algorithm, A6 is an ADASYN algorithm, A7 is a SMOTE-NC algorithm and A8 is based on the IOWA operator SMOTE algorithm. The influence of data quantization on model performance is also included in the experiment. The data in the table are the result of data extension and correction. By comparing the experimental results, the SMOTE algorithm based on the IOWA operator SMOTE algorithm is the most effective in classifying the data.
Train the extension model using both raw and composite data. The recognition rate of different algorithms on the same verification set was used to evaluate the model performance. We compare the performance of the extension model, FCNN, SVM and LSTM with original data and oversampled data, respectively, in the non-extended, oversampled and oversampled categories. The results of accuracy, specificity and F1-score of different models were shown in Table 3, Table 4 and Table 5, respectively. M1 is data synthesis based on weight and extension algorithms, M2 is the FCNN model, M3 is the SVM algorithm and M4 is the LSTM network model.
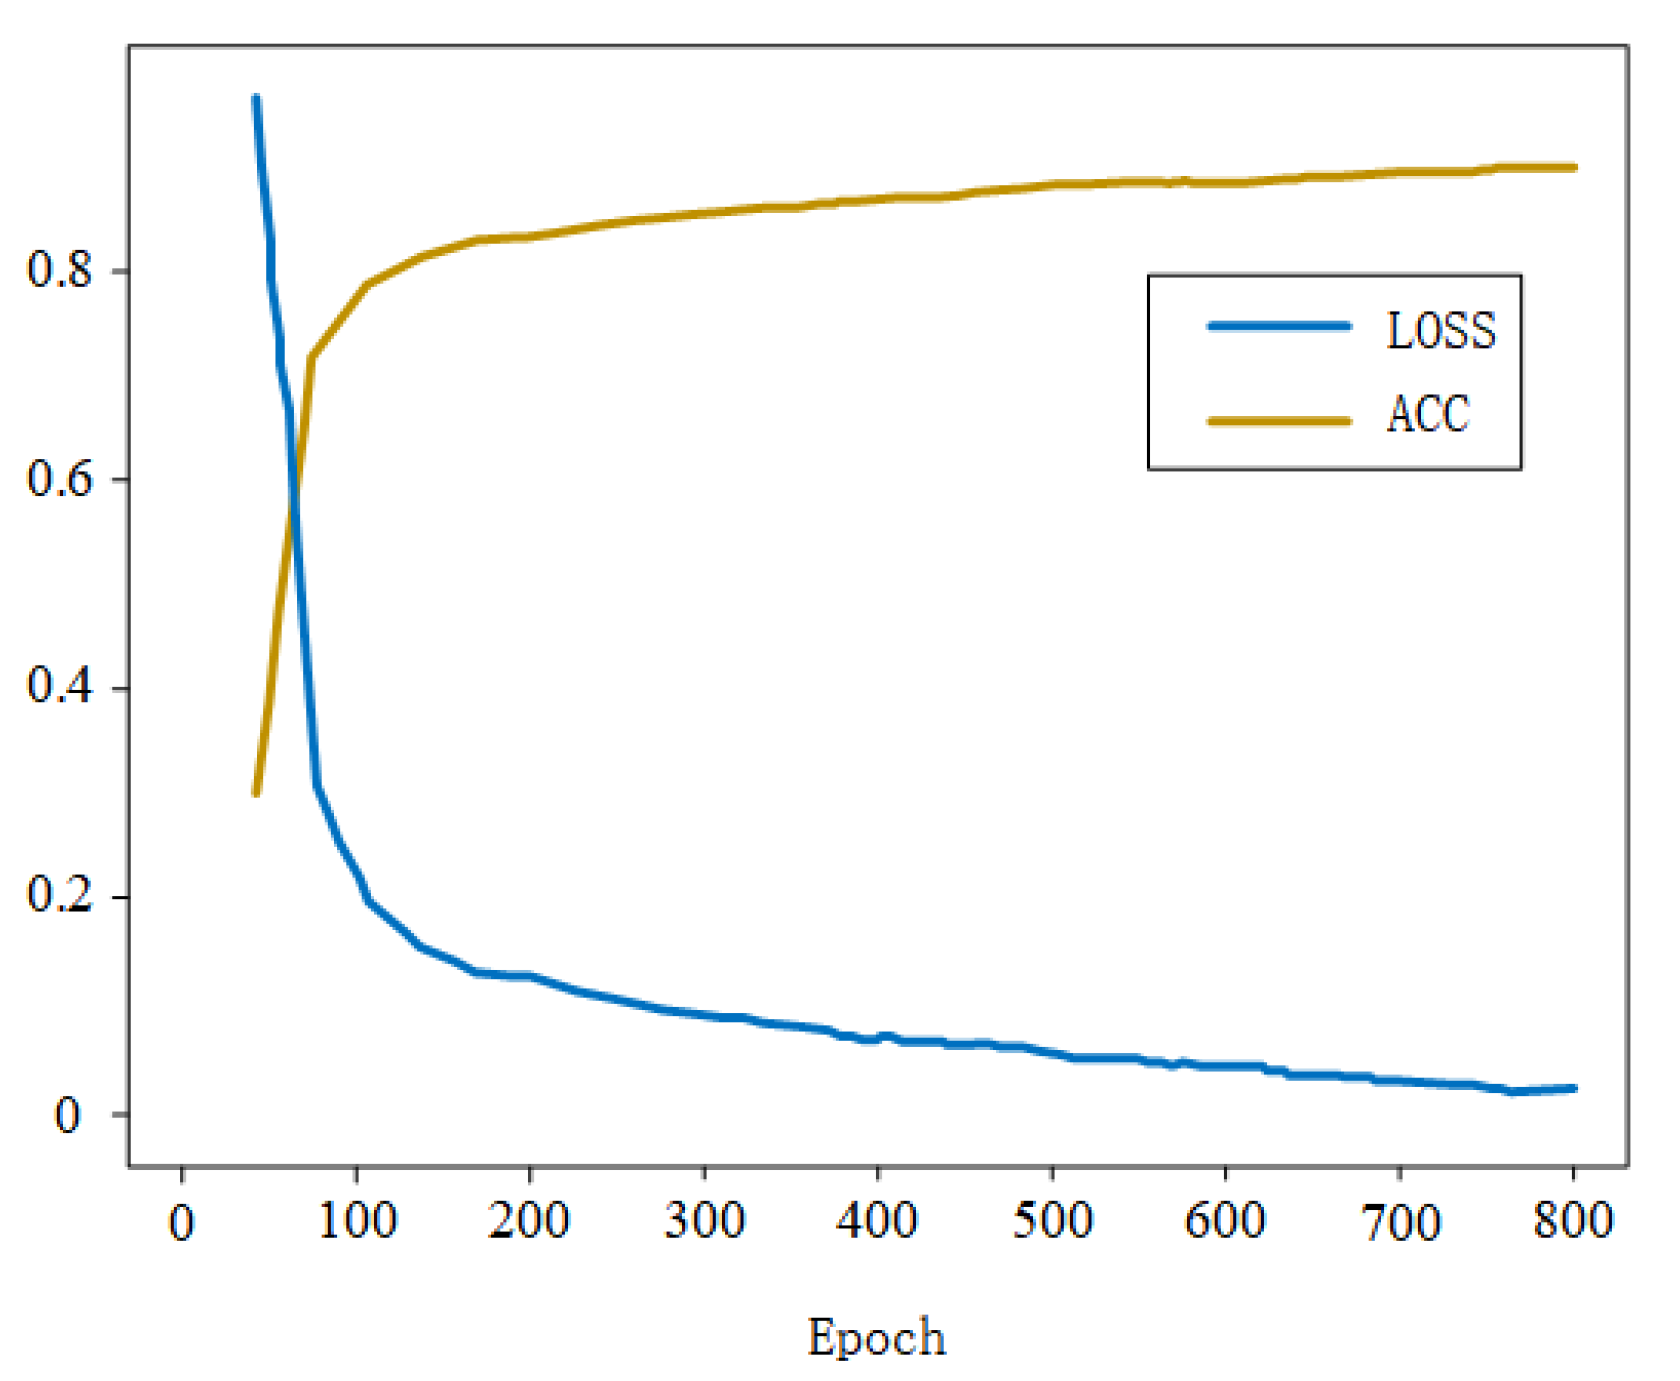
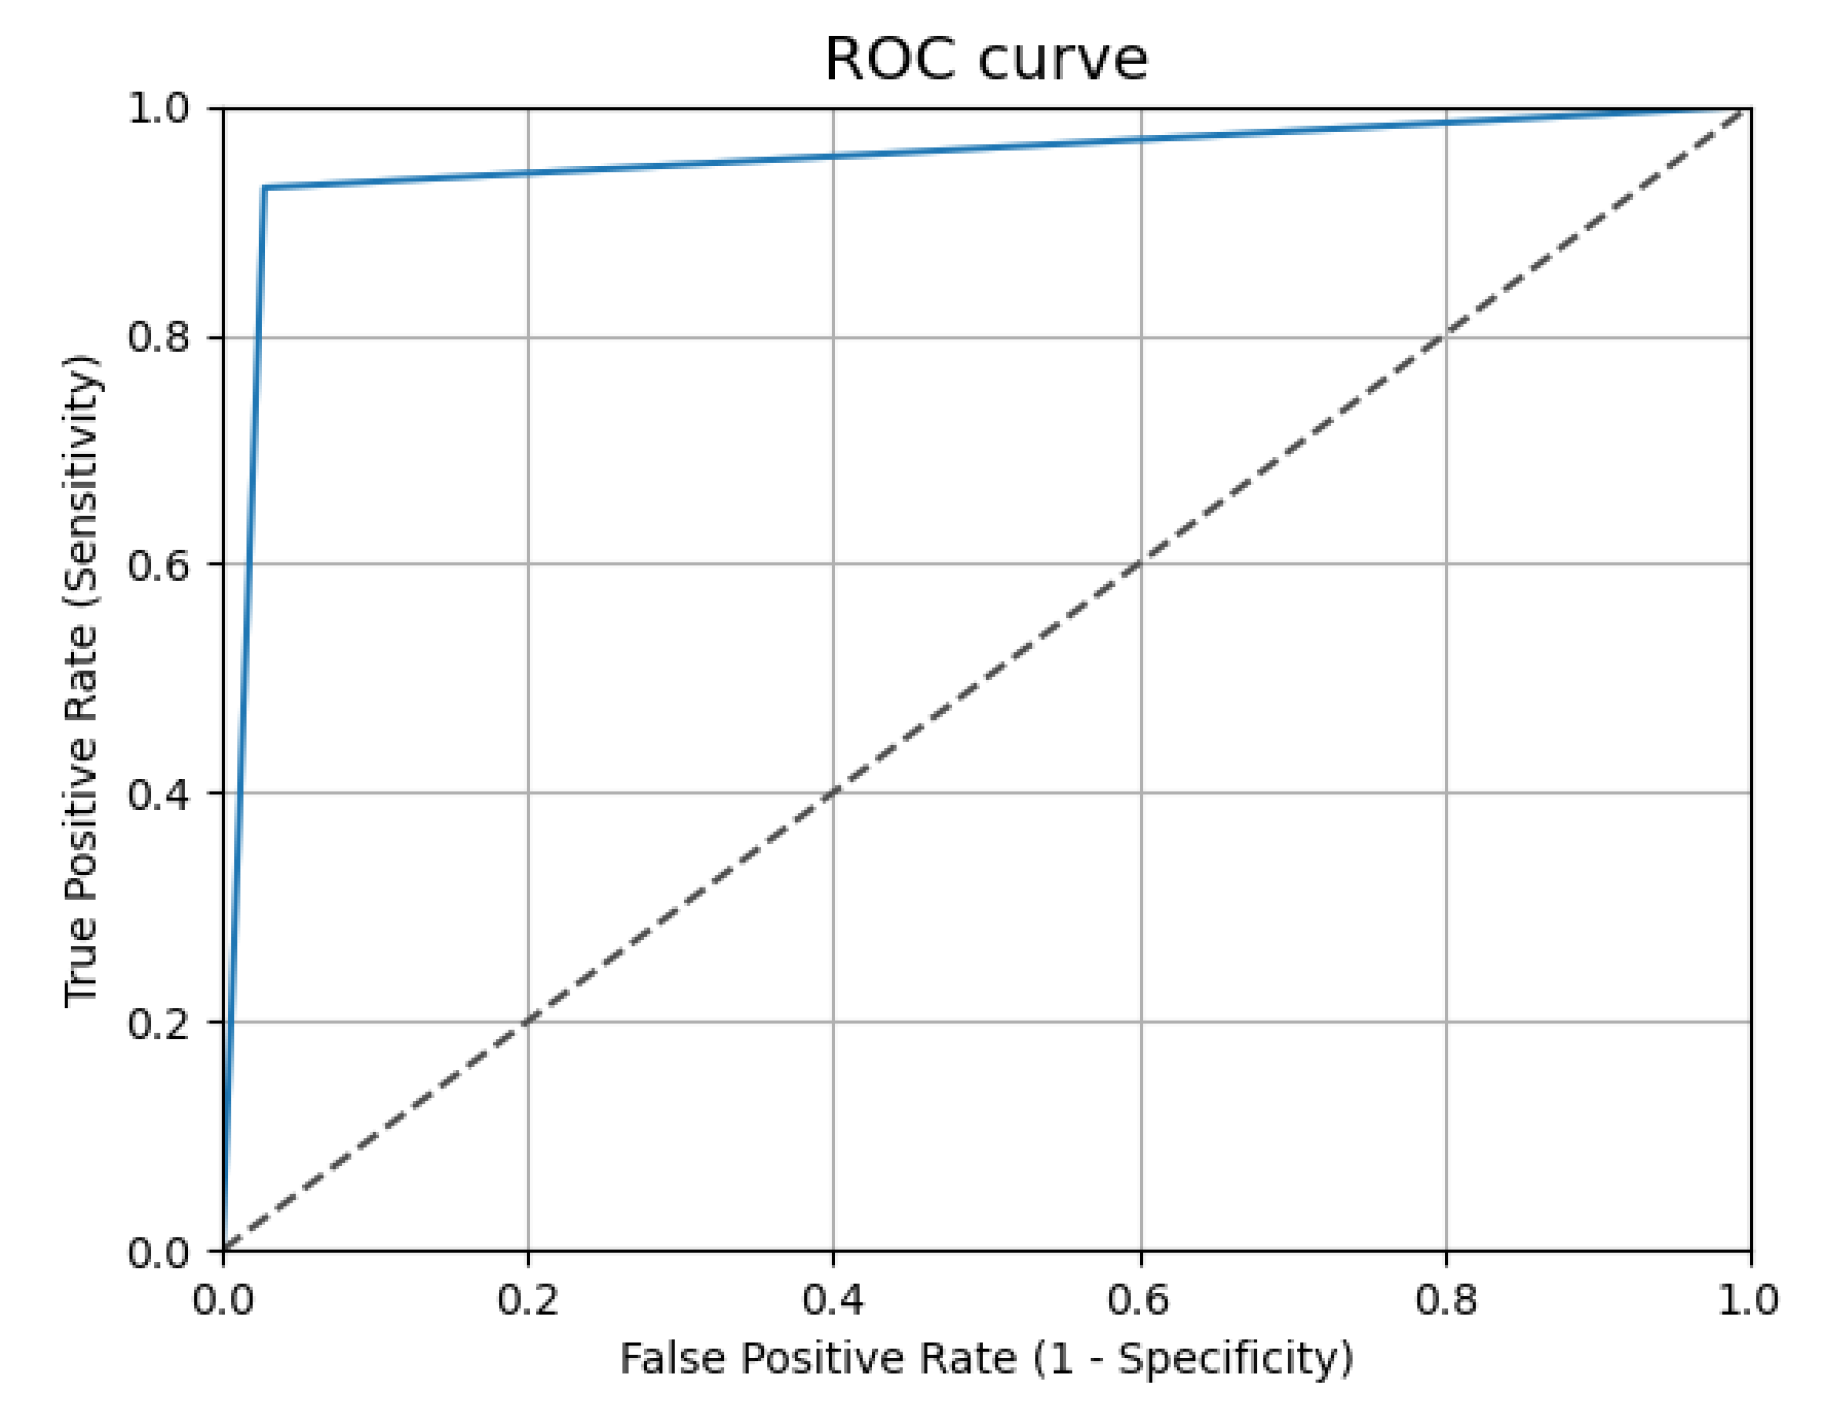
Data synthesis based on weight and extension algorithm accuracy and the loss of the training set are shown in Figure 8. The best performance of the model on the training set is about 93% accuracy and about 4% loss value. The model can judge the health status of unknown samples well. The ROC curve was also used to evaluate the ability of the model to diagnose diseases, as shown in Figure 9. The area under the curve (AUC) was 94.37%.

4. Discussion

As shown in Figure 7, the data model is better trained by the oversampled data than the oversampled data without data composition. Due to the small amount of diabetic cardiovascular disease data in the original data, the weight of the model training will be biased towards the most samples, and the diseased samples in the test data will be divided into non-diseased ones. Compared with the original dataset, the accuracy, specificity, F1-score, G-mean and AUC of the sampled dataset were significantly increased. It shows that the classification effect of the balanced data based on the IOWA operator SMOTE algorithm is better than that of the unbalanced data. It shows high sample recognition ability by using data synthesis based on weight and extension algorithms. In the aspect of analyzing text medical data especially unbalanced data are synthesized by a few class samples which shows great advantages. From the data level, the results in Table 2 show that the synthesized data based on the IOWA operator SMOTE algorithm is more consistent with the characteristics of the original data than the SMOTE algorithm and the ADASYN algorithm, which may improve the performance of data classification.
The way that the data are quantified can also affect the performance of the model. In the experiment, we quantified the data in different forms. As shown in Table 3, data modification can improve the accuracy of the model in the verification set. The corrected data may make more inputs valid. Further analysis of Table 3, Table 4 and Table 5 shows that the performance of data synthesis based on weight and extension algorithms has been improved when trained using the same extended dataset, so the proposed algorithm has the powerful ability to improve model robustness. Even when there is less raw data, the proposed algorithm also has a better performance in the identification of text-like medical data and has a strong ability to effectively diagnose.
Meanwhile, the accuracy and loss of data synthesis based on weight and extension algorithms are shown in Figure 8. As shown in Figure 9, the best performance achieved by the model on the training set is the accuracy of about 93%, the loss value of about 4% and the area under the curve (AUC) is 94.37%. It has proved that the proposed model has good learning ability and generalization ability and can judge the health status of unknown samples well. Although extended learning allows higher recognition accuracy with less relevant original data, its performance is still inferior to the model trained with very large data training. However, when a new convolutional neural network is trained with large amounts of data, it takes a lot of time to achieve good performance. In this case, it is difficult to verify the performance of each modified algorithm in time, which will take a lot of time. Although the amount of data in the extended dataset has increased compared with the original dataset, the total amount is still relatively small, so the training time of the model is correspondingly less. Therefore, the extended learning algorithm can also be more efficient in training time than the large-scale dataset. When the original data are small, data synthesis based on weight and extension algorithms is a better choice. Meanwhile, it is a very difficult task to collect enough raw medical data to train a blank convolutional neural network. Therefore, data synthesis based on weight and extension algorithms is applied to the pre-training of neural networks to achieve better results in less time before using a large amount of other medical data.

5. Conclusions

Using medical text data to construct an accurate and robust auxiliary diagnosis system is the premise of realizing medical intelligent diagnosis. The goal of this smart medical diagnosis is to reduce the clinician’s workload. Data synthesis based on weight and extension algorithms was evaluated on the actual medical dataset and obtained an accuracy of 93.53% and specificity of 94.37%, which confirms that it is an improved solution compared to other algorithms. It not only saves social resources and medical resources but also shortens the medical treatment cycle.
It has been proved that the quantization method of non-digital medical data will also affect the performance of the model. In addition, the data balance is also related to the attributes of the dataset itself, and there may be deviations between the distribution of samples in the training dataset and the distribution of overall samples. Therefore, we strive to achieve higher generalization ability by exploring more quantization methods of non-digital medical data in future. We will focus on the auxiliary diagnosis of various human diseases in future. Besides blood and urine parameters, there is other physiological information that can be used to diagnose different diseases. To identify more types of diseases, we plan to collect more types of medical text data to extend the existing dataset and study the model’s performance in diagnosing different diseases.

Author Contributions

Conceptualization, W.Y. and Y.L.; methodology, W.Y. and Y.G.; software, W.Y. and Y.G.; validation, W.Y., Y.G. and Y.L.; formal analysis, W.Y., Y.G. and Y.L.; investigation, W.Y. and Y.L.; writing—original draft preparation, W.Y. and Y.G.; writing—review and editing, W.Y. and Y.G.; visualization, W.Y. and Y.L.; supervision, W.Y. and Y.L.; project administration, W.Y.; funding acquisition, W.Y. All authors have read and agreed to the published version of the manuscript.

Funding

This research was funded by the Science and Technology Program of Tianjin, grant number 21YDTPJC00500.

Institutional Review Board Statement

Not applicable.

Informed Consent Statement

Informed consent was obtained from all subjects involved in the study. Written informed consent has been obtained from the patients to publish this paper.

Data Availability Statement

Data are unavailable due to privacy or ethical restrictions.

Acknowledgments

The authors thank the editors and anonymous reviewers for their constructive suggestions.

Conflicts of Interest

The authors declare no conflict of interest.

References

  1. Ogurtsova, K.; Da Rocha Fernandes, J.D.; Huang, Y.; Linnenkamp, U.; Guariguata, L.; Cho, N.H.; Cavan, D.; Shaw, J.E.; Makaroff, L.E. IDF diabetes atlas global estimates for the prevalence of diabetes for 2015 and 2040. Diabetes Res. Clin. Pract. 2017, 128, 40–50. [Google Scholar] [CrossRef] [PubMed]
  2. Padmalayam, I. Targeting mitochondrial oxidative stress through lipoic acid synthase: A novel strategy to manage diabetic cardiovascular disease. Cardiovasc. Hemato.l Agents Med. Chem. 2012, 10, 223–233. [Google Scholar] [CrossRef] [PubMed]
  3. Liu, Y.; Zhang, Q.; Zhao, G.; Liu, G.; Liu, Z. Deep learning-based method of diagnosing hyperlipidemia and providing diagnostic markers automatically. Diabetes Metab. Syndr. Obes. Targets Ther. 2020, 13, 679–691. [Google Scholar] [CrossRef] [PubMed]
  4. National Research Council. Toward Precision Medicine: Building a Knowledge Network for Biomedical Research and a New Taxonomy of Disease; National Academies Press: New York, NY, USA, 2011. [Google Scholar]
  5. Zhang, Z.; Tang, M.A. Domain-based, adaptive, multi-scale, inter-subject sleep stage classification network. Appl. Sci. 2023, 13, 3474. [Google Scholar] [CrossRef]
  6. Kolachalama, V.B.; Garg, P.S. Machine learning and medical education. NPJ Digital. Med. 2018, 1, 54. [Google Scholar] [CrossRef]
  7. Rajendra, A.U.; Faust, O.; Adib, K.N.; Suri, J.S.; Yu, W. Automated identification of normal and diabetes heart rate signals using nonlinear measures. Comput. Biol. Med. 2013, 43, 1523–1529. [Google Scholar] [CrossRef]
  8. Gu, P.; Yang, Y. Oversampling algorithm oriented to subdivision of minority class in imbalanced data set. Comput. Eng. 2017, 43, 241–247. [Google Scholar]
  9. Liu, X.Y.; Wu, J.; Zhou, Z.H. Exploratory under-sampling for class-imbalance learning. IEEE Trans. Syst. Man Cybern. Part B (Cybern.) 2008, 39, 539–550. [Google Scholar]
  10. Sun, J.; Knoop, S.; Shabo, A.; Carmeli, B.; Sow, D.; Syed-Mahmood, T.; Rapp, W.; Kohn, M.S. IBM’s health analytics and clinical decision support. Yearb. Med. Inform. 2014, 23, 154–162. [Google Scholar] [CrossRef]
  11. Sun, Y.; Wong, A.K.; Kamel, M.S. Classification of imbalanced data: A review. Int. J. Pattern Recognit. Artif. Intell. 2009, 23, 687–719. [Google Scholar] [CrossRef]
  12. Douzas, G.; Bacao, F.; Last, F. Improving imbalanced learning through a heuristic oversampling method based on k-means and SMOTE. Inf. Sci. 2018, 465, 1–20. [Google Scholar] [CrossRef]
  13. Jedrzejowicz, J.; Jedrzejowicz, P. GEP-based classifier for mining imbalanced data. Expert Syst. Appl. 2021, 164, 114058. [Google Scholar] [CrossRef]
  14. Liu, X.; Zhou, H.; Wang, Z.; Liu, X.; Li, X.; Nie, C.; Li, Y. Fully convolutional neural network deep learning model fully in patients with type 2 diabetes complicated with peripheral neuropathy by high-frequency ultrasound image. Comput. Math. Methods Med. 2022, 2022, 5466173. [Google Scholar] [CrossRef]
  15. Lipton, Z.C.; Kale, D.C.; Elkan, C.; Wetzel, R. Learning to diagnose with LSTM recurrent neural networks. arXiv 2015, arXiv:1511.03677. [Google Scholar]
  16. Yi, Z.; Li, S.; Yu, J.; Tan, Y.; Wu, Q.; Yuan, H.; Wang, T. Drug-drug Interaction extraction via recurrent neural network with multiple attention layers. In Advanced Data Mining and Applications: 13th International Conference, ADMA 2017, Singapore, 5–6 November 2017; Springer: Berlin/Heidelberg, Germany, 2017. [Google Scholar]
  17. Antoniou, A.; Storkey, A.; Edwards, H. Data Augmentation Generative Adversarial Networks; The University of Edinburgh: Edinburgh, UK, 2018. [Google Scholar]
  18. Merigó, J.M.; Casanovas, M. A new Minkowski distance based on induced aggregation operators. Int. J. Comput. Intell. Syst. 2011, 4, 123–133. [Google Scholar] [CrossRef]
  19. Yang, W.; Zhao, M.; Huang, Y.; Zheng, Y. Adaptive online learning based robust visual tracking. IEEE Access 2018, 6, 14790–14798. [Google Scholar] [CrossRef]
  20. Gers, F.A.; Schmidhuber, J.; Cummins, F. Learning to forget: Continual prediction with LSTM. Neural Comput. 2014, 12, 2451–2471. [Google Scholar] [CrossRef]
  21. Cireşan, D.; Schmidhuber, J. Multi-column deep neural networks for offline handwritten Chinese character classification. In Proceedings of the 2015 International Joint Conference on Neural Networks (IJCNN), Killarney, Ireland, 12–16 July 2015; IEEE: Piscataway, NJ, USA, 2015. [Google Scholar] [CrossRef]
  22. Amini, P.; Ahmadinia, H.; Poorolajal, J.; Amiri, M.M. Evaluating the high-risk groups for Suicide: A comparison of logistic regression, Support Vector Machine, Decision Tree and Artificial Neural Network. Iran. J. Public Health 2016, 45, 1179–1187. [Google Scholar]
  23. Simard, P.Y.; Steinkraus, D.; Platt, J.C. Best practices for convolutional neural networks applied to visual document analysis. In Proceedings of the 7th International Conference on Document Analysis and Recognition, IEEE Computer Society, Edinburgh, UK, 3–6 August 2003; p. 958. [Google Scholar]
  24. Liu, Y.; Zhang, Q.; Zhao, G.; Qu, Z.; Liu, G.; Liu, Z.; An, Y. Detecting diseases by human-physiological parameter-based deep learning. IEEE Access 2018, 7, 2169–3536. [Google Scholar] [CrossRef]
  25. Fram, E.B.; Moazami, S.; Stern, J.M. The effect of disease severity on 24-hour urine parameters in kidney stone patients with type II diabetes. Urology 2016, 87, 52–59. [Google Scholar] [CrossRef]
  26. Salhen, K.A.; Mahmoud, A.Y. Hematological profile of patients with type 2 diabetic mellitus in El-Beida, Libya. Ibnosina J. Med. Biomed. Sci. 2017, 9, 76–80. [Google Scholar] [CrossRef]
  27. Acharya, U.R.; Faust, O.; Sree, S.V.; Ghista, D.N.; Dua, S.; Joseph, P.; Ahamed, V.I.T.; Janarthanan, N.; Tamura, T. An integrated diabetic index using heart rate variability signal features for diagnosis of diabetes. Comput. Methods Biomech. Biomed. Eng. 2013, 16, 222–234. [Google Scholar] [CrossRef] [PubMed]
  28. Chawla, N.V.; Bowyer, K.W.; Hall, L.O.; Kegelmeyer, W.P. SMOTE: Synthetic minority over-sampling technique. J. Artif. Intell. Res. 2002, 16, 321–357. [Google Scholar] [CrossRef]
  29. Chiclana, F.; Herrera-viedma, E.; Herrea, F.; Alonso, S. Some induced ordered weighted averaging operators and their use for solving group decision-making problems based on fuzzy preference relations. Eur. J. Oper. Res. 2007, 182, 383–399. [Google Scholar] [CrossRef]
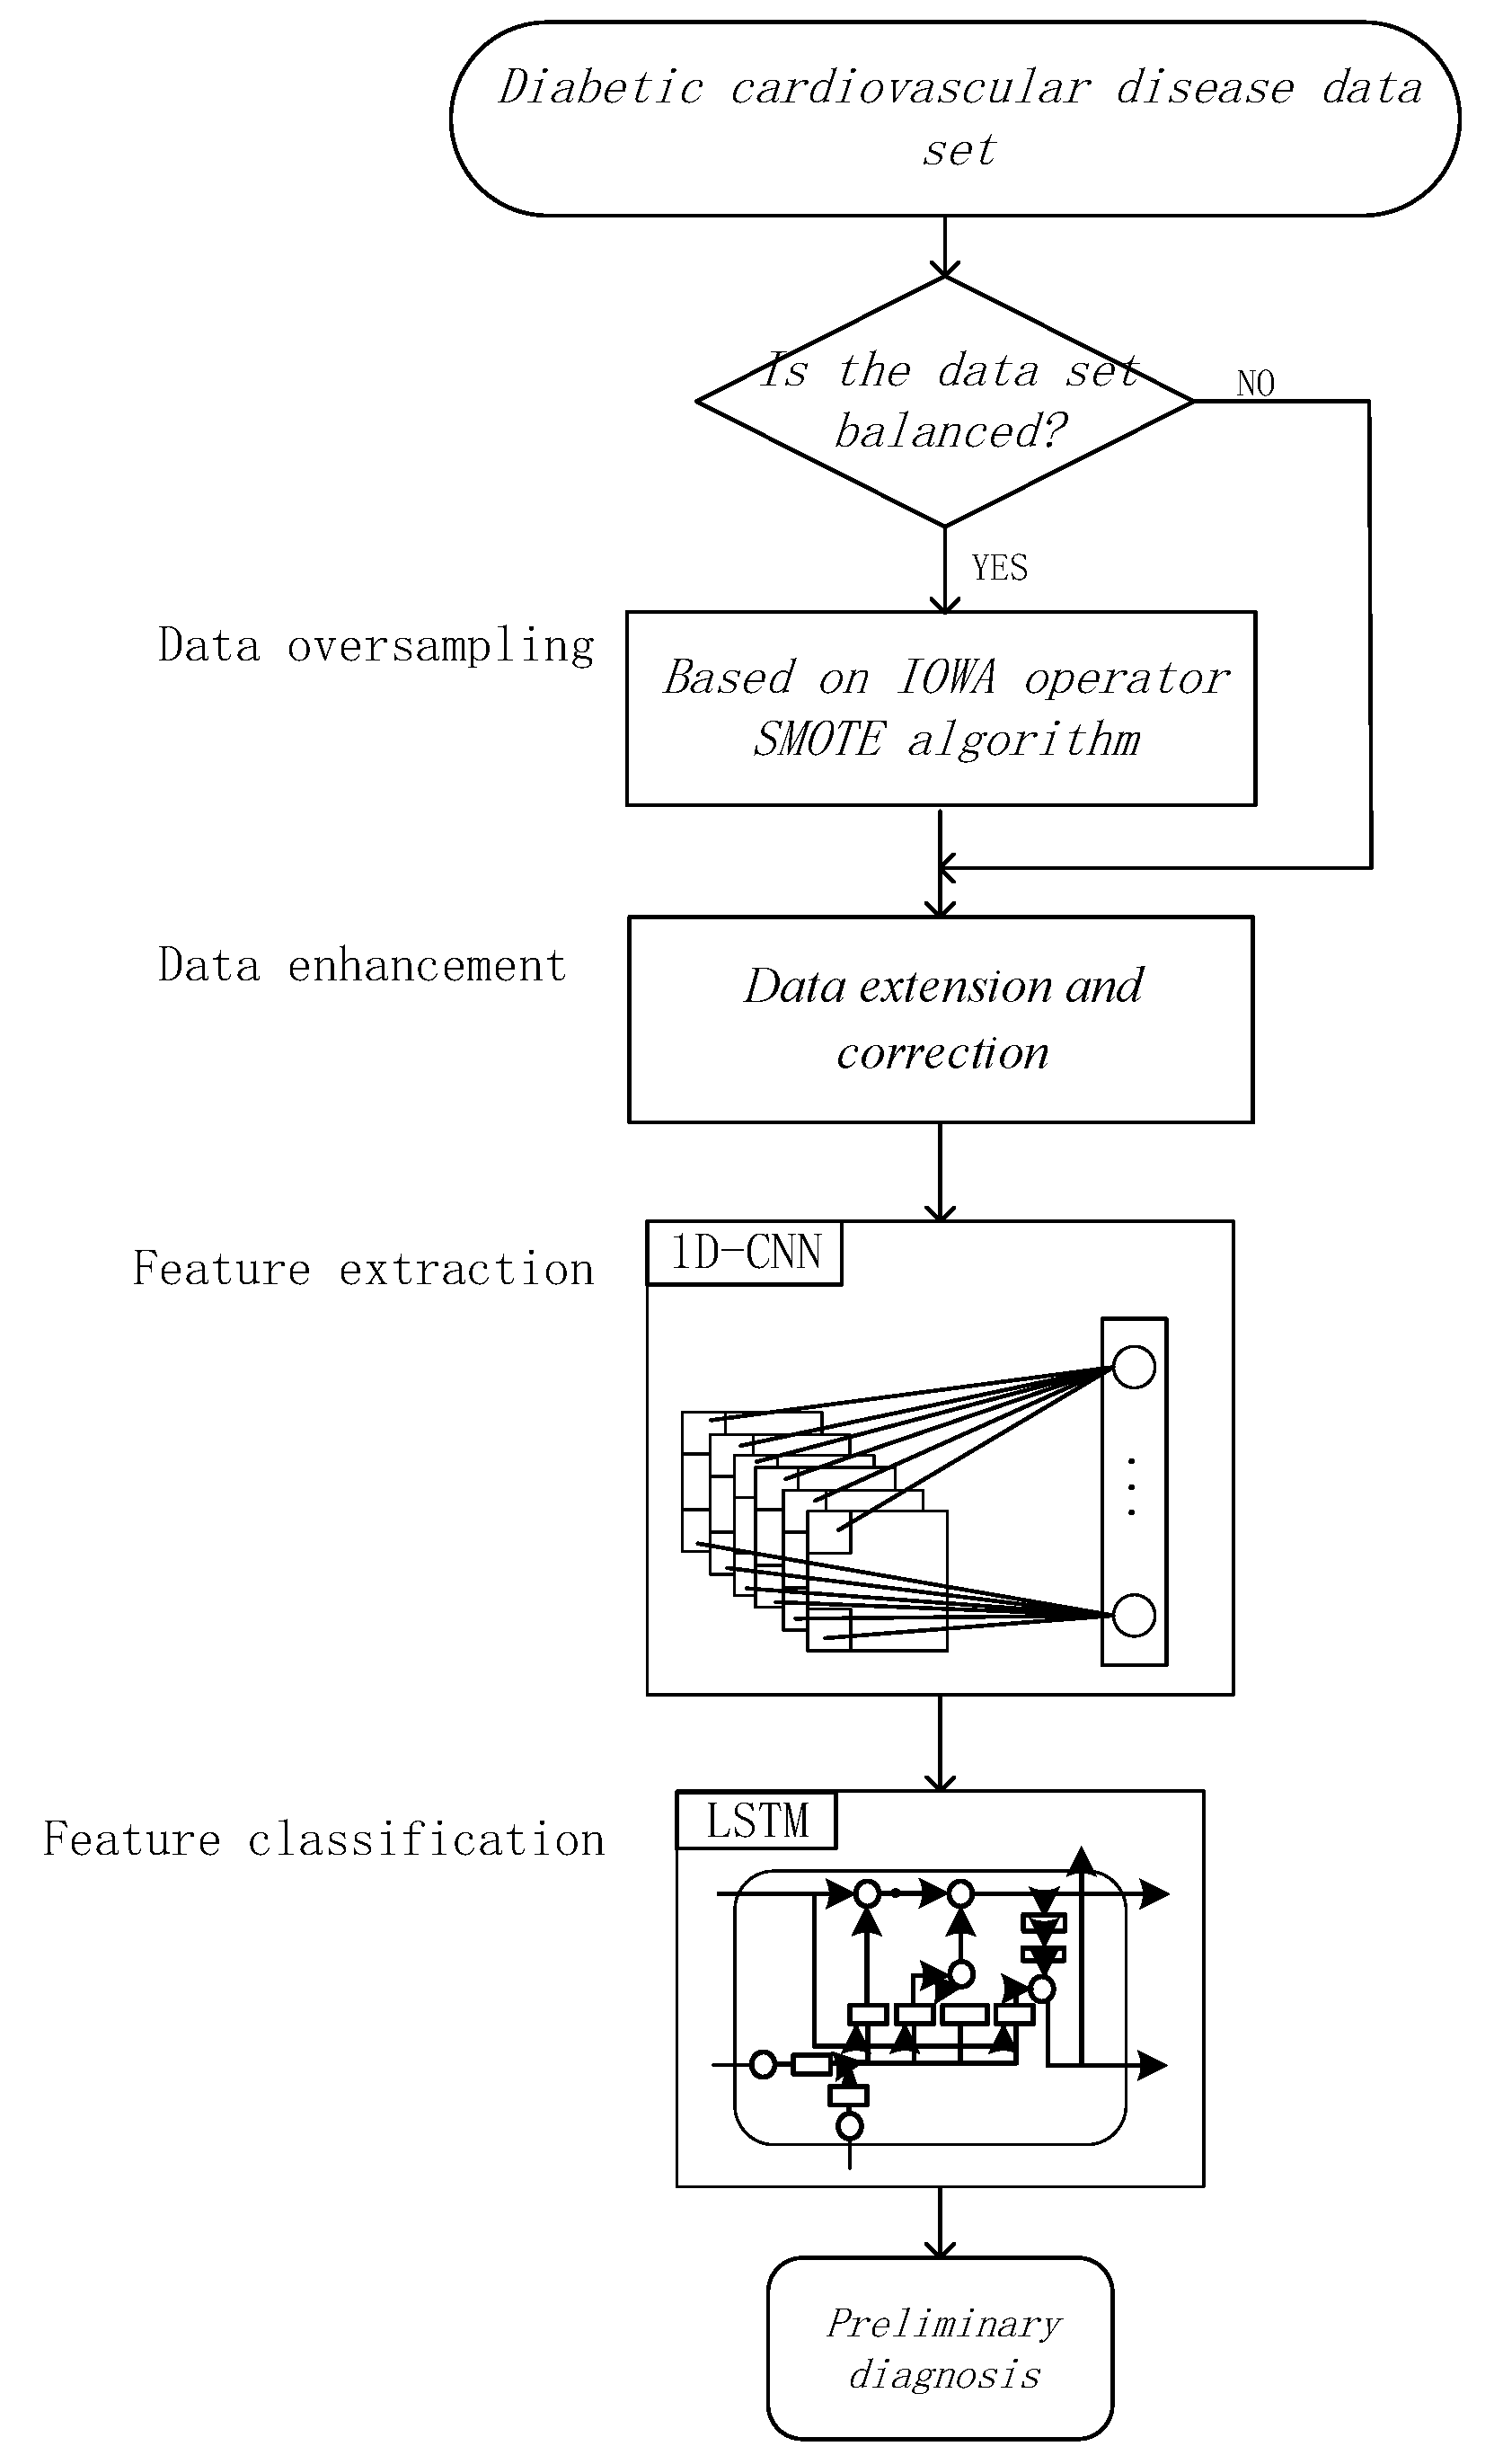
Figure 1. Data synthesis based on weight and extension algorithms flow charts.
Applsci 13 05449 g001
Figure 2. Schematic diagram of one-dimensional convolution algorithm.
Applsci 13 05449 g002
Figure 3. LSTM cell structure diagram.
Applsci 13 05449 g003
Figure 4. Biomedical data indicator heat map.
Applsci 13 05449 g004
Figure 5. Dataset distribution of diabetic cardiovascular disease.
Applsci 13 05449 g005
Figure 6. Data distribution before and after data amplification. (a) The data distribution before SMOTE is based on the IOWA operator; (b) the data distribution after SMOTE is based on the IOWA operator.
Applsci 13 05449 g006
Figure 7. The result of different classification algorithms of raw data and oversampled data.
Applsci 13 05449 g007
Figure 8. Loss value and accuracy curve of the training set.
Applsci 13 05449 g008
Figure 9. ROC curve of data synthesis based on weight and extension algorithms.
Applsci 13 05449 g009
Table 1. Discrete data thermal coding table.
Discrete IndexCoding Standard
GenderMale = 01, Female = 10
LEU“−” = 001,
“+/−” = 010,
“+” = 100
ERY
NIT
PRO
GLC
KET
URO
BR
Urine colorLight yellow = 0001,
Amber = 0010,
Brown = 0100,
Red = 1000
Abbreviation: LEU = Urinary leukocyte; ERY = Urine erythrocyte; NIT = Urinary nitrite; PRO = Urine protein; GLC = Urinary glucose; KET = Ketone body; URO = Urobilinogen; BR = Bilirubin.
Table 2. Comparison of results of different oversampling methods.
AccuracySpecificityF1-ScoreG-MeanAUC
A050066.67050
A159.3549.1563.7758.1360.03
A28891.387.587.994.72
A366.9458.6265.8168.2270.7
A472.2265.0371.7772.8774.12
A560.7557.6658.8761.1161.55
A6766877.7875.5877.6
A793.5794.3793.3393.594.37
A0 is not use any oversampling algorithm, A1 is random oversampling algorithm, A2 is classic SMOTE algorithm, A3 is Borderline SMOTE algorithm, A4 is K-Means SMOTE algorithm, A5 is SVM SMOTE algorithm, A6 is ADASYN algorithm, A7 is based on IOWA operator SMOTE algorithm.
Table 3. Accuracy of trained models (%).
M1M2M3M4
Original dataUnextended and Uncorrected52.2952.8655.7155
Extended Uncorrected5052.1452.1450
Extension and Correction50505550.71
Oversampled dataUnextended and Uncorrected8078.5191.4387.85
Extended Uncorrected92.1478.5191.4391.43
Extension and Correction93.5778.5192.8575.71
M1 is data synthesis based on weight and extension algorithms, M2 is FCNN model, M3 is SVM algorithm, M4 is LSTM network model.
Table 4. Specificity of trained models (%).
M1M2M3M4
Original dataUnextended and Uncorrected11.435.7112.8510
Extended Uncorrected05.715.712.86
Extension and Correction00104.29
Oversampled dataUnextended and Uncorrected95.7181.4395.7195.71
Extended Uncorrected71.438095.7171.43
Extension and Correction94.378088.5780
M1 is data synthesis based on weight and extension algorithms, M2 is FCNN model, M3 is SVM algorithm, M4 is LSTM network model.
Table 5. F1-score of trained models (%).
M1M2M3M4
Original dataUnextended and Uncorrected6867.966968.97
Extended Uncorrected 0.6667.3167.3266.02
Extension and Correction0.6666.6768.9766.34
Oversampled dataUnextended and Uncorrected91.8578.5291.3391.33
Extended Uncorrected 79.5478.5691.3375.6
Extension and Correction93.3378.5692.7687.5
M1 is data synthesis based on weight and extension algorithms, M2 is FCNN model, M3 is SVM algorithm, M4 is LSTM network model.
Disclaimer/Publisher’s Note: The statements, opinions and data contained in all publications are solely those of the individual author(s) and contributor(s) and not of MDPI and/or the editor(s). MDPI and/or the editor(s) disclaim responsibility for any injury to people or property resulting from any ideas, methods, instructions or products referred to in the content.