Article

Stream-DBSCAN: A Streaming Distributed Clustering Model for Water Quality Monitoring

1
Fisheries College, Ocean University of China, Qingdao 266001, China
2
School of Computer and Control Engineering, Yantai University, Yantai 264005, China
3
Deepsim Intelligence Technology Inc., Abbotsford, BC V2T 0G9, Canada
*
Author to whom correspondence should be addressed.
Appl. Sci. 2023, 13(9), 5408; https://doi.org/10.3390/app13095408
Submission received: 15 March 2023 / Revised: 17 April 2023 / Accepted: 18 April 2023 / Published: 26 April 2023

Abstract

:

Featured Application

Stream-DBSCAN algorithm is suitable for processing complex high-dimensional water quality data and can guide water quality detection more scientifically and intelligently.

Abstract

With the increasing use of wireless sensor networks in water quality monitoring, an enormous amount of streaming data is generated by widely deployed sensors. However, the current batch mode used for data analysis can no longer meet the diverse combination of monitoring indicators and the requirement for timely analysis results on an all-weather basis. To overcome these challenges and analyze a large amount of water quality data quickly and accurately, we propose a stream-DBSCAN distributed stream processing clustering model. First, real-time data streams are processed using the distributed stream computing framework Flink. Then, the DBSCAN clustering algorithm is applied to cluster each dataset as a different dimension of the cluster. Finally, the time distribution characteristics of the data in the same cluster are analyzed to identify the water quality variation rules. The system can extract data noise points and identify sudden deterioration of water quality. We tested the model using datasets on three water quality indices, pH, ammonia nitrogen (NH4N), and turbidity, in the Yantai Menlou Reservoir from May to August 2019. The results demonstrate that the system can efficiently and quickly perform cluster analysis on streaming data. By analyzing the clustering results, we found that the daily variation of water quality and sudden pollution events in the Menlou Reservoir are consistent with the actual situation.

1. Introduction

In recent years, the growing population and rising living standards have led to a significant increase in human demand for water resources. As a result, the amount of freshwater available has fallen below the critical threshold required for human survival [1].
Due to the extremely imbalanced distribution of water resources, the northern and northwestern regions of China are facing a freshwater emergency threat [2]. In recent years, ecological construction has been considered one of the most important factors in China’s economic development, and water resource protection has become a top priority [3]. This is why there are currently so many water quality monitoring systems for lakes, rivers, and reservoirs. Water quality detection involves establishing a reasonable model through a series of analytical methods to identify patterns in water quality changes, allowing for the prediction of future trends [4,5]. The water quality detection model can achieve risk warnings for water sources and improve the emergency response capability for sudden pollution [6].
The Menlou Reservoir in Yantai, China started constructing in 1958, and it was completed in 1960. The reservoir watershed area is over 1077 square kilometers. It is the main drinking water source supplying 70% water for the urban area of Yantai City. In this connection, the Menlou Reservoir performs an essential role in Yantai City [7]. The water quality of Menlou Reservoir is directly related to the development of the city and the life of residents. Therefore, the government attaches great importance to water quality monitoring in the reservoir and deployed a large number of sensors to obtain real-time water quality information. Many scholars and experts have also carried out research on the water quality monitoring in the Menlou Reservoir. Jiang Zhenbo et al. [8] proposed to design the Menlou Reservoir management information system platform based on the problems in the existing management system of Menlou Reservoir. Scholars have also completed a lot of research on the water quality of Menlou Reservoir. Wang Yan et al. [9] established a water quality prediction model for Menlou Reservoir when the water reached a moderate nutrient level in 2013 and proposed nutritive prevention and control measures suitable for Menlou Reservoir.
The sensor group used to detect water quality information in Menlou Reservoir continuously transmits water quality indicators to the computer. This information has strong timeliness [10] characteristics, and its actual value is inversely proportional to time. Therefore, the water quality monitoring work must not only meet the objective requirements and standards for the quality of the results but also ensure real-time data processing [11]. If the traditional batch mode is used to process water quality indicators, it is impossible to grasp changes in the water body in time, resulting in lagging management measures. Stream processing, on the other hand, is a framework for receiving, processing, and outputting information in real-time, unlike the batch processing mechanism.
Currently, with the abundance of water quality data, it is essential to establish appropriate models to analyze water quality in real-time to detect changes and predict future changes. To address various water quality issues, scholars have developed diverse water quality analysis models for practical solutions. Zhou et al. [12] employed the canonical correlation model and neural network model to study the primary factors affecting water quality changes in the Three Gorges Reservoir and developed a prediction model for water quality changes. Zhao et al. [13] tackled the limitations of traditional water quality detection models in processing high real-time high-frequency data and proposed a water quality big data processing platform that combined wavelet decomposition with the LSTM model. The above research provides guidance for reservoir water quality monitoring from various perspectives. Di et al. [14] presented a method combining expected maximum value (EM) and partitioning around medoids (PAM), and several detection methods, such as Welch t-test, Wilcoxon test, and Spearman correlation, to analyze the water quality of the Yangtze River. Mandel et al. [15] used a density algorithm to sort probes and achieve intelligent management of large-scale water distribution networks (WDN). Vries et al. [16] tested three machine learning methods, namely, day dependent support vector regression (SVR) models, adaptive orthogonal projection, and unsupervised clustering technology, for anomaly detection of flow, pressure, conductivity, and temperature in water quality. The experimental results showed that these methods had limited effectiveness when dealing with significant data volumes and complex data attributes. While machine learning and other methods have been employed for intelligent water quality management, the challenge of real-time data representation for massive data streams remains an urgent issue to be addressed.
Based on the previously mentioned research idea, this paper proposes a distributed clustering modelling framework called “stream-DBSCAN”. The framework leverages the Flink distributed parallel computing model as the data processing platform to optimize the classical density clustering DBSCAN algorithm. The improved DBSCAN algorithm is deployed to the Flink distribution as the core algorithm of the computing node, thus enabling the density clustering DBSCAN algorithm to have the ability of distributed parallel computing when combined with the streaming data processing mode.
Using the indices of ammonia nitrogen (NH4N), pH value, and turbidity of Menlou Reservoir from May to August in 2019, water quality indices were clustered into several categories. The relationship between water quality and time was then analyzed based on the clustering results.

2. Method Principle

Currently, we are facing massive amounts of high-dimensional streaming data, which can be difficult to process efficiently due to limited computing power and memory. However, distributed streaming computing methods can enable high-speed data processing. In terms of water quality detection, using clustering algorithms to classify water quality indices into different categories can improve rapid analysis of water variation situations. The density-based DBSCAN algorithm can achieve water quality clustering and detect abnormal points of numerical mutation, enabling water management departments to rapidly understand the situation of water quality variation.

2.1. Distributed Streaming Data Processing

The key challenge in processing big data is to discover new knowledge and laws from data that have low value density, irregular distribution, and deeply hidden information. This represents a significant shift from big data to big knowledge to big decision-making [17]. In the era of big data, new technologies and methods have been developed to improve the ability to use vast amounts of data for decision-making and knowledge discovery [18]. The most common method for data analysis is called data mining [19]. Data mining uses efficient data analysis and mining rules to process vast volumes of data and uncover potential connections and patterns between data attributes. In the 4V attributes of big data, data timeliness is given top priority in the processing of big data. With the sheer volume of data available, finding hidden knowledge in a short period is crucial for big data processing. Scholars have developed mining algorithms for massive data that have approached optimal tempo-spatial complexity after several iterations. However, the computing power of computers is still inadequate to meet the requirements of processing massive data within a short period. The main reasons for this are summarized as follows:
The first issue is that batch mode processing renders data generated earlier meaningless because it requires reading, calculating, and outputting data in batches, bundling data at different time scales for input and output. To address these problems, stream data processing was proposed to overcome the shortcomings of batch processing. In stream data processing, data is continuously transmitted into memory in the form of streams and processing results are returned immediately after being processed. As a result, stream data processing provides more timely processing results [20].
The second issue is that due to the large amount of data and high data dimensionality, the computing power of a single computer is insufficient to process massive data. Not only does the calculation take a longer time, but the memory also cannot store such a huge amount of data. However, stream processing reads data only once, and the memory does not have to load the entire batch of data, enabling the computer to process a large amount of data without overflowing the memory. The problem of insufficient computing power can be solved using distributed computing, where the amount of computation is allocated to each computer node, and the data results can be obtained at a very low cost through merging rules.
In recent years, numerous clustering algorithms have been introduced in data mining to enhance the speed and scalability of processing big data. These clustering algorithms can be broadly divided into two categories [21]: single-machine-based clustering and distributed multi-machine clustering. As distributed clustering can fundamentally overcome the limitation of computing capability, the research of some clustering algorithms has gradually shifted from a single-machine approach to a distributed approach.

2.2. Density Based Clustering Algorithm

The most significant difference between density-based clustering algorithms and other methods is that the former use density as the basis for algorithm judgment. Before starting clustering, density-based algorithms require setting relevant density thresholds. Such algorithms only consider the density values of neighboring points within a certain range and do not rely on setting centroids, thus avoiding the impact of distance and direction factors on the clustering process. This allows for clustering of irregularly shaped datasets based on their shape and extension trends and overcomes the impact of noise points that do not have clustering on the clustering results.
Classic density-based clustering algorithms include OPTICS, DPC, DENCLUE, DBSCAN, among others. Although density-based clustering algorithms have high clustering accuracy, they still have some issues that require improvement. For instance, Cheng [22] proposed the LDP-MST clustering algorithm based on the classic MST clustering algorithm, to address the impact of noise points on the algorithm’s time consumption. In Du [23], it was suggested that the use of a pair of thresholds in traditional three-way clustering methods cannot accurately represent the clustering structure, and the threshold is difficult to determine. To address this issue, they proposed a multistep three-way clustering (M3W), which improves the probability of correct data allocation by constructing multi-step data structures and corresponding allocation strategies.
This article focuses on the time-consuming nature of the traditional clustering algorithm DBSCAN when processing massive stream data. It proposes parallelizing the DBSCAN algorithm using the distributed Flink framework and a result merging rule that acts on the main node. This enables each parallelized result to be reasonably merged into the final result. Although the above methods have improved density-based algorithms under certain specific conditions, improving their applicability and accuracy, traditional density clustering algorithms are still simple and efficient, and consume less time when facing massive data. Therefore, this article chooses the traditional DBSCAN algorithm as the model clustering algorithm.

2.3. DBSCAN Algorithm

The DBSCAN algorithm is a density-based clustering method that was first proposed by Martin Ester to address the challenge of irregularly shaped data sets and widely scattered clusters. This algorithm divides clusters based on the density of the data, which enables it to accurately restore the original data’s shape characteristics. DBSCAN uses data density as the testing criterion to achieve continuity in clustering, resulting in a highly precise clustering effect with low time and space complexity. As a result, it has become the most famous density clustering algorithm [24].
The DBSCAN algorithm relies on two important parameters, Eps and MinPts, which will be adjusted to obtain the experimental results:
Eps represents the radius around the data coordinate point and specify the coordinate point as the center of the circle, Within the radius of Eps, the points around the center point are counted to calculate the density attribute of the point. Eps, as a radius, often uses the L2 norm distance, also known as the Euclidean distance. Count the points around the center point within the radius of Eps to calculate the density attribute of the points. For example, point y belongs to the X dataset, where C δ ( x ) represents a subsample set containing samples X with a distance of no more than Eps from x:
C δ ( x ) = { y X : dist ( x , y ) Eps }
The parameter MinPts represents the minimum number of surrounding points, specifying the minimum number of neighbor points within the circle’s radius of Eps. Using these two parameters, Eps and MinPts, the DBSCAN algorithm classifies data points into three categories:
(1)
Core point: Taking the point k as the center and Eps as the radius, there exists {x1, x2, …, xn}. If C δ ( x ) > Minpts, it means that the density attribute of point k meets the requirements, and the point k will be recorded as the core point of a certain cluster. In this sense, all points in the range of Eps from point k will be ‘density reachable’.
(2)
Boundary point: Taking the point k as the center and Eps as the radius, there exists {x1, x2, …, xn}. If C δ ( x ) < MinPts and point k is point reachable by the direct density of a point within the radius of Eps, point k will be a boundary point.
(3)
Noise point: Taking the point k as the center and Eps as the radius, there exists {x1, x2, …, xn}. If C δ ( x ) < MinPts and there is no core point in the Eps range, point k will be recorded as the noise point.
In the DBSCAN algorithm, reference density is transitive. If the density of 𝐾1 can reach 𝐾2 and the density of 𝐾2 can reach 𝐾3, then the densities of 𝐾1 and 𝐾3 are reachable. Similarly, if 𝐾2 and 𝐾3 make 𝐾1 density reachable, then 𝐾2 and 𝐾3 density are reachable. The DBSCAN algorithm connects the density-reachable points together to form clusters of clustering results. Compared with other clustering algorithms, the above-mentioned clustering mechanism of DBSCAN makes it unnecessary to preset the number of clusters and it can also exclude noise interference data through the density clustering process, which is part of reason why this paper chooses it as the core algorithm of the model.
Density-based clustering algorithms are commonly utilized to address irregular data sets and relatively dispersed clusters. In contrast to the K-means algorithm, the DBSCAN algorithm does not require the initial number of clusters K to be set, nor does it rely on the distance between the centroid point and the decision point for clustering. Instead, it depends on the parameters Eps and MinPts to constrain the density around each point. The key advantage of the DBSCAN algorithm lies in its superior control. When processing water quality data, the granularity of water quality clustering can be controlled by adjusting the parameters of Eps and MinPts. Additionally, the DBSCAN algorithm does not need to backtrack and reread previous data, and it allows for easier merging after partition calculation in the clustering process. These characteristics are crucial reasons for selecting the DBSCAN algorithm as the core processing algorithm in this paper.
Currently, parallelization of the DBSCAN algorithm is a significant area of improvement. Shi et al. [25] proposed the SDKB-DBSCAN algorithm, which combines kernel density estimation with irregular dynamic partitioning and boundary merging. This algorithm achieves parallelization of the DBSCAN algorithm and demonstrates some improvements in accuracy and calculation speed. In this paper, we also parallelized the DBSCAN algorithm by incorporating it with the Flink framework.

2.4. Flink

Flink is a distributed stream processing platform that has emerged in recent years, originating from the Stratosphere project. Its main function is to distribute streaming data, which is characterized by stateful computations of both boundless and bounded streaming data. Flink can adapt to all common cluster environments and compute data of any size in memory storage. Next, Flink will be introduced from several aspects.
(1)
Batch and stream processing:
In Spark, all data is processed in batches. Offline data is processed in a large batch, while real-time data is processed in an infinite number of smaller batches. In contrast, Flink processes all data in the form of streams. Offline data is bounded, while real-time data is unbound. Flink treats batch processing as bounded flow processing, relying on precise time control and stateful running of applications.
(2)
Overview of system architecture:
Similar to other streaming data processing frameworks, Flink uses a master-slave architecture composed of four parts: JobManager, ResourceManager, TaskManager, and Dispatcher. Figure 1 illustrates the interaction of these components after application submission.
(1)
Layered architecture
Flink is a distributed platform for stream processing that follows a layered architecture, where each upper layer depends on services provided by the lower layer. Flink can be divided into four main layers:
Deployment layer: This layer covers the installation methods of Flink, such as local, cluster, and cloud server.
Core layer: This layer provides all the core implementations that support Flink computing.
API layer: This layer implements the DataStream API for unbounded streams and the DataSet API for bounded streams, which are used for stream and batch processing, respectively.
Library layer: This layer is the application architecture layer of Flink, which builds computing frameworks that meet specific application scenarios on top of different types of API layers. The hierarchical architecture of Flink is depicted in Figure 2.
(2)
Features of Flink
Flink boasts the following seven key features:
High throughput and low latency: Flink can process millions of data events per second with a computing speed of milliseconds.
Event Time: Flink supports window calculations based on event time for unordered stream data, ensuring processing results’ accuracy.
State Management: Flink 1.4 provides state management, which stores intermediate results generated by previous calculations in memory, eliminating the need to count all data each time during stream processing. This approach reduces computational resource consumption and greatly improves computational efficiency.
Highly Flexible Windows: Flink’s windows can flexibly change to cope with complex streaming modes, including time-, count-, session-, and data-driven types.
High Error Tolerance: Flink supports distributed snapshot technology and can recover tasks from Checkpoints when a parallel node encounters a problem.
Independent Memory Management: Flink implements a memory self-management mechanism, which reduces the impact of JVM and GC on resource usage. It also serializes and deserializes data into binary and stores it in memory, effectively improving memory utilization.
Save Point Mechanism: Flink sets the Save Points mechanism to save the execution of the task in a snapshot manner when processing infinite stream data. When the task restarts, it can restore its working state by reading the Save Points.
Table 1 shows a comparison between Flink, Storm, and Spark Streaming, demonstrating the various advantages of Flink over the other two platforms. These features make Flink the ideal choice for the later work discussed in this article.

3. Stream-DBSCAN Water Quality Detection Clustering Model

The Stream-DBSCAN model, proposed in this paper, integrates the benefits of easy merging in DBSCAN clustering algorithms with the high efficiency of Flink’s distributed stream processing framework. This not only significantly reduces the time required to process massive data, but also reduces memory requirements. Furthermore, the DBSCAN algorithm is capable of noise reduction, filtering out anomalous data points, which results in improved clustering accuracy when dealing with large datasets.

3.1. Water Quality Data Sampling

The Menlou Reservoir’s water quality parameters are gathered through a wireless sensor network. The sensors measure various parameters, such as NH4N, pH, temperature, and flow rate, and transmit this data to a computer system through an aggregation gateway [26]. Unlike traditional manual sampling methods, the wireless sensor network increases sampling frequency, accelerates information transmission speed, and enhances the real-time value of data [27]. This paper utilizes a high-density dataset, generated by numerous sensors in the Menlou Reservoir, with small time granularity and coherence.

3.2. Water Quality Data Preprocessing

This paper conducted an experiment using water quality indicators from Menlou Reservoir in Yantai City between May and August 2019. NH4N, pH value, and turbidity were selected as the indicators to study the change and time period of water quality in the reservoir.
Higher data sampling frequency enables the detection of instantaneous changes in water quality over time. However, this results in duplicate data for data analysis, which wastes computing resources. Therefore, before stream clustering, the original data was periodically sampled. Ultimately, 200,000 data points were obtained after resampling from the original 1.2 million data at the same time interval.
Through data preprocessing, it was found that the dispersion effect of pH value data was small, while the data dispersion degrees of NH4N and turbidity were relatively large. The numerical change rate of these two indicators fluctuated from 0 to 1000. In the multi-index clustering system, the data often presents different dimensions due to the different actual meanings of each clustering index. When there is a large difference in the order of magnitude of each index of the data, clustering the original data values directly will highlight the characteristics of indicators with higher orders of magnitude and larger rates of change. This can weaken the changes of low-level data sets.
To ensure the validity of the clustering results, this paper used the minmax normalization method to process the original data. The original three-dimensional data was linearly transformed, and the values were mapped to a range of [0, 1]. The following is the min-max normalization formula:
y i = X I min 1 j n X j max 1 j n X j min 1 j n X j
where x i represents the original data value and y i represents the normalized value, respectively.

3.3. Build the Model

To establish the relationship between water quality and time from the water quality data, the Stream-DBSCAN model employs a clustering method to group the pH, ammonia nitrogen, and turbidity indicators into clusters. The model then combines data points with similar indicators into a single cluster, allowing each cluster to represent a specific class of water conditions. The process of Stream-DBSCAN model construction can be expressed as follows:
(1)
The Stream-DBSCAN model utilized experimental data from the Menlou Reservoir between May to August 2019, focusing on three water quality indicators: NH4N, pH, and turbidity. Since the magnitude of each dimension in the experimental data varied significantly, the model first standardized and sampled the data to ensure that the results considered the impact of each dimension while avoiding redundancy in similar data operations.
(2)
To ensure the streaming nature of the dataset, the Stream-DBSCAN model employs Kafka to convert sensor-generated data into a continuous data stream prior to clustering. The stream processor in Kafka can continually collect the data stream, apply built-in processing to adjust it, and output the stream in real-time. Within this framework, Kafka combines data generated by the NH4N, pH, and turbidity sensors based on a common timestamp attribute before transmitting the data stream to the Flink framework. By utilizing Kafka, the model benefits from high throughput and low latency, allowing it to process hundreds of thousands of data points per second with only a few microseconds of delay.
(3)
During the data partitioning stage, it is crucial to consider whether the partitioning results will result in larger clusters during the clustering process and decrease the number of noise points. Once Kafka passes the data stream into Flink, the DataStream must be converted into KeyedStream using keyBy for data partitioning. To ensure the partitioning is reasonable in this model, we implement the K-means algorithm [28] to perform rough clustering of the dataset [29], dividing data with similar values into the same KeyedStream. If the data is directly inputted into each node without rough clustering, numerous small-scale clusters will appear in the clustering results, and some points that should be in the cluster will be misjudged as noise points, resulting in rejection before cluster merging [30]. Considering that the dataset’s size is not too significant, this model opts to divide it into three. The rough clustering process of the dataset using the K-means algorithm is as follows: Using K cluster centroid points μ1, μ2, ……, μK, the following clustering process occurs for each 3D data point η𝑖:
C i = a r g   min j x i μ j 2
Among them, C i is the class closest to point i among the K classes, and the value range of C i is 1–K. x i is the data point to be determined, and   μ j represents each centroid point.
For the K generated clusters, their centroids μ𝑖 have the following iterative formulas:
μ i = i = 1 m C i = j x i i = 1 m C i = j  
The Stream-DBSCAN model utilizes the K-means algorithm to coarsely cluster data, yielding K data streams that exhibit internal similarities and external differences.
(4)
During the process of distributed clustering, the selection of data parallelism K is crucial in determining whether the processing time is acceptable. Therefore, the K value is adjusted according to the size of the data, and the selection of K should strike a balance between the computing power of the computer and the time-consuming curve of the clustering algorithm. An optimal value of K will control the data processing time of each computer node within a manageable time cost. In the case of the three data streams generated in process (3), the Stream-DBSCAN model employs three independent nodes to perform parallel operations on the data streams. Three tasks are set up in Flink to receive the KeyedStream generated after the partition. Each node is assigned a task, and the DBSCAN algorithm is utilized to cluster the dataset in each node. When the DBSCAN algorithm runs on each node, it chooses appropriate values of Eps and Minpts based on the number of data and the rate of change of the value. After the node completes the calculation task, the result is returned to the master node. At this point, the distributed clustering phase is complete.
(5)
The distributed clustering process generates three sets of clustered sub-results that need to be merged in this stage. To accomplish this, it is necessary to examine whether the boundaries of each cluster in the three clustering results produced by the DBSCAN algorithm can be merged. After receiving the three clustering results from the DBSCAN algorithm, the master node merges them as the final step in the entire Stream-DBSCAN model. The merge calculation for the entire dataset should be simple and efficient to maintain the processing speed of the entire model and prevent distributed computation from becoming meaningless. To effectively merge the clustering results from the three nodes and minimize the processing time, the Stream-DBSCAN model utilizes the overlapping and merging rule for clustering results, as shown in the figure below:
Figure 3a and Figure 3b are the DBSCAN clustering results returned by computer nodes A and B, respectively.
(i)
Calculate the centroid points of each cluster in Figure 3a,b, and obtain two centroids of A and B.
(ii)
Find the edge points closest to the centroid point of the other cluster in cluster A and cluster B, respectively, as shown in Figure 3c, for two points a and b.
(iii)
Calculate the distances, LAb and LBa from the edge points in cluster A and cluster B to the centroid of another cluster (Figure 3c).
(iv)
Compare the size relationship between LAb, LBa, and Eps, respectively, if LAb, LBa < Eps, then merge the two clusters A and B.
The master node merges the clustering results of the three computer nodes according to the above-mentioned merging rules to obtain the final clustering result.
The entire model process is illustrated by Figure 4.
The Stream-DBSCAN clustering model facilitates parallel operation on three computing nodes during the clustering process for streaming data, resulting in a significant reduction in the clustering algorithm’s running time. Additionally, the model implements overlapping merging as a rule to ensure the availability of clustering results.
Using the Stream-DBSCAN clustering model, we obtained the clustering results of 200,000 water quality data, which consist of three factors: pH, NH4N, and turbidity. These factors affect the clustering results, whereas the time of non-influencing factors. The clustering process utilized the values of the three water quality indicators at a specific time point as a reference for clustering and merged similar water quality conditions corresponding to different times into one category. Therefore, analyzing the clustering results only requires referring to the time attribute in the clustering results.
After analyzing the relationship between the water quality situation represented by each cluster and the time attribute distribution of each element in the cluster, we discovered the pattern of water quality changes in Yantai Menlou Reservoir.

4. Experiment and Analysis

The experiment was conducted using the Flink stream distributed computing framework, with Java as the programming language. The input variables for the experiment were pH value, NH4N, and turbidity. As the dataset had a low dimension, single-machine three-thread parallel computing was utilized to simulate distributed computing. Cluster analysis was performed using the proposed stream-DBSCAN model in Figure 4, and the reservoir water quality was analyzed and predicted based on the cluster results.

4.1. Data Analysis

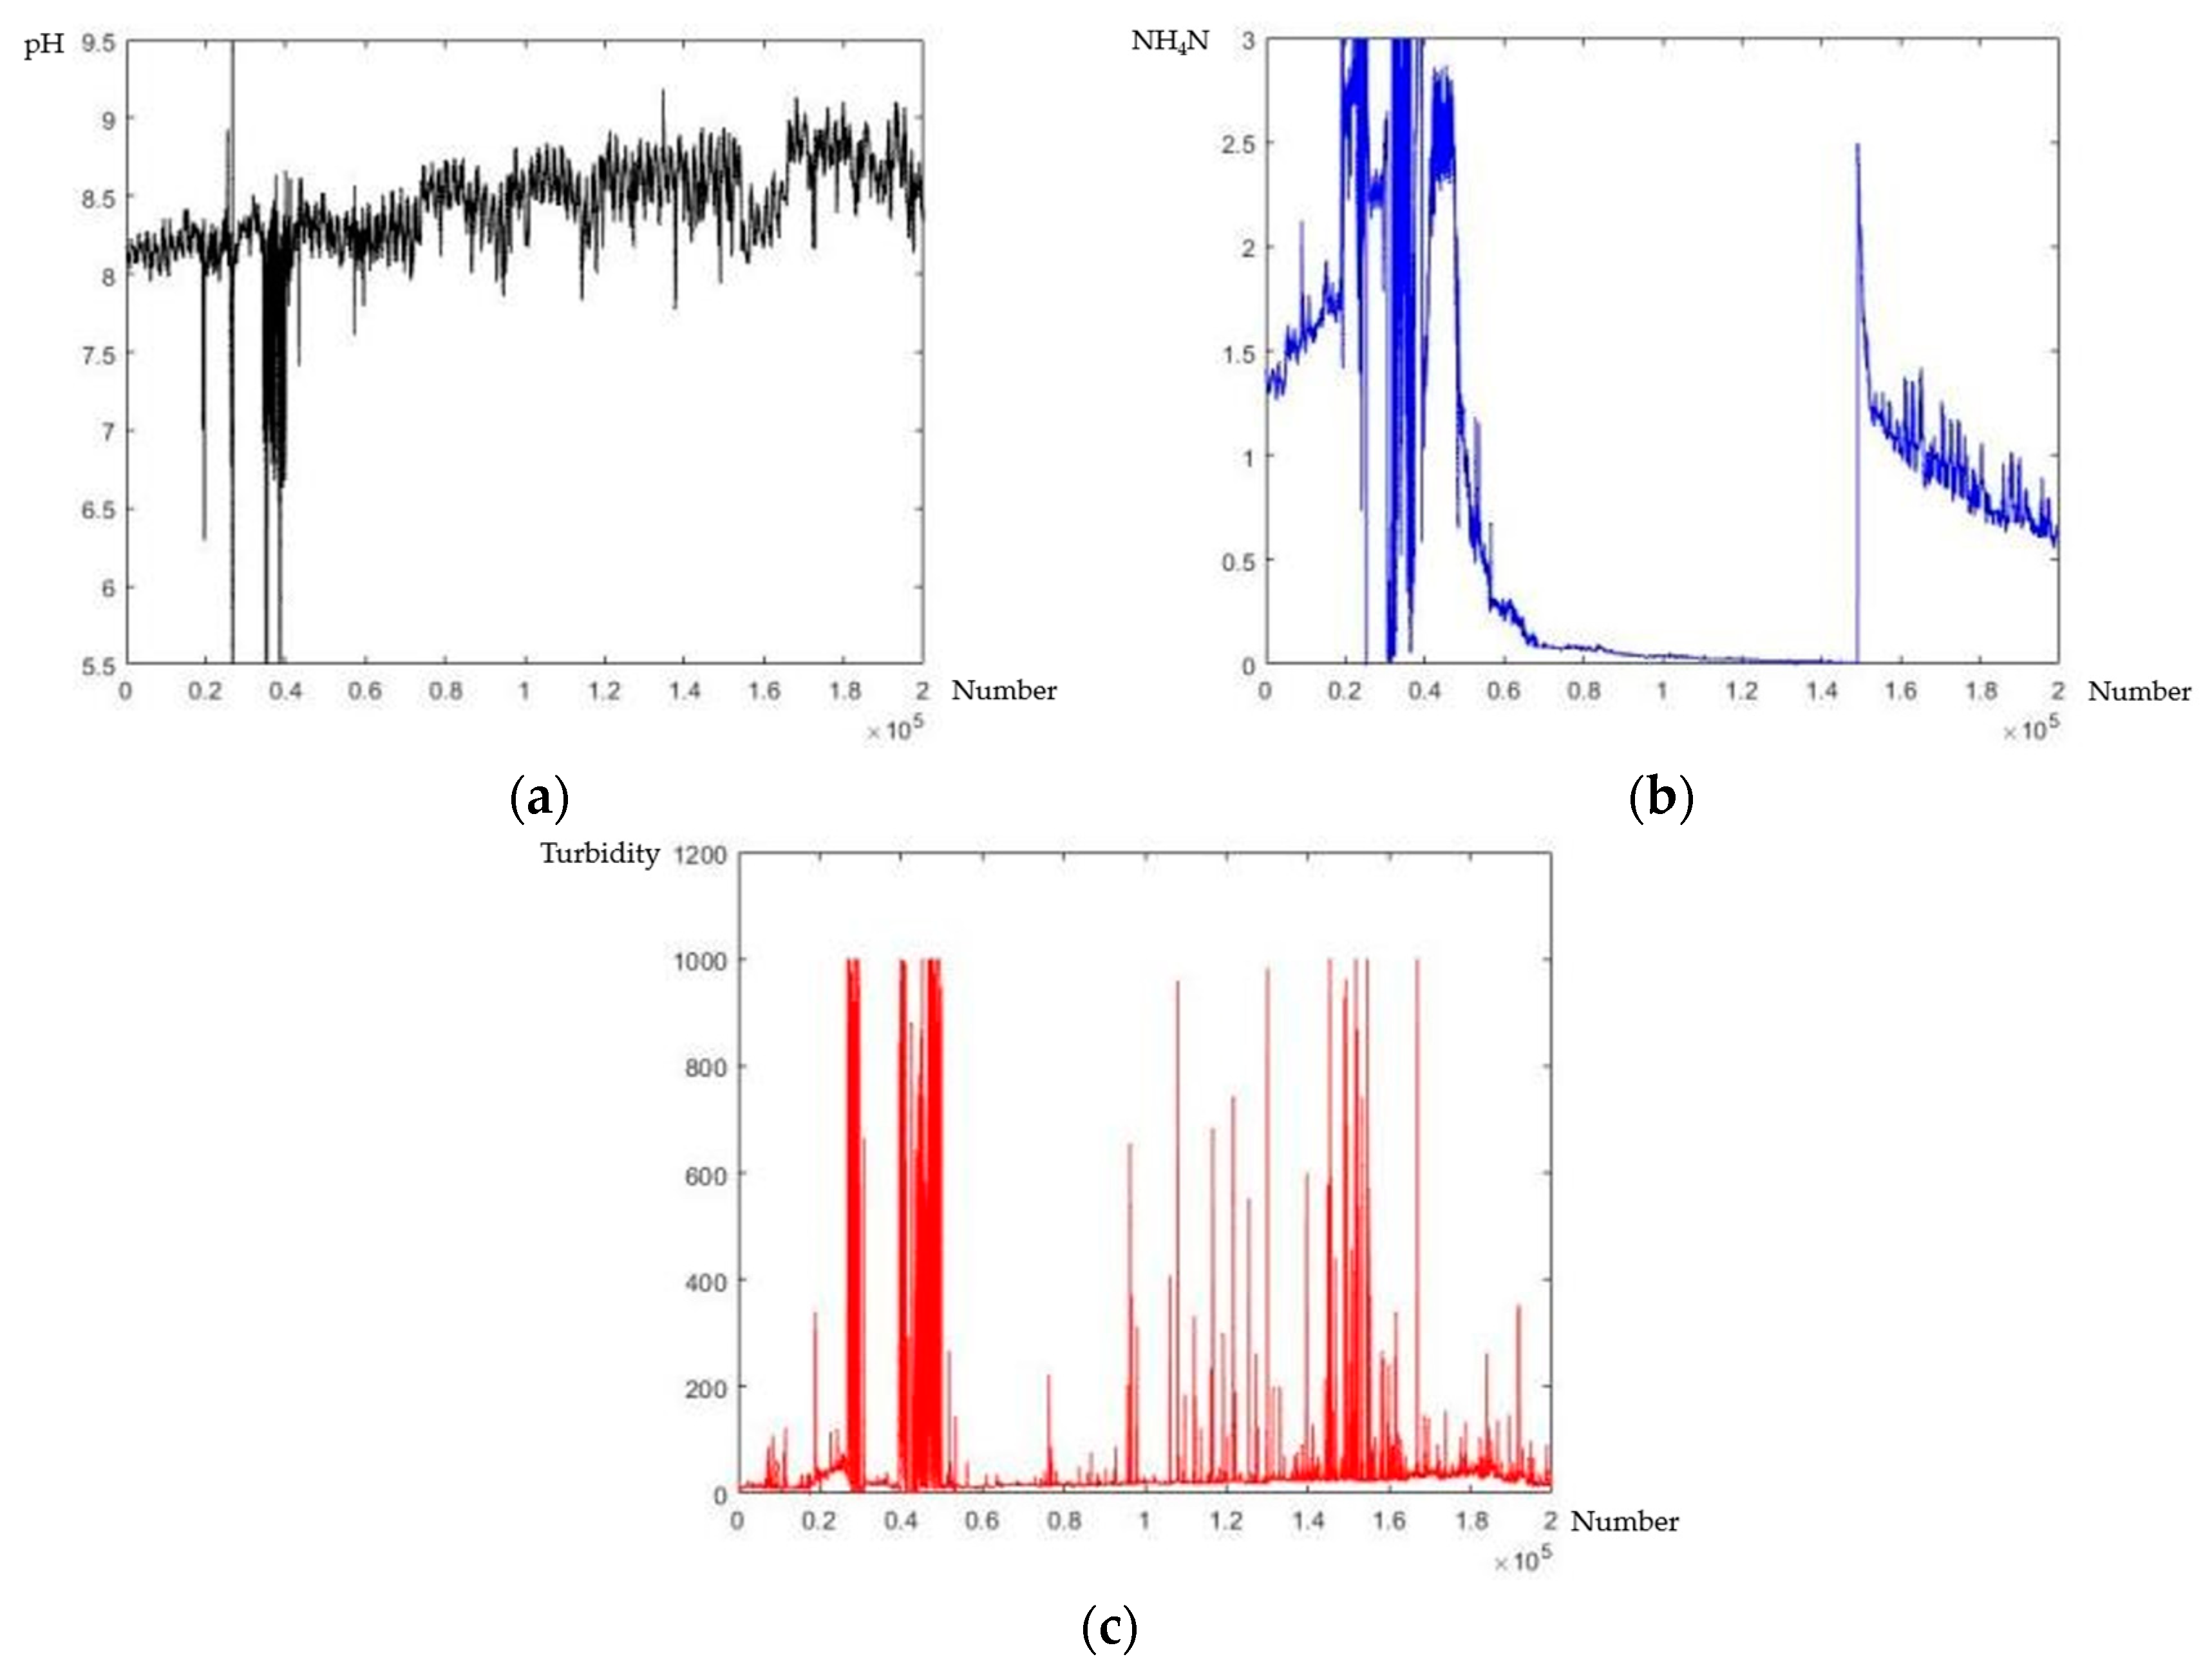
Figure 5 displays the change trend of the 200,000 data volume of pH value, NH4N, and turbidity over time. The horizontal axis represents the sequential number of the data based on their timestamp.
The analysis results reflect the change rate of the three-dimensional index, where the pH value changes relatively gently (Figure 5a). The changes in NH4N can be divided into three stages. During the first stage, the data values varied greatly and frequently between the x-axis [20,000, 40,000]. The value then gradually tends to 0 on the x-axis [60,000, 150,000]. After reaching a peak value around 150,000, the value enters a slowly decreasing phase (Figure 5b). The turbidity data has been repeatedly and violently changing between 0 and 1000 (Figure 5c).
Table 2 displays the data characteristics of pH, ammonia nitrogen, and turbidity in the dataset, where the minimum value of pH, NH4N, and turbidity is 0, and the maximum value of NH4N and turbidity is 1000. The primary reason for this data is that the sensor was disturbed, or the water environment was temporarily severely polluted.

4.2. Clustering Results

After conducting a staged test with DBSCAN parameters Eps set to 0.05 (L2 norm) and Minpts set to 20, the clustering results are convenient for subsequent analysis. Table 3 displays the clustering results when the distributed node numbers are set to 3. A total of 5 clusters are classified, where clusters I–IV are small data clusters, and cluster V is a large data cluster. Meanwhile, 32,159 water quality indicators have not generated clusters as they are considered noise points by the system.
In general, the results indicate that cluster v is relatively stable, as the three indicators are close to the data mode. Cluster v accounts for 81.8% of the total monitoring time, representing the normal water quality situation of the reservoir during May to August. On the other hand, clusters I–IV have a smaller amount of data but larger 3D data values, with secondary peak values indicating a significant change in water quality during a certain period of time. The noise point values cannot form clusters as they fail to meet the density requirement due to their large change rate. These points correspond to several main peak values and nearby points in the line graph. Further analysis reveals that NH4N and turbidity noise points were far higher than the average value, indicating severe water quality pollution in the reservoir during those time periods.
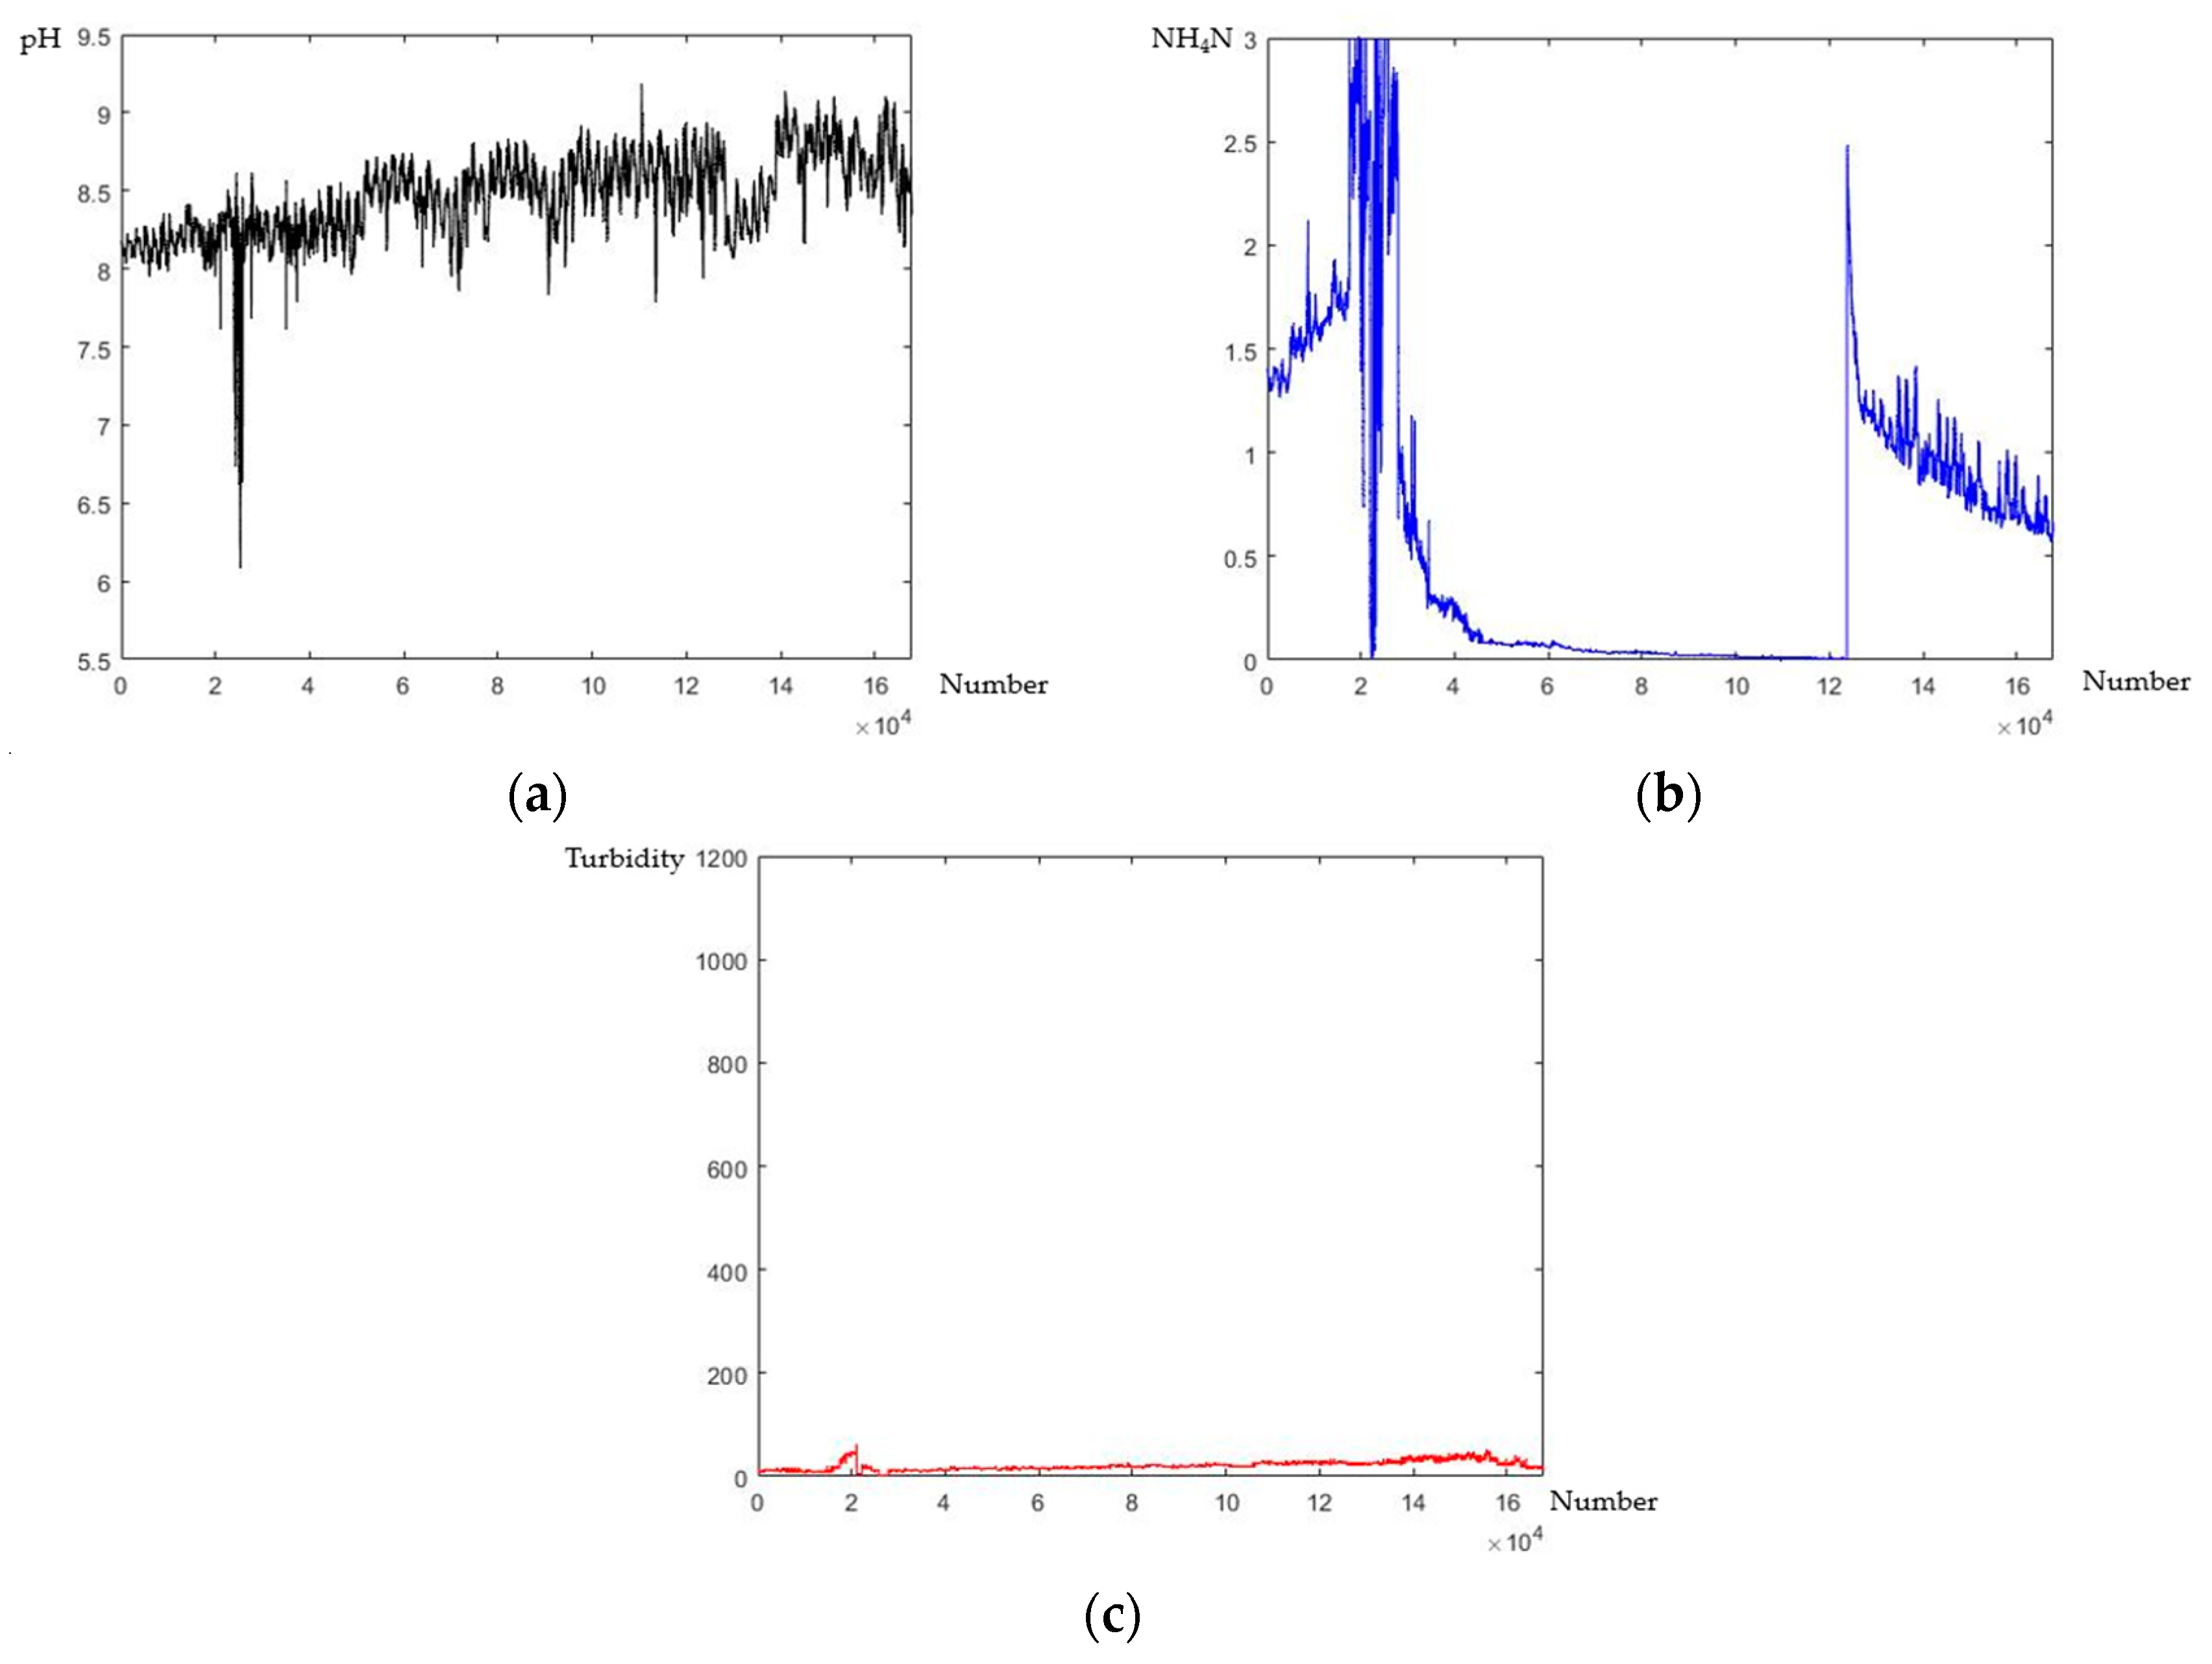
The changes in pH, NH4N, and turbidity, with noise points excluded, are depicted in Figure 6. Clustering was performed using DBSCAN, resulting in a reduction in the variation range of the three-dimensional water quality numerical curves, particularly for turbidity (Figure 5c). A significant number of extreme points in Figure 4c were classified as noise points, providing evidence that the Stream-DBSCAN model has achieved a satisfactory noise reduction effect.
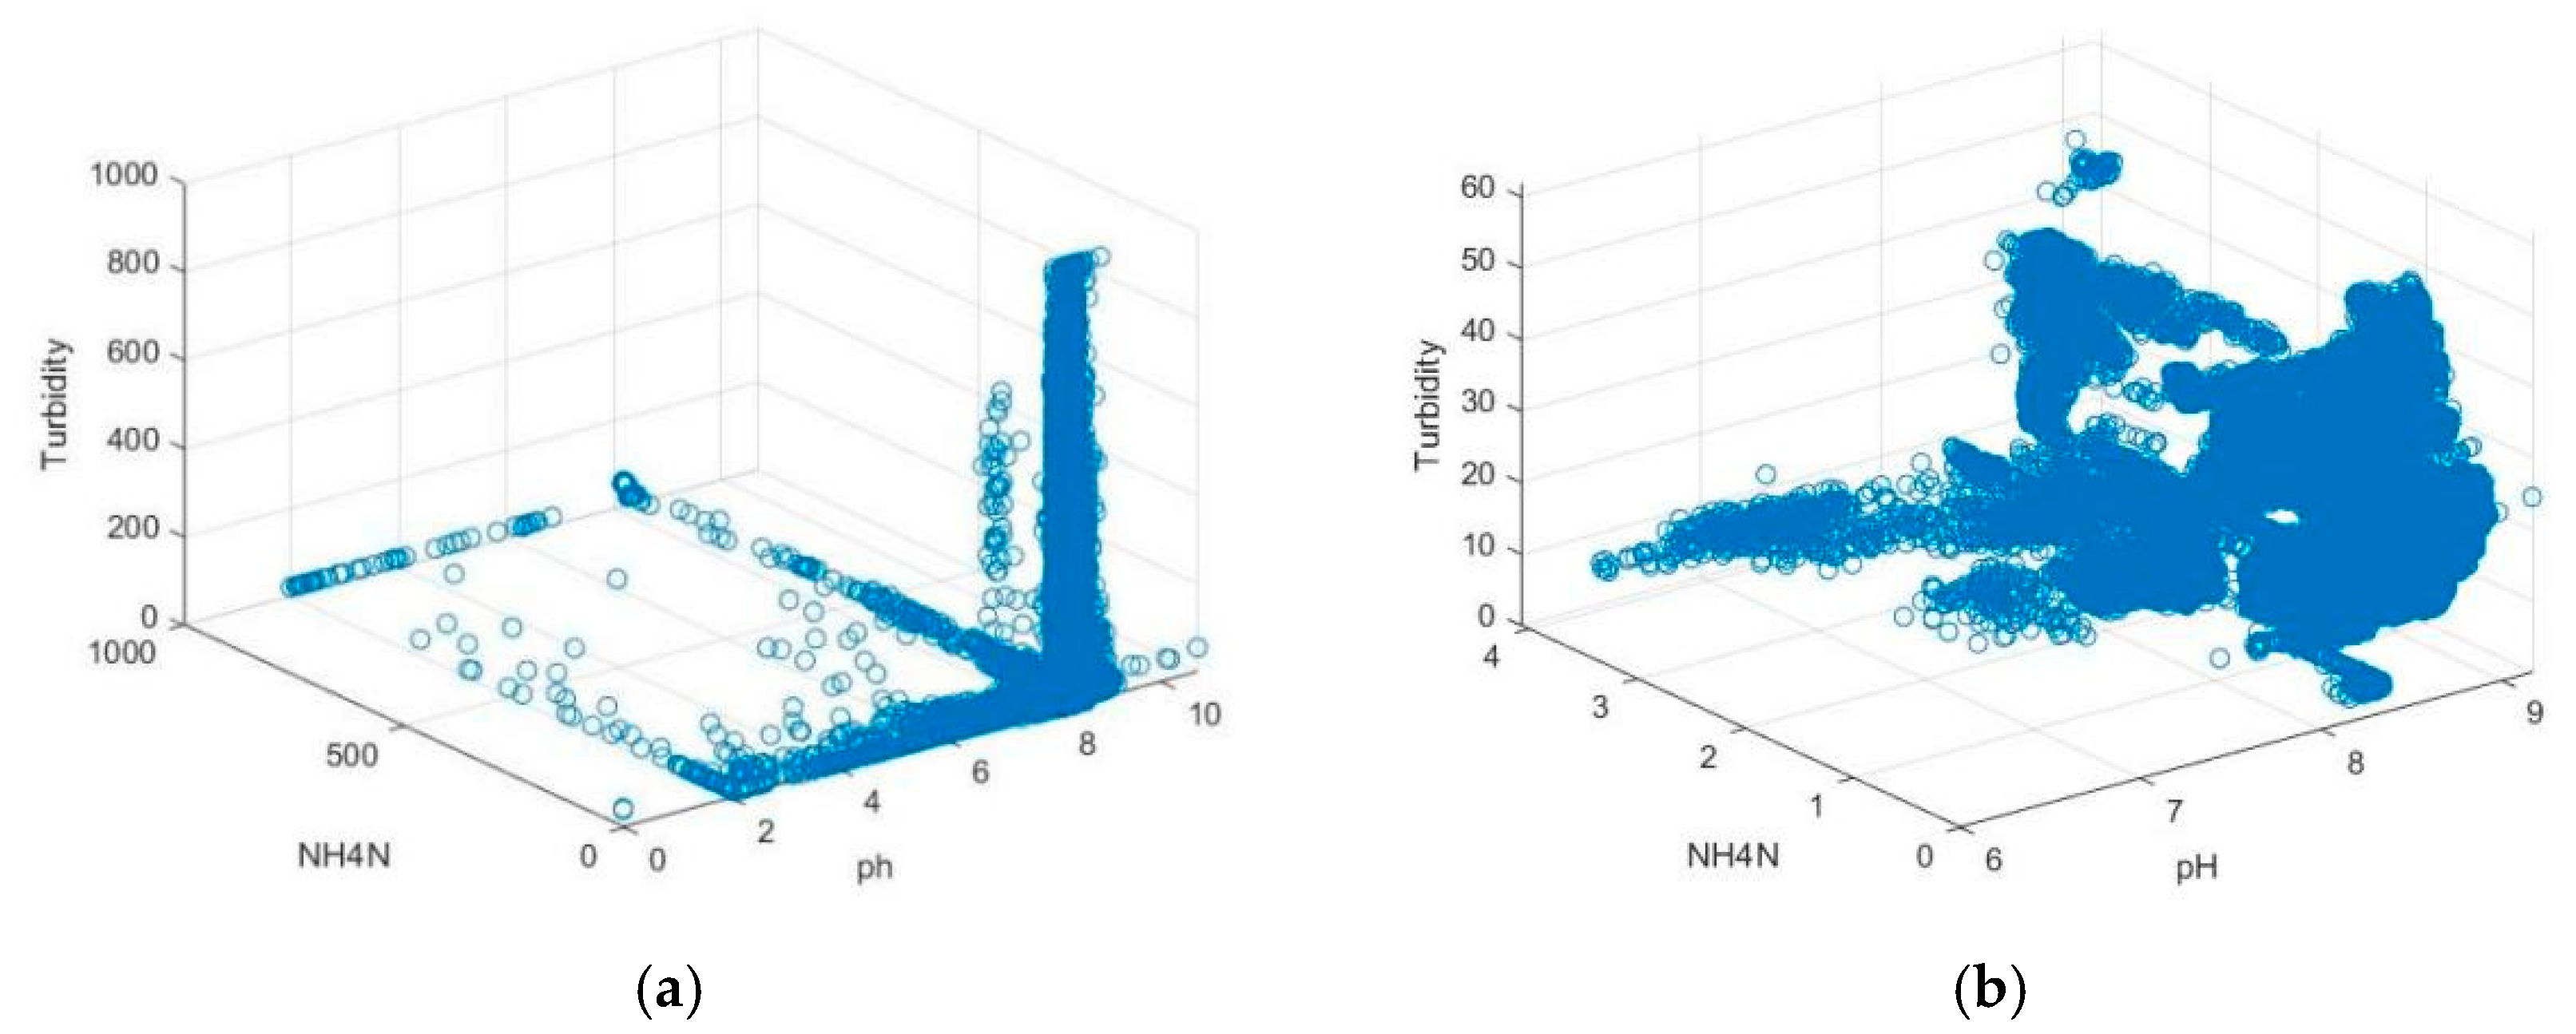
Figure 7 depicts a comparison of the 200,000 data sets before and after the noise reduction process in the form of a three-dimensional chart. The coordinate interval of NH4N and turbidity in Figure 7a ranges from 0 to 1000, and some sparsely distributed points can be observed. In Figure 7b, the pH coordinate interval ranges from 6 to 9, the NH4N coordinate interval ranges from 0 to 4, and the turbidity interval ranges from 0 to 6. The clustering process effectively removed the sparse points in Figure 7a as noise points through the clustering algorithm, while the points in Figure 7b maintain the characteristics of high-density clustering and the relative distances between clusters are maintained.
We conducted a similar analysis on the results processed by the DBSCAN-Stream model, and the findings are presented in Table 4. The eigenvalues of the water quality data have undergone changes, with the model identifying most of the special peaks through noise reduction. These peaks represent instances of sensor interference or sudden pollution of water quality, which have significant practical implications.

4.3. Data Relationship Analysis

The cluster analysis results indicate that cluster V has no regularity as it covers every time period of the day, while other clusters have smaller scales, suggesting that the water quality changes differently from the normal water quality during a certain time period on some dates, either good or bad. The timestamps of each point in I–IV clustering exhibit periodic changes. The clusters are arranged based on the time attribute, and it is observed that I–IV clusters have distinct time segment characteristics. The water quality in the reservoir is divided into four grades, where a higher grade indicates worse water quality (Table 5). Cluster IV represents good water quality, and the corresponding time stamps are mostly during the period from 6:00 a.m. to 8:00 a.m., after which the water quality starts to deteriorate. Cluster III represents the time period from 12:00 p.m. to 3:00 p.m., and cluster II represents the water quality from 6:00 p.m. to 8:00 p.m. Cluster I represents the water quality from 8:00 p.m. to 12:00 a.m. The water quality situation represented by cluster V is between 2 and 3, which can be considered as the average situation of the water quality in the reservoir. The analysis results suggest that the water quality in Menlou Reservoir follows a daily variation rule where the water quality is generally better in the morning and worse in the evening.
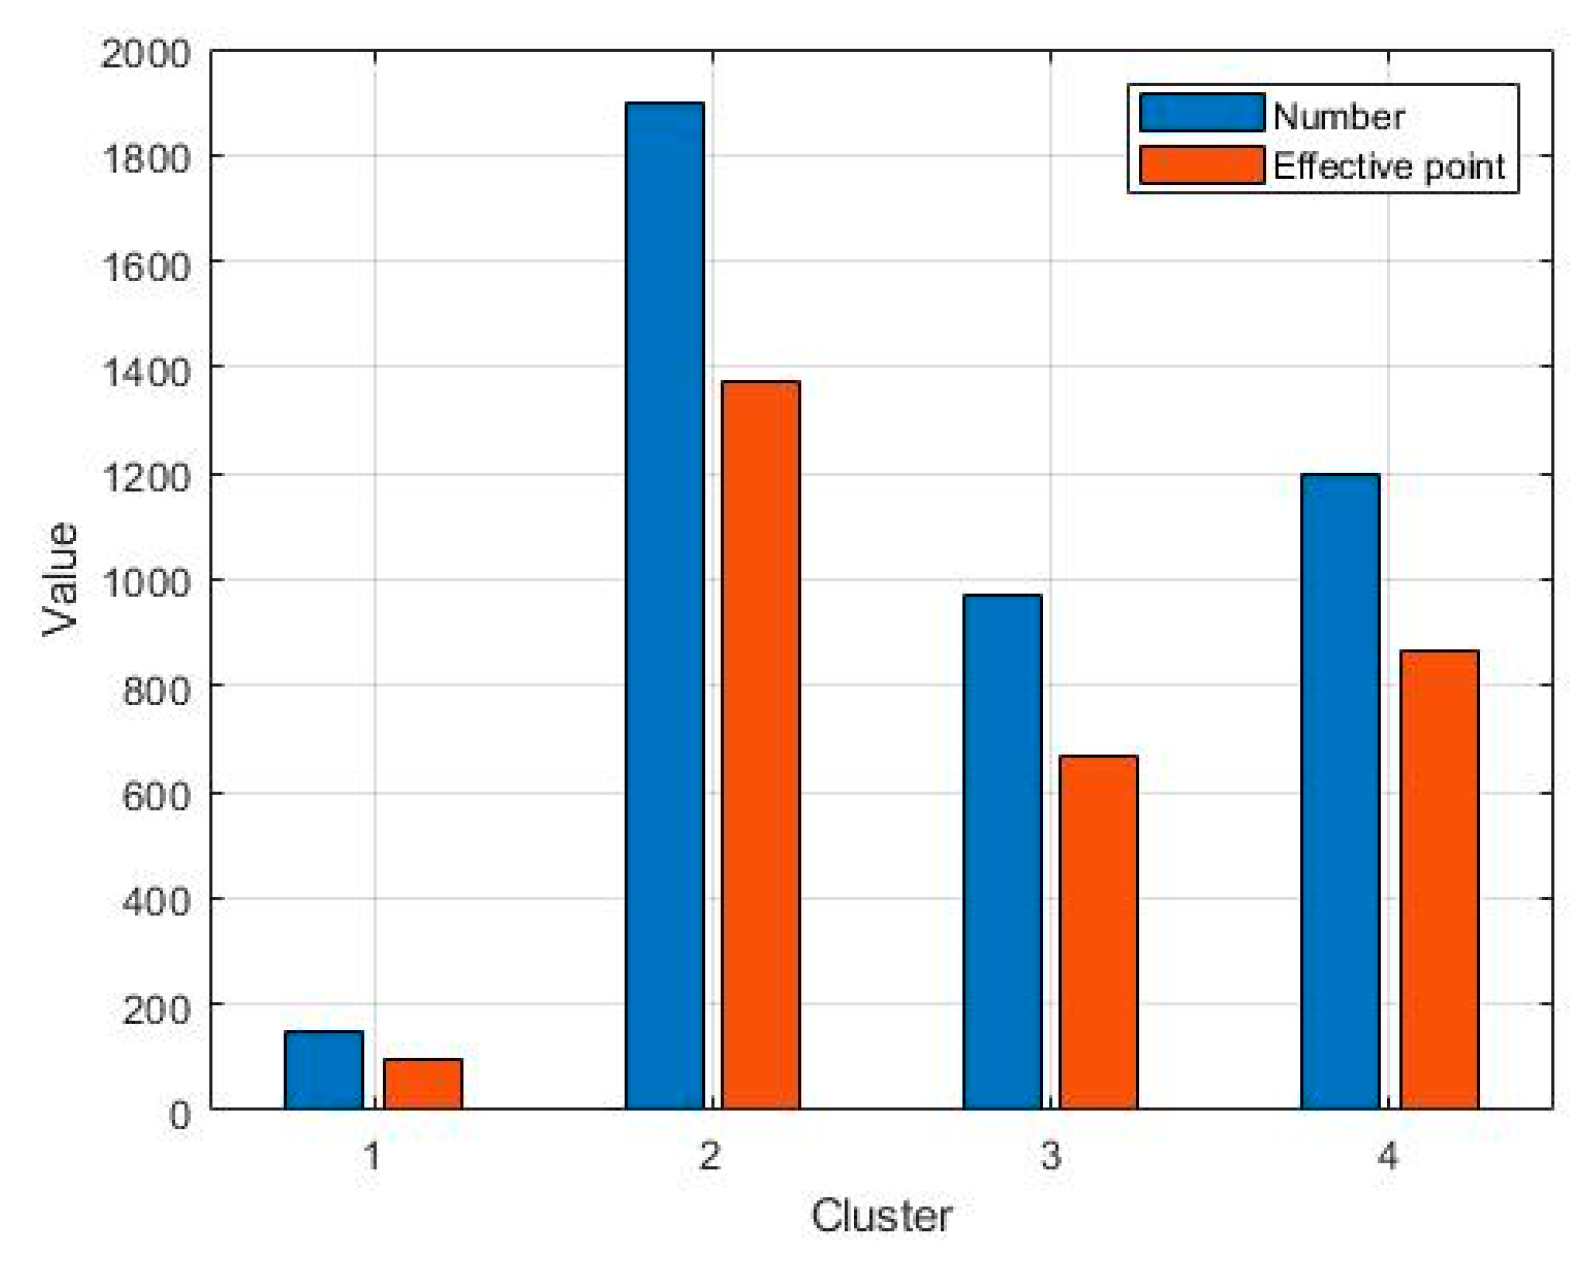
Figure 8 illustrates the comparison between the number of elements in each cluster and the total number of elements in the corresponding time period. Based on the calculation, it is found that the points with a regular reaction time in clusters I–IV account for approximately 71% of the total.

4.4. Distributed Time Consumption Analysis

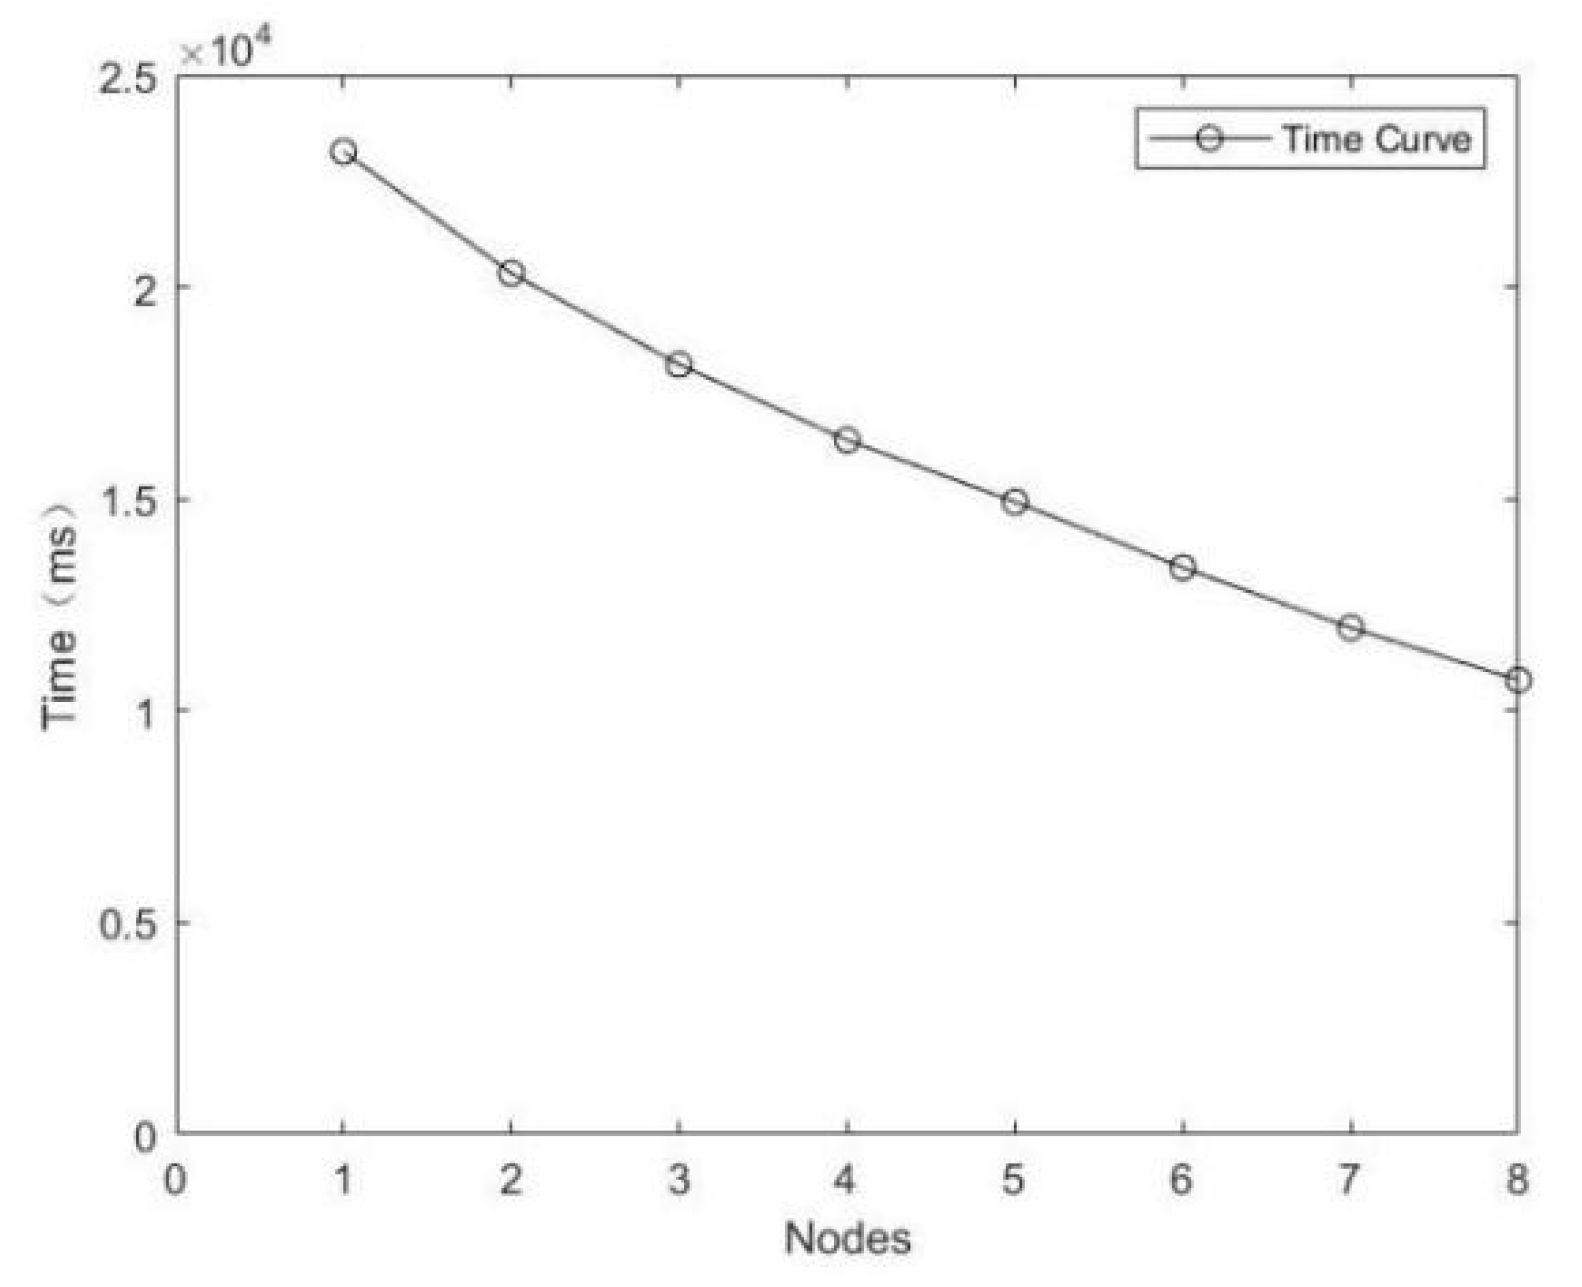
After conducting multiple experiments, we recorded the time required for the Stream-DBSCAN model to process 200,000 datasets while setting different numbers of nodes. The time consumption curve is presented in Figure 9. It is evident from the graph that the processing time gradually decreases with an increase in the number of nodes. However, the rate of change of the curve gradually decreases as the number of nodes increases. This is because the increased number of distributed nodes leads to increased computational complexity during the merger process. Consequently, when the number of nodes approaches infinity, the time consumption curve reaches a minimum value while ensuring the same dataset.

5. Conclusions

The Stream-DBSCAN model not only meets the real-time data processing requirements in water quality management, improving the response speed of management departments to water quality changes, but also reflects changes in water quality and pollution time nodes in clustering results. Currently, water quality detection methods mainly rely on fixed-point detection by water stations. However, by utilizing the Stream-DBSCAN model, water stations can achieve automatic detection and data analysis, enabling all-weather, fine-grained, and all-indicator monitoring and thereby improving decision-making efficiency. This model is not limited to the three dimensions tested in this experiment, and different parameter groups can be set for clustering processing as needed. By inputting various water quality indicators with reasonable weights, the Stream-DBSCAN model can output corresponding clustering results with the desired focus, providing more scientific and intelligent guidance for water quality management. It is worth mentioning that the model adopts DBSCAN as the core processing algorithm, inheriting the drawbacks of the DBSCAN algorithm. In the face of different combinations of water quality indicators, it is necessary to determine appropriate Eps and Minpts parameters through pre-experiments, which presents some resistance to practical applications. In future work, we will focus on parameter adaptation in the DBSCAN algorithm, updating parameters through feedback from clustering results, and improving the model’s usability.

Author Contributions

Conceptualization, J.Z.; methodology, Y.H.; software, Y.W.; validation, J.Z. and Y.H.; formal analysis, C.M.; investigation, C.M.; resources, S.W.; data curation, S.W.; writing—original draft preparation, Y.H.; writing—review and editing, Y.H.; visualization, Y.H.; supervision, J.Z.; project administration, C.M.; funding acquisition, J.Z. All authors have read and agreed to the published version of the manuscript.

Funding

This research was funded by the Natural Science Foundation of Shandong Province grant number No. ZR2020MF148 and No. ZR2020QF108.

Data Availability Statement

Some or all data are available from the corresponding author by request.

Conflicts of Interest

The authors declare no conflict of interest.

References

  1. Falkenmark, M.; Lundqvist, J. Comprehensive assessment of the freshwater resources of the world. In World Freshwater Problems—Call for A New Realism; Stockholm Environment Institute: Stockholm, Sweden, 1997. [Google Scholar]
  2. Fengchun, L. Improving the design level of water conservancy planning by using the concept of water resources sustainable development. Heilongjiang Sci. 2017, 8, 170–171. [Google Scholar]
  3. Zhao, Z.N.; Tian, Y.; Zhang, Y.; Yuan, Y.; Luo, P.; Huang, H.J.; Wang, J. Analysis of Connotation and Current Situation of Water Resources Risks in China. Yellowriver 2019, 41, 46–50. [Google Scholar]
  4. Dellana, S.A.; West, D. Predictive modeling for wastewater applications: Linear and nonlinear approaches. Environ. Model. Softw. 2009, 24, 96–106. [Google Scholar] [CrossRef]
  5. Deng, R.; Wei, S.N. Sewage Quality Prediction Based on LSTM Neural Network and DBSCAN Algorithm. Comput. Telecommun. 2021, 4, 66–73. [Google Scholar]
  6. Liu, J.; Zhu, R.J.; Jiang, D.X.; Wang, D.W.; Xu, C.P.; Nan, J.; Wang, P. Real-time water quality prediction model based on IGA-BPNN method. South-North Water Transf. Water Sci. Technol. 2020, 18, 93–100. [Google Scholar]
  7. Guo, X.J.; Song, J.G.; Han, Y.-M. Water Environ mental Capacit y of a Reservoir in Yantai. Environ. Sci. Technol. 2006, 29, 43–45. [Google Scholar]
  8. Jiang, Z.; Huang, J. Research on Information System Construction of Menlou Reservoir in Yantai. China Water Power Electrif. 2019, 6, 3–8. [Google Scholar]
  9. Wang, Y.; Jiang, X. Water Pollution Investigation and Water Quality Model Establishment for Menlou Reservoir in Yantai. Environ. Sci. Manag. 2015, 40, 173–176. [Google Scholar]
  10. Ma, J.; Jiang, W. The Concept, Characteristics and Application of Big Data. Natl. Def. Sci. Technol. 2013, 34, 10–17. [Google Scholar]
  11. Zhang, X. Research on Effective Technology to Improve the Accuracy and Stability of Water Quality Testing Results. Shaanxi Water Resour. 2021, 39, 108–111. [Google Scholar]
  12. Zhou, W. Analysis of Water Quality Influencing Factorsand Water Quality Prediction in the Three Gorges Reservoir Area. Master’s Thesis, Chongqing Jiaotong University, Chongqing, China, 2020. [Google Scholar]
  13. Zhao, J.; Wei, S.; Wen, X.; Qiu, X. Analysis and prediction of big stream data in real-time water quality monitoring system. J. Ambient. Intell. Smart Environ. 2020, 12, 393–406. [Google Scholar] [CrossRef]
  14. Di, Z.; Chang, M.; Guo, P.; Li, Y.; Chang, Y. Using real-time data and unsupervised machine learning techniques to study large-scale spatio-temporal characteristics of wastewater discharges and their influence on surface water quality in the yangtze river basin. Water 2019, 11, 1268. [Google Scholar] [CrossRef]
  15. Mandel, P.; Wang, Y.; Parre, A.; Féliers, C.; Heim, V. Quality zones automatically identified in water distribution networks by applying data clustering methods to conductivity measurements. Water Res. 2021, 207, 117716. [Google Scholar] [CrossRef]
  16. Vries, D.; van den Akker, B.; Vonk, E.; de Jong, W.; van Summeren, J. Application of machine learning techniques to predict anomalies in water supply networks. Water Sci. Technol. Water Supply 2016, 16, 1528–1535. [Google Scholar] [CrossRef]
  17. Wu, X.; Zhu, X.; Wu, G.-Q.; Ding, W. Data mining with big data. IEEE Trans. Knowl. Data Eng. 2014, 26, 97–107. [Google Scholar]
  18. Storey, V.; Song, I. Big data technologies and management: What conceptual modeling can do. Data Knowl. Eng. 2017, 108, 50–62. [Google Scholar] [CrossRef]
  19. Arora, P.; Deepali, D.; Varshney, S. Analysis of K-Means and K-Medoids algorithm for big data. Procedia Comput. Sci. 2016, 78, 507–512. [Google Scholar] [CrossRef]
  20. Huang, W.; Meng, L.; Zhang, D.; Zhang, W. In-memory parallel processing of massive remotely sensed data using an apache spark on hadoop yarn model. IEEE J. Sel. Top. Appl. Earth Obs. Remote Sens. 2017, 10, 3–19. [Google Scholar] [CrossRef]
  21. Shirkhorshidi, A.S.; Aghabozorgi, S.; Wah, T.Y.; Herawan, T. Big Data Clustering: A Review; ICCSA 2014; Springer: Cham, Switzerland, 2014. [Google Scholar]
  22. Cheng, D.; Zhu, Q.; Huang, J.; Wu, Q.; Yang, L. Clustering with Local Density Peaks-Based Minimum Spanning Tree. IEEE Trans. Knowl. Data Eng. 2021, 33, 374–387. [Google Scholar] [CrossRef]
  23. Du, M.; Zhao, J.; Sun, J.; Dong, Y. M3W: Multistep three-way clustering. IEEE Trans. Neural Netw. Learn. Syst. 2022, 1–14. [Google Scholar] [CrossRef]
  24. Li, S.S. An Improved DBSCAN Algorithm Based on the Neighbor Similarity and Fast Nearest Neighbor Query. IEEE Access 2020, 8, 47468–47476. [Google Scholar] [CrossRef]
  25. Shi, A.; Yin, J.; Fan, P. Spark Parallelization Improved SDKB-DBSCAN Clustering Algorithm. Mod. Comput. 2021, 14, 14–20+37. [Google Scholar]
  26. Pule, M.; Yahya, A.; Chuma, J. Wireless sensor networks: A survey on monitoring water quality. J. Appl. Res. Technol. 2017, 15, 568–570. [Google Scholar] [CrossRef]
  27. Adu-Manu, K.S.; Tapparello, C.; Heinzelman, W.; Katsriku, F.A.; Abdulai, J.-D. Water Quality Monitoring Using Wireless Sensor Networks: Current Trends and Future Research Directions. ACM Trans. Sens. Netw. 2017, 13, 1–41. [Google Scholar] [CrossRef]
  28. Hartigan, J.A.; Wong, M.A. Algorithm AS 136: A K-Means Clustering Algorithm. J. R. Stat. Soc. 1979, 28, 100–108. [Google Scholar] [CrossRef]
  29. Gholizadeh, N.; Saadatfar, H.; Hanafi, N. K-DBSCAN: An improved DBSCAN algorithm for big data. J. Supercomput. 2021, 77, 6214–6235. [Google Scholar] [CrossRef]
  30. Mo, Y. Design and Implementation of a Water Quality Monitoring System Server Side. Master’s Thesis, Huazhong University of Science and Technology, Wuhan, China, 2015. [Google Scholar]
Figure 1. The interaction process of Flink components.
Applsci 13 05408 g001
Figure 2. Flink Layered Architecture Diagram.
Applsci 13 05408 g002
Figure 3. Two-cluster merging process. (a) Result A; (b) Result B; (c) Merge.
Applsci 13 05408 g003
Figure 4. Stream-DBSCAN model flow chart.
Applsci 13 05408 g004
Figure 5. Changes in each indicator. (a) pH; (b) NH4N; (c) turbidity.
Applsci 13 05408 g005
Figure 6. Changes of each index after noise reduction. (a) pH; (b) NH4N; (c) turbidity.
Applsci 13 05408 g006
Figure 7. (a) Data set before noise reduction; (b) Data set after noise reduction.
Applsci 13 05408 g007
Figure 8. Comparison of intra-cluster points.
Applsci 13 05408 g008
Figure 9. Time curve.
Applsci 13 05408 g009
Table 1. Comparison between Flink and other mainstream frameworks.
StormSpark StreamingFlink
Streaming ModelNativeMini-batchNative
Consistency assuranceAt Least/Most OnceExactly OnceExactly Once
delayLow latency (in milliseconds)High latency (seconds)Low latency (in milliseconds)
swallow and spitLOWHighHigh
fault-tolerantACKRDD Based CheckpointCheckpoint (Chandy Lamport)
StateFulNoYes (Dstream)Yes (Operator)
SQL supportNoYesYes
Table 2. Dataset characteristics.
IndexTotleS.D.AvgMinMax
PH200,0000.3656840628.4248135010.68473
NH4N200,00044.60782894 3.247683601000.000
Turbidity200,00092.2691969639.70650301000.000
Table 3. Clustering results when the distributed nodes are set to 3.
ClusterNumber
I147
II1899
III970
IV1198
V163,624
Noise32,159
Table 4. Data set characteristics after noise reduction.
IndexTotleS.D.AvgMinMax
pH167,8400.2617200838.46194346.0933479.175494
NH4N167,84029.572319040.7225812604.078737
Turbidity167,8408.49965700420.7093810.5209687461.88089
Table 5. Daily variation rule of water quality in the Menlou Reservoir.
ClusterTimeQuality
Ip.m. 8:00–p.m. 10:004
IIp.m. 6:00–p.m. 8:003
IIIa.m. 12:00–p.m. 3:00 2
IVa.m. 6:00–a.m. 8:001
Disclaimer/Publisher’s Note: The statements, opinions and data contained in all publications are solely those of the individual author(s) and contributor(s) and not of MDPI and/or the editor(s). MDPI and/or the editor(s) disclaim responsibility for any injury to people or property resulting from any ideas, methods, instructions or products referred to in the content.