Article

Novel Cuckoo Search-Based Metaheuristic Approach for Deep Learning Prediction of Depression

1
College of Computing and Informatics, Saudi Electronic University, Riyadh 11673, Saudi Arabia
2
School of Computing Science and Engineering, VIT Bhopal University, Bhopal-Indore Highway, Kothrikalan, Sehore 466116, India
3
School of Advanced Sciences and Languages, VIT Bhopal University, Bhopal-Indore Highway, Kothrikalan, Sehore 466116, India
*
Authors to whom correspondence should be addressed.
Appl. Sci. 2023, 13(9), 5322; https://doi.org/10.3390/app13095322
Submission received: 27 March 2023 / Revised: 14 April 2023 / Accepted: 22 April 2023 / Published: 24 April 2023

Abstract

:
Depression is a common illness worldwide with doubtless severe implications. Due to the absence of early identification and treatment for depression, millions of individuals worldwide suffer from mental illnesses. It might be difficult to identify those who are experiencing mental health illnesses and to provide them with the early help that they need. Additionally, depression may be associated with thoughts of suicide. Currently, there are no clinically specific diagnostic biomarkers that can identify the severity and type of depression. In this research paper, the novel particle swarm-cuckoo search (PS-CS) optimization algorithm is proposed instead of the traditional backpropagation algorithm for training deep neural networks. The backpropagation algorithm is widely used for supervised learning in deep neural networks, but it has limitations in terms of convergence speed and the possibility of getting trapped in local optima. These problems were addressed by using a deep neural network architecture for depression detection tasks along with the PS-CS optimization technique. The PS-CS algorithm combines the strengths of both particle swarm optimization and cuckoo search algorithms, which allows for a more efficient and effective optimization of the network parameters. We also evaluated how well the suggested methods performed against the most widely used classification models, including (K-nearest neighbor) KNN, (support vector regression) SVR, and decision trees, as well as the most widely used deep learning models, including residual neural network (ResNet), visual geometry group (VGG), and simple neural network (LeNet). The findings show that the suggested method, PS-CS, in conjunction with the CNN model, outperformed all other models, achieving the maximum accuracy of 99.5%. Other models, such as the KNN, decision trees, and logistic regression, achieved lower accuracies ranging from 69% to 97%.

1. Introduction

Millions of individuals throughout the world are affected by the common medical ailment known as depression. It is categorized as a mental disorder and is regarded as harmful since it can impair a patient’s physical and mental health [1]. A wide range of problems are included in mental health disorders, such as anxiety disorder, agitation, insomnia, eating disorder, addiction disorder, depression, trauma, and stress-related illnesses [2]. The patient’s mental health is often taken into account when determining the degree of the patient’s depression. Depression is a type of mental disorder that shows itself as a lack of interest in regular physical, mental, and social activities, as well as persistent feelings of helplessness, demotivation, and mood swings. This can impair the patient’s capacity to learn, cause mood swings, and frequently decrease their work efficiency. It can also cause emotional harm and physical changes in the patient’s body. Depending on how severe the condition is, depression symptoms might change [3]. When depression is severe, the brain slows down and generates cortisol, which can prevent neurons from growing in the brain. This can have a significant negative effect on one’s cognitive process and occasionally even trigger suicidal thoughts. Clinical depression, bipolar depression, dysthymia, seasonal affective disorder, and other kinds of depression can manifest at various phases [4]. There are several therapeutic options accessible, including therapies, brain stimulation treatments, and counselling sessions [5]. The World Health Organization estimates that 280 million individuals worldwide suffer from depression, and that the illness contributes to about 800,000 suicide attempts year [1]. Depression-related emotional and physical issues can make it difficult for someone to function both at work and at home. Depression affects around 3.7% of the world’s population, including 5.3% of adults and 5.7% of people over the age of 59. Depressed people have a better chance of managing their symptoms and avoiding more serious illnesses by receiving a timely diagnosis and treatment if they can identify the signs of depression early on. Wellness and health as well as the negative results are alleviated in personal, economic, and public life. However, the detection of depression symptoms is difficult since resources are lacking. The symptoms of the illuminator are complex and resources. The current approach is based on the clinical interview and surveys of the questionnaire of hospitals or agencies using a psychological evaluation table to prevent predictions of mental disorders. This method primarily relies on the use of questionnaires, and depression, a psychological disability, can be approximately diagnosed through it [1]. Doctors use sophisticated blood tests or other advanced laboratory tests to make a conclusive diagnosis. However, when it comes to detecting depression, most lab tests are ineffective. Although interaction with the patient is the most important diagnostic tool a doctor has, diagnosing depression can be difficult because clinical depression manifests itself in a variety of ways. Some depressives, for example, do not exhibit any of the classic symptoms of depression, such as sadness or melancholy behavior. Clinical depression symptoms and outward manifestations can vary from person to person, leading to misdiagnosis and mistreatment [3]. When every cluster is taken into account severally, this study’s principal reverse is the terribly small sample size. This flaw is especially important because a result of the conclusions was not tested by employing an external dataset; however, an inside validation procedure resulted in a random two hundredth of the information in every cycle. The study was additionally restricted by the very fact that it had been conducted on a subclinical sample. As a result, clinical identification and treatment implications ought to be infatuated with caution. The logistic regression model effectively showcases the strength of the chosen features, leading to improved clustering compared to other traditional features. Moreover, because the model is based on possible depressive symptoms, it may provide a thorough justification for the treatment using machine learning techniques [4].
Machine learning is among the most widely used approaches for assessing a person’s physiological state from various data sources. As machine learning models are increasingly used to make critical day-to-day predictions in critical contexts, various stakeholders in the AI industry are demanding greater transparency in these contexts. Selection and implementation of irrational AI decisions that do not account for the model’s actions pose a high threat in this regard. As a result, the description of the model output is critical. Deep neural networks have recently made significant contributions to many research fields, particularly pattern recognition and artificial intelligence. It is more powerful than traditional neural networks, but has two major drawbacks. The first drawback is that in most cases, overfitting occurs. The latter takes a lot of time to model the underlying data. Convolutional neural networks (CNNs) are highly effective for classifying biological images, and features obtained from CNNs are often superior to those created by hand. Research has shown that using a combination of handcrafted and learned features can enhance the performance of CNNs in classifying biometric images. In the field of neural signal classification, a number of studies have employed various techniques to transform EEG signals into image representations, which have yielded better results compared to other methods. In addition to training with data, CNNs extract functions [5]. Recurrent neural networks (RNNs) are not typically used for analyzing time series data; however, they consist of 722 neural computations and applications, making them a more suitable choice than CNNs for this purpose. This is because RNNs are better suited for sequential data and pattern analysis. Long short-term memory (LSTM) is a form of recurrent neural network (RNN) that was developed to address the gradient decay problem that occurs while processing multivariate and time series data with long-term dependencies. The goal of this research is to employ LSTM-based RNNs to represent diverse emotional states in textual data. Machine learning is a common method for obtaining data about people’s physical and mental states from a range of sources. Since that time, machine learning models are being used more frequently. Transparency becomes less important in such circumstances. Various AI industry participants make and implement AI decisions in this regard. It cannot be justified, and no explanation exists for how the model behaves. As a result, a description of the model’s output is required. Precision medicine practitioners, for example, require more data from machine learning models [6]. In the study conducted by Ali Shariq Imran et al. [7], the issue of understanding global sentiment towards COVID-19 is addressed by using sentiment analysis and deep learning techniques to analyze cross-cultural polarity and emotion in COVID-19-related tweets. The researchers used a dataset of over 1 million tweets written in multiple languages and proposed a multi-layer LSTM assessment model for classifying both sentiment polarity and emotions expressed in the tweets. They found significant differences in sentiment polarity and emotion expressed in tweets across different cultures, with their proposed model achieving state-of-the-art accuracy on the Sentiment140 dataset for sentiment polarity classification. The findings provide valuable insights into how different cultures are reacting to the COVID-19 pandemic on social media, which can inform policy decisions and public health interventions.
Depression is a complex mental health condition that affects millions of individuals worldwide, and it can be difficult to diagnose due to the lack of clinically specific diagnostic biomarkers. Traditional methods of depression detection, such as self-report questionnaires and clinical interviews, are often subjective and time consuming. Moreover, these methods may not be sensitive enough to detect early signs of depression, leading to delayed diagnosis and treatment. To address these challenges, we propose a novel approach to depression detection using modified particle swarm optimization with deep learning. Our method aims to overcome the limitations of traditional backpropagation algorithms by optimizing deep neural networks using PS-CS optimization. By doing so, we hope to improve the accuracy and speed of depression detection, ultimately leading to better outcomes for patients. Our contribution is unique in that it combines two powerful techniques, particle swarm optimization and deep learning, in a novel way that has not been explored before in the context of depression detection. By leveraging the strengths of both techniques, we believe that our approach has the potential to revolutionize the field of mental health diagnosis and treatment.

1.1. Motivation

The motivation behind this research is multifaceted. First, depression is a widespread mental health disorder that can significantly impact an individual’s quality of life. Unfortunately, many individuals do not receive timely and effective treatment due to a shortage of mental health professionals or barriers to accessing care. Therefore, there is a pressing need for accurate and efficient automated tools that can detect depression and other psychological illnesses. Second, the current COVID-19 pandemic has resulted in increased mental health challenges globally, with depression rates rising due to isolation, fear, and uncertainty. Thus, there is an urgent need for reliable and accessible mental health support. Third, existing software applications that claim to monitor mental health often lack the necessary security protections, potentially resulting in sensitive data being compromised or used for targeted advertising. Therefore, our proposed optimized deep learning technique for detecting and assessing depression prioritizes security and accuracy to ensure that patients’ sensitive information is protected. Finally, the development of a reliable and secure automated system for monitoring and detecting depression can provide critical data to healthcare professionals and researchers, enabling them to make informed decisions regarding treatment options and improving our understanding of the disease’s underlying mechanisms.

1.2. Objective of the Paper

The objective of a newly developed deep learning model is to successfully forecast depression. To further enhance the efficiency of the model, a unique optimization technique has been implemented. This approach has been evaluated using large datasets, specifically the Reddit depression dataset, and has been shown to be capable of handling the dataset growth while maintaining high prediction accuracy.
  • The goal of this research is to create a model that can recognize suicidal thought patterns in human beings based on their online posts.
  • This study’s objective is to provide a deep learning approach for diagnosing depression that can effectively use a constrained collection of features.
  • By contrasting the proposed model with other models and taking into account various performance metrics used by various classifiers, its efficacy is evaluated.
  • The goal is to run the model independently, without using the user interface.

1.3. Proposed Novel Work

The majority of earlier works on diagnosing depression have mostly focused on machine learning algorithms and optimization techniques, such as support vector machines, K-nearest neighbors, and logistic regression. However, the deep learning technique, which provides fast and precise results, has been relatively underexplored. Deep learning has outperformed numerous algorithms, including LSTM, in various disciplines. With the objective of avoiding overfitting difficulties, this study proposes a deep learning methodology that relies on a novel PS-CS optimization algorithm to accurately identify depression based on user posts and phrases. The study will conduct a comprehensive comparison with commonly used algorithms and use hyper parameter tuning to enhance the proposed model’s performance. The presented model can predict depression with good accuracy and low memory usage. Figure 1 illustrates the study’s workflow.

1.4. Paper Organization

We give a thorough explanation of our work on identifying depression using an integrated PSCS-based deep learning method in this study. We start in Section 2 by talking about the work conducted by the different researchers as a literature review; next, we explain the method used in this research in Section 3, also shows a thorough overview of the proposed model. Section 4 shows the complete in depth experimental setup. In Section 5, the performance of proposed methods was compared to the findings of some of the most prominent classification algorithms. Section 6 includes some last thoughts and conclusion of proposed study and suggestions for future research.

2. Literature Review

Hassan et al. investigated the use of text analysis, emotional theory, machine learning, and linguistic processing techniques to assess an individual’s state of depression by evaluating emotions in text from different platforms of social media [8].
Li et al. presented a method for more correctly recognising depression by transforming EEG characteristics and employing machine learning algorithms. An experiment was carried out utilising an emotional facial stimulus task, and EEG data from 28 volunteers were collected using a 128-channel HydroCel Geodesic Sensor Net (HCGSN) and analysed using Net Station software. To analyse the information, two separate methodologies, ensemble learning and deep learning, were utilised, and a support vector machine (SVM) was used as a classifier. They assessed the effectiveness of both techniques for single and total frequency bands. They discovered that utilising an ensemble model and power spectral density yielded the best accuracy of 89.02%, while deep learning approach and activity yielded the best accuracy of 84.75% [9].
Richter et al. examined a diagnostic strategy to distinguish cognitive biases in people with sub-clinical anxiety and depression. The study divided 125 people into four groups based on their symptoms, then used a behavioural test battery and powerful machine learning algorithms to detect and quantify several cognitive and emotional biases. The prediction model has a high accuracy of 71.44% in identifying individuals with severe depression or anxiety symptoms and 70.78% in identifying those without symptoms. The study also indicated which precise behavioural measurements were most essential in predicting group membership, shedding light on the cognitive mechanisms underlying anxiety and depression [10].
Priya et al. gathered data from employed and unemployed persons of various nationalities and groups using the depressed, anxious, and perceived stress (DASS 21). They used five different machine learning algorithms to predict the intensity of anxiety, sadness, and stress and discovered an imbalance in the distribution of the classes in the findings. To overcome this problem, they used the F1 score measure, which allowed them determine that the random forest classifier had the highest accuracy of the five algorithms examined. Furthermore, the specificity parameter demonstrated that the algorithms were very good at properly recognizing negative findings [11].
By examining data from the online DASS42 tool, Kumar et al. used eight different machine learning algorithms to anticipate the occurrence of psychological disorders such as anxiety, depression, and stress. They predicted five different severity levels for each of these diseases and divided the systems into four categories: probabilistic, closest neighbour, neural network, and tree-based. In addition, to help in prediction, they used a composite classification algorithm. They also used the same techniques on a different dataset, DASS21, which they gathered themselves. The scientists observed that the hybrid algorithm produced higher prediction accuracy than a single method, but the radial basis function network, a sort of neural network, produced the best degree of accuracy [12].
Choudhury et al. developed a strategy to predict depression and offer psychiatric care in order to obtain insight into the high incidence of depression among university students in Bangladesh, particularly undergraduates. After conferring with psychologists, counsellors, and professors, they polled students and utilised three algorithms to train and evaluate the dataset. They discovered that the random forest algorithm had the best accuracy for predicting depression, followed by the support vector machine approach, which had a comparable accuracy and f-measure of roughly 75% and 60%, respectively. The study’s purpose was to detect depression early and ensure rapid recovery in order to avoid suicide [13].
Shin et al. investigated if voice might be used as a biomarker to diagnose minor and serious depression. The 93 individuals were separated into three groups: not depressed, moderate depressive episode, and severe depressive episode. The study team took 21 voice traits from semi-structured interview recordings and used analysis of variance to compare the three groups. Seven voice markers were found to differ across the three groups, even after age, BMI, and medication were taken into account. They discovered that a multi-layer processing method offered the best outcomes, with an AUC score of 65.9%, a sensitivity of 65.6%, and a specificity of 66.2% as a result. The voice patterns of people who were suffering depressive episodes and those who were not also showed significant changes, according to the study. Furthermore, their research demonstrated that it was able to distinguish between people who had minor and significant depression as well as those who were not depressed with accuracy when using machine learning. According to the study’s findings, it was the first of its type to look into changes in speech patterns among those who had mild depression. According to the study’s findings, speech analysis may be able to identify mild depression [14].
Hosseinified et al. investigated the efficiency of several categorization approaches in discriminating between those with and without depression. In their investigation, they used the power spectrum of three frequency bands (alpha, beta, and theta) as well as the complete EEG. According to the findings of their study, utilizing a support vector machine (SVM) classifier in conjunction with a genetic algorithm for feature selection provided an accuracy rate of 88.6% in categorizing depression patients [15].
Serrano et al. used machine learning algorithms and data from postpartum mothers collected from seven hospitals in Spain to construct predictive models for predicting the risk of postpartum depression (PPD). They used a holdout tactic to perform an internal review. They also created a simple flowchart and architecture for building the m-health app’s graphical user interface. As a prediction model for PPD within the first week following delivery, the Naive Bayes algorithm was shown to be the most successful in terms of sensitivity and specificity [16].
Khalil et al. sought to enhance depression prediction by creating and employing machine learning approaches. They employed supervised machine learning to build a compact model that gives class labels based on a set of realistic features. The classification approach was used to give class labels to test individuals based on known predictive feature values, but the class label was unknown. They employed cutting-edge supervised learning classifiers with data adjustments. The findings were encouraging, demonstrating that machine learning might be used to successfully predict depression in type 2 diabetes patients [17].
Zhou et al. used discharge summaries to identify patients with depression using the MTERMS natural language processing (NLP) system and machine learning classification methods. Domain experts were invited to examine both the training and test instances, and these cases were classed as depressed with high, intermediate, and low confidence. All of the methods they examined performed similarly for cases of depression with high confidence, with MTERMS’ knowledge-based decision tree slightly beating the machine learning classifiers, reaching an F-measure of 89.6%. MTERMS also fared the best on intermediate confidence instances (70.6% F-measure). With an F-measure of 70.0%, the RIPPER rule learner was the most successful machine learning approach, with greater accuracy but poorer recall than MTERMS. The suggested NLP-based technique proved successful in finding a considerable number of depression cases (about 20%) that were not on the coded diagnostic list [18].
Acharya et al. introduced a unique computer model for screening depression using EEG data, which used a deep neural network machine learning approach called convolutional neural network (CNN). Unlike previous approaches that need a manually selected collection of factors to be fed into a classifier for classification, the proposed strategy automatically and adaptively learns from the input EEG signals to discriminate between EEGs acquired from depressed and non-depressed people. To test the theory, the researchers used EEGs from 15 depressed and 15 non-depressed people. By utilising EEG input from the left and right hemispheres, the system attained accuracies of 93.5% and 96.0%, respectively. The EEG signals from the right hemisphere were shown to be more distinct in depression than those from the left hemisphere, indicating a potential link between depression and right hemisphere hyperactivity. The researchers proposed that this model be developed to identify multiple periods and severity levels of depression and to develop a depression severity index (DSI) [19].
Delgadillo et al. sought to identify patient subgroups who respond differentially to cognitive-behavioural therapy (CBT) or person-centred counselling (CfD) for depression. A retrospective review of archival data from 1435 individuals who underwent either CBT or CfD in primary care was employed in the research. In a training sample of 1085 patients, the scientists employed a machine learning method termed elastic net with optimum scaling to construct a targeted prescription algorithm. The results showed that patients in the test sample who received the “ideal” therapy as recommended by the algorithm improved much more (62.5%) than those who received the “suboptimal” treatment (41.7%) [20].
The research paper by Shakeel Ahmad et al. [21] proposes a methodology to detect and classify extremist affiliations on social media using sentiment analysis techniques. The study used Twitter streaming API and Dark Web forums to collect the dataset. The authors employed supervised machine learning, unsupervised lexicon-based and clustering-based techniques, and deep learning models for sentiment analysis. The results showed that deep learning models outperformed other methods in terms of accuracy. This research provides valuable insights into monitoring online activities related to extremism for national security agencies. Renata et al. [22] used sentiment analysis and deep learning to collect and analyze data from online social networks for personalized recommendations. The authors used a dataset of messages extracted from Twitter to train their model and conducted subjective tests to establish user preferences. The KBRS architecture considers sentences extracted from social networks. Results showed that the system was effective in identifying relevant messages for users while optimizing resource consumption on electronic devices. Overall, this approach presents a promising solution to the problem of developing a recommendation system using deep learning and sentiment analysis on data collected from online social networks. Cheng et al. [23] proposes a sentiment analysis framework based on deep learning models to extract sentiments from social media. The authors collected reviews from social media platforms to build a dataset and proposed three deep learning-based models, including LSTM, BiLSTM, and GRU, to classify review sentiments. The results showed that the proposed BiLSTM model outperformed the other two models with an accuracy of 87.17%. This study highlights the importance of sentiment analysis in analyzing user-generated content on social media platforms and suggests that deep learning-based models can effectively extract sentiments from such data. In the view of depression detection, additionally recent research has shown the effectiveness of deep learning-based methods in healthcare domains [24,25,26,27,28,29]. For example, in smart healthcare, a deep learning-based predictive evaluation system has been proposed to enable interactive multimedia-enabled smart healthcare [30]. In the field of education, a computer-aided instruction system has been developed for college music majors that uses convolutional neural networks [31]. Another study proposed a content-aware fusion method for RGB-D saliency prediction [32]. In 3-D point cloud classification, a dual-graph attention convolution network has been proposed [33]. Additionally, a traffic burst-sensitive model has been developed for short-term prediction under special events [34]. In the field of robotics, various deep learning models gain attention for solving different real life problem [35,36,37,38,39,40].
The studies highlight the potential benefit of using machine learning and deep learning to identify subgroups of patients who respond differently to different types of therapy, which could inform treatment decisions. However, it is crucial to highlight that the study has several limitations, such as the sample size and the retrospective methodology, and that other studies with bigger sample sizes and various demographics are needed to corroborate the findings. Various studies emphasize the hybrid method for utilizing deep learning to identify patient subgroups that respond differently to different forms of therapy, which might improve treatment decisions [21,22,23]. The architecture of deep learning, the optimization methods used, and the calibration of hyper parameters to identify various patterns in data are significantly responsible for its efficiency. Finding an optimization technique that can considerably enhance deep learning results is the goal of this research. The propensity to become stuck in local minima and poor convergence rates are the main difficulties that learning algorithms encounter [24,25,26,27,28,29].
The majority of traditional optimization methods are deterministic and referred to as “gradient-based approaches” since they utilize gradient information. Stochastic optimization algorithms can be categorized into heuristic and metaheuristic approaches, which are usually effective but not always reliable. To move from local search to global search, randomization is a useful strategy, and therefore, most metaheuristic algorithms aim to achieve global optimization by creating various solutions on a global scale through exploration and by focusing on limited search areas through exploitation. Each nature-inspired metaheuristic algorithm combines exploration and exploitation with its own characteristics to find the best solutions, and some of them have obtained solutions close to optimal. Choosing the best solution guarantees optimal convergence, while randomization through exploitation prevents the solutions from being trapped in local optima and increases solution diversity. A good balance between these two key components typically ensures global optimality [41,42]. Some popular examples of nature-inspired algorithms include GA, ABC, PSO, and CS algorithms, with the cuckoo search algorithm being a recent popular swarm intelligence algorithm inspired by the egg-laying behavior of cuckoo birds [43,44].
In this paper, we overcome the shortcoming of CS by introducing a PS algorithm in the exploration phase of the CS approach. After that, a new optimization algorithm named PSCS is applied with deep learning to enhance performance of deep learning for depression detection. The training model utilizes sentiment analysis to distinguish between positive expressions of depression and other psychiatric disorders as a means of detecting depression. In our study, the proposed approach addresses these shortcomings by using a multimodal approach that incorporates text, speech, and physiological signals, ensuring data privacy and security through the use of encryption techniques, and utilizing a standardized benchmark dataset for evaluation.

3. Methods Used

3.1. Deep Learning

Deep learning has lately received a lot of interest in the world of machine learning. Convolutional networks, deep auto encoders, and deep belief networks are just a few examples of the hierarchical learning structures used in this method [44,45,46,47,48,49]. For tasks such as pattern categorization and representation learning, these designs have several input processing layers. One popular approach for training neural network weights is through the use of a backpropagation algorithm. This algorithm involves propagating the error from the output layer back through the network, adjusting the weights in each layer based on the error gradient with respect to the activation of the previous layer; using these hierarchical architectures aims to lower the total inaccuracy of the network [21,22,23,33]. In place of the traditional backpropagation approach, this study suggests using a modified particle swarm (PS) optimization technique to train deep neural networks. The backpropagation algorithm is widely used for supervised learning in deep neural networks, but it has limitations in terms of convergence speed and the possibility of getting trapped in local optima [27,28,29]. To address these issues, we applied the modified particle swarm optimization algorithm to a deep neural network architecture for classification tasks. In the modified particle swarm optimization algorithm, we replaced exploitation phase PS with the cuckoo search (CS) algorithm, named the PSCS algorithm. PSCS combines the strengths of both particle swarm optimization and cuckoo search algorithms, which allows for a more efficient and effective optimization of the network parameters.

3.2. Particle Swarm Optimization (PSO)

Particle swarm optimization (PSO) is an optimization algorithm based on a random probability distribution. Kennedy and Eberhart initially presented it in 1995 and also represented its various uses for different problem-solving purposes [50]. The social behavior of fish schools and bird flocks, in which individuals coordinate their movement based on the positions and velocities of their neighbors, serves as the model for the algorithm [51]. Because of its simplicity, resilience, and efficacy in tackling a wide range of optimization problems, particle swarm optimization (PSO) has grown in popularity. The method is used in a variety of industries, including engineering, economics, biology, and image processing. PSO’s primary goal is to find the optimal solution to an optimization issue by iteratively updating the location and velocity of a population of particles, each of which represents a potential solution [52]. The process starts with a random population of particles with random positions and speeds. Using the objective function, each particle evaluates its fitness and then changes its velocity and location depending on its own best prior position and the best position of its neighbors.

3.3. Cuckoo Search (CS)

Cuckoo search (CS) is a population-based metaheuristic optimization approach that Yang and Deb initially introduced in 2009. Cuckoo birds, which lay their eggs in the nests of other bird species and rely on the host birds to hatch and nurture their young, inspired CS [53]. The goal of CS is to iteratively explore the solution space for the best answer to an optimization problem using reproduction, selection, and replacement. Each solution in computer science is symbolized by a cuckoo egg, and each cuckoo egg refers to a valid solution to the optimization problem. The process begins with a population of cuckoo eggs created at random. During the search process, some cuckoo eggs are replaced with new eggs generated by random walk. This process mimics the reproduction behavior of cuckoo birds. Additionally, a levy flight strategy is used to generate new solutions that can help the algorithm to escape from local optima [54].

3.4. Proposed Method

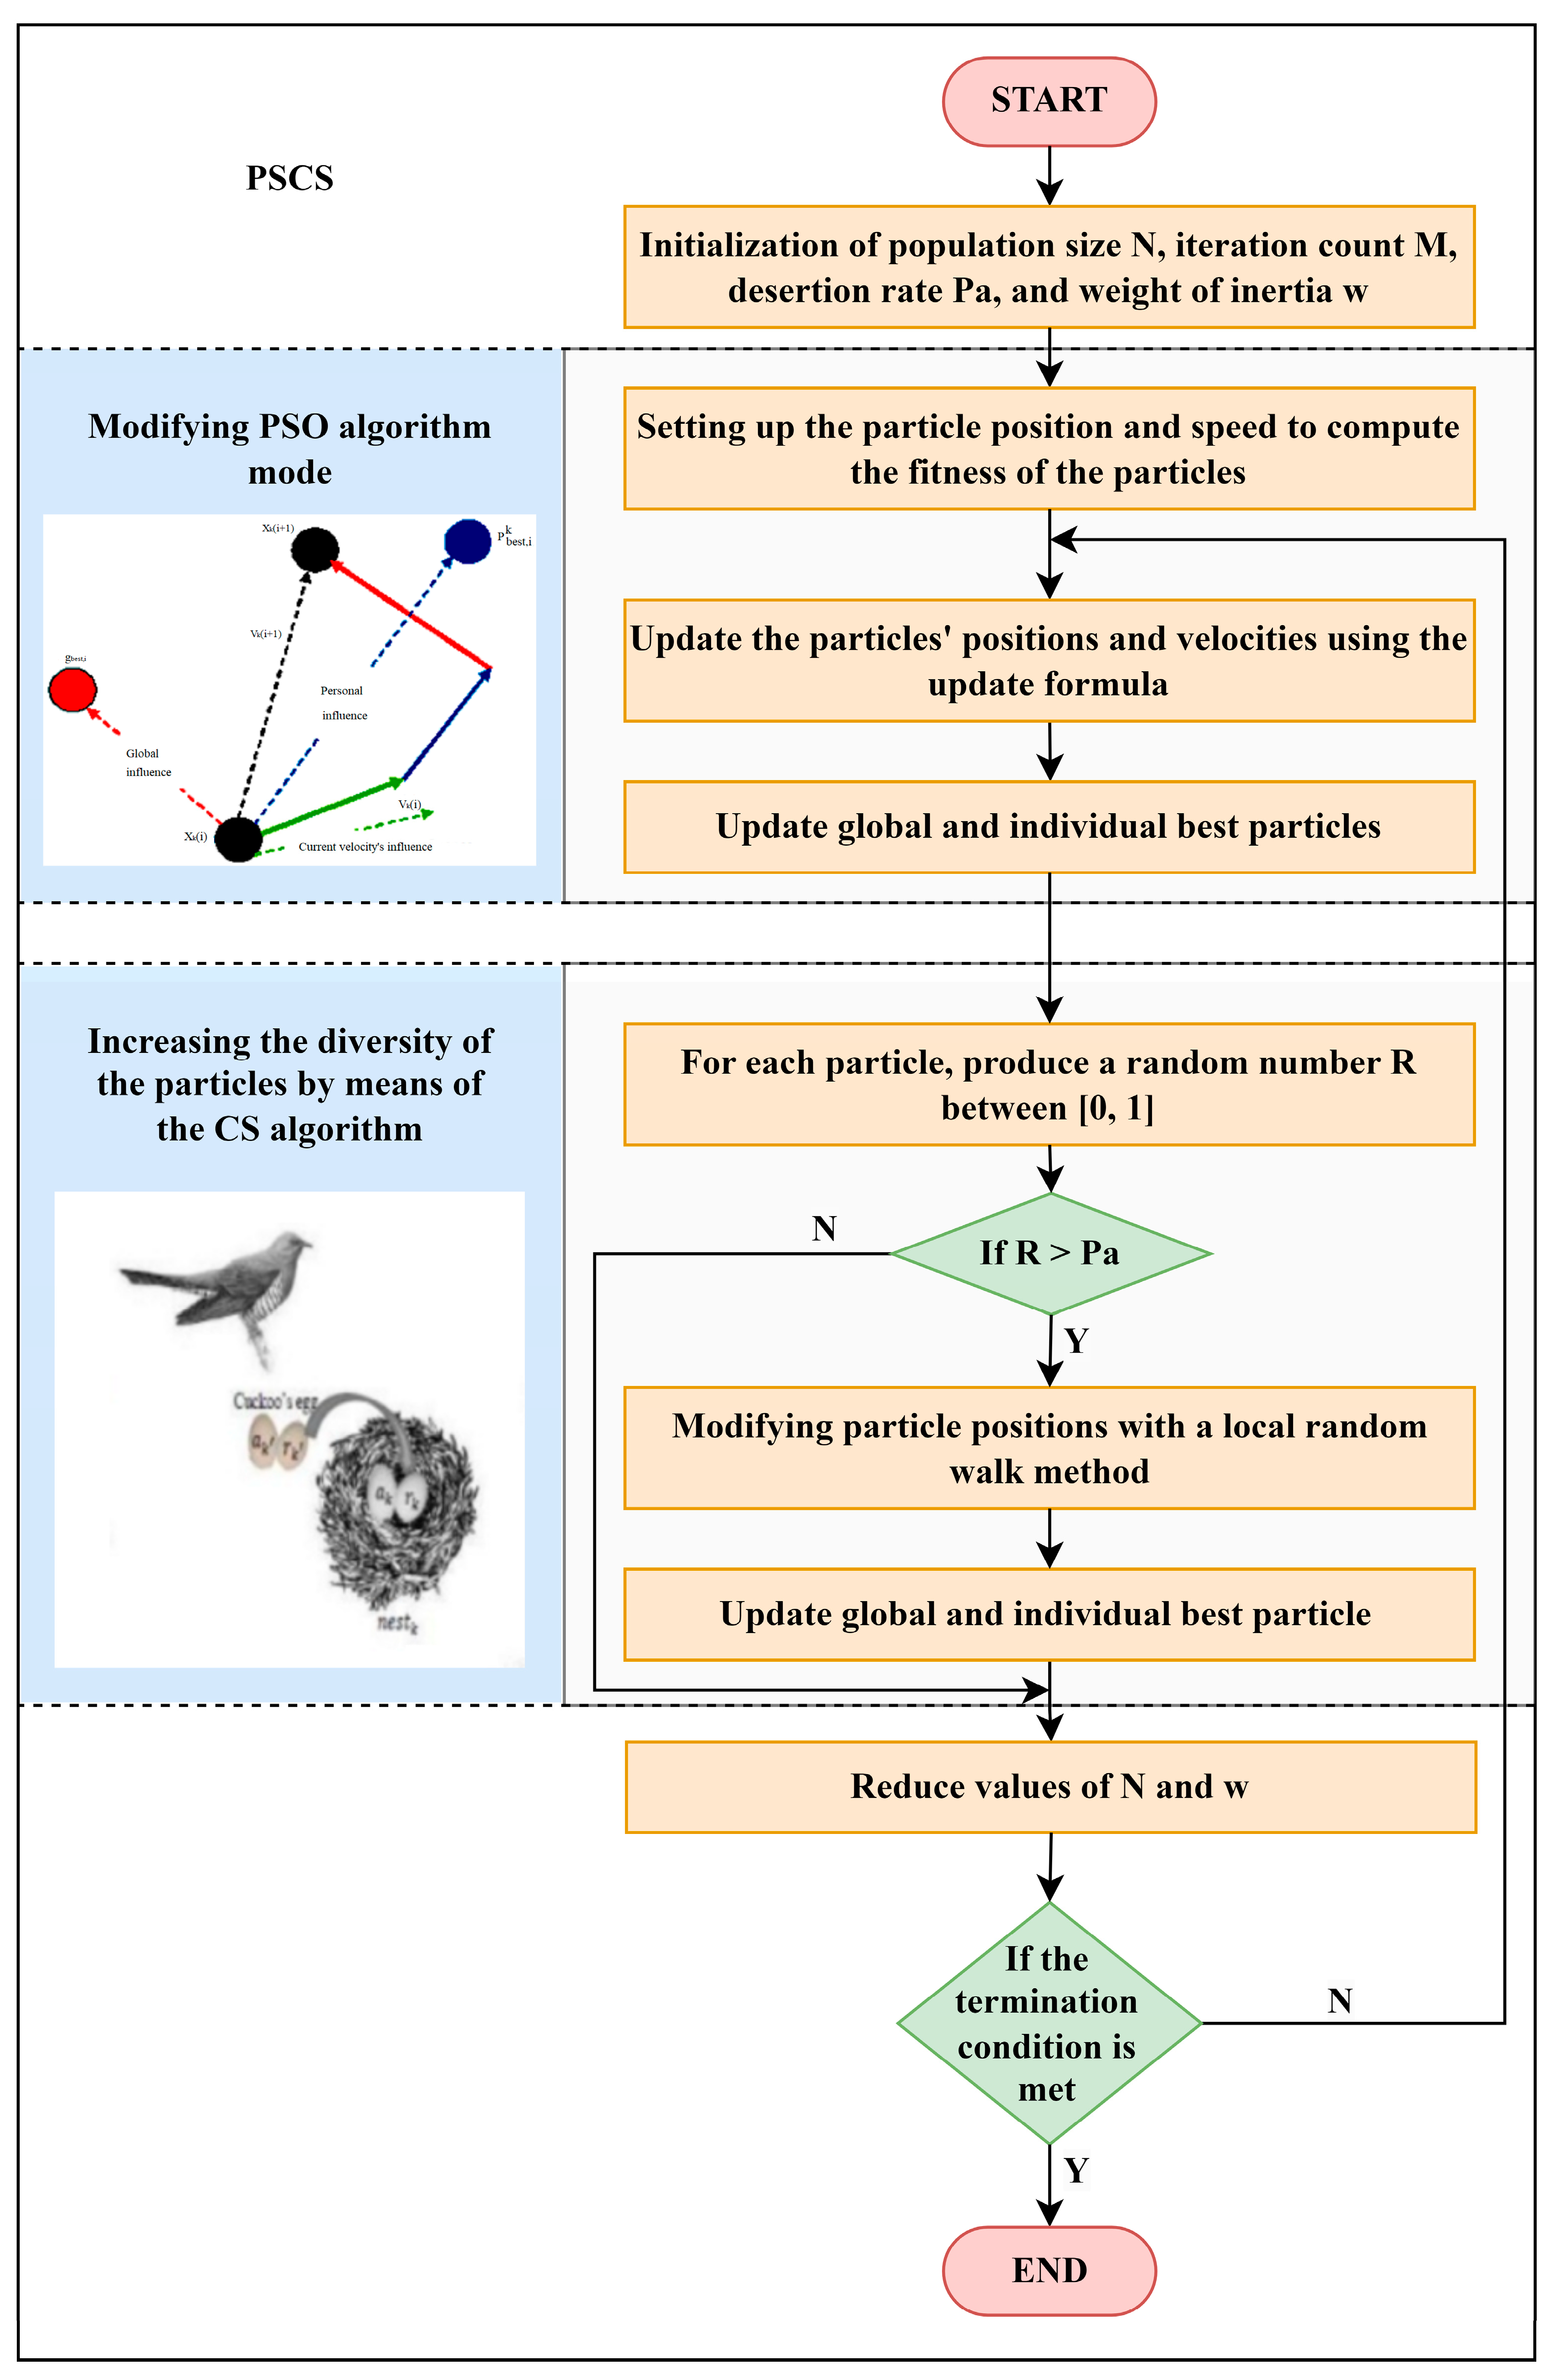
The flowchart (Figure 2) provides a visual representation of how the hybrid PSO and CS algorithm works in conjunction with deep learning models to optimize their performance. It shows the steps involved in the optimization process and how the algorithm’s parameters can be adjusted to improve the models’ accuracy. It illustrates the steps involved in the hybrid PSO and CS algorithm, which includes initializing the swarm, setting up the fitness function, and applying the PSO and CS optimization techniques to search for the optimal model parameters. The hybrid PSO and CS algorithm is a sophisticated optimization approach that synergistically integrates the particle swarm optimization (PSO) and cuckoo search (CS) algorithms. The algorithm operates by generating a group of particles, each of which is given a unique position and velocity that allows them to explore the search space. These particles interact with each other, exchanging information on the best solutions found so far, thereby facilitating a collaborative approach towards identifying the optimal solution. In contrast, the cuckoo search algorithm is inspired by the breeding behavior of cuckoo birds, where a population of nests, representing candidate solutions, is evaluated based on their fitness. To improve the solution quality, some nests are replaced with new solutions generated randomly from the best nests found to date. By merging the strengths of both the PSO and CS algorithms, the hybrid algorithm enhances the overall optimization performance. This can be achieved in different ways, such as using the PSO algorithm to initialize the population and the CS algorithm to perform local search, or using PSO algorithm to update the velocity of the particles and CS algorithm to update their position (Algorithm 1).
Algorithm 1: PS-CS Optimization
    Initialize the PSO algorithm with N particles
    Initialize the CS algorithm with M cuckoo nests
    While stopping criterion is not met do
1.
      // Evaluate fitness of particles and cuckoos
2.
      For each particle in PSO:
 
            Evaluate the fitness of the particle
ii.
          If the particle’s fitness is better than its personal best
    (a)
  update personal best
iii.
        If the particle’s fitness is better than the global best
  
    update global best
      For each cuckoo in CS:
          Evaluate the fitness of the cuckoo
      // Update PSO global and local best solutions
      For each particle in PSO:
1.
      Update the particle’s velocity and position using the PSO update equation
2.
      If the particle’s fitness is better than its personal best
1.
    update personal best
3.
        If the particle’s fitness is better than the global best
1.
    update global best
      // Update cuckoos using CS algorithm
      For each cuckoo in CS:
1.
          Choose a random cuckoo from the nest and perform a Levy flight
2.
          If the new cuckoo’s fitness is better than the old cuckoo’s fitness
  
    replace the old cuckoo with the new cuckoo
      // Update PSO particles using information from CS algorithm
      For each particle in PSO:
1.
    If the particle is in the top k% of the population
 
    update the particle’s position using the best cuckoo’s position
2.
          Else
  
    update the particle’s position using the PSO update equation
      // Perform PSO search on a subset of cuckoos
      Choose a subset of the cuckoo nests
      For each chosen cuckoo in the subset:
a.
          For each particle in PSO:
  
     If the particle’s fitness is better than the chosen cuckoo’s fitness
a.
    update the chosen cuckoo’s position with the particle’s position
      // Update PSO particles using information from PSO search
1.
      For each particle in PSO:
1.
    If the particle’s fitness is better than its personal best
    (a)
  update personal best
2.
    If the particle’s fitness is better than the global best
    (a)
  update global best
    (b)
  Update the particle’s velocity and position using the PSO update equation
    end while

3.5. PS-CS Update Equation

During the optimization process, the PS-CS update equation is utilized to update the velocity and position of each particle in the swarm. It involves three components: the particle’s current velocity, its distance from its personal best solution, and its distance from the global best solution found by the swarm.
Vi(t + 1) = w × Vi(t) + c1 × rand1 × (pbesti − Xi(t)) + c2 × rand2 × (gbest − Xi(t))
Xi(t + 1) = Vi(t) + Vi(t + 1)
In Equation (1) Vi is the velocity of particle i at time t, in Equation (2) Xi is the position of particle i at time t, pbesti is the personal best solution found by particle i so far, gbest is the global best solution found by the swarm so far, “c1” and “c2” are the cognitive and social parameters, which control the influence of the particle’s personal best and the swarm’s global best on the update, “rand1” and “rand2” are random values drawn from a uniform distribution between 0 and 1.

4. Experimental Setup

4.1. Dataset

Our deployed model was trained on a rich dataset sourced from Reddit—one of the largest and most diverse social media platforms in the world. Specifically, we utilized the Reddit depression dataset, which can be accessed via Kaggle (https://www.kaggle.com/datasets/infamouscoder/depression-reddit-cleaned (accessed on 26 March 2023)). To compile this dataset, we employed the Push Shift API (https://github.com/pushshift/api (accessed on 26 March 2023)) to collect posts from a total of 28 subreddits, including 15 dedicated to mental health. For our study, we utilized the Push Shift API to collect posts from a variety of subreddits related to mental health, depression, and other relevant topics. This allowed us to gather a diverse and comprehensive dataset for use in training and testing our model. This allowed us to gather a comprehensive range of posts related to depression and other mental health issues from a variety of perspectives and sources.
In order to facilitate an effective assessment of our model’s performance, we utilized a more streamlined dataset consisting of 232,074 distinct posts, including 116,037 suicidal posts and 116,037 non-suicidal posts. Each post is accompanied by a corresponding depressed or non-depressive diagnosis, providing valuable context and insight into the mental health status of the user. There are several special characters in the data. The data source for this study is a CSV file. The purpose is to classify the kind of depression based on patient replies to a questionnaire. These responses will be used to train a model that can identify the kind of depression. Table 1 shows experimental setup that was used in this research.

4.2. Preprocessing of Dataset

4.2.1. Tokenization

Tokenization is the process of dividing a written document into smaller components called tokens. Words, word fragments, and even single characters such as punctuation can be considered as tokens. Because each piece of data is treated separately, tokenization analysis allows us to better understand the text’s meaning. This procedure can help us hone our model’s comprehension and processing of the content. Using the NLTK package, we tokenized the input data, dividing it up into an array of tokens. The Natural Language Toolkit (NLTK) is a widely used Python package for natural language processing (NLP) tasks. In our study, we utilized the NLTK package extensively to preprocess and clean the Reddit depression dataset. Specifically, we employed NLTK’s word tokenization, which involves splitting text into individual words, as well as stemming, which involves reducing words to their base form. These techniques helped us extract meaningful information from the raw data and convert them into a structured format that could be easily analyzed.

4.2.2. Data Cleaning

We carried out a data cleaning procedure, which entailed eliminating punctuation and special characters from the text to prepare the dataset for modeling. Some characters contain symbols such as (!./?) could make it difficult to represent the data accurately and may not add to the context of the text. In order to increase the precision of our model, we cleaned and normalized the data.

4.2.3. Stemming

Stemming is a method for obtaining a word’s basic form by eliminating its affixes. Having the ability to retain only the stems rather than the whole words allows us to decrease the size of the index and dataset while simultaneously improving retrieval precision. We are able to keep the meaning and usage of the stems while removing extraneous information from the words by using stemming methods. We are able to better evaluate and comprehend the data thanks to this procedure. The example is given below.
Working = Work + ing (Stemmed word is work)
Crying = Cry + ing (Stemmed word is cry)
Depression = Depress + ion (Stemmed word is depress)
We eliminate affixes from the data using the Porter stemmer stemming method. Using this method, affixes are systematically removed to reveal the word’s base form. The input array held the affixes in the same sequential sequence as the initial input data. We were able to better process and evaluate the data thanks to this procedure.

4.2.4. Embedding Normalization

Word embeddings are a method for representing textual characters numerically in the form of vectors. The many facets of the word in relation to the whole text are intended to be captured by these vectors. GloVe embedding, an unsupervised learning approach that creates word embeddings by combining global word co-occurrence matrices from a given corpus of data, was used for our textual data. The associations between words are mostly derived by the GloVe algorithm using statistics. It makes use of a regression model that is trained on a huge database of word co-occurrence counts in order to determine the statistical significance of words and the degree of relationship between two words. By using this method, we can more easily express words as numbers and analyze them. The Figure 1 depicts the preprocessing of the dataset along with the method of normalization and how the dataset was converted into a numeric word-based dataset with the images which were the input for the proposed methodology.

4.3. Proposed Deep Learning Architecture

A convolutional neural network (CNN)-based deep learning architecture with multiple layers designed for image classification as shown in Table 2 as well as Figure 3 depicts a clear visualization for the same. The input is a grayscale image of size 32 × 32 × 1, where the last dimension corresponds to the color channel. The network consists of two convolutional layers with 128 and 48 filters, respectively, each followed by a 2 × 2 average pooling layer to reduce the size of the feature maps. The convolutional layers utilize the rectified linear unit (ReLU) activation function. After the second pooling layer, the output feature maps are flattened into a one-dimensional vector of length 256. This vector is then passed through a dropout layer to prevent overfitting, which randomly sets a fraction of the input units to zero during training. The output of the dropout layer is then passed through a fully connected layer with 128 neurons and the dense activation function. The kernel size determines the size of each convolutional neuron’s receptive field, while the depth of the layer is determined by the number of filters. A common method for normalizing a layer’s activations over a small batch of input data is batch normalization. Internal covariate shift, also known as a change in the distribution of layer activations during training, is successfully decreased by this normalization technique, improving model stability and generalization. In deep learning models, the rectified linear unit (ReLU) is a popular non-linear activation function. It is renowned for its computational effectiveness, simplicity, and capacity to improve neural networks’ performance in a variety of applications. Max pooling is used in convolutional neural networks to down-sample the feature maps and decrease their spatial dimensions. This process extracts important characteristics from the incoming data to increase the network’s effectiveness. An approach that lowers the model’s parameter count after the convolutional and activation layers is frequently used to boost generalization performance. The output of the last convolutional layer is transformed into a one-dimensional vector using a flatten layer, which is followed by a dense layer that is completely connected to the preceding layer. The model can make the final classification determination thanks to this dense layer. The probability scores for each class are generated using a softmax activation function, and the final classification predictions are generated by the output layer. The fully connected layer’s output parameter reflects the number of classes in the data. For example, if the output size is set to 2, the data have two kinds. The hybridized PS-CS approach will be utilized as an optimization tool to enhance the proposed deep learning model depicted in Figure 2. The proposed model is presented in Section 3.5, and a thorough description of this algorithm is given there.

4.4. Parameter Setting of Proposed Models

The probability of discovering an egg is represented by Parameter Pa. In the modified cuckoo search algorithm, the Pa value is adjusted dynamically using the following equation:
P a =   P amax P amax   P amin iter max     iter
Equation (3) has a number of parameters. Pamax is the highest chance a cuckoo has of finding an egg in a particular nest, and it denotes the maximum likelihood of doing so. Pamin, on the other hand, represents the lowest likelihood that a cuckoo will find an egg in a specific nest, which is the lowest probability. itermax describes the most iterations a cuckoo will make in order to locate an egg in a particular nest. This setting restricts how many times. The cuckoo will seek for an egg before abandoning the nest and going on to another. The suggested model’s classification accuracy is evaluated using the fitness function:
Classification   Accuracy   = CC N × 100
Equation (4) involves two parameters: N, which refers to the total number of samples in the relevant class; and CC, the number of observations that were properly classified. To evaluate the proposed method’s fitness function, the classifier’s classification accuracy is considered. If the fitness degree value is greater than that of the previous answer, the previous result is discarded in favor of the current one. Otherwise, the previous solution is retained. Finally, the fitness function is described in Equation (5):
Fitness ( f ) = Accuracy   ( f a )
Accuracy: Accuracy   = TP + TN TP + FP + FN + TN .
The accuracy of a model is an indicator of its performance. Precision is calculated as True   Positives True   Positives   +   False   Positives . A high precision value suggests a better model. Recall is calculated as True   Positives True   Positives   +   False   Negatives . A high recall value also suggests a better model. The F1 score is calculated as 2 ( Percision   ×   Recall ) Percision +   Recall . The lower the F1 score, the better the model is performing.
Accuracy (fit): Using the data, the classifier’s accuracy was assessed (f). The following list of PS-CS algorithm parameters used in our tests:
Table 3 presents a comprehensive list of parameters used in our proposed model, specifically for the cuckoo search algorithm (CS). Each “nest” in the algorithm represents a potential solution to the optimization problem. The optimization technique incorporates an “abandoning” mechanism to determine which nests to keep and which to replace with new ideas. By defining the total number of eggs deposited during each iteration using the “Total number of eggs” parameter, it is possible to strike a balance between discovering novel solutions and making use of those that already exist. The “Total number of generations” parameter specifies the greatest number of iterations for the method. The “Limit” parameter restricts the introduction of new solutions by specifying the number of times an egg may be abandoned in a nest before being removed. The “Step size” parameter regulates the rate of exploration by setting a maximum distance an egg can go in the search space during each iteration. The “Mutation probability” parameter also describes the likelihood that a mutation will occur in an egg, which can lead to the introduction of fresh ideas and increased diversity. The “Crossover rate” parameter, which defines the likelihood that two eggs will experience crossover and produce a new solution, increases the diversity of solutions being taken into consideration. The parameter values play a crucial role in determining the performance of the optimization algorithms. Changing these parameters can have a significant impact on the optimization results and finding the optimal parameter values is often a challenging task. In our study, we conducted a series of experiments to evaluate the performance of the PSO, CS, and PS-CS algorithms using different parameter values.

5. Experimental Result and Discussion

5.1. Part A: Comparison of Proposed Approach Performance with Various CNN Based Deep Learning Models

In this section, a classification task performed to distinguish between depressed and non-depressed patients using CNN-based deep learning models and compared with the performance of proposed algorithm. The LeNet, ResNet, and VGG models are well-established CNN architectures widely used in image classification tasks. The training and validation dataset were split in an 80:20 ratio, respectively, to evaluate the performance of every model for the fair comparison. The same set of hyper parameters setting used across all models to ensure a fair assessment. The Adam optimizer with a learning rate of 0.001 was utilized, along with the binary cross entropy loss function. The models were trained for a total of 20 epochs, and loss, accuracy, precision, recall, and F1 score were among the computed assessment measures. In contrast, the proposed model is a novel architecture developed specifically for this task. The performance of each model was compared based on the evaluation metrics mentioned above.

5.1.1. Training and Validation Loss

The evaluation of deep learning models during the training process heavily relies on training and validation loss as crucial metrics. Training loss, on the other hand, evaluates the difference between the anticipated and actual values of the training data; validation loss assesses the difference between the predicted and actual values of the validation data. It is essential to consider both training and validation loss to gain an overall perspective on the model’s performance visualization for the same, for the proposed algorithm is presented in Figure 4.
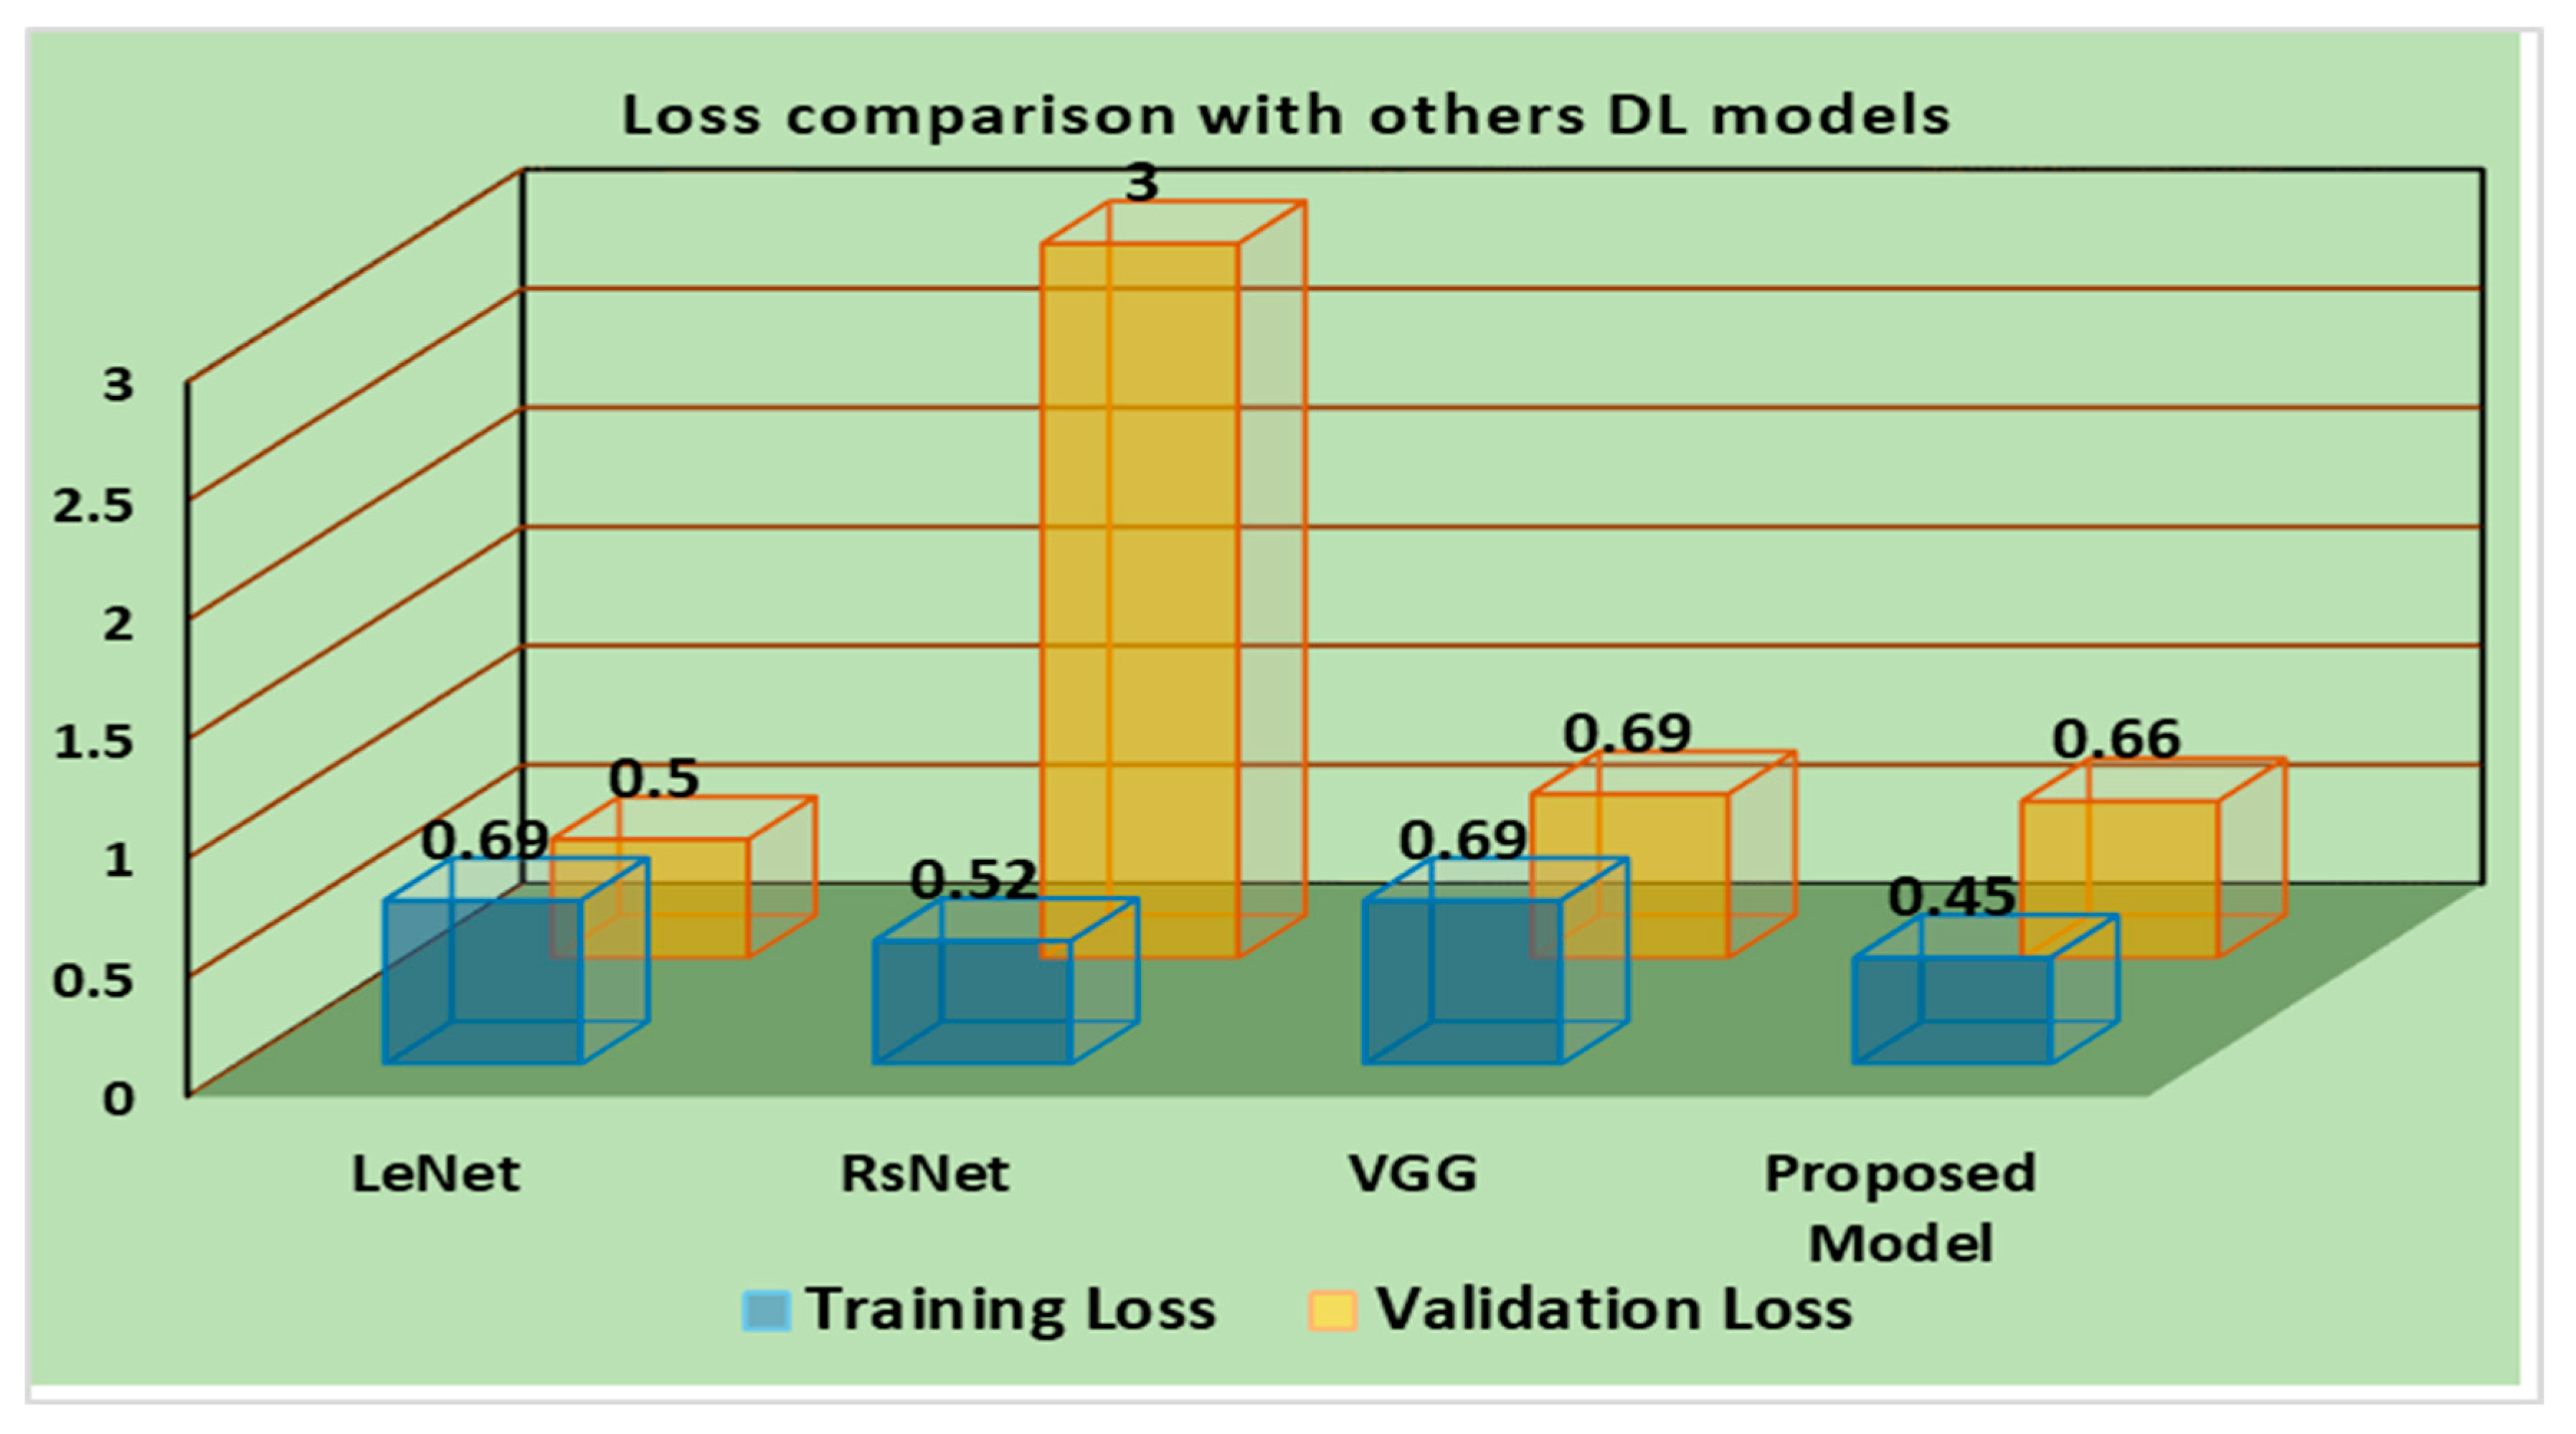
Figure 5 visualizes the overall comparison; we can observe that the proposed model indicates the lowest training loss of 0.45 and a validation loss of 0.66. This finding suggests that the proposed model is performing well and has the potential to generate reliable predictions on new, unseen data to conclude, based on the presented findings, the proposed model appears to be the most efficient among the listed models, demonstrating a balanced proportion of low training and validation loss.

5.1.2. Precision and Recall

The precision–recall graphs shown in Figure 6a–d are often used metrics for assessing the effectiveness of classification models. Whereas recall represents the proportion of real positive predictions to all actual positive examples in the dataset, precision is the ratio of true positive predictions to all positive predictions made by the model. The best results of each model with a specific threshold value have been used for comparing the precision–recall curves of each model. Here amongst all other deep learning models (VGG, ResNet, LeNet) the precision–recall graph for our proposed model (PS-CS) shows slightly better results since the training and testing curves are narrower here.

5.1.3. Receiver Operating Characteristic (ROC) Curve

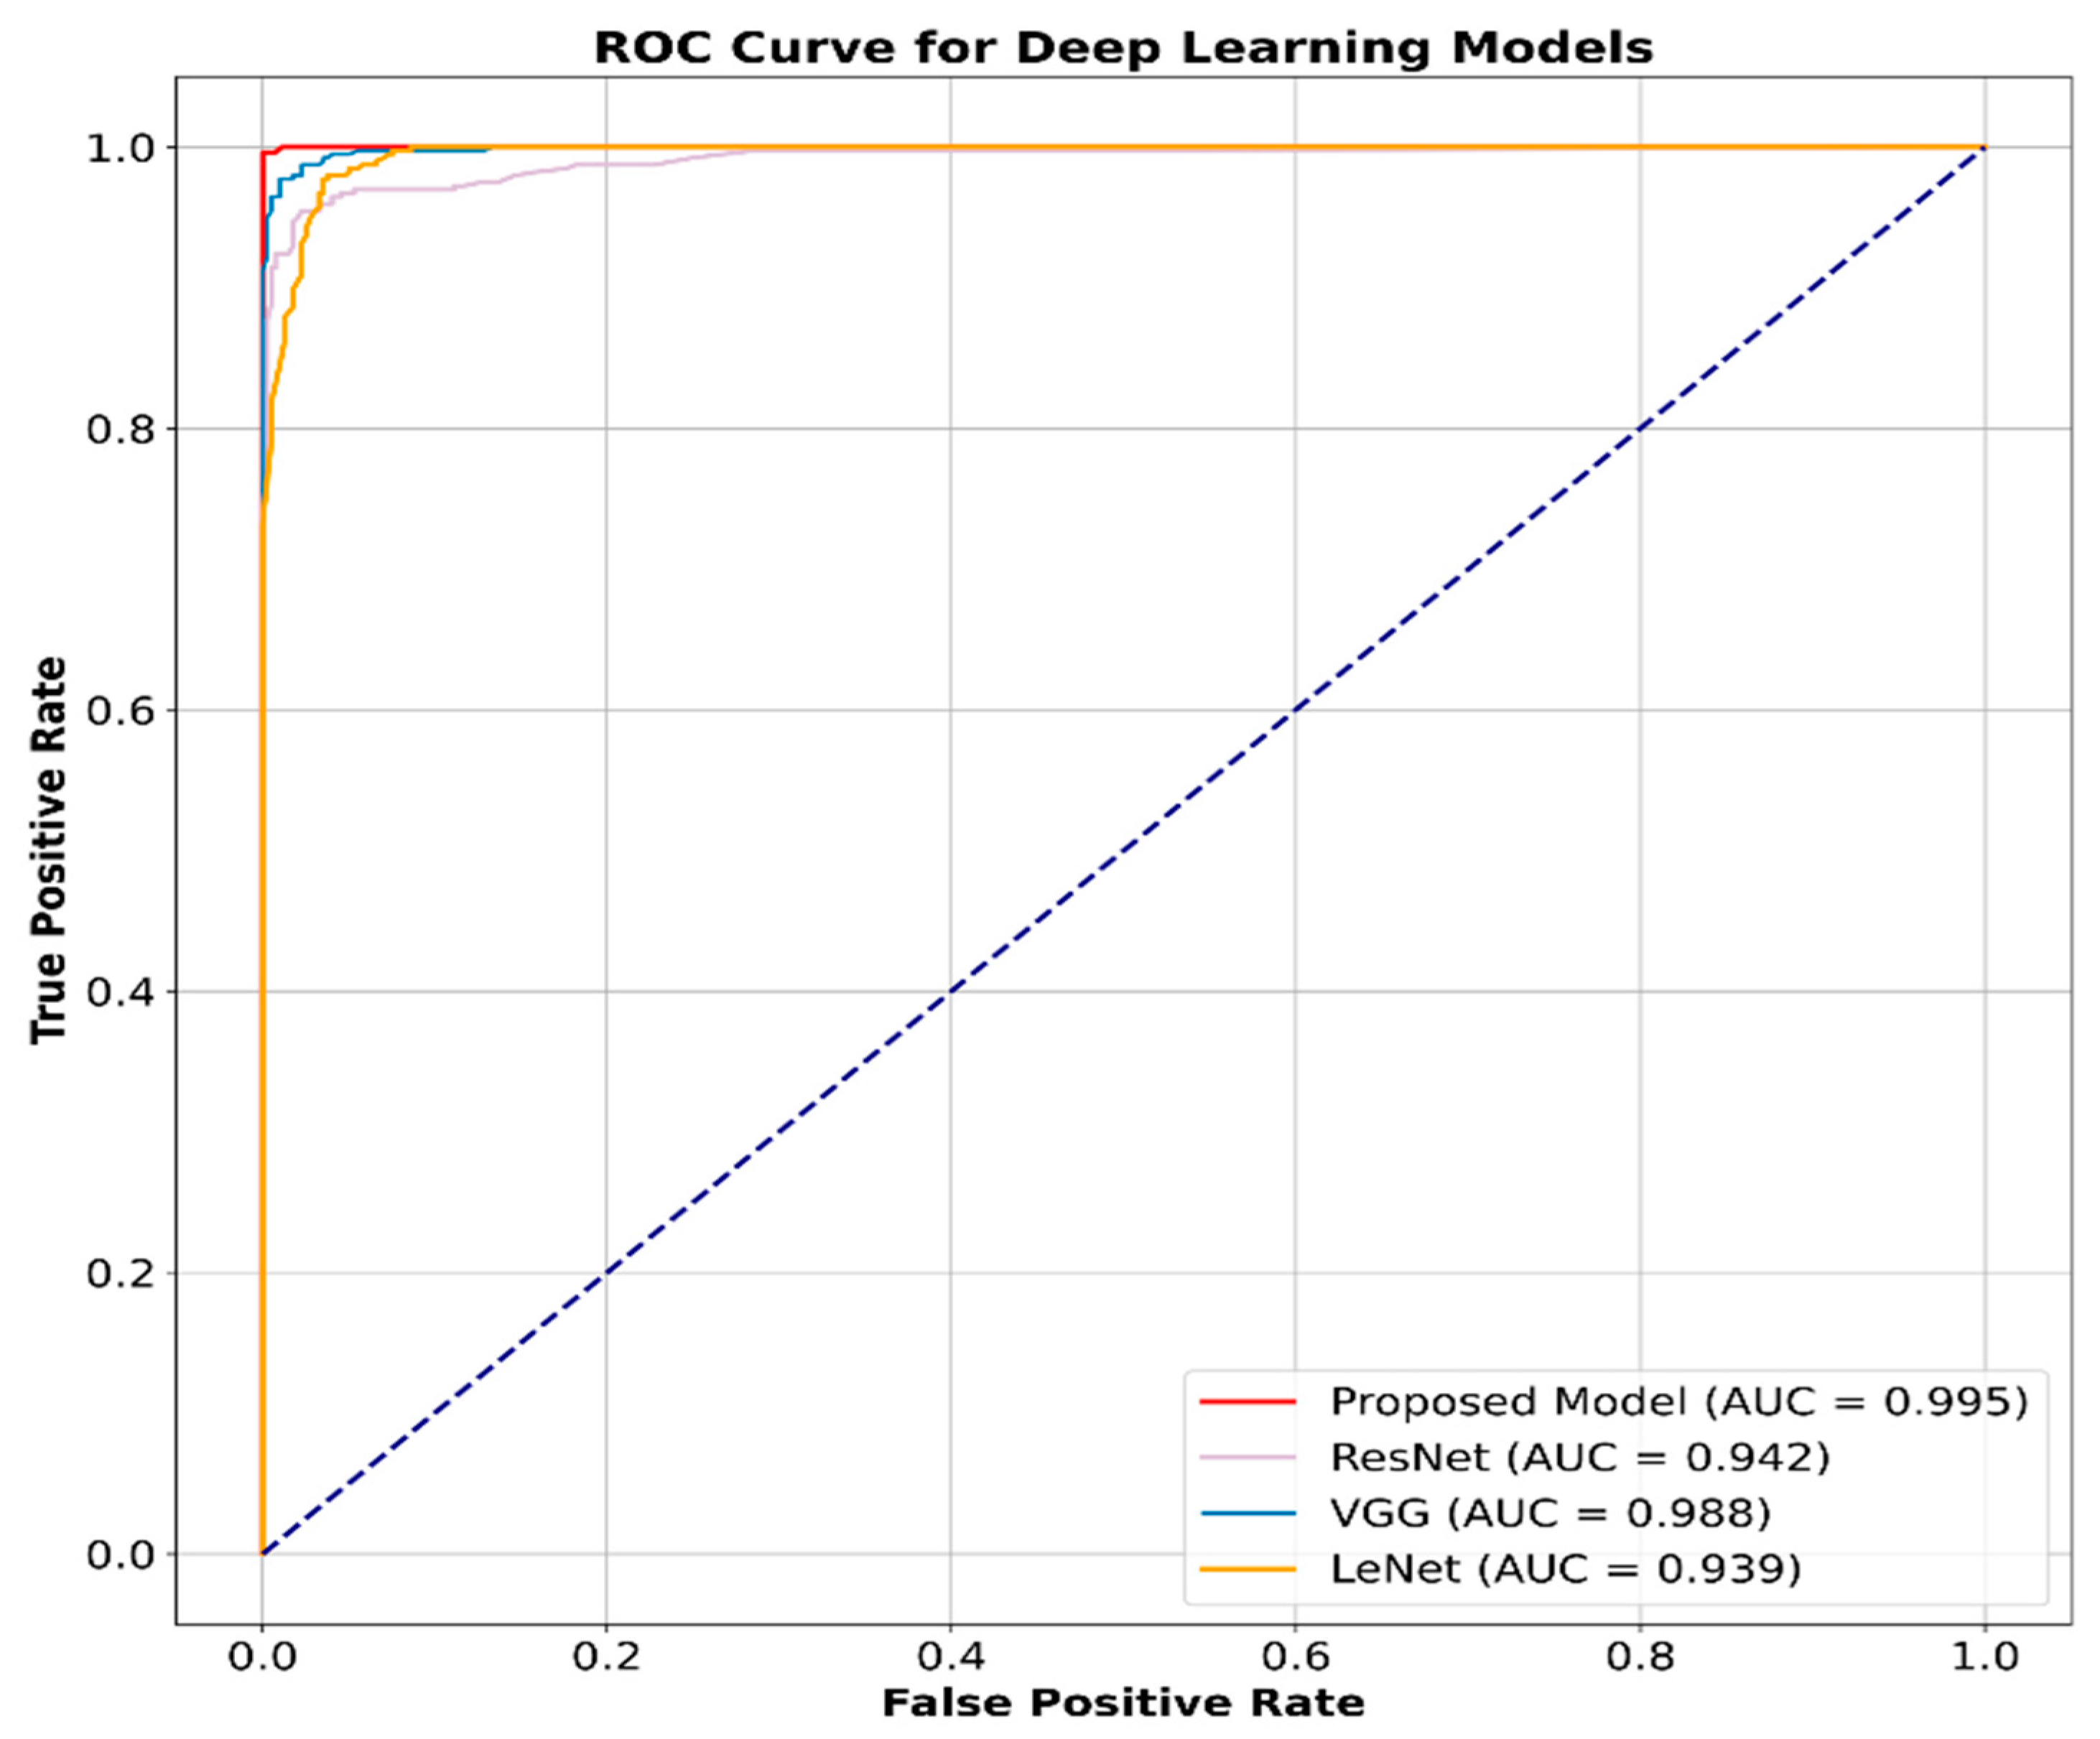
A receiver operating characteristic (ROC) curve is a graphical depiction of the performance of a binary classifier when the classification threshold is changed. For various threshold values, it compares the true positive rate (TPR) against the false positive rate (FPR). Figure 7 compare the ROC curves for various deep learning models and proposed model, respectively. This can give us an idea of how well they perform in terms of classification.

5.2. Part B: Comparison of Proposed Approach Performance with Classification Results of Other Popular Classification Models for Classification of Depressed vs Non-Depressed Patient

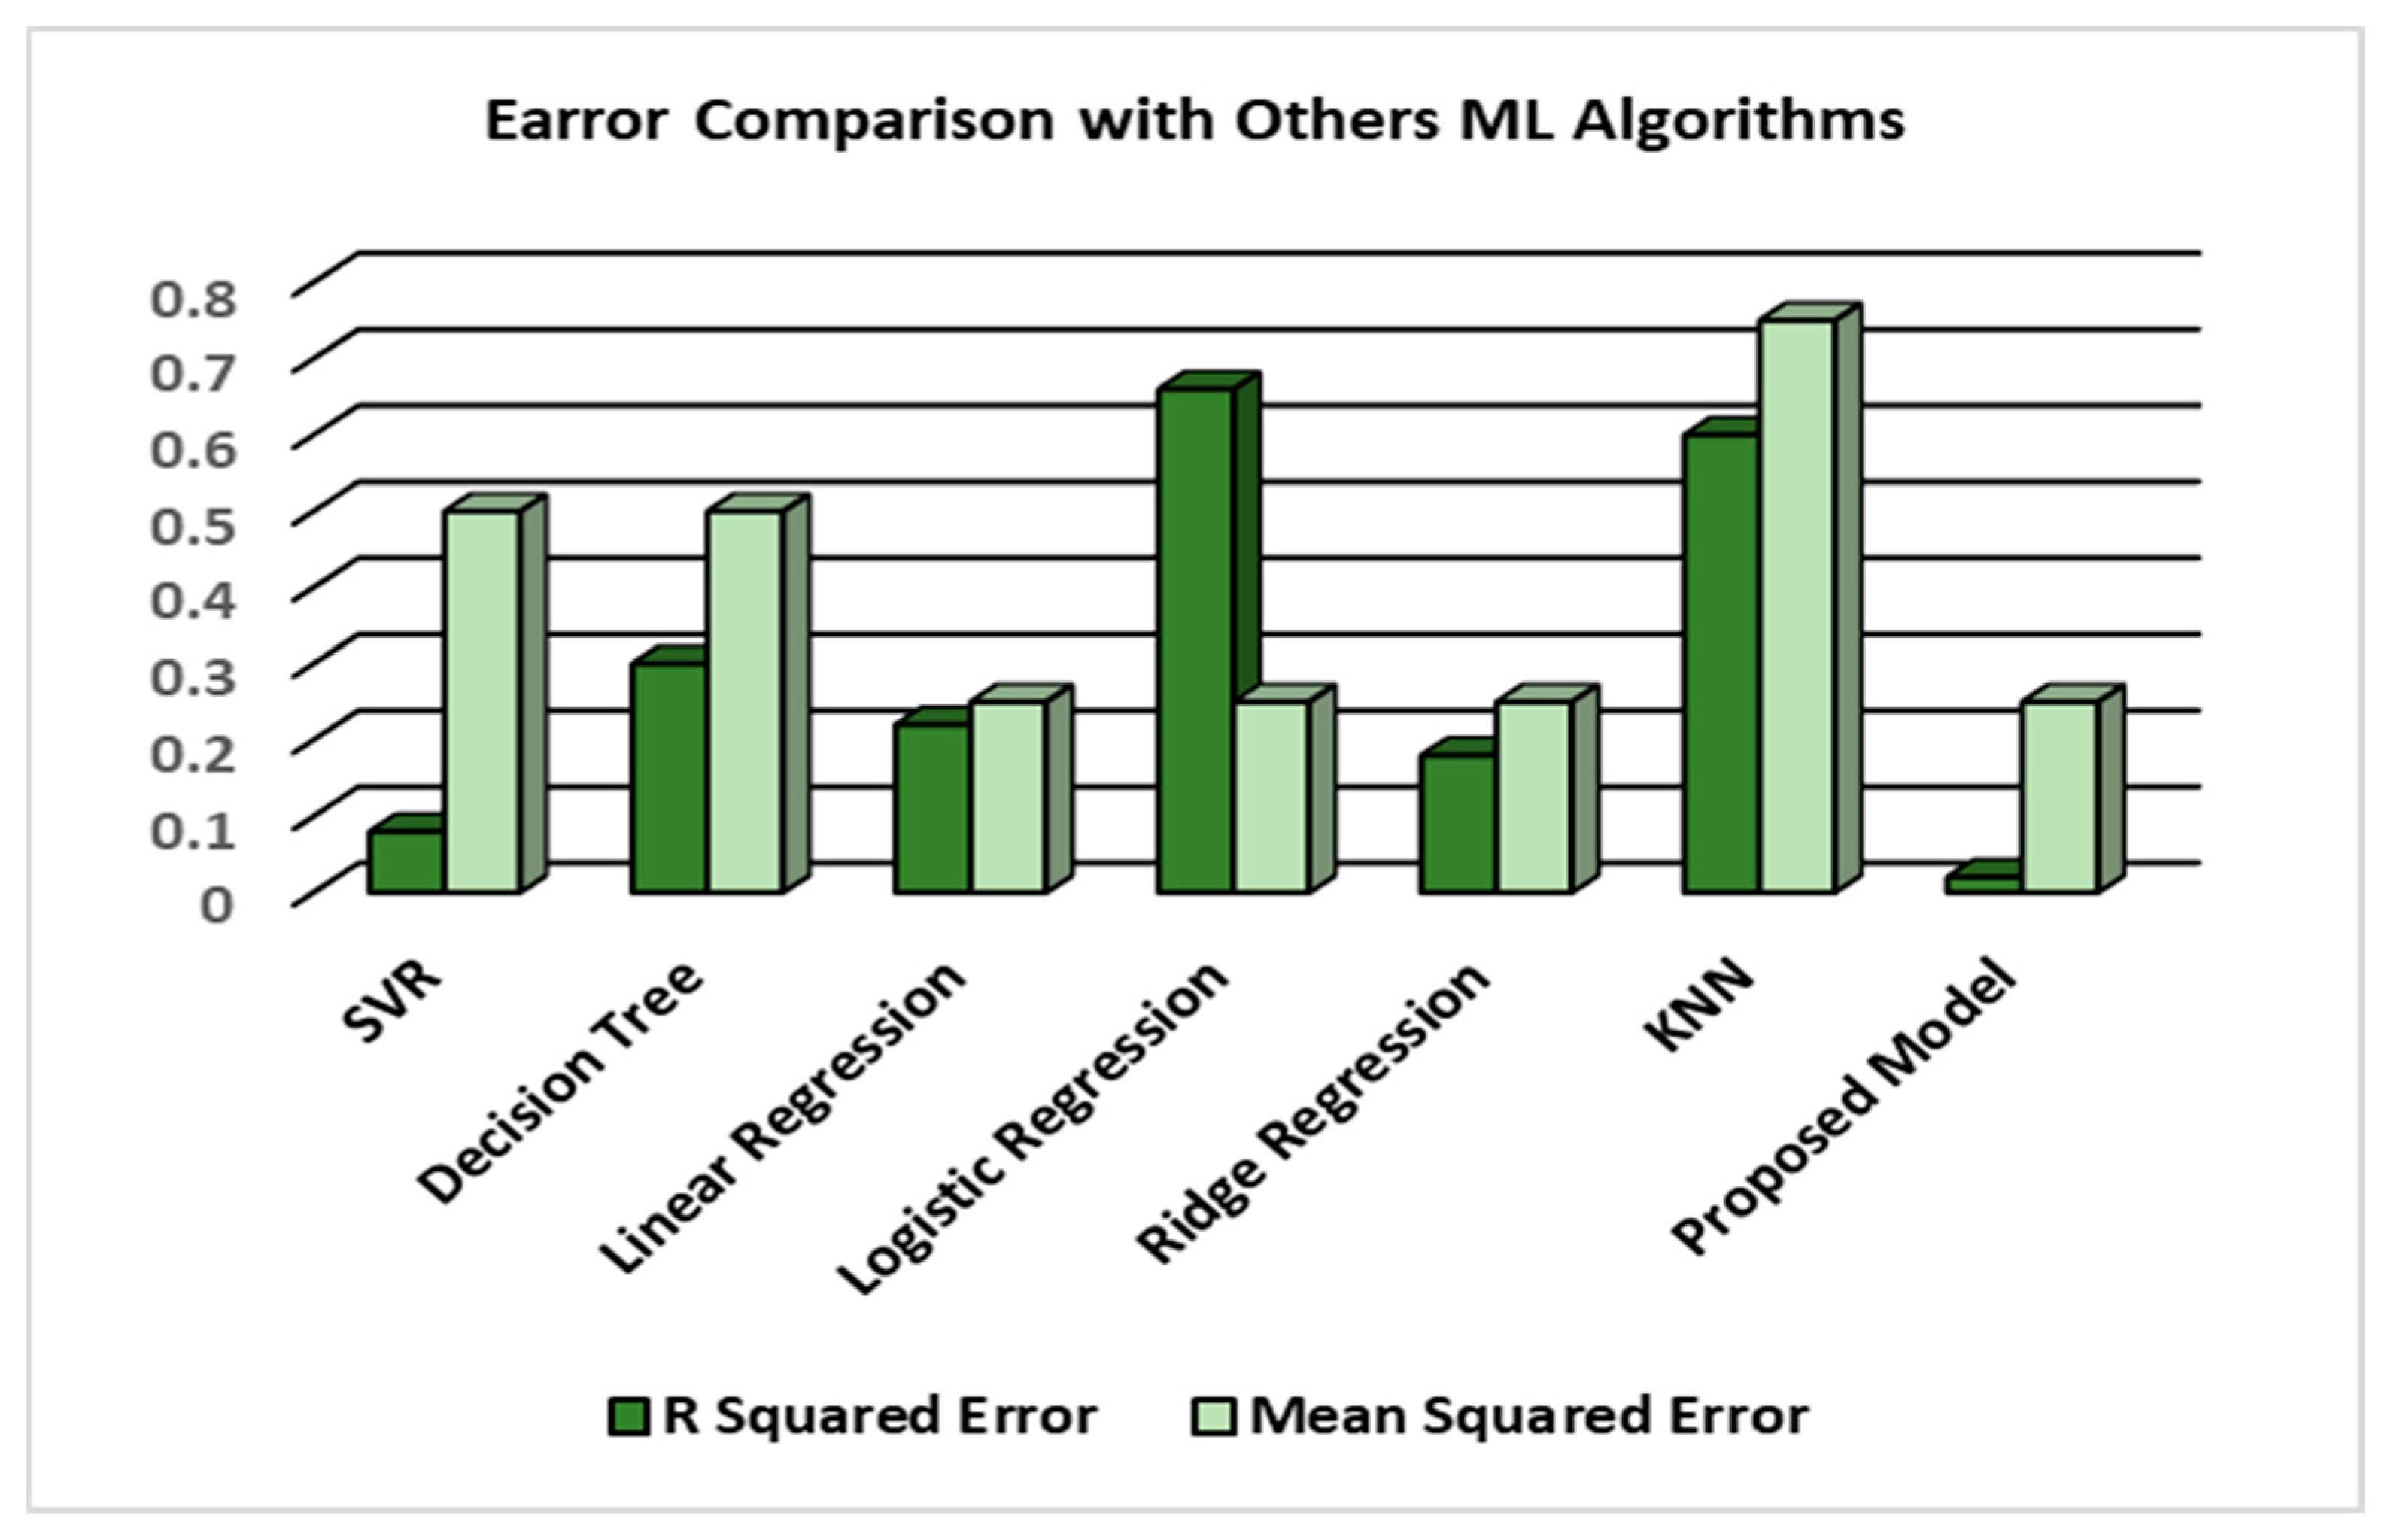
In this study, we performed a comparison of various popular classification models on the same dataset to ensure a fair evaluation. We used the same training and testing ratio for each model and ensured that all models used the same parameters. The models used for comparison were support vector regression (SVR), decision tree, linear regression, logistic regression, ridge regression, and K-nearest neighbors (KNNs). We applied the same evaluation metrics to each model to ensure a fair comparison. These metrics included R-squared error and mean squared error (MSE). The R-squared error quantifies the proportion of variance in the target variable that is predicted by the model; the MSE is a commonly used metric in machine learning for regression issues and offers a measure of how effectively the model is able to capture the variability of the data.

5.2.1. R-Squared and Mean Squared Error

The evaluation of models is essential to assess their performance in predicting outcomes. Two widely used metrics for evaluating model performance are R-squared error and mean squared error (MSE). R-squared error determines the fraction of variance in the predicted target variable by the model, while MSE measures the average squared difference between the predicted and actual values of the target variable.
Figure 8 depicted that the proposed model has the lowest R-squared error of 0.02 and MSE of 0.25, indicating its superior predictive accuracy compared to the other models. The other models have relatively higher R-squared error and MSE compared to the proposed model.

5.2.2. Confusion Matrix of Various Classification Models

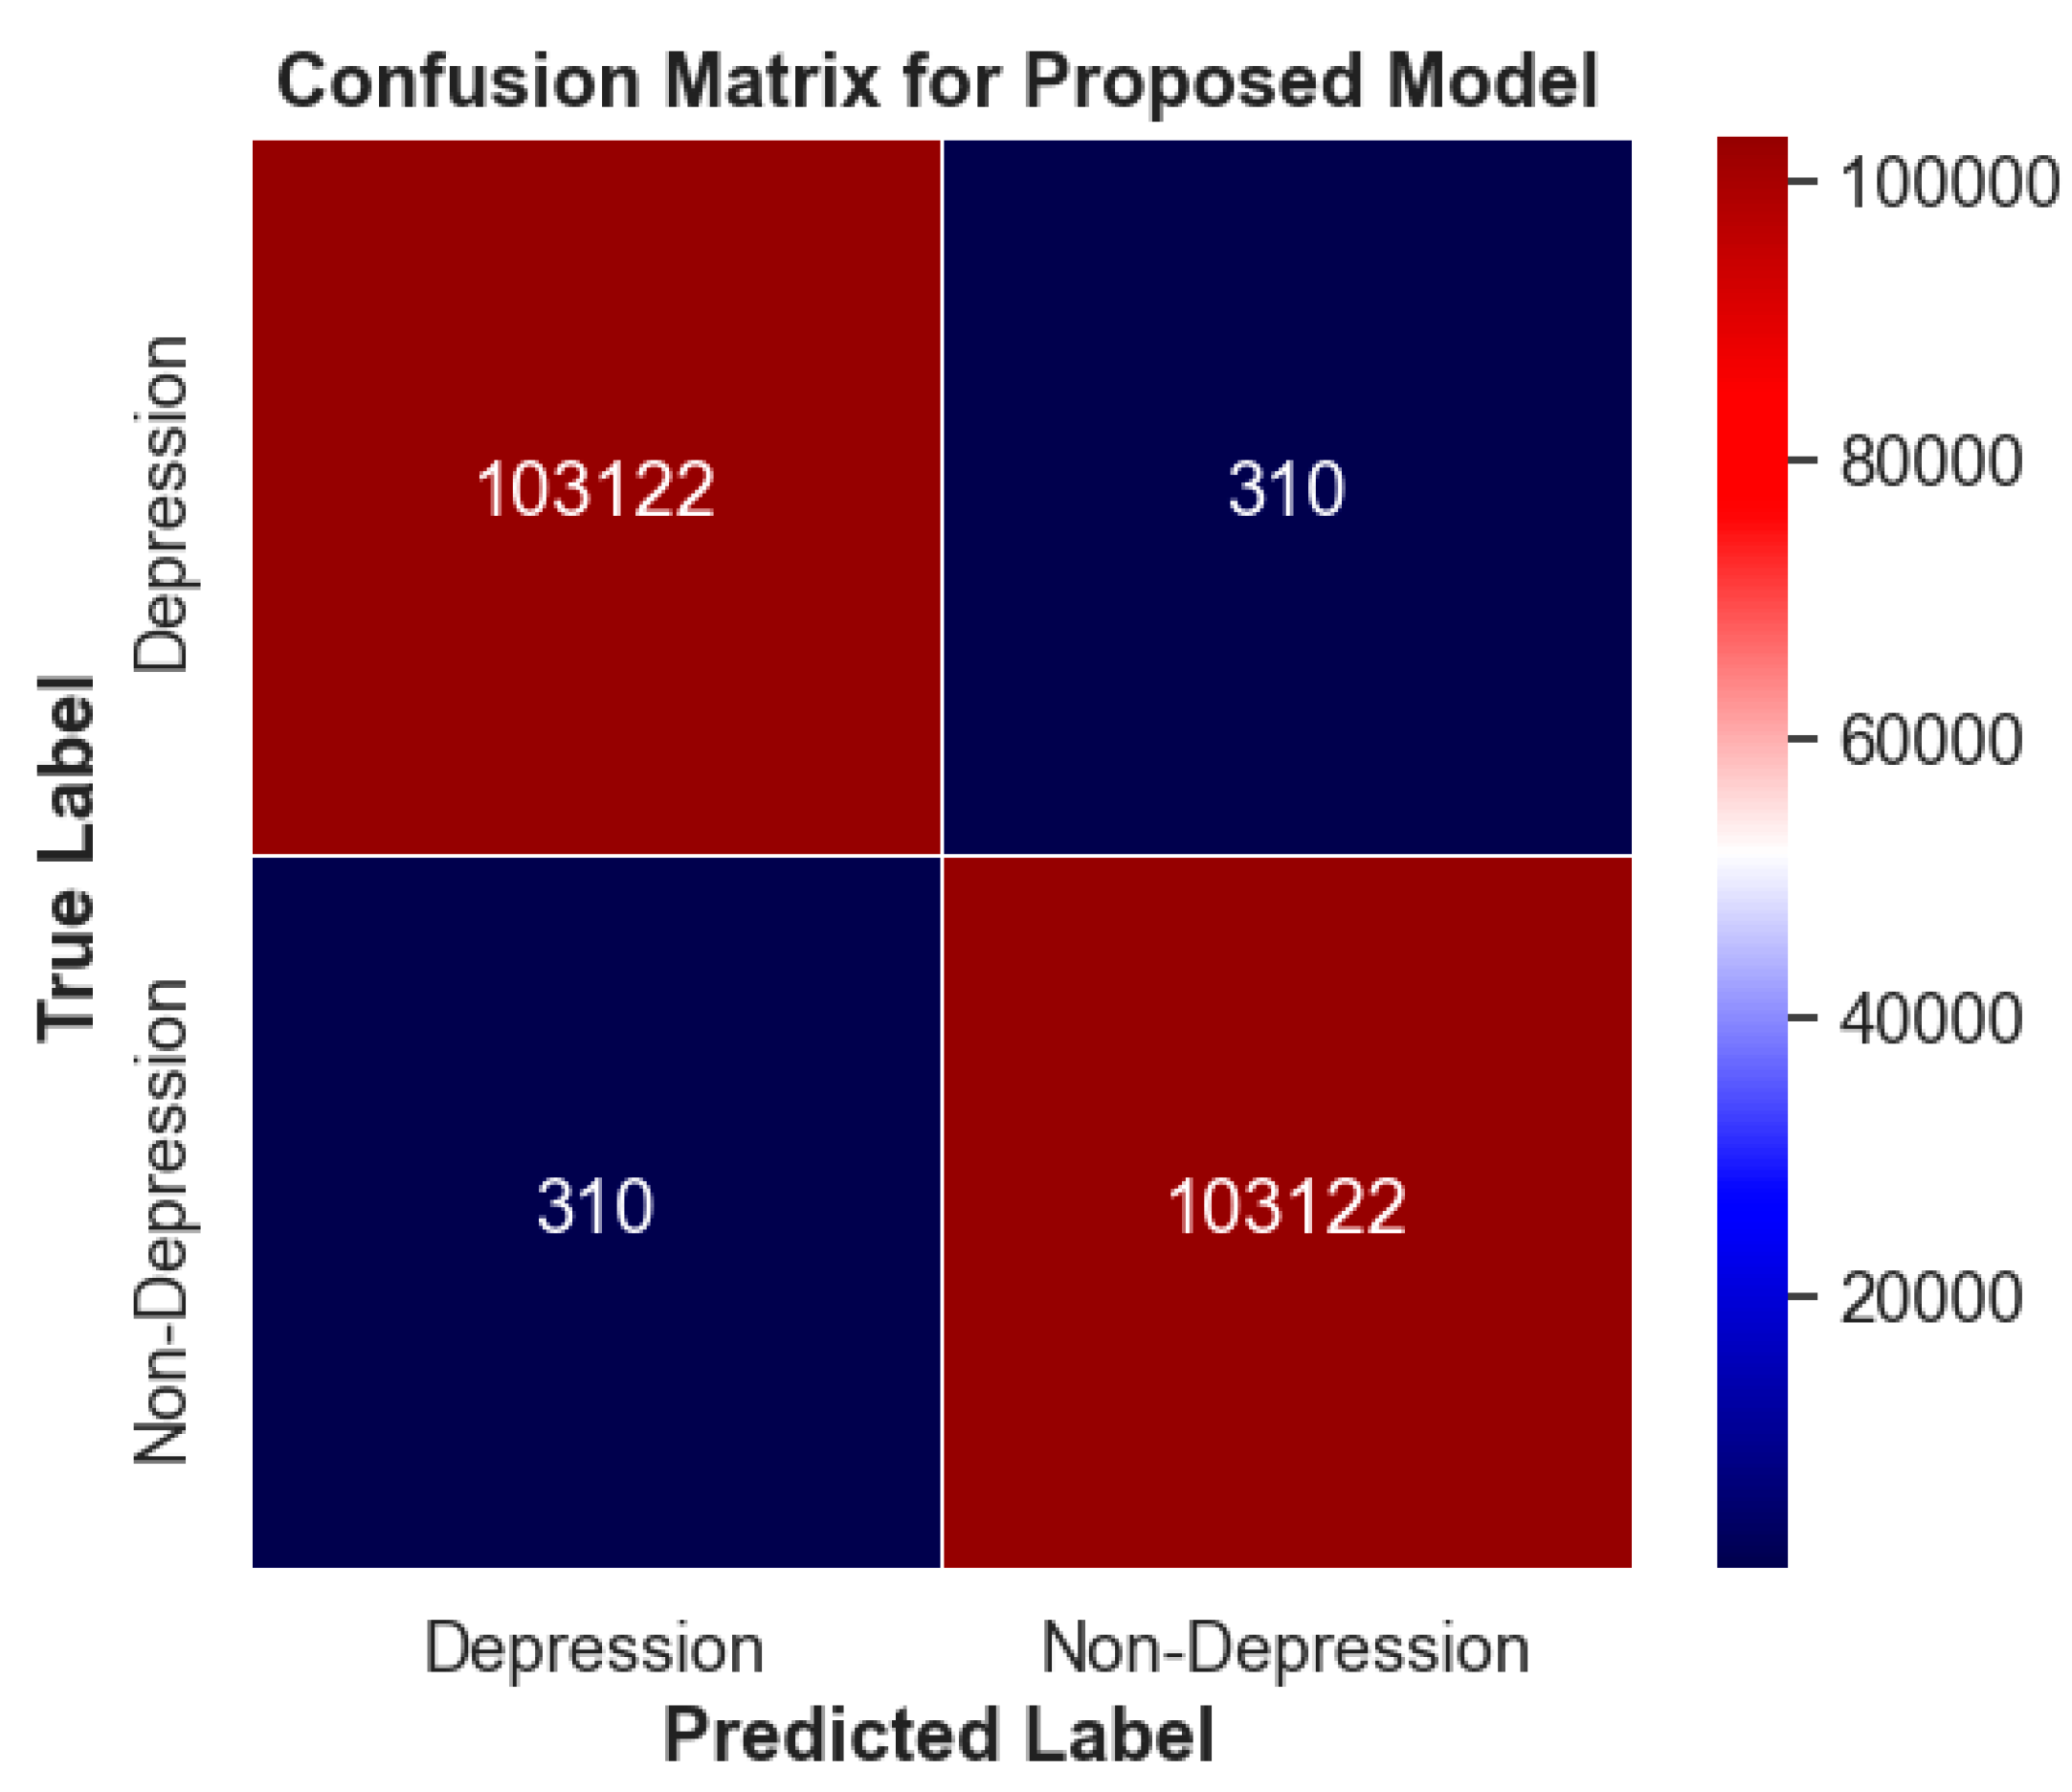
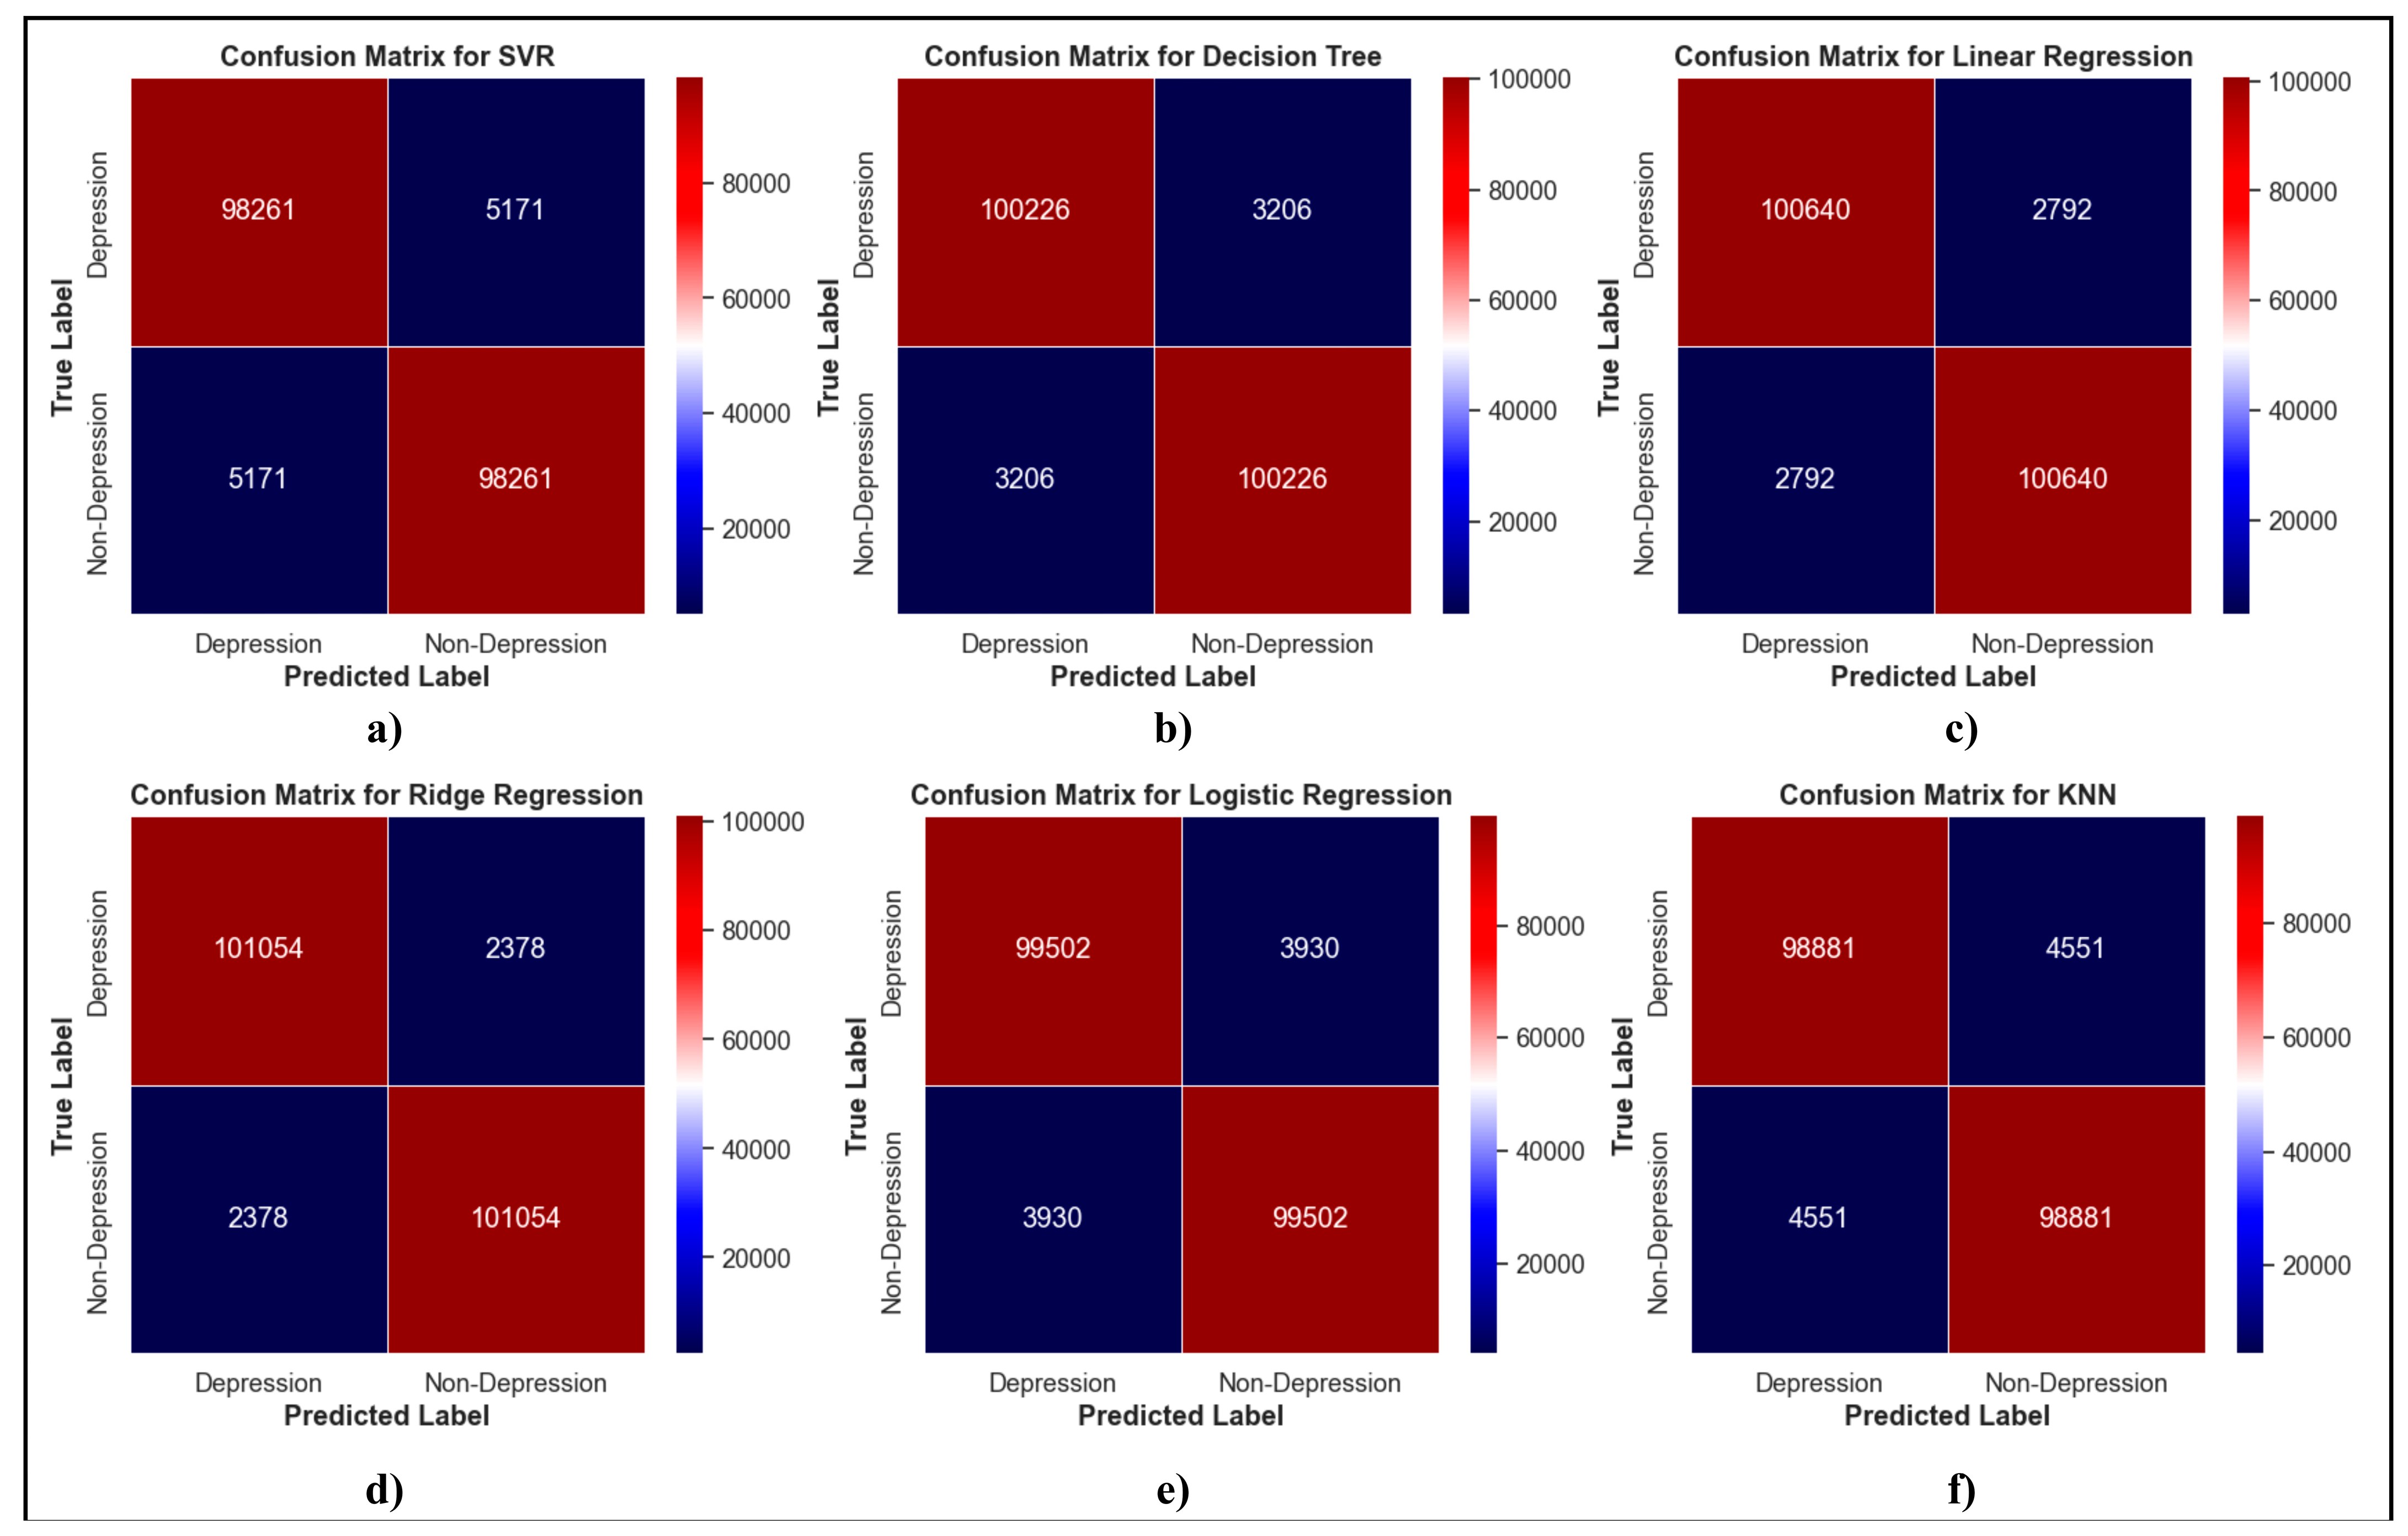
In Figure 9, the confusion of the proposed algorithm and Figure 10a–f are discussed. The confusion matrix of different comparison algorithms is used to evaluate the performance of a classification algorithm. It is used to describe the performance of a classification model by comparing the predicted class with the true class. It allows us to visualize the number of correct and incorrect predictions made by the model. The diagonal elements of the matrix represent the number of observations that were correctly classified, while the off-diagonal elements represent the number of observations that were incorrectly classified. By analyzing the confusion matrix, we can understand which classes the model is having difficulty with and make adjustments accordingly. Confusion matrix of Figure 10a–f represents the result of classification (depression and non-depression) using different models: SVR, decision tree, linear regression, ridge regression, logic regression, and KNN, respectively. It can be inferred that all six models perform similarly in classifying depression severity, with similar numbers of observations being misclassified as different classes.

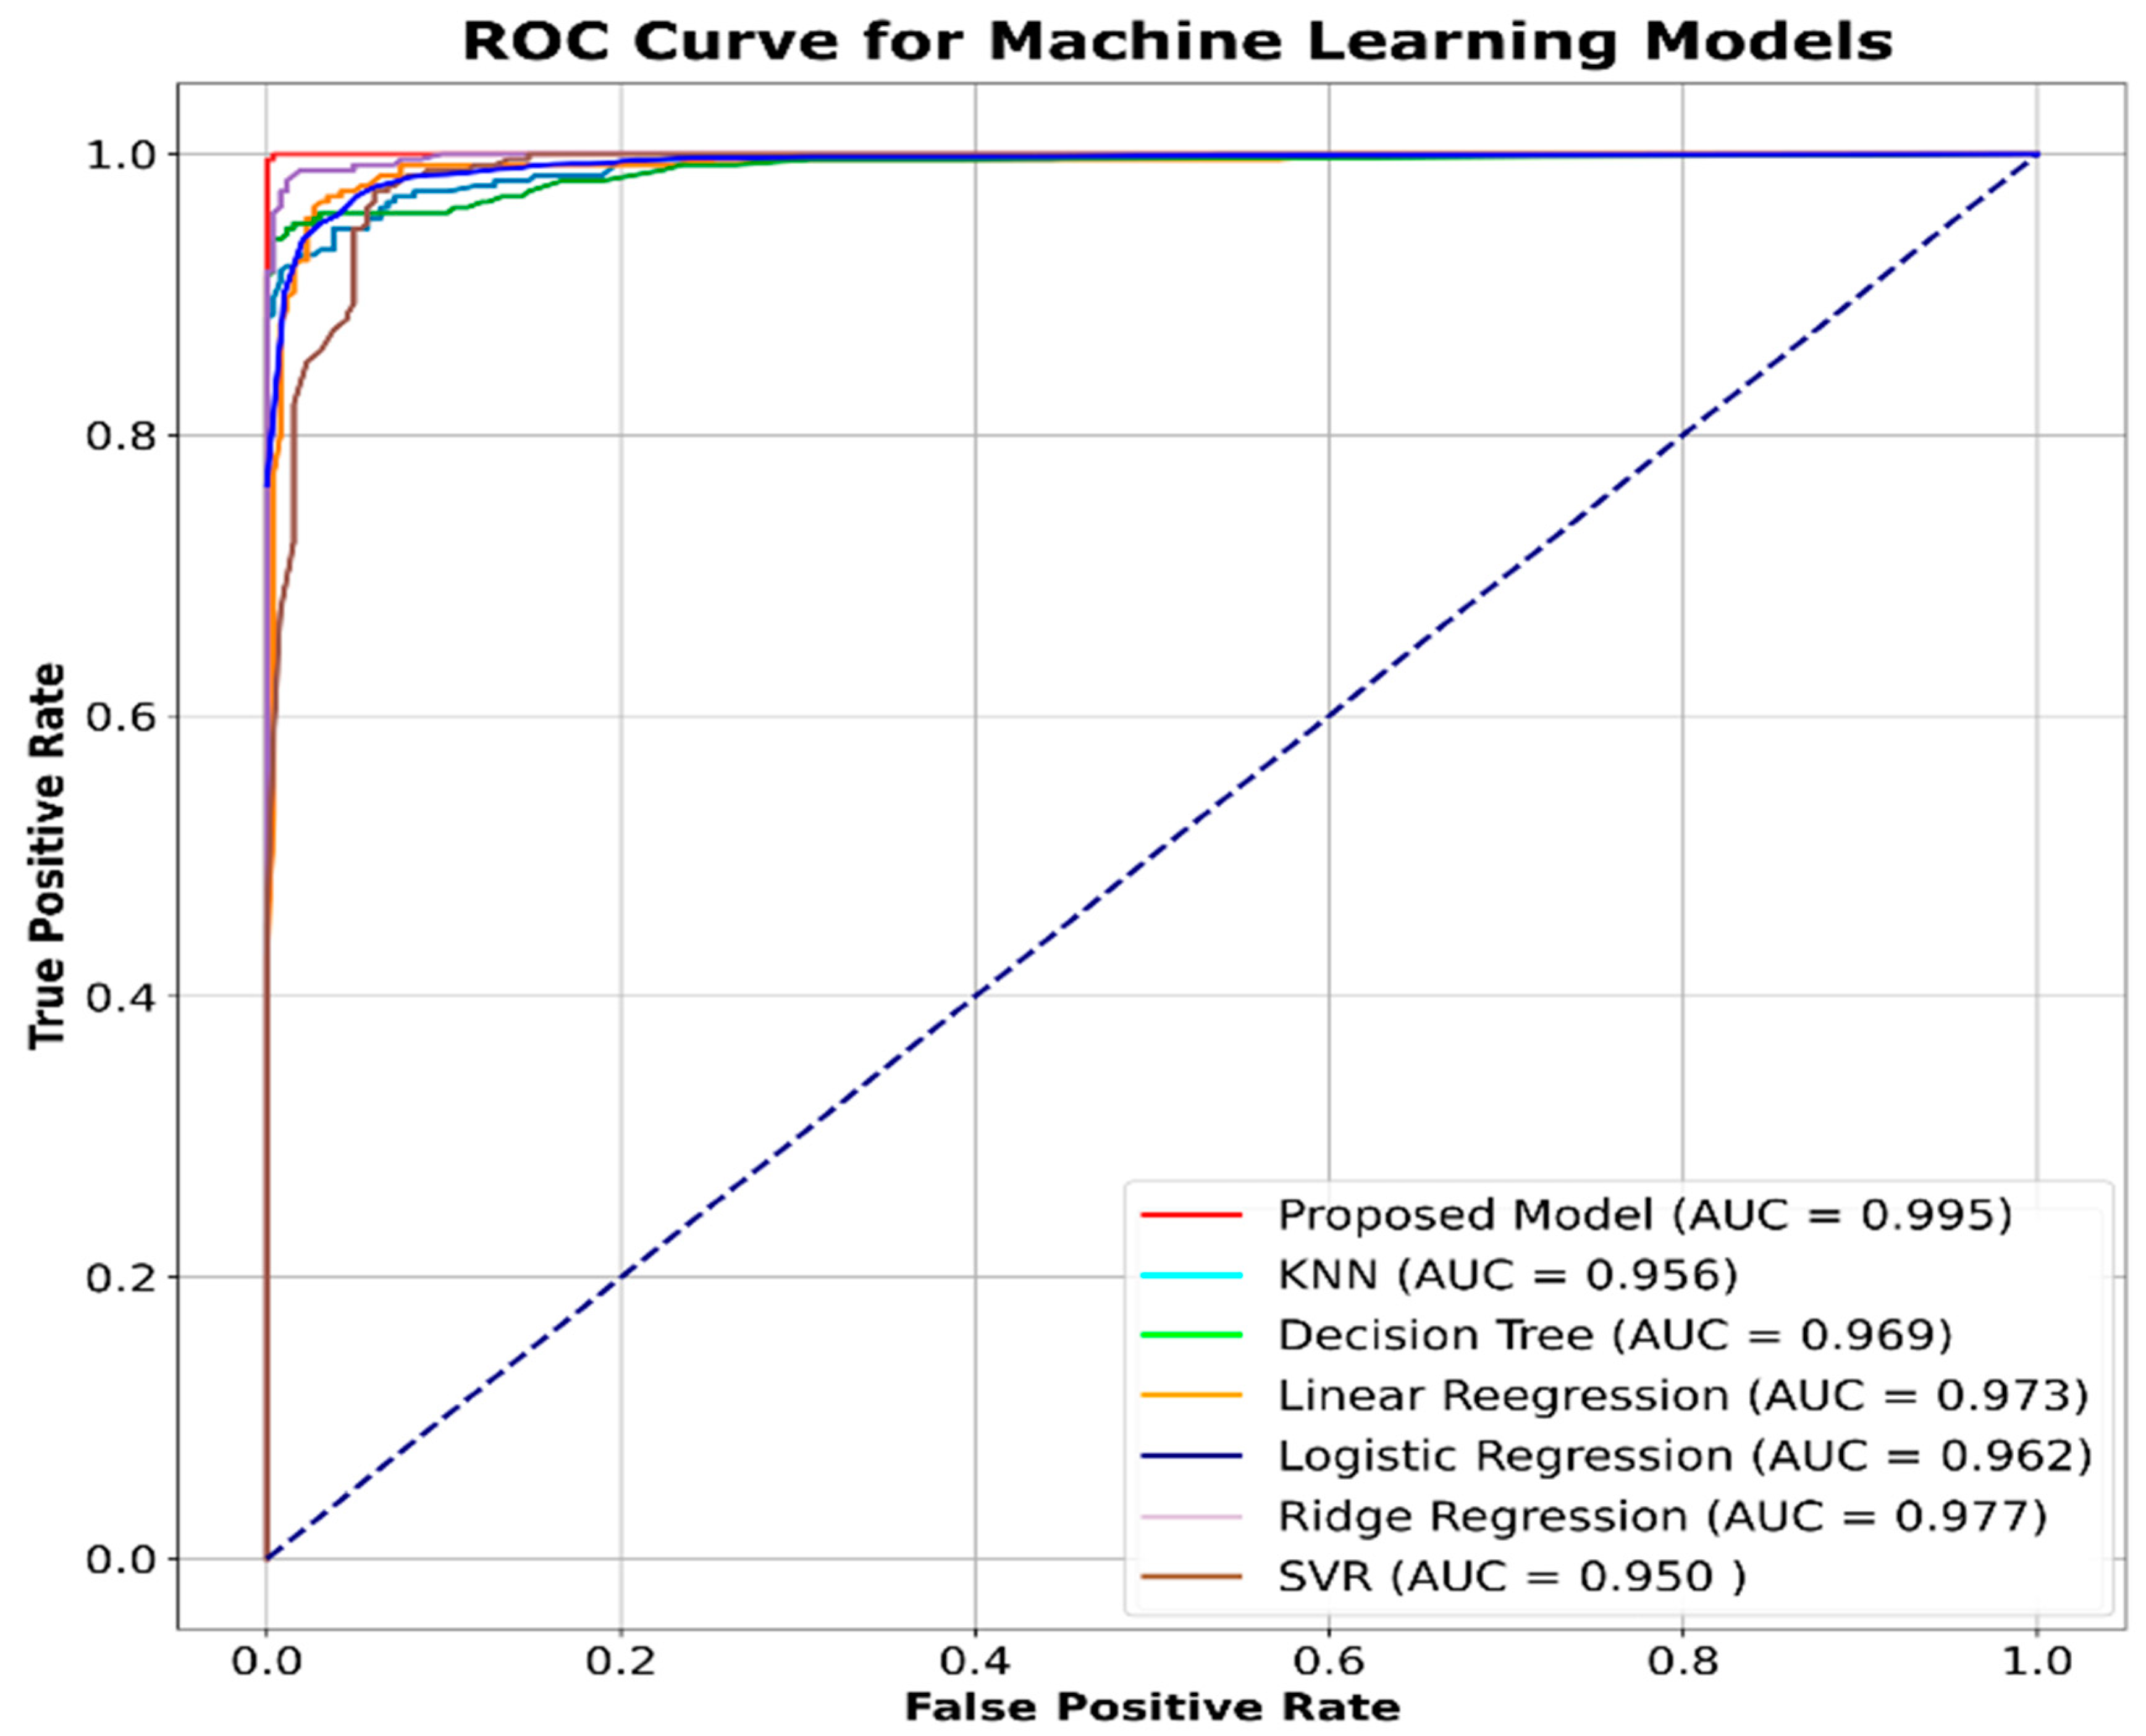
5.2.3. ROC of Various Classification Models

The ROC of various classification models are shown in Figure 11. The ROC of the proposed model is 99.5% and the ridge regression has an accuracy of 97.7%; the highest among all others comparison algorithms and the lowest being 95.0% for KNN model. After which, it can be observed that linear regression has an accuracy of 97.3%. Then, we found decision tree with 96.9% and logical regression with 96.2%, providing us with a very similar performance along with KNN model with 95.6% accuracy.

5.2.4. Comparison of Proposed Model with Other Published Model of Depression Detection

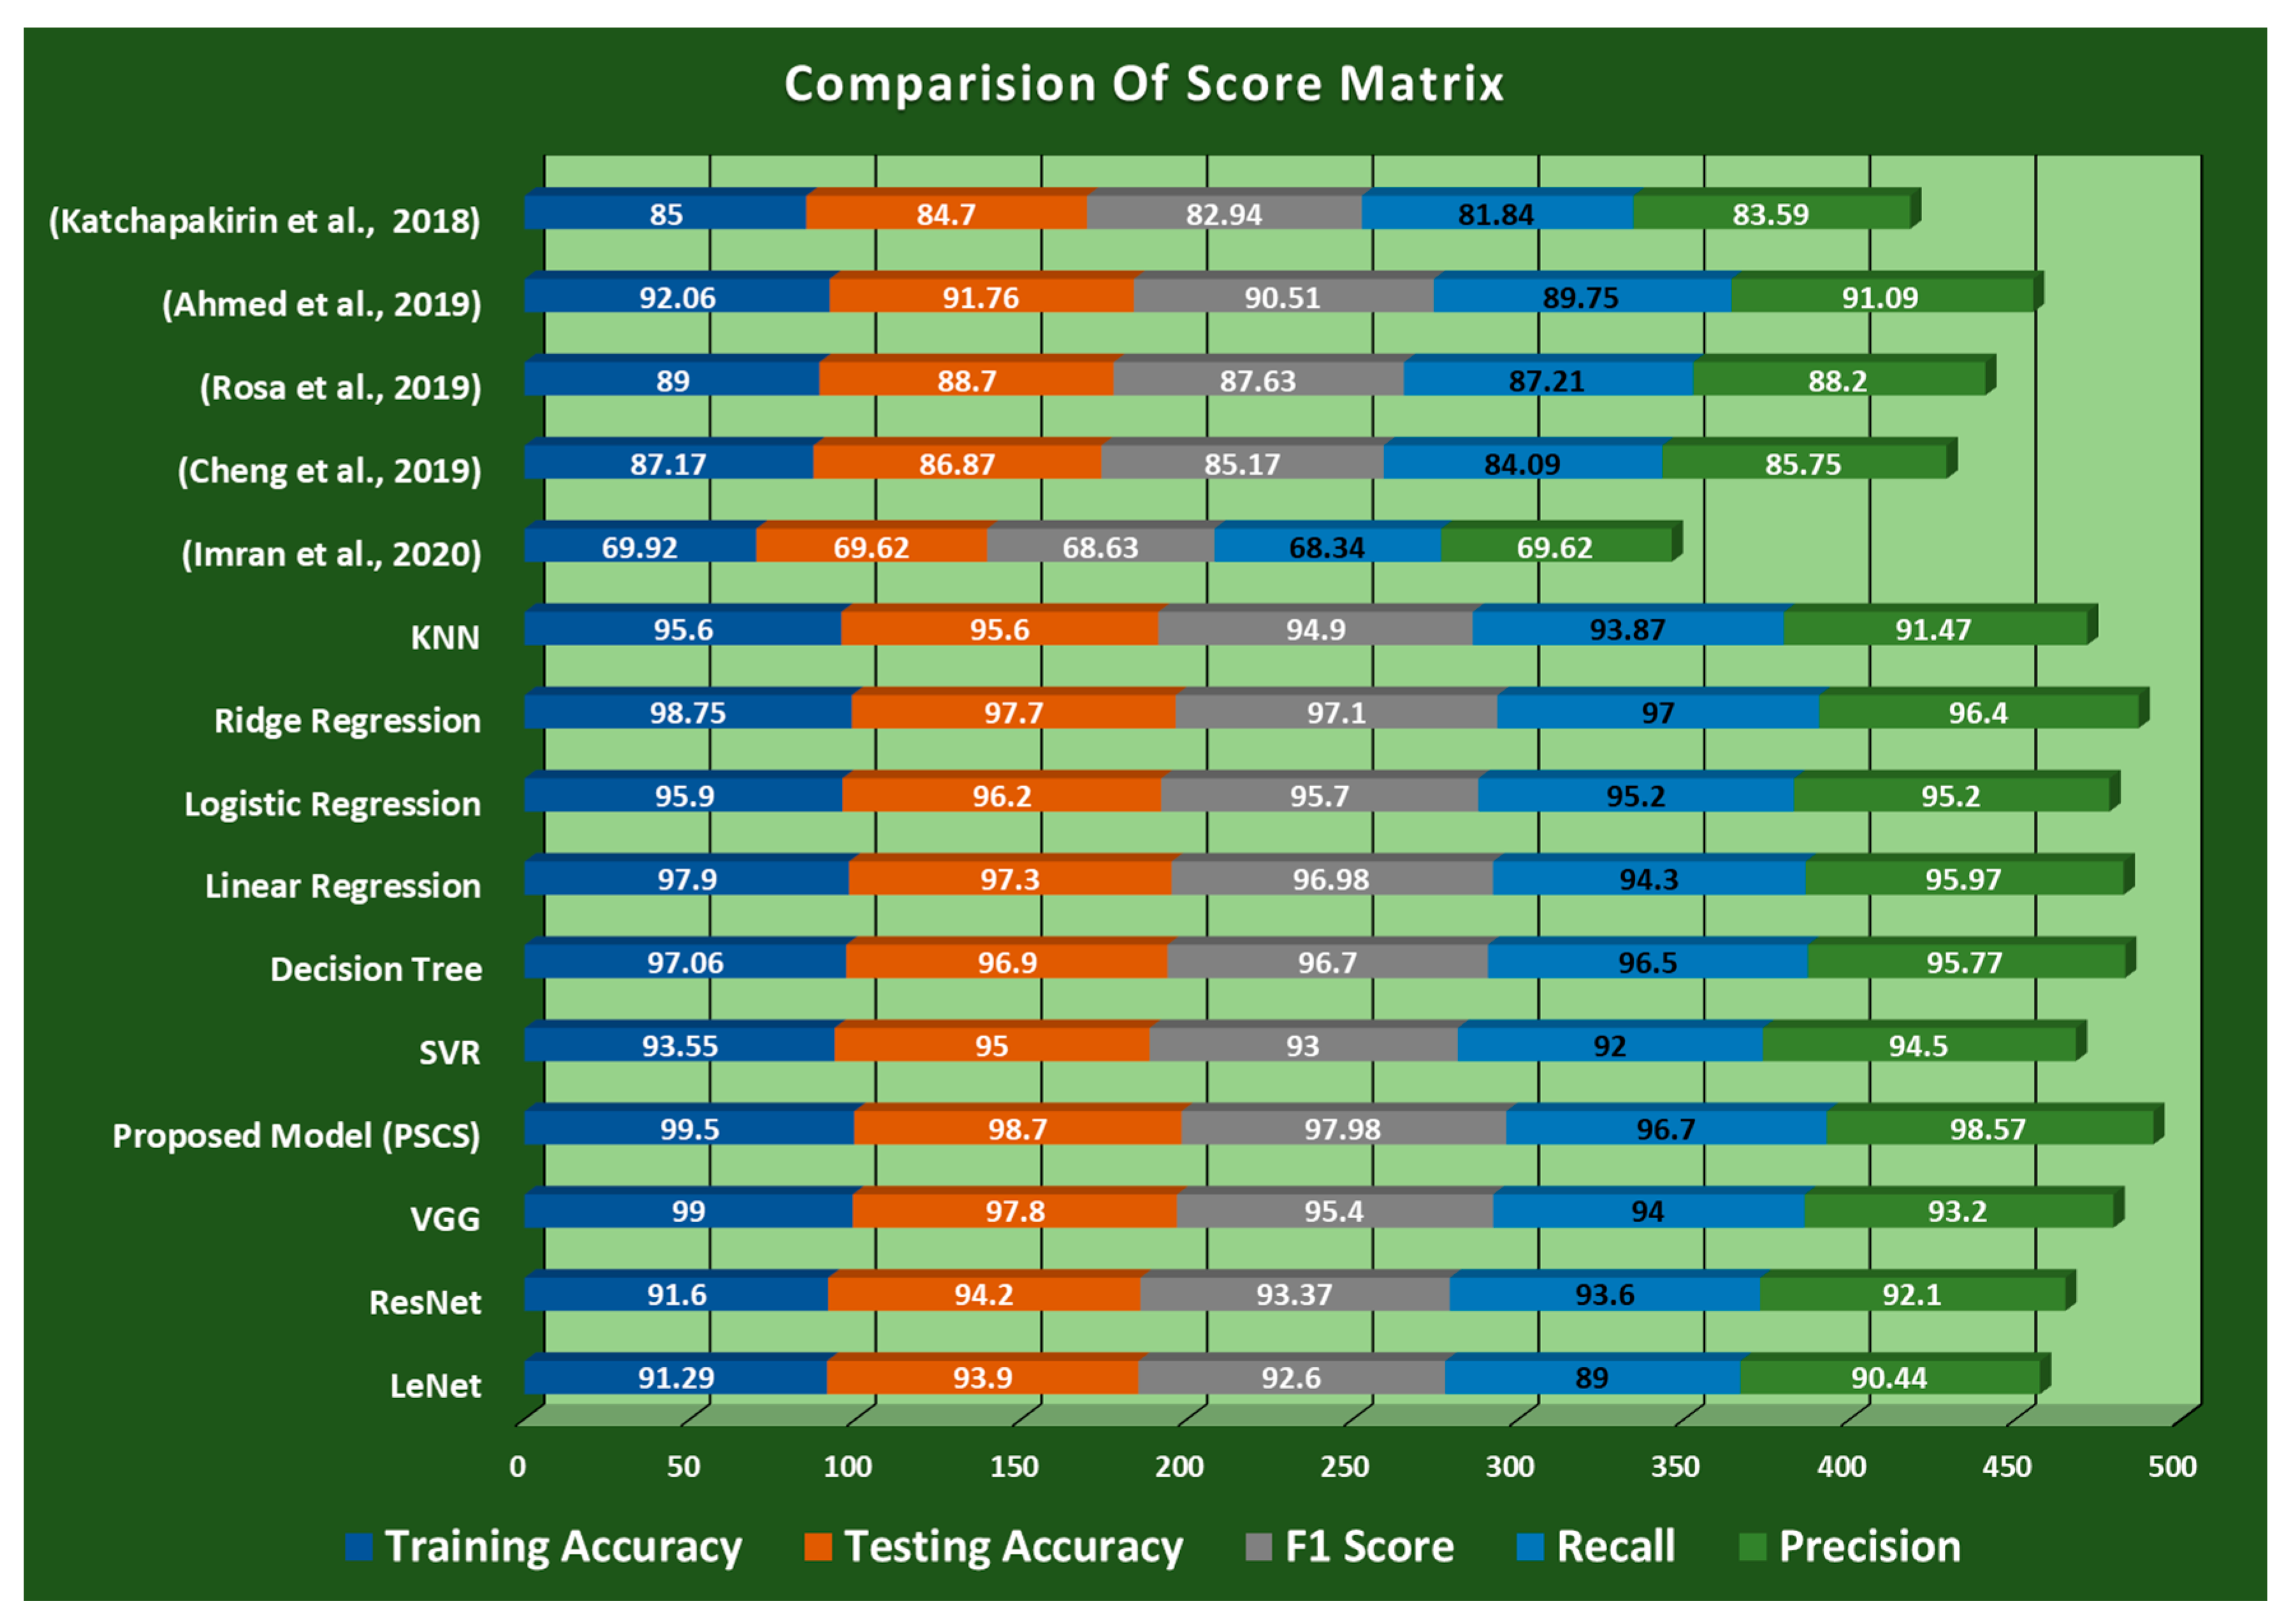
We compared the performance of the proposed system to a number of different current schemes for depression detection. We specifically compared our proposed approach to those put forth by Katchapakirin et al. [55], Ahmed et al. [21], Rosa et al. [22], Cheng et al. [23], and Imran et al. [7]. We measured each scheme’s performance at 84.7, 91.76, 88.7, 86.65, and 69.62, respectively, while our proposed model performance is 98.70. These findings are summarized in Table 4. Our investigation demonstrates that our suggested system outperforms when compared to others published work for solving the same problems. It achieved a maximum training accuracy of 99.5% and 98.7% as testing accuracy.
In Figure 12, it is clearly depicted from the all observation that the proposed model of deep learning gives comparatively good results as compared to other popular models of deep learning and machine learning for depression disease classification. For the dataset used, ridge and linear regression also given good result compared to the others. The proposed methodology after further hyper parameter tuning to improve the model’s generalization ability performed best among the rest of the models with training accuracy of 99.5%. The second best to it is ridge regression with an accuracy of 98.75%, while the LSTM-based models are performing with low accuracies.

6. Conclusions

In this research, a novel machine learning approach was implemented in the data collected from Push Shift API and test sensors that explore the behavior of depression and the activity of various people. The number of the impact on social and professional functionality, as well as symptoms, contributes to the severity of depression. Another serious mental disorder is associated with depression. Basic differences with bipolar diseases are presence of periodic anecdotist in the latter, and conditions are marked as a magnetic expression, impulse, increased activity, and slip gate. It is a genetic disease that can lead to two diseases atmosphere episodes that can be regarded as genetic vulnerabilities for their biological conditions. Results of the proposed model with various deep learning models such as LeNet, ResNet, and VGG and machine learning models such as KNN, SVR, DT, etc., for depression detection and classification between depressed and non-depressed patients were compared and analyzed. A comparison shows the various deep and machine learning models used for the proposed model are the ones which came out to be the best model amongst the others, with a mean accuracy percentage of 98.7%.

Future Work

One promising avenue for future research is to explore the use of other optimization algorithms, such as genetic algorithms or ant colony optimization, to optimize the performance of deep neural networks in depression detection. Additionally, the incorporation of multimodal data sources, such as combining physiological data with behavioural data or social media activity, could improve the accuracy of depression diagnosis. Longitudinal studies are also necessary to evaluate the effectiveness of the proposed method over time and its ability to predict relapse or recurrences of depression.
Apart from improving the accuracy of depression diagnosis, the proposed method has the potential to personalize treatment plans for individuals with depression by analysing patterns in patient data, such as social media activity or physiological responses. This personalized approach could lead to more targeted and efficient treatment plans, thereby reducing the time and resources required for patients to recover from depression. Furthermore, the integration of the proposed model into telemedicine platforms or mobile applications could increase access to mental health services for individuals who face geographic or financial barriers. Overall, by exploring the various applications of the proposed method, including personalized treatment planning and telemedicine, we can revolutionize the way we diagnose and treat depression, ultimately improving outcomes for individuals with depression and reducing the societal burden of this pervasive mental illness.

Author Contributions

Methodology, R.M.A. and R.M. and A.D.; Software, K.J., S.U.A.; Validation, P.K. and K.J.; Formal analysis, R.M., P.K. and A.D.; Investigation, R.M., A.D. and S.U.A.; Resources, R.M.; Data curation, R.M., A.D. and S.U.A.; Writing—original draft, R.M.A. and R.M.; Writing, review & editing, R.M.A., K.J. and P.K. All authors have read and agreed to the published version of the manuscript.

Funding

The authors declare that no funds, grants, or other support were received for this article.

Institutional Review Board Statement

Not applicable.

Informed Consent Statement

Not applicable.

Data Availability Statement

Used data set available on internet link is also given in paper.

Conflicts of Interest

The authors declare no conflict of interest.

References

  1. He, L.; Guo, C.; Tiwari, P.; Su, R.; Pandey, H.M.; Dang, W. DepNet: An automated industrial intelligent system using deep learning for video-based depression analysis. Int. J. Intell. Syst. 2021, 37, 3815–3835. [Google Scholar]
  2. Chris, X.; Sanketh, R.P.; Samuel, O. The Depression Dataset (1). Kaggle. 2021. Available online: https://www.kaggle.com/datasets/arashnic/the-depression-dataset (accessed on 24 April 2023).
  3. Zulfiker, M.S.; Kabir, N.; Biswas, A.A.; Nazneen, T.; Uddin, M.S. An in-depth analysis of machine learning approaches to predict depression. Curr. Res. Behav. Sci. 2021, 2, 100044. [Google Scholar] [CrossRef]
  4. Dinga, R.; Marquand, A.F.; Veltman, D.J.; Beekman, A.T.; Schoevers, R.A.; Van Hemert, A.M.; Penninx, B.W.; Schmaal, L. Predicting the naturalistic course of depression from a wide range of clinical, psychological, and biological data: A machine learning approach. Transl. Psychiatry 2018, 8, 1–11. [Google Scholar] [CrossRef] [PubMed]
  5. Khan, A.; Sohail, A.; Zahoora, U.; Qureshi, A.S. A survey of the recent architectures of deep convolutional neural networks. Artif. Intell. Rev. 2020, 53, 5455–5516. [Google Scholar] [CrossRef]
  6. Nemesure, M.D.; Heinz, M.V.; Huang, R.; Jacobson, N.C. Predictive modeling of depression and anxiety using electronic health records and a novel machine learning approach with artificial intelligence. Sci. Rep. 2021, 11, 1980. [Google Scholar] [CrossRef]
  7. Imran, A.S.; Daudpota, S.M.; Kastrati, Z.; Batra, R. Cross-cultural polarity and emotion detection using sentiment analysis and deep learning on COVID-19 related tweets. IEEE Access 2020, 8, 181074–181090. [Google Scholar] [CrossRef] [PubMed]
  8. Hassan, A.U.; Hussain, J.; Hussain, M.; Sadiq, M.; Lee, S. Sentiment analysis of social networking sites (SNS) data using machine learning approach for the measurement of depression. In Proceedings of the 2017 International Conference on Information and Communication Technology Convergence (ICTC), Jeju Island, Republic of Korea, 18–20 October 2017; pp. 138–140. [Google Scholar]
  9. Li, X.; Zhang, X.; Zhu, J.; Mao, W.; Sun, S.; Wang, Z.; Xia, C.; Hu, B. Depression recognition using machine learning methods with different feature generation strategies. Artif. Intell. Med. 2019, 99, 101696. [Google Scholar] [CrossRef]
  10. Richter, T.; Fishbain, B.; Markus, A.; Richter-Levin, G.; Okon-Singer, H. Using machine learning-based analysis for behavioral differentiation between anxiety and depression. Sci. Rep. 2020, 10, 16381. [Google Scholar] [CrossRef]
  11. Priya, A.; Garg, S.; Tigga, N.P. Predicting anxiety, depression and stress in modern life using machine learning algorithms. Procedia Comput. Sci. 2020, 167, 1258–1267. [Google Scholar] [CrossRef]
  12. Kumar, P.; Garg, S.; Garg, A. Assessment of anxiety, depression and stress using machine learning models. Procedia Comput. Sci. 2020, 171, 1989–1998. [Google Scholar] [CrossRef]
  13. Choudhury, A.A.; Khan, M.R.H.; Nahim, N.Z.; Tulon, S.R. Predicting Depression in Bangladeshi Undergraduates using Machine Learning. In Proceedings of the 2019 IEEE Region 10 Symposium (TENSYMP), Kolkata, India, 7–9 June 2019; pp. 789–794. [Google Scholar] [CrossRef]
  14. Shin, D.; Cho, W.I.; Park, C.H.K.; Rhee, S.J.; Kim, M.J.; Lee, H.; Kim, N.S.; Ahn, Y.M. Detection of minor and major depression through voice as a biomarker using machine learning. J. Clin. Med. 2021, 10, 3046. [Google Scholar] [CrossRef] [PubMed]
  15. Hosseinifard, B.; Moradi, M.H.; Rostami, R. Classifying depression patients and normal subjects using machine learning techniques and nonlinear features from EEG signal. Comput. Methods Programs Biomed. 2013, 109, 339–345. [Google Scholar] [CrossRef] [PubMed]
  16. Jiménez-Serrano, S.; Tortajada, S.; García-Gómez, J.M. A mobile health application to predict postpartum depression based on machine learning. Telemed. e-Health 2015, 21, 567–574. [Google Scholar] [CrossRef] [PubMed]
  17. Khalil, R.M.; Al-Jumaily, A. Machine learning based prediction of depression among type 2 diabetic patients. In Proceedings of the 2017 12th International Conference on Intelligent Systems and Knowledge Engineering (ISKE), Nanjing, China, 24–26 November 2017; pp. 1–5. [Google Scholar]
  18. Zhou, L.; Baughman, A.W.; Lei, V.J.; Lai, K.H.; Navathe, A.S.; Chang, F.; Sordo, M.; Topaz, M.; Zhong, F.; Murrali, M.; et al. Identifying patients with depression using free-text clinical documents. Stud. Health Technol. Inform. 2015, 216, 629–633. [Google Scholar] [PubMed]
  19. Acharya, U.R.; Oh, S.L.; Hagiwara, Y.; Tan, J.H.; Adeli, H.; Subha, D.P. Automated EEG-based screening of depression using deep convolutional neural network. Comput. Methods Programs Biomed. 2018, 161, 103–113. [Google Scholar] [CrossRef]
  20. Delgadillo, J.; Gonzalez, S.D.P. Targeted prescription of cognitive–behavioral therapy versus person-centered counseling for depression using a machine learning approach. J. Consult. Clin. Psychol. 2020, 88, 14. [Google Scholar] [CrossRef]
  21. Ahmad, S.; Asghar, M.Z.; Alotaibi, F.M.; Awan, I. Detection and classification of social media based extremist affiliations using sentiment analysis techniques. Hum. Cent. Comput. Inf. Sci. 2019, 9, 24. [Google Scholar] [CrossRef]
  22. Rosa, R.L.; Schwartz, G.M.; Ruggiero, W.V.; Rodr, D.Z.-G. A knowledge-based recommen- dation system that includes sentiment analysis and deep learning. IEEE Trans. Ind. Inform. 2019, 15, 2124–2135. [Google Scholar] [CrossRef]
  23. Cheng, L.C.; Tsai, S.L. Deep learning for automated sentiment analysis of social media. In Proceedings of the 2019 IEEE/ACM International Conference on Advances in Social Networks Analysis and Mining, Vancouver, BC, Canada, 27–30 August 2019. [Google Scholar]
  24. Tian, J.; Hou, M.; Bian, H.; Li, J. Variable surrogate model-based particle swarm optimization for high-dimensional expensive problems. Complex Intell. Syst. 2022, 29, 1–49. [Google Scholar] [CrossRef]
  25. Zhang, X.; Huang, D.; Li, H.; Zhang, Y.; Xia, Y.; Liu, J. Self-training maximum classifier discrepancy for EEG emotion recognition. CAAI Trans. Intell. Technol. 2023, 1–12. [Google Scholar] [CrossRef]
  26. Li, X.; Sun, Y. Application of RBF neural network optimal segmentation algorithm in credit rating. Neural Comput. Appl. 2020, 33, 8227–8235. [Google Scholar] [CrossRef]
  27. Wang, F.; Wang, H.; Zhou, X.; Fu, R. A Driving Fatigue Feature Detection Method Based on Multifractal Theory. IEEE Sens. J. 2022, 22, 19046–19059. [Google Scholar] [CrossRef]
  28. Lu, S.; Yang, B.; Xiao, Y.; Liu, S.; Liu, M.; Yin, L.; Zheng, W. Iterative reconstruction of low-dose CT based on differential sparse. Biomed. Signal Process. Control. 2023, 79, 104204. [Google Scholar] [CrossRef]
  29. Ban, Y.; Wang, Y.; Liu, S.; Yang, B.; Liu, M.; Yin, L.; Zheng, W. 2D/3D Multimode Medical Image Alignment Based on Spatial Histograms. Appl. Sci. 2022, 12, 8261. [Google Scholar] [CrossRef]
  30. Lv, Z.; Yu, Z.; Xie, S.; Alamri, A. Deep Learning-based Smart Predictive Evaluation for Interactive Multimedia-enabled Smart Healthcare. ACM Trans. Multimed. Comput. Commun. Appl. 2022, 18, 43. [Google Scholar] [CrossRef]
  31. Cao, H. Entrepreneurship education-infiltrated computer-aided instruction system for college Music Majors using convolutional neural network. Front. Psychol. 2022, 13, 900195. [Google Scholar] [CrossRef] [PubMed]
  32. Zhou, W.; Lv, Y.; Lei, J.; Yu, L. Global and Local-Contrast Guides Content-Aware Fusion for RGB-D Saliency Prediction. IEEE Trans. Syst. Man, Cybern. Syst. 2019, 51, 3641–3649. [Google Scholar] [CrossRef]
  33. Huang, C.-Q.; Jiang, F.; Huang, Q.-H.; Wang, X.-Z.; Han, Z.-M.; Huang, W.-Y. Dual-Graph Attention Convolution Network for 3-D Point Cloud Classification. IEEE Trans. Neural Networks Learn. Syst. 2022, 1–13. [Google Scholar] [CrossRef] [PubMed]
  34. Ren, Y.; Jiang, H.; Ji, N.; Yu, H. TBSM: A traffic burst-sensitive model for short-term prediction under special events. Knowledge-Based Syst. 2022, 240, 108120. [Google Scholar] [CrossRef]
  35. Zhang, Y.; Huang, Y.; Zhang, Z.; Postolache, O.; Mi, C. A vision-based container position measuring system for ARMG. Meas. Control. 2022, 56, 596–605. [Google Scholar] [CrossRef]
  36. Mi, C.; Huang, S.; Zhang, Y.; Zhang, Z.; Postolache, O. Design and Implementation of 3-D Measurement Method for Container Handling Target. J. Mar. Sci. Eng. 2022, 10, 1961. [Google Scholar] [CrossRef]
  37. Aziz, R.M. Application of nature inspired soft computing techniques for gene selection: A novel frame work for classification of cancer. Soft Comput. 2022, 26, 12179–12196. [Google Scholar] [CrossRef]
  38. Aziz, R.M. Nature-inspired metaheuristics model for gene selection and classification of biomedical microarray data. Med Biol Eng Comput 2022, 60, 1627–1646. [Google Scholar] [CrossRef] [PubMed]
  39. Aziz, R.; Verma, C.K.; Jha, M.; Srivastava, N. Artificial neural network classification of microarray data using new hybrid gene selection method. International Int. J. Data Min. 2017, 17, 42–65. [Google Scholar] [CrossRef]
  40. Aziz, R.; Verma, C.K.; Srivastava, N. A novel approach for dimension reduction of microarray. Comput. Biol. Chem. 2017, 71, 161–169. [Google Scholar] [CrossRef] [PubMed]
  41. Abualigah, L.; Elaziz, M.A.; Khodadadi, N.; Forestiero, A.; Jia, H.; Gandomi, A.H. Aquila Optimizer Based PSO Swarm Intelligence for IoT Task Scheduling Application in Cloud Computing. In Integrating Meta-Heuristics and Machine Learning for Real-World Optimization Problems. Studies in Computational Intelligence; Houssein, E.H., Abd Elaziz, M., Oliva, D., Abualigah, L., Eds.; Springer: Cham, Switzerland, 2022; Volume 1038. [Google Scholar] [CrossRef]
  42. Forestiero, A. Heuristic recommendation technique in Internet of Things featuring swarm intelligence approach. Expert Syst. Appl. 2021, 187, 115904. [Google Scholar] [CrossRef]
  43. Yaqoob, A.; Aziz, R.M.; Verma, N.K.; Lalwani, P.; Makrariya, A.; Kumar, P. A review on nature-inspired algorithms for cancer disease prediction and classification. Mathematics 2023, 11, 1081. [Google Scholar] [CrossRef]
  44. Aziz, R.M.; Mahto, R.; Goel, K.; Das, A.; Kumar, P.; Saxena, A. Modified genetic algorithm with deep learning for fraud transactions of ethereum smart contract. Appl. Sci. 2023, 13, 697. [Google Scholar] [CrossRef]
  45. Desai, N.P.; Baluch, M.F.; Makrariya, A.; Musheer, A.R. Image processing model with deep learning approach for fish species classification. Turk. J. Comput. Math. Educ. 2022, 13, 85–99. [Google Scholar]
  46. Aziz, R.M.; Hussain, A.; Sharma, P.; Kumar, P. Machine learning-based soft computing regression analysis approach for crime data prediction. Karbala Int. J. Mod. Sci. 2022, 8, 1–9. [Google Scholar] [CrossRef]
  47. Aziz, R.M.; Baluch, M.F.; Patel, S.; Kumar, P. A machine learning based approach to detect the Ethereum fraud transactions with limited attributes. Karbala Int. J. Mod. Sci. 2022, 8, 139–151. [Google Scholar] [CrossRef]
  48. Aziz, R.M.; Sharma, P.; Hussain, A. Machine learning algorithms for crime prediction under Indian Penal Code. Ann. Data Sci. 2022, 6, 1–32. [Google Scholar] [CrossRef]
  49. He, L.; Niu, M.; Tiwari, P.; Marttinen, P.; Su, R.; Jiang, J.; Guo, C.; Wang, H.; Ding, S.; Wang, Z.; et al. Deep learning for depression recognition with audiovisual cues: A review. Inf. Fusion 2022, 80, 56–86. [Google Scholar] [CrossRef]
  50. Kameyama, K. Particle swarm optimization—A survey. IEICE Trans. Inf. Syst. 2009, 92, 1354–1361. [Google Scholar] [CrossRef]
  51. Wu, C.S.; Kuo, C.J.; Su, C.H.; Wang, S.H.; Dai, H.J. Using text mining to extract depressive symptoms and to validate the diagnosis of major depressive disorder from electronic health records. J. Affect. Disord. 2020, 260, 617–623. [Google Scholar] [CrossRef]
  52. Peña, E.; Zhang, S.; Deyo, S.; Xiao, Y.; Johnson, M.D. Particle swarm optimization for programming deep brain stimulation arrays. J. Neural Eng. 2017, 14, 016014. [Google Scholar] [CrossRef]
  53. Aziz, R.M. Cuckoo search-based optimization for cancer classification: A new hybrid approach. J. Comput. Biol. 2022, 29, 565–584. [Google Scholar] [CrossRef]
  54. Aziz, R.M.; Desai, N.P.; Baluch, M.F. Computer vision model with novel cuckoo search based deep learning approach for classification of fish image. Multimed. Tools Appl. 2022, 14, 1–20. [Google Scholar] [CrossRef]
  55. Katchapakirin, K.; Wongpatikaseree, K.; Yomaboot, P.; Kaewpitakkun, Y. Facebook social media for depression detection in the thai community. In Proceedings of the 2018 15th International Joint Conference on Computer Science and Software Engineering (JCSSE), Nakhon Pathom, Thailand, 11–13 July 2018; pp. 1–6. [Google Scholar]
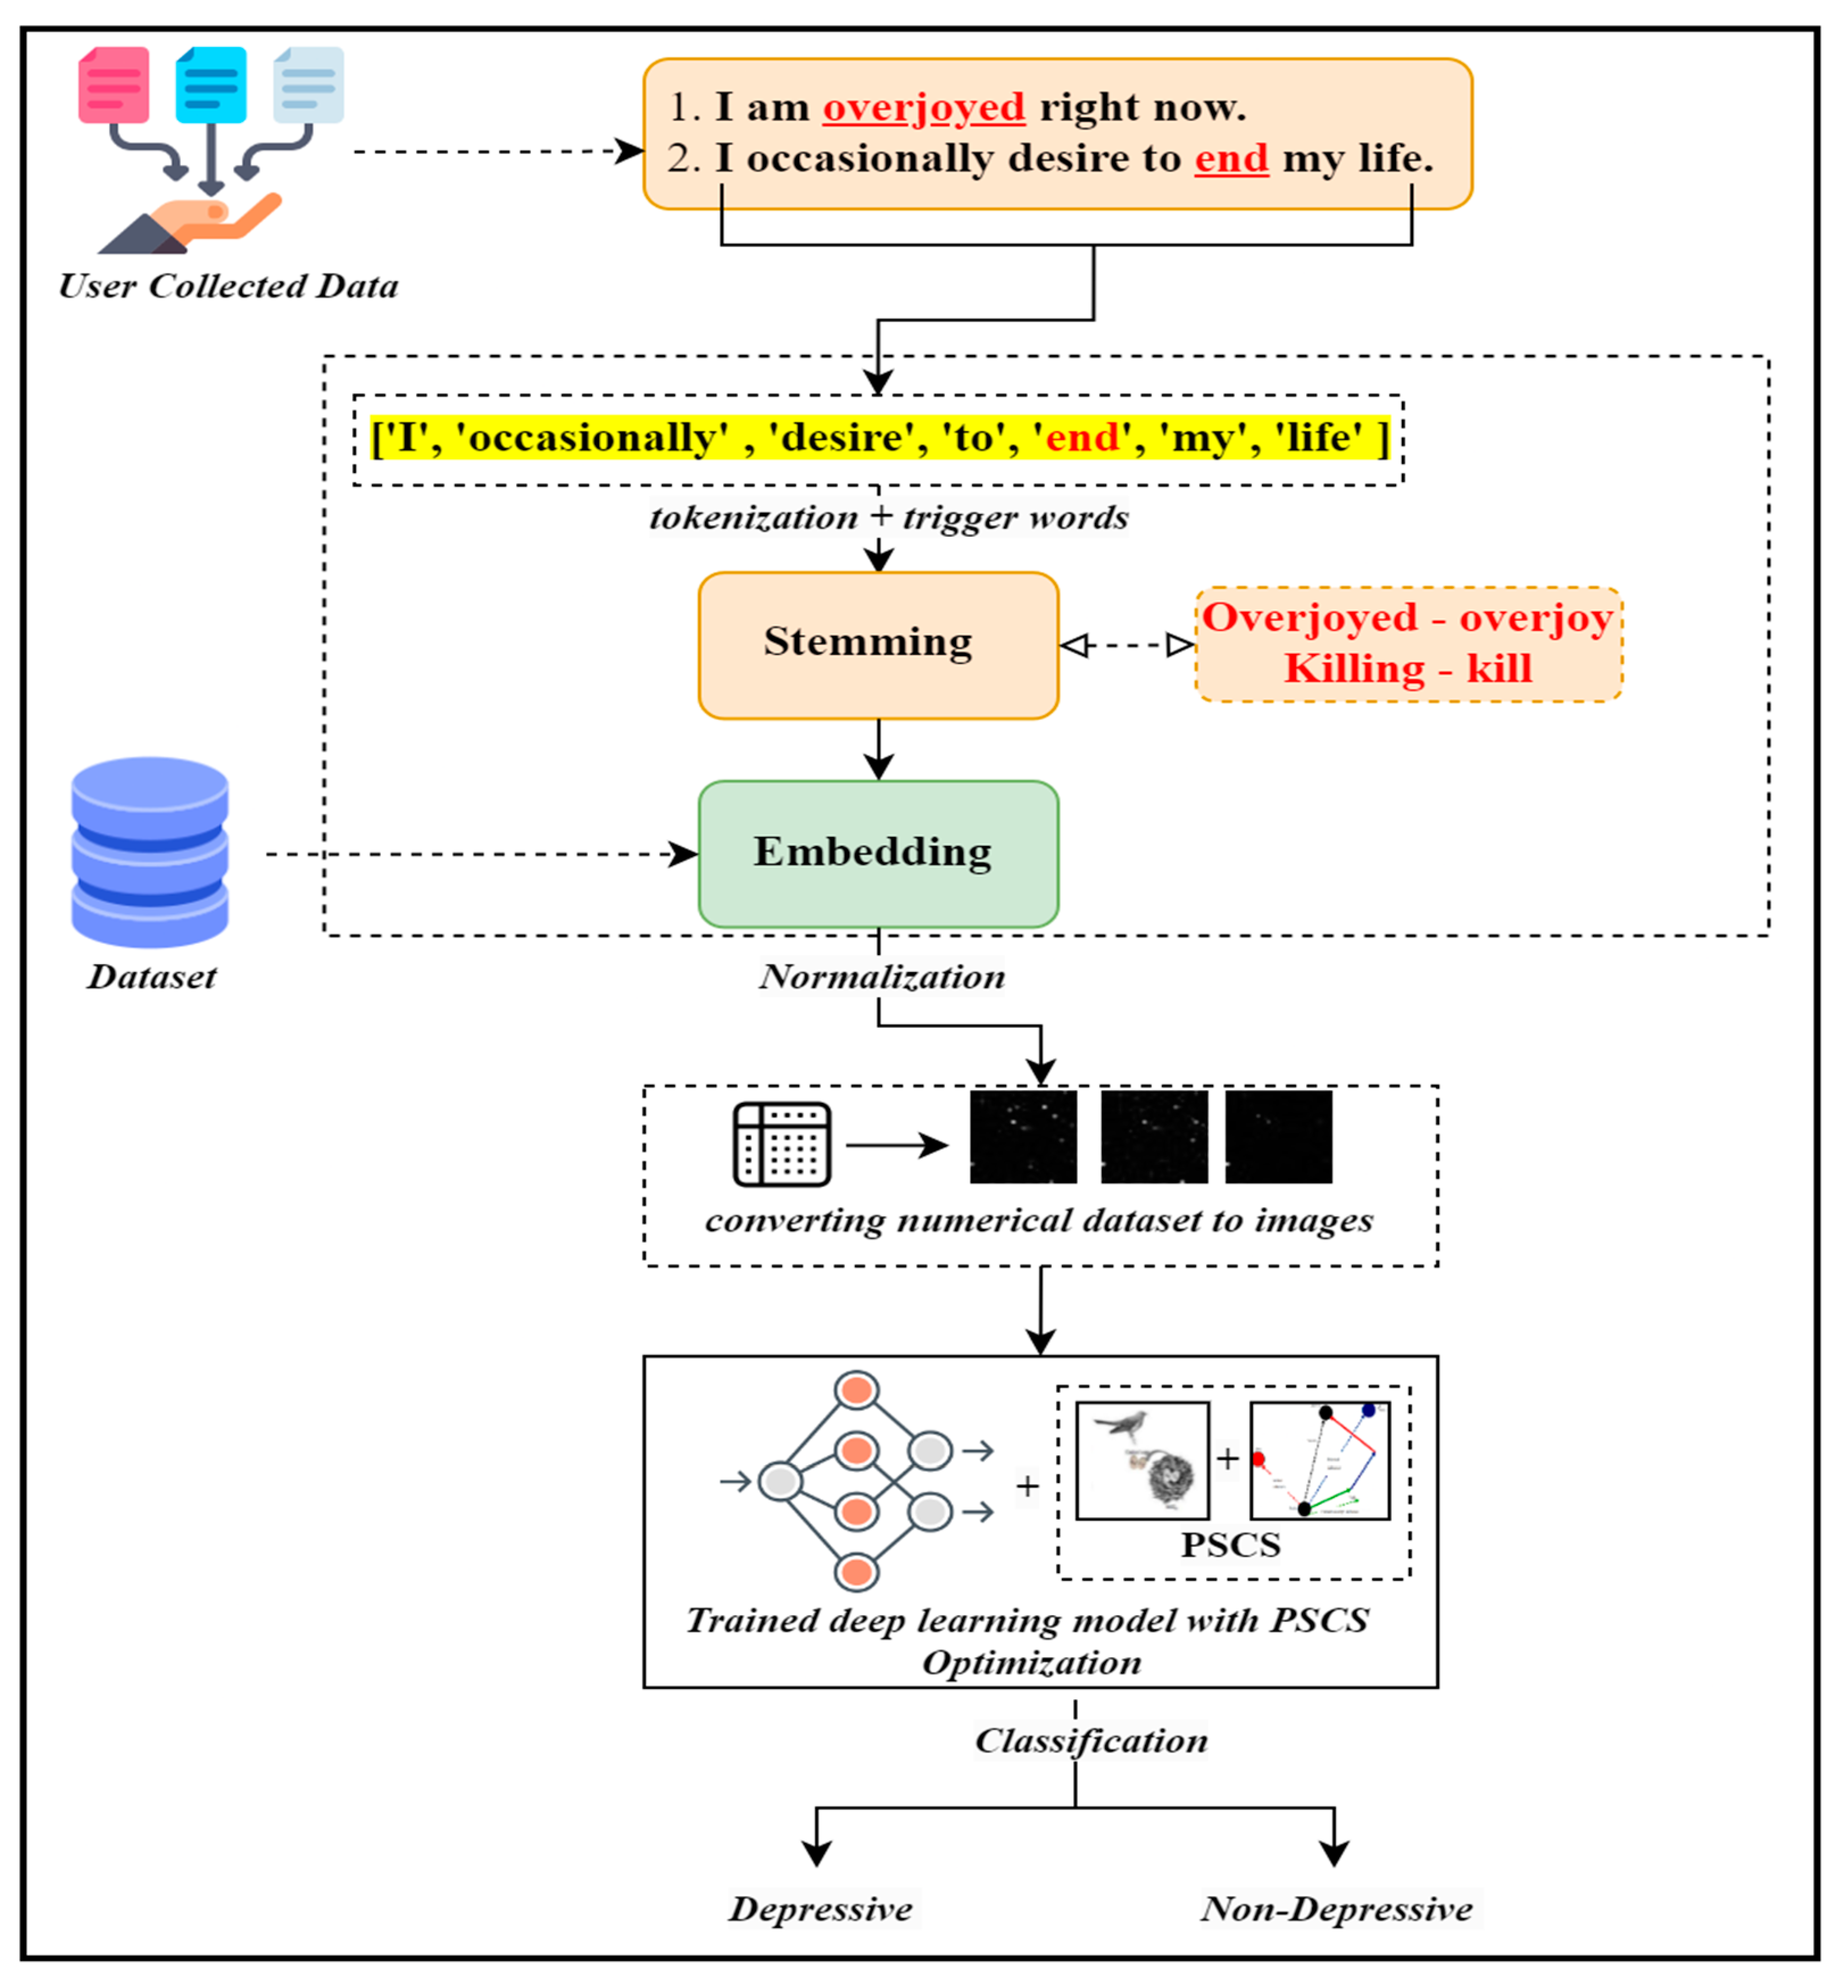
Figure 1. The sequence of steps taken in the study’s process workflow.
Applsci 13 05322 g001
Figure 2. Flowchart for proposed optimization algorithm.
Applsci 13 05322 g002
Figure 3. Visualization of deep learning model configuration.
Applsci 13 05322 g003
Figure 4. Accuracy and Loss graph graphs for the proposed model.
Applsci 13 05322 g004
Figure 5. Training and Validation loss comparison of deep learning models.
Applsci 13 05322 g005
Figure 6. Precision–Recall graph for VGG model (a), ResNet model (b), Proposed model (c), LeNet Model (d).
Applsci 13 05322 g006
Figure 7. ROC for proposed model and various CNN models for classification of the type of depression.
Applsci 13 05322 g007
Figure 8. Error comparison with machine learning algorithms.
Applsci 13 05322 g008
Figure 9. Confusion Matrix of Proposed Methodology.
Applsci 13 05322 g009
Figure 10. (af) Confusion Matrix for models SVR, decision tree, linear regression, ridge regression, logic regression, and KNN.
Applsci 13 05322 g010
Figure 11. ROC for various models used for classification of the type of depression.
Applsci 13 05322 g011
Figure 12. Performance evaluation of proposed algorithm in relation to deep learning, machine learning, and other published algorithms [7,21,22,23,55] for depression detection.
Applsci 13 05322 g012
Table 1. Simulation parameter setting.
SpecificationsParameters
ProcessorIntel(R) Core ™ i9- 12900 k (5.20 GHz)
Random Access Memory (RAM)64 GB
Graphics Processing Unit (GPU)Nvidia RTX Quadro A5000
IDEVSCode (Python)
Operating SystemUbuntu 20.04.5 LTS (Windows WSL)
Table 2. The setup of the deep learning model employed in this study.
LayerFilters/NeuronsFilter SizeSize of Feature MapActivation Function
InputNoneNone 32 × 32 × 1 None
Convolution 1256 3 × 3 128 × 128 × 1 Relu
Avg-Pooling 1None 2 × 2 64 × 64 × 1 None
Convolution 2128 3 × 3 48 × 48 × 1 Relu
Avg-Pooling 2None 2 × 2 16 × 16 × 1 None
FlattenNoneNone256Flatten
DropoutNoneNone128Dense
Dense2None64Softmax
Table 3. Parameter setting of the proposed algorithm.
ParametersDescriptionPSOCSPS-CS
wInertia weight0.65--
C1Learning factor1.2-1.2
C2Learning factor2-2
NPopulation size10080-
MIteration100300100
PcCrossover probability---
PmVariation probability---
wmaxMaximum inertia weight--0.9
wminMinimum inertia weight--0.3
NmaxMaximum population size--100
NminMinimum population size--20
PaAbandonment rate-0.250.25
PaminMaximum probability -0.20.2
PamaxMinimum probability-0.60.6
αStep size-0.030.03
Table 4. Performance comparison among the various published models with proposed model for depression detection.
Type of AlgorithmTraining AccuracyTesting AccuracyF1 ScoreRecallPrecision
Proposed Model (PSCS)99.598.797.9896.798.57
Katchapakirin et al. (LSTM) [55]8584.782.9481.8483.59
Ahmed et al. (LSTM and CNN) [21]92.0691.7690.5189.7591.09
Rosa et al. (CNN and BiLSTM) [22]8988.787.6387.2188.2
Cheng et al. (BiLSTM) [23]87.1786.8785.1784.0985.75
Imran et al. (LSTM) [7]69.9269.6268.6368.3469.62
Disclaimer/Publisher’s Note: The statements, opinions and data contained in all publications are solely those of the individual author(s) and contributor(s) and not of MDPI and/or the editor(s). MDPI and/or the editor(s) disclaim responsibility for any injury to people or property resulting from any ideas, methods, instructions or products referred to in the content.