Abstract
The aim of biomechanics applied to implantology is to determine the deformative and tensional states by solving the equilibrium equations within the mandibular bone and the osseointegrated implant to ensure its stability and improve the success rate. The finite element method is a powerful numerical technique that uses computing power to derive approximate solutions for the analysis of components with very complex geometry, loads, materials, and especially the biomechanical problems analysis, which is challenging to find in vivo or in vitro. This study performs a complete FEA survey on 3 implants Cono-in with 3 different diameters 3.4 mm, 4.5 mm, and 5.2 mm with abutments inclined to 15° and evaluates the tensions that are generated in the system as a result of the application of chewing loads. In this study, the extent of the stresses developed in the peri-crestal zone of the implants with the variation of the occlusal overstress acting on them was also evaluated. Autodesk Inventor Nastran Software was used to perform this type of localized finite element analysis; With this type of analysis, it was possible to analyze the peri-crestal area of the implant more precisely through a more accurate reconstruction of the mesh element, which allowed us to solve the FEA solution mathematically. The results showed how the application of the inclined load with respect to the vertical load on a larger diameter system leads to an increase in stress.
1. Introduction
Osseointegrated implants have been successfully used to restore the functionality of fully or partially edentulous patients. Despite the high success rate of these implants, the literature [1,2] notes high failure rates. The most common failures are the lack of stability between the implant and the bone and the breakage in the areas of abutment–implant connection due to, for example, an incorrect choice of the diameter of the implant or an incorrect consideration of the chewing loads. In fact, studies [1] show how an inclination of the load increases the stress on the system. Although these ruptures do not result in implant loss, they pose a problem for both patients and physicians and incur additional costs. Therefore, varieties of geometries and connections for implants and abutments have been developed. Studies in the literature show how the internal connection with respect to the external one (hexagonal) provides a reduction in stress at the interface of the bone implant [1]. In addition, clinical failures have improved. The use of the FEA method increasingly used in recent years [2] to study the stresses in many dental applications allows us to understand the mechanical behavior of the implant without having to perform destructive or in vivo tests. FEA basically stands for a numerical model of stress and strain analysis of an assigned geometry [3,4]. FEA results showed that when combined with strain gauge measurements in vivo, they correspond to clinical results [4]. The aim of this study is to evaluate the simultaneous influence of load diameter and inclination on an implant system with an internal conometric connection, on the distribution of stresses in the abutment, and on the implant, paying more attention to the upper area of the implant where the highest tensions occur.
This implant was chosen because it has a self-locking Cone Morse connection with a 2 degrees angulation, 1 degree per side. On the market, there are very few implants that have a self-locking connection. Most commercial implants do not have a self-locking Cone Morse connection but a conical 5°, 11°, or even 18° implant–abutment connection angle [5,6,7,8].
2. Materials and Methods
The finite element method allowed the analysis of the stresses that the prosthetic components exchanged intrinsically and how the latter were discharged onto the bone [9,10,11,12,13]. In this work, we will study the conometric implants (3P ImplaFavourite, Scalenghe, Turin, Italy) with 3 different diameters (3.4 mm, 4.5 mm, and 5.2 mm) and abutments inclined at 15°.
Figure 1 below showed the main aspects of the three different geometries under analysis. Before carrying out the real finite element analysis, it was necessary to simulate the abutment–implant contact [14] through the constraint functions present within the Software Inventor 2021, Autodesk (San Francisco, CA, USA) (Figure 2, Figure 3 and Figure 4).
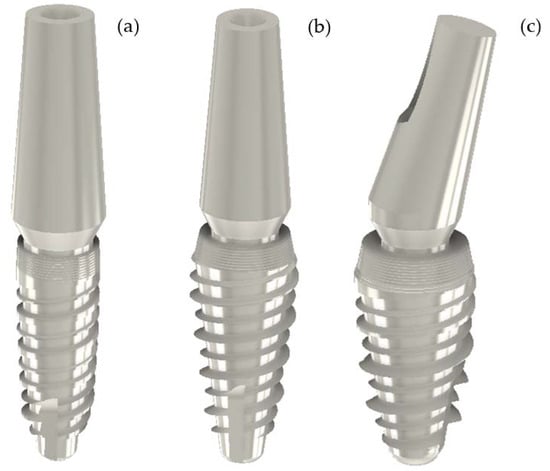
Figure 1.
(a) Cono-in Implant 3.4 × 10 mm with full small abutment 0° (b) Cono-in Implant 4.5 × 10 with full small abutment 0°. (c) Cono-in Implant 5.2 × 10 mm with full small abutment 15° (Geometries displayed via the Inventor Professional 2021 Software, Autodesk).

Figure 2.
Constraint of alignment axis abutment–axis implant.
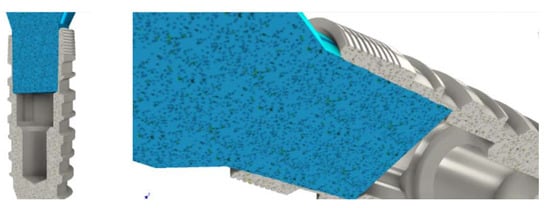
Figure 3.
Coincidence constraint between the extreme face of the stump and the internal groove of the implant.

Figure 4.
Another constraint imposed was relative to rotational locking, which ensured that the two components did not have relative rotation.
Regarding an internal connection, due to friction between the inclined planes of the implant and the abutment, the lateral occlusal force is concentrated on the implant wall through the abutment–implant connection zone. Therefore, the loosening of the screws is less frequent in internal connections, and the absolute stability between the implant and the abutment with the absolute absence of micromovements guarantees a good bacterial seal and optimal clinical well being [15,16,17,18,19,20,21,22].
The Cono-in implants were made of grade 4 titanium, with small full-section abutments made of ti6al4v titanium alloy, known for its improved mechanical strength (the abutments were, in fact, the component most at risk of breaking the resistance). The next step was, therefore, to assign the material to the two components before carrying out the stress analysis study [14]. Therefore, in order to model the bone–implant contact, the interlocking constraint was used, the movements in the three directions, x, y, and z, were constrained and applied to the upper surface of the e-implants shown in Figure 5 since the correct stability occurs if there are not micro-chromosomes between the implant and bone. The occlusal surface of the dental implant was subjected to a combined loading condition in the mesiodistal, buccal-lingual, and apical directions. Three different simulations were performed to vary the occlusal force and, consequently, the angle of the resulting relative to the occlusal plane; In this way, the variation of the maximum stress of Von Mises was highlighted by varying load and inclination. A 0.5 mm mesh was used [23,24,25,26,27,28,29,30,31].
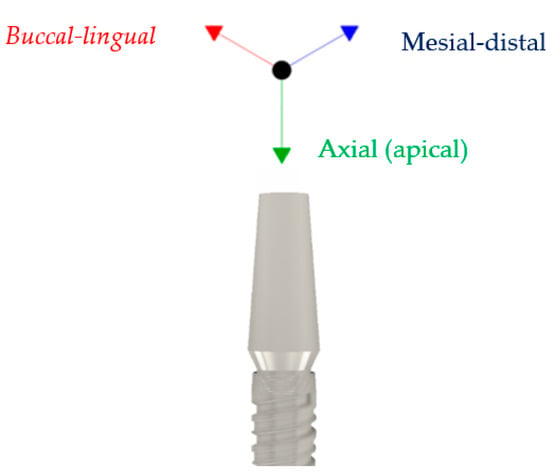
Figure 5.
The reference system used.
In this study, we will also evaluate the extent of the stresses developed in the peri-crestal zone of the implants with the variation of the occlusal overstress acting on them. In particular, the responses of the first cone morse implant with inclination of 0° and the last of 15° will be compared in order to highlight how the inclination of the stump can affect the response of the implant to the action of occlusal forces. Autodesk Inventor Nastran software was used to perform this type of localized finite element analysis.
Specifically, six finite element simulations were carried out in the periapical zone of the two implants: three for the dental implant conometric axis of the abutment with zero inclination and three for the dental implant conometric axis of the abutment with inclination of 15°; the simulations differed according to the occlusal load considered, 300 N, 200 N, and 100 N. The results of the analyses were shown in the figures below (Figures 11–18).
3. Results
The force values have been assumed from the studies carried out on the masticatory complex. In particular, the use of the first two implants as replacement of incisors or lateral incisors and the third type of implant as replacement of a premolar or molar has been hypothesized. Subsequently, the results of the analysis were shown with the elements performed via the Inventor Professional Calculation Software (Autodesk) using overstresses on the respective 3 implants, as were shown the values of Von Mises stress for a mesh element size of 0.05 mm in Figure 6, Figure 7, Figure 8 and Figure 9. Figure 10 below summarizes the movements along x, y, and z for the three different types of implants evaluated (considering the maximum efforts). Finally, the results of the analysis carried out in the three different plants were summarized, for greater clarity, in tabular form (Table 1) and graphic form (Scheme 1 and Scheme 2).
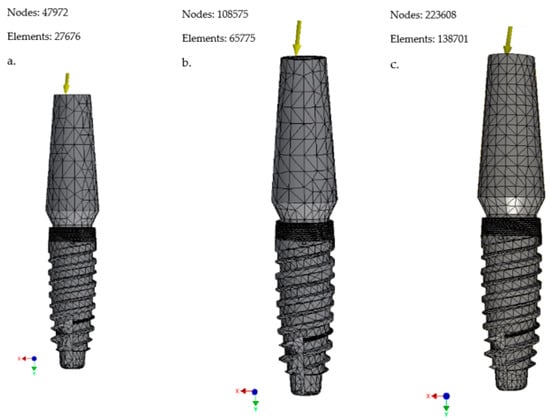
Figure 6.
(a) Mesh 0.1 mm; (b) mesh 0.08 mm; (c) mesh 0.05 mm (Cono-in 3.4 × 10 mm).
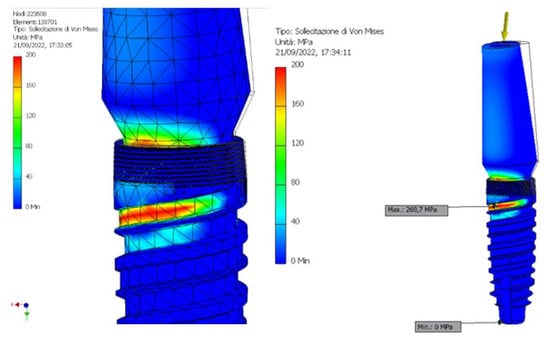
Figure 7.
Representation of the maximum and minimum Von Mises stress on Cono-in 3.4 × 10 mm implant at first analysis.
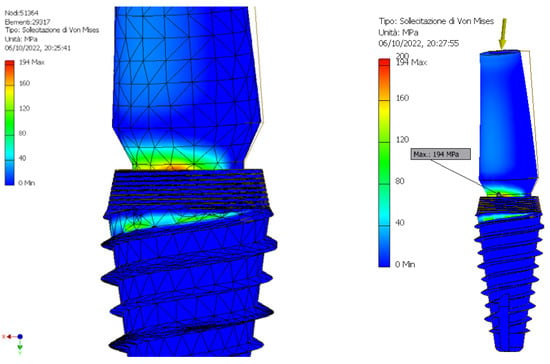
Figure 8.
Representation of the maximum and minimum Von Mises stress on Cono-in 4.5 × 10 mm implant at first analysis.
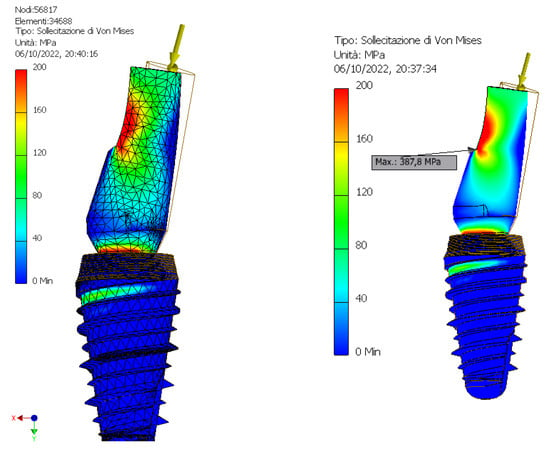
Figure 9.
Representation of the maximum and minimum Von Mises stress on Cono-in 5.2 × 10 mm implant at first analysis.
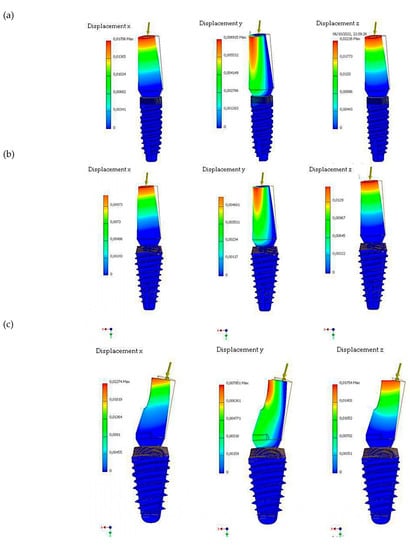
Figure 10.
Analysis of maximum displacements along x, y, and z at maximum loads for (a) Cono-in implant 3.4 × 10 mm, (b) Cono-in 4.5 × 10 mm, and (c) Cono-in 5.2 × 10 mm.

Table 1.
The table shows the results of the finite element analysis, in terms of Von Mises stress, for the 3 different implants (Cono-in 3.4 × 10 mm to 0, Cono-in 4.5 × 10 mm to 0, and Cono-in 5.2 × 10 mm to 15 mm) with changing resulting forces and mesh element sizes.
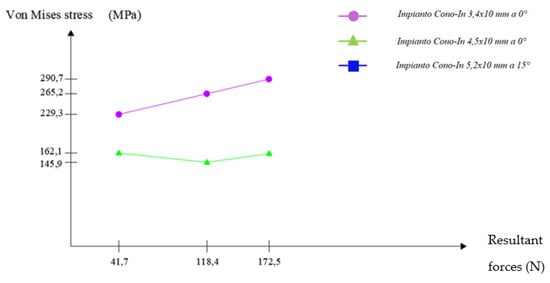
Scheme 1.
Graphical representation of the trend of Von Mises’ stress as the resultant forces acting on the implants with a small full stump to 0°. Mesh settings set to 0.08 mm (Cono-in 3.4 × 10 mm and Cono-in 4.5 × 10 mm).
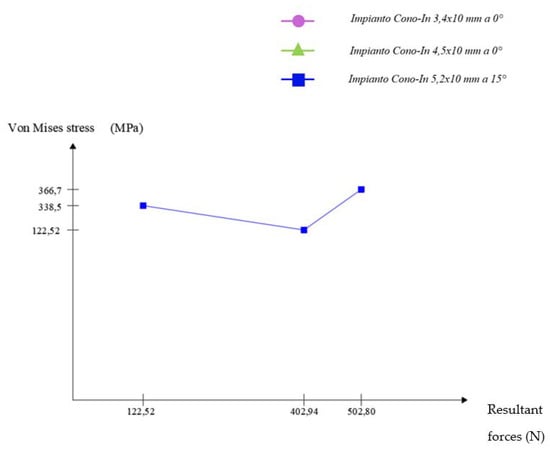
Scheme 2.
Graphical representation of the trend of Von Mises’ stress as the resultant forces acting on the implant with a small full stump at 15° (Cono-in 5.2 × 10 mm). Mesh settings set to 0.08 mm (mesh element size).
The results of this study localized in the peri-crestal zone of the implants are shown in the figures below (From Figure 11, Figure 12, Figure 13, Figure 14, Figure 15, Figure 16, Figure 17 and Figure 18).
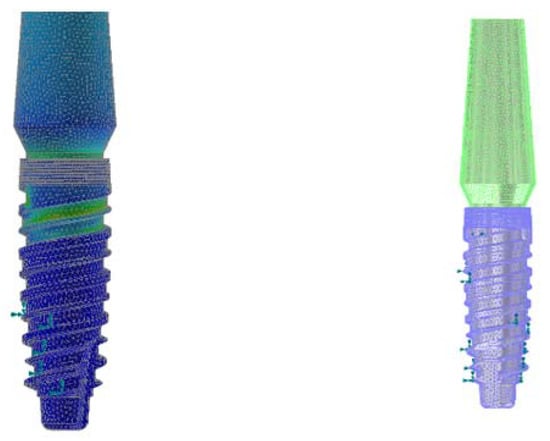
Figure 11.
Discretization of the Cono-in 3.4 mm implant with small full abutment at 0° using the 0.2 mm volume mesh element (Autodesk Inventor Nastran 2021).
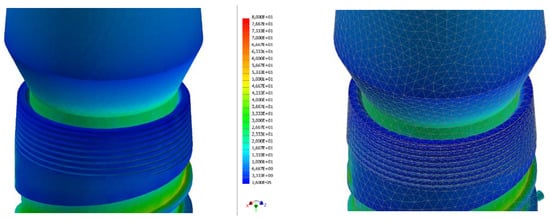
Figure 12.
Strain analysis dental implant Cono-in 3.4 mm 0° following an occlusal force of 100 N. Stress distribution view with and without mesh display. The colorimetric variation range has been set in the range of [0, 80] MPa for a better representation of the stress distribution. In this first analysis, the stress in the peri-crestal area of the implant varies from 18 to 25 MPa (Autodesk Inventor Nastran 2021).
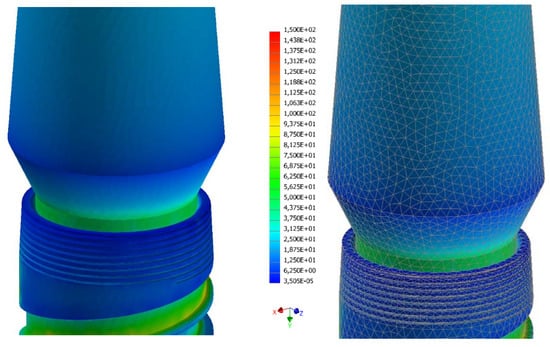
Figure 13.
Strain analysis dental implant Cono-in 3.4 mm 0° following an occlusal force of 200 N. Stress distribution view with and without mesh display. The colorimetric variation range has been set in the range of [0, 150] MPa for a better representation of the stress distribution. In this first analysis, the stress in the peri-crestal area of the implant varies from 36 to 50 MPa (Autodesk Inventor Nastran 2021.
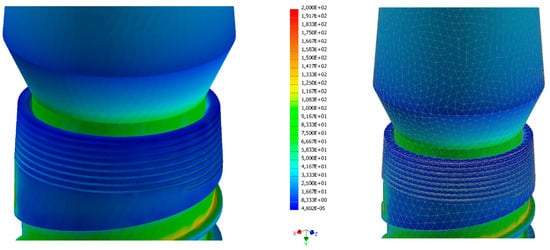
Figure 14.
Strain analysis dental implant Cono-in 3.4 mm 0° following an occlusal force of 300 N. Stress distribution view with and without mesh display. The colorimetric variation range has been set in the range of [0, 80] MPa for a better representation of the stress distribution. In this first analysis, the stress in the peri-crestal area of the implant varies from 50 to 70 MPa (Autodesk Inventor Nastran 2021).
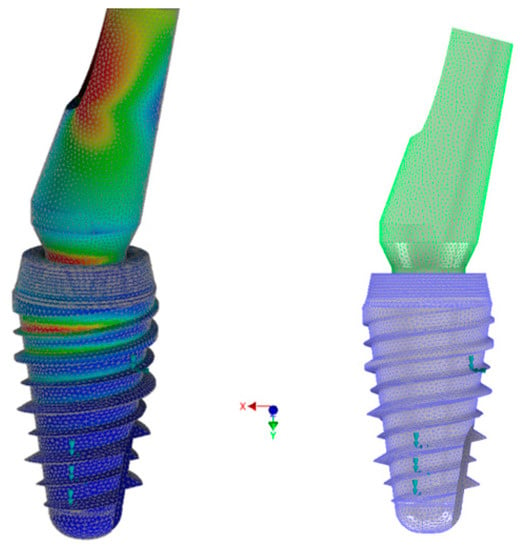
Figure 15.
Discretization of the Cono-in 5.2 mm implant with small full abutment at 15° by using the 0.2 mm volume mesh element (Autodesk Inventor Nastran 2021).
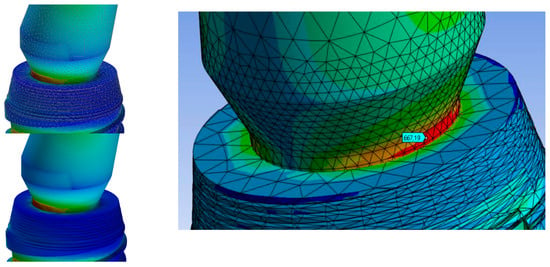
Figure 16.
Strain analysis dental implant Cono-in 5.2 mm 15° following an occlusal force of 100 N. Stress distribution view with and without mesh display. The colorimetric variation range has been set in the range of [0, 50] Mpa for a better representation of the stress distribution. In this first analysis, the stress in the peri-crestal area of the implant varies from 7 to 46 MPa (Autodesk Inventor Nastran 2021).
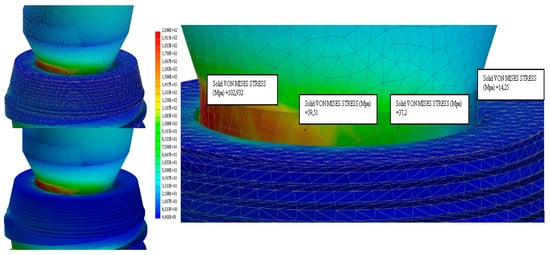
Figure 17.
Strain analysis dental implant Cono-in 5.2 mm 15° following an occlusal force of 200 N. Stress distribution view with and without mesh display. The colorimetric variation range has been set in the range of [0, 100] MPa for a better representation of the stress distribution. In this first analysis, the stress in the peri-crestal area of the implant varies from 14 to 103 MPa (Autodesk Inventor Nastran 2021).
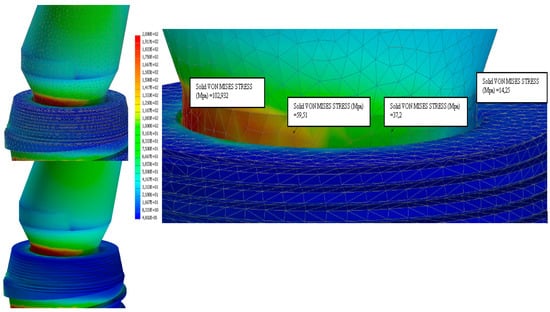
Figure 18.
Strain analysis dental implant Cono-in 5.2 mm 15° following an occlusal force of 300 N. Stress distribution view with and without mesh display. The colorimetric variation range has been set in the range of [0, 100] MPa for a better representation of the stress distribution. In this first analysis, the stress in the peri-crestal area of the implant varies from 19 to 150 MPa (Autodesk Inventor Nastran 2021).
4. Discussion
The geometry of the implants is one of the fundamental parameters to be considered in the clinical picture [32]. In this regard, finite element analysis is a powerful means to study the stresses and possible problems that could lead to implant failure. Some studies have focused on the influence of the length [1] of the implant in relation to the stress distribution; it has been reported that the best range of lengths, which corresponded approximately to the true length of the roots of the teeth, was suggested to be in the range of 8 mm and 13 mm [9,33,34,35]. This criterion was met by the implant object of the present investigation, which has a wheelbase of about 0.8 mm. Similarly, the studies concerning the geometry of the helix showed a close correlation between the same stress and the distribution of stress around the implant. A decrease in the thread pitch of the implant could positively influence the stability of the implant. One of the technical measures concerning the implant geometry, also used on the implants under investigation, was the addition of helixes or micro-helixes up to the crestal module that provided a potentially positive contribution to the implant–bone adhesion as well as to the conservation of marginal bone [33,35,36]. In general, as previously treated, bone is remodeled constantly to adapt to external stimuli due to the surrounding environment, a phenomenon known as bone homeostasis. Therefore, the implants were designed to maximize the delivery of optimal favorable voltages, minimizing the amount of extreme adverse stress at the implant-bone interface [37,38]. Hence, these implants have threads that allowed better stability and a greater surface of implant–bone contact. It is, therefore, evident that a pitch of 0.8 mm has a higher resistance to vertical load. In this study, conical implants were used that produce compressive forces (positive for bone remodeling). On the contrary, in cylindrical implants, cutting forces were more developed due to implant damage [39]. In addition, the double thread was more useful for faster insertion than the single thread. Studies have shown that implants with multiple threads (resulting in a lower height) have a higher percentage of the bone–implant interface [40]. In addition, a greater depth of the helix can be an advantage in areas of softer bone and when there was greater occlusal strength due to increased functional surface in contact with bone [35]. In contrast, the decrease in the depth of the fillet allows for easier insertion into the denser bone without the need for tapping [41]. The results obtained regarding this localized study of the peri-crestal zone were extremely interesting [42,43]. Firstly, both implants generated significantly lower stress distributions in the peri-crestal area than the yield stress of the material constituting the abutment (the maximum stress developed in this area was 100 MPa in the face of a yield stress of 860 Mpa Ti6Al4V). This result makes it possible to affirm that both implants will be able to withstand occlusal forces for a considerable life span, which is an excellent result that guarantees the clinical success of the treatment.
There were substantial differences concerning the uniformity of stress distribution. The dental implant with zero inclination of the abutment had a very uniform and axisymmetric stress distribution; the stress distribution was, for the same occlusal forces considered in all 3 cases (100 N, 200 N, and 300 N), much lower than the implant distributions with an inclination of 15°of the abutment. In addition, stresses were distributed gradually over a finite and substantially defined range (for an occlusal force of 100 N stress → range in MPa (18, 25); for an occlusal force of 200 N → stress range in MPa (36, 50); for an occlusal force of 300 N → stress range in MPa (50, 70)).
On the other hand, the 15-prong implant had a stress concentration in the peri-crestal area of the implant, meaning localized stress. This resulted in a distribution, albeit small, less gradual and, therefore, a consequently wider range of values:
- For an occlusal force of 100 N stress → range in MPa (7, 46);
- For an occlusal force of 200 N → stress range in MPa (15, 103);
- For an occlusal force of 300 N → stress range in MPa (20, 150).
In the latest configuration, the abutment was more stressed than the first threads of the implant.
Obviously, a situation that presented continuity and graduality of the stress distribution was always preferable as it turned out to be a necessary prerequisite for not having complications during the fatigue life of the component. Therefore, there was an apparent correlation between the inclination of the stump and the development of stress in the peri-crestal implant area. In particular, it seemed that the two implants under study were in a linear relationship with a multiplicative factor 2, in the peri-crestal zone of the installations). These results do not account for the effect that the oral environment may have. A further study could implement this effect to obtain more accurate results.
5. Conclusions
All the implants and abutments under analysis have been verified, and the results showed that, even with very high loads acting on the implants, the maximum stress, evaluated with the Von Mises criterion, was always lower than the yield strength of the implant and the abutment, respectively, 483 MPa and 860 MPa.
In conclusion, the peri-crestal study of the first and third systems (Cono-in 3.4 and Cono-in 5.2) confirmed the following:
- The 3.4 mm Cono-in system was more stressed by large occlusal forces in the peri-crestal area with a much lower stress distribution;
- The 5.2 mm implant resisted higher occlusal loads than the first one thanks to its more consistent geometry; but, in the peri-crestal area, it had values and distributions of the most important stresses due to the inclination of the abutment, which needs more attention;
- An inclined load leads to an increase in stress in the abutment–implant connection area.
Such a study can, therefore, help the clinician to accurately assess the size of the implant and take into account any parafunctional loads such as bruxism, avoiding failures that would lead to increased costs on the part of the patient and the clinician. The next investigation should attempt to correlate the results with clinical results. Currently, there is still no correspondence between FEA studies and in vivo studies. In doing so, it improves the validity of the models. In addition, it is necessary to simulate the consequences of saliva, infection, and fatigue failure under repetitive, realistic, and cyclical load conditions.
Author Contributions
Conceptualization, B.T.; Methodology, C.C., M.C. and A.S.; Formal analysis, A.S.; Investigation, C.C.; Resources, B.T.; Data curation, M.C.; Writing – original draft, C.C., M.C., A.S. and B.T.; Writing – review & editing, A.P.; Visualization, A.P.; Supervision, B.T.; Project administration, B.T. All authors have read and agreed to the published version of the manuscript.
Funding
This research received no external funding.
Institutional Review Board Statement
Not applicable.
Informed Consent Statement
Not applicable.
Data Availability Statement
Not applicable.
Acknowledgments
The authors thank Company 3P ImplaFavourite for its valuable participation in the modeling process and technical consult.
Conflicts of Interest
The authors declare no conflict of interest.
References
- Quaresma, S.E.T.; Cury, P.R.; Sendyk, W.R.; Sendyk, C. A Finite Element Analysis of Two Different Dental Implants: Stress Distribution in the Prosthesis, Abutment, Implant, and Supporting Bone. J. Oral Implantol. 2008, 34, 1–6. [Google Scholar] [CrossRef] [PubMed]
- Yi, Y.; Heo, S.-J.; Koak, J.-Y.; Kim, S.-K. Mechanical complications of implant-supported restorations with internal conical connection implants: A 14-year retrospective study. J. Prosthet. Dent. 2021. ahead-of-print. [Google Scholar] [CrossRef] [PubMed]
- Kunavisarut, C.; Lang, L.A.; Stoner, B.R.; Felton, D.A. Finite element analysis on dental implant-supported prostheses without passive fit. J. Prosthodont. 2002, 11, 30–40. [Google Scholar] [CrossRef] [PubMed]
- Bathe, K.J. Finite Element Procedures; Prentice-Hall: Upper Saddle River, NJ, USA, 1996; Chapter 4; pp. 148–377. [Google Scholar]
- Gultekin, B.A.; Gultekin, P.; Yalcin, S. Finite Element Analysis—New Trends and Developments, 1st ed.; Sciyo: Rijeka, Croatia; IntechOpen: London, UK, 2012. [Google Scholar]
- Chen, L. Finite Element Analysis-New Trends and Developments; Ebrahimi, F., Ed.; IntechOpen Ltd.: London, UK, 2012; ISBN 978-953-51-0769-9. [Google Scholar]
- Danza, M.; Zollino, I.; Paracchini, L.; Riccardo, G.; Fanali, S.; Carinci, F. 3D finite element analysis to detect stress distribution: Spiral family implants. Maxillofac. Oral Surg. 2009, 8, 334–339. [Google Scholar] [CrossRef]
- Cho, S.Y.; Huh, Y.H.; Park, C.J.; Cho, L.R. Three-Dimensional Finite Element Analysis on stress distribution of internal Implant-Abutment engagement features. Int. J. Oral Maxillofac. Implants 2018, 33, 319–327. [Google Scholar] [CrossRef]
- Kim, S.J.; Kim, S.; Choi, H.; Woo, D.; Park, Y.B.; Shim, J.S.; Kim, H.S.; Lee, K.W. A three-dimensional Finite Element Analysis of short Dental Implants in the posterior maxilla. Int. J. Oral Maxillofac. Implants 2014, 29, e155–e164. [Google Scholar] [CrossRef]
- Kharsan, V.; Bandgar, V.; Mirza, A.; Jagtiani, K.; Dhariwal, N.; Kore, R. Comparative Evaluation of three abutment-implant interfeces on stress distribution in and around different implant systems: A Finite Element Analysis. Contemp. Clin. Dent. 2019, 10, 590–594. [Google Scholar] [CrossRef]
- Pessoa, R.S.; Muraru, L.; Júnior, E.M.; Vaz, L.G.; Sloten, J.V.; Duyck, J.; Jaecques, S.V.N. Influence of Implant Connection Type on the Biomechanical Environment of Immediately Placed Implants—CT-Based Nonlinear, Three-Dimensional Finite Element Analysis. Clin. Implant Dent. Relat. Res. 2010, 12, 219–234. [Google Scholar] [CrossRef]
- Yalçin, M.; Kaya, B.; Laçin, N.; Ari, E. Three-Dimensional Finite element analysis of the effect of endosteal implants with different maco designs on stress distribution in different bone qualities. Int. J. Oral Maxillofac. Implants 2019, 34, 43–50. [Google Scholar] [CrossRef]
- Yenigun, S.; Ercal, P.; Ozden-Yenigun, E.; Katiboglu, A.B. Influence of Abutment design on stress distribution in narrow implants with marginal bone loss: A Finite Element Analysis. Int. J. Oral Maxillofac. Implants 2021, 36, 640–649. [Google Scholar] [CrossRef]
- Unsal, G.S. Three-Dimensional Finite Element Analysis of Different implant configurations in Enlarged first molar areas. Int. J. Oral. Maxillofac. Implants 2020, 35, 675–683. [Google Scholar] [CrossRef] [PubMed]
- Doganay, O.; Kilic, E. Comparative Finite Element Analysis of short implants with different treatment approaches in the atrophic mandible. Int. J. Oral Maxillofac. Implants 2020, 35, e69–e76. [Google Scholar] [CrossRef] [PubMed]
- Sahin, S.C. Static and Dynamic Stress Analysis of Standard- and Narrow-Diameter Implants: A 3D Finite Element Analysis. Int. J. Oral Maxillofac. Implants 2020, 35, e58–e68. [Google Scholar] [CrossRef] [PubMed]
- Fiorillo, L.; Cicciù, M.; D’Amico, C.; Mauceri, R.; Oteri, G.; Cervino, G. Finite Element Method and Von Mises Investigation on Bone Response to Dynamic Stress with a Novel Conical Dental Implant Connection. Hindawi BioMed Res. Int. 2020, 2020, 2976067. [Google Scholar] [CrossRef]
- Akça, K.; Cehreli, M.C.; Iplikçioğlu, H. Evaluation of the mechanical characteristics of the implant-abutment complex of a reduced-diameter morse-taper implant, A nonlinear finite element stress analysis. Clin. Oral. Implants Res. 2003, 14, 444–454. [Google Scholar] [CrossRef]
- Formiga, M. Evaluation Using FEM on the Stress Distribution on the Implant, Prosthetic Components and Crown, with Cone Morse, External and Internal Hexagon Connections. Dent. Press Implantol. 2013, 7, 67–75. [Google Scholar]
- Cho, S.Y.; Huh, Y.H.; Park, C.J.; Cho, L.R. Three-Dimensional Finite Element Analysis of the stress distribution at the internal Implant-Abutment connection. Int. J. Periodontics Restor. Dent. 2016, 36, 49–58. [Google Scholar] [CrossRef]
- Maslucan, R.A.; Dominguez, J.A. A Finite Element Stress Analysis of a Conical Triangular Connection in Implants: A New Proposal. Materials 2022, 15, 3680. [Google Scholar] [CrossRef]
- Dantas de Moraes, S.L.; Verri, F.R.; Santiago Júnior, J.F.; Augusto de Faria Almeida, D.; Lemos, C.A.A.; Marcela de Luna Gomes, J.; Pellizzer, E.P. Three-dimensional Finite Element Analysis of varying diameter and connection type in implants with high crown-implant ratio. Braz. Dent. J. 2018, 29, 36–42. [Google Scholar] [CrossRef]
- Faria Almeida, D.A.; Pellizzer, E.P.; Verri, F.R.; Santiago, J.F., Jr.; Carvalho, P.S. Influence of tapered and external hexagon connections on bone stresses around tilted dental implants: Three-dimensional finite element method with statistical analysis. J. Periodontol. 2014, 85, 261–269. [Google Scholar] [CrossRef]
- Santiago Júnior, J.S.; Verri, F.R.; Almeida, D.A.; Souza Batista, V.E.; Lemos, C.A.; Pellizzer, E.P. Finite element analysis on influence of implant surface treatments, connection and bone types. Mater. Sci. Eng. C Mater. Biol. Appl. 2016, 63, 292–300. [Google Scholar] [CrossRef] [PubMed]
- Merz, B.R.; Hunenbart, S.; Belser, U.C. Mechanics of the implant-abutment connection: An 8-degree taper compared to a butt joint connection. Int. J. Oral Maxillofac. Implants 2000, 15, 519–526. [Google Scholar] [PubMed]
- Brunski, J.B. Biomechanical factors affecting the bone dental implant interface. Clin. Mater. 1992, 10, 153–201. [Google Scholar] [CrossRef] [PubMed]
- Geris, L.; Andreykiv, A.; Van Oosterwyck, H.; Vander Stolen, J.; van Keulen, F.; Duyck, J.; Naert, I. Numerical simulation of tissue differentiation around loaded titanium implants in a bone chamber. J. Biomech. 2004, 37, 763–769. [Google Scholar] [CrossRef] [PubMed]
- Vandamme, K.; Naert, I.; Geris, L.; Vander Sloten, J.; Puers, R.; Duyck, J. The effect of micromotion on the tissue response Influence of Implant-Abutment Connection on the Biomechanical Behavior of Implants 233 around immediately loaded roughened titanium implants in the rabbit. Eur. J. Oral Sci. 2007, 115, 21–29. [Google Scholar] [CrossRef]
- Canay, S.; Akça, K. Biomechanical aspects of bone-level diameter shifting at implant-abutment interface. Implant Dent. 2009, 18, 239–248. [Google Scholar] [CrossRef]
- Albrektsson, T.; Zarb, G.; Worthington, P.; Eriksson, A.R. The long-term efficacy of currently used dental implants: A review and proposed criteria of success. Int. J. Oral Maxillofac. Implants 1986, 1, 11–25. [Google Scholar] [PubMed]
- Laster, Z.; Weissberg, I.; Kablan, F. Biomechanics and Peri-implantisis: The effect of a subcrestal wing-thread to decrease alveolar crestal bone strain. Theory, Finite Element Analysis, and Clinical Application. Int. J. Oral Maxillofac. Implants 2014, 29, e265–e271. [Google Scholar] [CrossRef][Green Version]
- Li, T.; Kong, L.; Wang, Y.; Hu, K.; Song, L.; Liu, B.; Li, D.; Shao, J.; Ding, Y. Selection of optimal dental implant diameter and length in type IV bone: A three-dimensional finite element analysis. Int. J. Oral Maxillofac. Surg. 2009, 38, 1077–1083. [Google Scholar] [CrossRef]
- Brånemark, P.-I.; Adell, R.; Breine, U.; Hansson, B.O.; Lindström, J.; Ohlsson, Å. Laboratory ofLaboratory of Experimental Biology, Department of Anatomy, University of Gothenburg and the Department of Plastic Surgery, Sahlgrenska Sjukhuset, Gothenburg, Sweden Intra-osseous anchorage of dental prostheses. I. Experimental studies. Scand. J. Plast. Reconstr. Surg. 1969, 3, 81–100. [Google Scholar] [CrossRef]
- Schroeder, A.; Pohler, O.; Sutter, F. Tissue reaction to an implant of a titanium hollow cylinder with a titanium surface spray layer. SSO Scweiz. Monatsschr. Zahnheilkd. 1976, 8, 713–727. [Google Scholar]
- Cervino, G.; Romeo, U.; Lauritano, F.; Bramant, E.; Fiorillo, L.; D’Amico, C.; Milone, D.; Laino, L.; Campolongo, F.; Rapisarda, S.; et al. FEM and Von Mises Analysis of OSSTEM Dental Implant Structural Comoonents: Evalutation of Different Direction Dynamic Loads. Open Dent. J. 2018, 12, 219–229. [Google Scholar] [CrossRef] [PubMed]
- Abuhussein, H.; Pagni, G.; Rebaudi, A.; Wang, H.L. The effect of thread pattern upon implant osseointegration. Clin. Oral Implants Res. 2010, 21, 129–136. [Google Scholar] [CrossRef] [PubMed]
- Roberts, W.E.; Viecilli, R.F.; Chang, C.; Katona, T.R.; Paydar, N.H. Biology of biomechanics: Finite element analysis of a statically determinate system to rotate the occlusal plane for correction of a skeletal Class III open-bite malocclusion. Am. J. Orthod. Dentofac. Orthop. 2015, 148, 943–955. [Google Scholar] [CrossRef] [PubMed]
- Ueda, N.; Takayama, Y.; Yokoyama, A. Minimization of dental implant diameter and length according to bone quality determined by finite element analysis and optimized calculation. J. Prosthodont. 2016, 379, 324–332. [Google Scholar] [CrossRef]
- Al-Zordk, W.; Ghazy, M.; El-Anwar, M. Stress Analysis Around Reduced-Diameter Zirconia and Titanium One-Piece Implants with and without microthreads in the neck: Experimental and Finite Element Analysis. Int. J. Oral Maxillofac. Implants 2020, 35, 305–312. [Google Scholar] [CrossRef]
- Duyck, J.; Ronald, H.J.; Van Oosterwyck, H.; Naert, I.; Vander Sloten, J.; Ellingsen, J.E. The influence of static an dynamic loading on marginal bone reactions around osseointegrated implants: An animal experimental study. Clin. Oral Implants Res. 2001, 12, 207–218. [Google Scholar] [CrossRef]
- Isidor, F. Loss of osseointegration caused by occlusal load of oral implants. A clinical and radiographic study in monkeys. Clin. Oral Implants Res. 1996, 7, 143–152. [Google Scholar] [CrossRef]
- Can Sivrikaya, E.C.; Omezli, M.M. The Effect of Tapered and Cylindrical Implants on Stress Distribution In Different Bone Qualities: A Finite Element Analysis. Int. J. Oral Maxillofac. Implants 2019, 34, e99–e105. [Google Scholar] [CrossRef]
- Roberts, W.E.; Smith, R.K.; Zilberman, Y.; Mozsary, P.G.; Smith, R.S. Osseous adaption to continuous loading of rigid endosseous implants. Am. J. Orthod. 1984, 86, 95–111. [Google Scholar] [CrossRef]
Disclaimer/Publisher’s Note: The statements, opinions and data contained in all publications are solely those of the individual author(s) and contributor(s) and not of MDPI and/or the editor(s). MDPI and/or the editor(s) disclaim responsibility for any injury to people or property resulting from any ideas, methods, instructions or products referred to in the content. |
© 2023 by the authors. Licensee MDPI, Basel, Switzerland. This article is an open access article distributed under the terms and conditions of the Creative Commons Attribution (CC BY) license (https://creativecommons.org/licenses/by/4.0/).
