Featured Application
This research can be used for environmental monitoring. Satellite images are used to classify different land cover types. This information can help in monitoring changes in land use and land cover, tracking deforestation and forest degradation, and assessing the impacts of climate change.
Abstract
Detecting and classifying objects from satellite images are crucial for many applications, ranging from marine monitoring to land planning, ecology to warfare, etc. Spatial and temporal information-rich satellite images are exploited in a variety of manners to solve many real-world remote sensing problems. Satellite image classification has many associated challenges. These challenges include data availability, the quality of data, the quantity of data, and data distribution. These challenges make the analysis of satellite images more challenging. A convolutional neural network architecture with a scaling method is proposed for the classification of satellite images. The scaling method can evenly scale all dimensions of depth, width, and resolution using a compound coefficient. It can be used as a preliminary task in urban planning, satellite surveillance, monitoring, etc. It can also be helpful in geo-information and maritime monitoring systems. The proposed methodology is based on an end-to-end, scalable satellite image interpretation. It uses spatial information from satellite images to categorize these into four categories. The proposed method gives encouraging and promising results on a challenging dataset with a high inter-class similarity and intra-class variation. The proposed method shows 99.64% accuracy on the RSI-CB256 dataset.
1. Introduction
Earth images collected by satellite are called satellite image sources. These images are also referred to as spaceborne photographs [1]. Satellite companies provide these images for utilization in a variety of application domains.
Satellite images can be helpful in a diverse variety of application areas. Some of the key application domains are meteorology [2,3,4], land planning [5,6,7], academia [8], surveillance [9,10,11], monitoring, agriculture [12,13,14,15], marine studies [16,17,18,19,20], conservation [21,22], geology [23,24], and warfare [25,26,27]. The time-series data of satellite images can be helpful in analyses and long-term planning in various domains. They can be utilized for anomaly detection by observing unusual or unexpected patterns. Satellite images can be presented in a variety of spectra, including visible colors.
Domain experts from different walks of life are interested in analyzing satellite images for various applications. The computer vision community provides services to solve the application-specific analysis of satellite images. However, certain tasks in satellite image analyses are very frequently performed to satisfy application-specific services. Image classification, image interpretation, and object recognition in satellite images are the essential tasks that computer vision experts often employ when dealing with satellite images. Satellite image classification is primarily used for land cover classification, which entails classifying various land cover types, such as forests, croplands, urban areas, and water bodies, from satellite images. Precise land cover classification is crucial for a range of applications, including natural resource management, land use planning, agricultural management, urban planning, environmental impact assessment, and disaster management. It offers valuable insights into land cover changes, ecosystem health monitoring, and sustainable land management practices.
This paper presents a satellite image interpretation method to categorize satellite images into four different areas, i.e., water bodies, green areas, cloudy areas, and deserts. This interpretation can then be utilized for a number of potential applications. The proposed model provides a better accuracy, as well as empirical results verify it. To show the supremacy of the proposed model, it is also compared with some deep learning models. This work introduces an EfficientNet architecture for image classification, which has been demonstrated to be more effective than other commonly used models. This innovative approach not only increases the accuracy of classification but also reduces the computational cost of training the model. By incorporating EfficientNet, the research demonstrates a major advancement in the field of satellite image classification, opening up possibilities for a more precise and efficient analysis of remote sensing data.
The main contributions of the study can be summarized as follows:
- It gives an in-depth analysis of existing techniques for satellite image classification.
- It proposes a scalable deep learning model for the interpretation of satellite images.
- It compares the proposed methodology with state-of-the-art techniques. Visualizations of the feature embeddings of different techniques are also presented.
2. Related Work
Satellite remote sensing technology has enabled the acquisition of high-resolution imagery that can provide a wealth of information about the Earth’s surface. One of the most common applications of satellite imagery is land cover classification, which involves the identification and mapping of different types of land cover, such as forests, urban areas, water bodies, and agricultural fields. Accurate land cover classification is critical for a range of applications, including natural resource management, urban planning, and disaster management. In this literature review, we aim to explore the latest advances in satellite image land cover classification, including the methods and algorithms used, the challenges involved, and the potential for further improvement. Satellite images were once considered the property of research and development giants. However, nowadays, they are becoming increasingly more accessible to research communities working in a variety of domains. Experts in these domains require an automatic interpretation of these satellite images to perform high-level analyses and to support the decision-making process. This is because the manual interpretation of such massive data is not feasible in many scenarios and can lead to inefficient solutions based on these interpretations. So, these domain experts seek support from the computer vision community to provide some solutions for the automatic interpretation and classification of satellite images.
Land cover classification using satellite images can be significant for monitoring, analyses, and planning for the improved utilization of resources. The satellite image interpretation process is dependent upon two basic steps: feature extraction and classification. Traditionally, handcrafted features have been utilized, and then these features are fed to conventional machine learning classifiers [28,29,30,31,32]. Feature extraction in traditional setups has many associated and inherited challenges, affecting the quality of classification [33]. Conventional machine learning methods, such as decision trees, support vector machines (SVMs), and random forests, have been widely used for land cover classification [31]. These methods require manual feature engineering, where domain experts must carefully choose a set of relevant features to represent the data. The accomplishment of these techniques greatly relies on the quality of the selected features. Conventional machine learning methods can achieve a good accuracy for simple classification tasks, but they may struggle when dealing with complex and high-dimensional challenging data, such as satellite images.
In the recent past, these challenges have been well dealt with due to the dawn of deep learning approaches. Deep learning has provided solutions to many challenging problems [34]. Handcrafted feature extraction has been replaced with automatic feature extraction. This approach has demonstrated its robustness in a variety of computer vision problems [31]. Satellite images are no exception, and researchers have employed deep learning approaches to provide satellite image classification, object detection, change detection, shoreline and landslide detection, etc. [33,34,35,36,37,38,39,40,41,42,43]. These approaches greatly depend on the amount of data and the distribution of data.
Mehran et al. [44] employed CNNs for ship detection in satellite images, with state-of-the-art models, such as Inception-Resnet, pre-trained on the Image-Net dataset, showing a high accuracy of over 99%. Li et al. used Dataset-RSI-CB256 to analyze the interpretation of weak labeling on satellite image classification and interpretation [45]. They employed deep learning and adapted the dataset for this analysis. Gargees et al. worked on change detection using Satellite Image Classification Dataset-RSI-CB256 [46]. They utilized the deep visual features of these satellite images to analyze changes in the landscape. Kwak et al. [47] presented a semi-supervised land cover classification of remote sensing imagery using CycleGAN and EfficientNet. The related work is summarized in Table 1. Satellite image classification for land cover using traditional methods involves manual feature engineering and conventional machine learning classifiers. However, these methods may struggle with complex and high-dimensional data. To address this, deep learning approaches, such as CNNs, have been utilized and have shown robustness in various computer vision problems, including satellite image classification. Inception-Resnet, a state-of-the-art model, has demonstrated a high accuracy of over 99% for ship detection in satellite images. Other studies have also employed deep learning techniques for analyzing weak labeling, change detection, and land cover classification using satellite images. The use of EfficientNet further enhances the potential of the proposed methodology for accurate and efficient satellite image classification. The presented methodology achieves encouraging results on a challenging dataset with a high inter-class similarity and intra-class variation.

Table 1.
Summary of Existing Methodologies.
3. Materials and Methods
3.1. Data Description
Satellite Image Classification Dataset-RSI-CB256 is used for this research. This is a publicly available dataset and can be found in [48]. Figure 1 shows sample images of this dataset. This dataset comprises four distinct classes acquired from sensors and Google map snapshots. The size of each image is 256 × 256. Figure 2 shows the category spread of the data. It also shows the dataset’s inter-class similarities and intra-class variational challenge through t-distributed stochastic neighbor embedding (T-SNE) visualization. T-SNE visualization allows for the mapping of higher-dimensional data points to two- or three-dimensional spaces. T-SNE preserves the pairwise similarities between the high-dimensional data points as much as possible in the lower-dimensional space. In other words, the data points that are related in the high-dimensional space will be near each other in the low-dimensional space, while the data points that are disparate in the high-dimensional space will be apportioned in the low-dimensional space. Visualization shows the challenging gravity of a dataset.
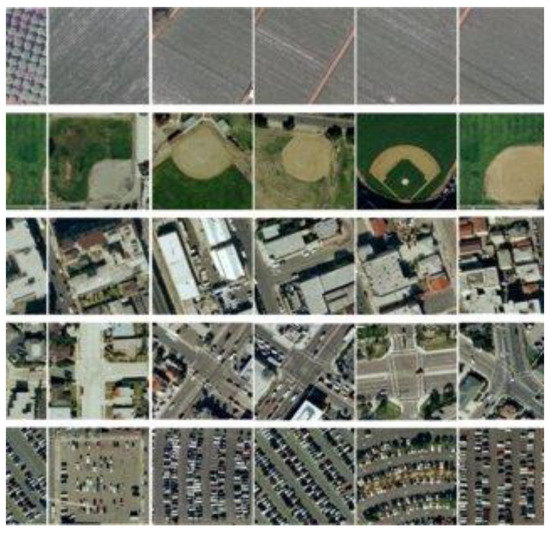
Figure 1.
Samples of satellite images from Dataset-RSI-CB256.
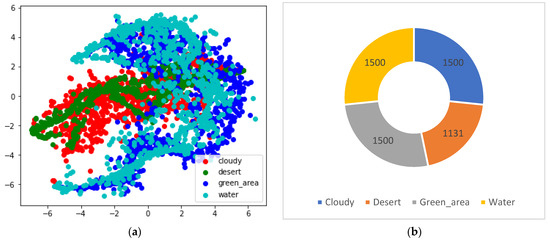
Figure 2.
Dataset visualizations: (a) T-SNE visualization; (b) doughnut chart for category distribution.
3.2. Proposed Methodology
This research aims to classify satellite images into different categories. The proposed methodology takes the satellite image as input and categorizes it into four different classes of terrains. Pre-processing is first applied to the input images, then a feature map is extracted, and, finally, the images are classified. A complete architectural diagram is presented in Figure 3.
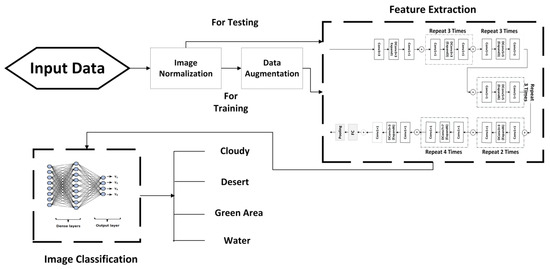
Figure 3.
Architectural diagram of the proposed methodology.
3.2.1. Image Normalization
Before entering the feature extraction phase, the images are normalized. Input image is mapped to a 3-dimensional space with dimensions, where characterizes the number of rows, is the number of columns in image , and C is the number of channels of the input image. Mapping function ʨ is applied to input image . Mapping function is defined as
, , , and range between all the values of and .
Normalization is a frequent pre-processing step in computer vision tasks to standardize the pixel values of images, which can help enhance the performance and convergence of machine learning models.
3.2.2. Data Augmentation
Data scarcity is a major concern in deep learning solutions. Data augmentation is a powerful technique that can help to improve the accuracy and generalization of machine learning models, especially when the size of the training dataset is limited. Data augmentation can improve the performance of a machine learning model by providing it with a more diverse range of training data. It also helps to reduce overfitting by introducing variations in the training data, which makes the model more robust and generalizable. Data augmentation is used to minimize the aforementioned issue, where and
rotates an image by an angle θ, shifts an image horizontally by s pixels, shifts an image vertically by t pixels, shears an image horizontally by a factor of u, zooms an image by a factor of v, flips an image horizontally, flips an image vertically, and changes the brightness of an image by multiplying each pixel by a factor of y. By using these data augmentation techniques, the machine learning model is exposed to more variations in the data, which can help it to generalize better to new and unseen data.
3.2.3. Feature Extraction
EfficientNets are a kind of convolutional neural network that works on the principle of scaling [49]. EfficientNets are used as feature extractors in the presented research. The EfficientNet architecture consists of three components: the stem, the blocks, and the head. The stem is the initial part of the network that processes the input image, while the blocks are repeated units of convolutional layers that learn increasingly complex features. The head is the final part of the network that maps the learned features to the output classes. They are designed to provide state-of-the-art performance in image classification tasks while being computationally efficient. These adjust the architecture’s width, resolution, and depth with compound coefficients . This scaling is very effective, as larger input images require more complicated architectures to compute results with more channels and layers to analyze fine-grained patterns. Compound coefficients evenly adjust the width , resolution , and depth of the underlying architecture, where
is the input taken from the user, and specifies the correlation with the network width, resolution, and depth. The value of ϕ affects the width, depth, and resolution of the network. When ϕ is greater than 1, the network size increases, leading to a wider, deeper, and higher resolution. Conversely, when ϕ is less than 1, the network size decreases, resulting in a narrower, shallower, and lower resolution. The values of ϕ used in this research for EfficientNet B4–B7 are 1.8, 2.0, 2.2, and 2.4, respectively. can be computed through a minor grid search. A minor grid search is a process of finding the optimal values for the coefficients , and so that the constraint is satisfied. This constraint ensures that the computational cost of the model remains roughly constant as these coefficients are adjusted. The equations involving the coefficients adjust the architecture’s width, resolution, and depth. Specifically, is the depth, is the width, and is the resolution. The equations show that is raised to the power of these values to adjust them.
EfficientNet proposes better and more accurate results via the compound scaling of these three network parameters. However, this will slightly increase the floating-point operations per second (FLOPS) by . However, , so FLOPS are increased approximately by only [49]. are fixed, and the compound coefficient value is adjusted for B0 to obtain architectures B1–B7. Compound scaling can be visualized in Figure 4.
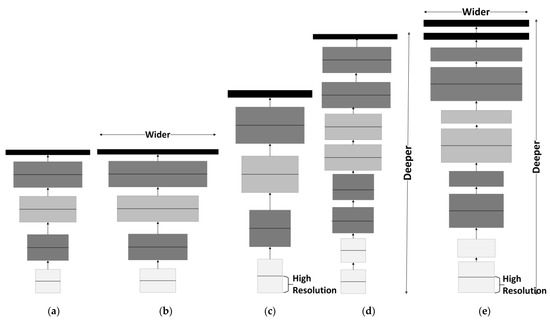
Figure 4.
Scalable deep learning model: (a) base architecture; (b) width scaling; (c) resolution scaling; (d) depth scaling; (e) compound scaling (adapted from [49]).
The base EfficientNet B0 is mainly created on the idea of the residual blocks of MobileNet. It also includes squeeze and excitation blocks. The base EfficientNet is inspired by MnasNet and presented in Figure 5. This architecture uses reinforcement learning to minimize the computational cost of the architecture and to find Pareto-optimal solutions. The architecture includes a plus sign (+) to signify a residual or skip connection between the input and output of a block. DConv is a convolution technique that applies a single filter to each input channel independently, followed by a pointwise convolution (PWConv) that combines the output channels using a 1 × 1 filter. The expansion layer increases the number of channels in the input feature maps before the depthwise separable convolution is applied, allowing for the capture of more intricate and varied features from the input image. The expansion factor is a hyperparameter that determines the channel count of the expansion layer in each building block. This layer increases the number of channels in the input feature maps before the depthwise convolution is applied, resulting in a higher channel count in the output feature maps. In the proposed architecture, a ReLU activation is used in the PWConv layer, which is the first step in each building block. This PWConv layer applies a 1 × 1 convolution operation to the input feature maps, followed by the ReLU activation function, which operates element-wise and sets negative values to zero while keeping positive values unchanged. Meanwhile, a Swish activation is used in the DConv layer, which is the second step in each building block. The DConv layer applies a depthwise convolution operation to the feature maps, followed by the Swish activation function, a smooth and differentiable function that computes a weighted combination of the input and its sigmoid activation.
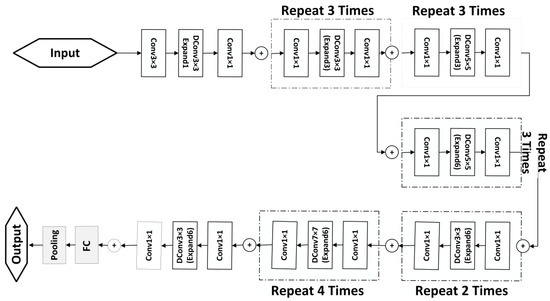
Figure 5.
Feature extraction using EfficientNet.
MnasNet is an efficient neural network architecture designed to be versatile and optimized for efficiency. However, there are opportunities for further improvement in accuracy through modifications to the architecture. MnasNet employs SGD as the optimizer. Utilizing more sophisticated optimization techniques, such as Adam, could potentially accelerate convergence and boost the model’s precision. MnasNet employs a mixture of 3 × 3 and 5 × 5 convolutional filters to process input data. Nevertheless, employing larger filters, such as 7 × 7, could capture more spatial features from the input images and result in improved accuracy. EfficientNets (B4–B7) are developed using the defined architectures and compound scaling technique outlined in [49]. This approach allowed us to develop highly efficient models with superior performance.
3.2.4. Classification
The EfficientNet feature extraction network is concatenated with a flattened layer of hundreds of neurons with the ReLU activation. Finally, a SoftMax layer is attached for the classification of satellite images. The ReLU and softmax activations can be defined as follows:
4. Results
Satellite Image Classification Dataset-RSI-CB256 is used for this research. The batch size for experiments is 32. The input size of the proposed network is 600 × 600 px. The image samples are resized to fit in the model. Our approach involves utilizing the RMSProp optimizer, which has a decay rate of 0.9 and a momentum of 0.9. Additionally, we incorporate batch normalization after each convolution layer with a momentum of 0.99, and we apply a weight decay of 1 × 10⁻⁵. To prevent overfitting, we implement a dropout rate of 0.2 on the final layer. As suggested by [49], we gradually increase the learning rate from 0 to 0.256 during the first 5 epochs, and we subsequently decrease it by a factor of 0.97 every 2.4 epochs. Splits of 80%, 10%, and 10% are used for training, validation, and testing. The sample selection for training and validation remains the same for all experiments. A validation set is utilized for an early stopping process.
4.1. Evaluation Metric
Different evaluation metrics are used for the analysis of the results. These evaluation metrics include accuracy , recall , precision , the F1 measure , Cohen’s kappa , and area under curve (AUC). These are all common evaluation metrics used in the context of multi-class classification tasks.
Accuracy measures the fraction of correctly predicted instances among all instances. In multi-class classification, we can calculate the overall accuracy by summing up the number of correct predictions for all classes and dividing it by the total number of instances.
Recall measures the fraction of accurately projected positive occurrences among all genuine positive occurrences. In multi-class classification, we can calculate the recall for each class by treating that class as the true class and all other classes as false values.
Precision measures the fraction of accurately anticipated positive occurrences among all projected positive cases.
The F1 score is the harmonic mean of precision and recall. It is a way to combine both precision and recall into a single metric that is useful when we want to balance the importance of correctly predicting both positive and negative instances.
where TP = true positive, TN = true negative, FP = false positive, and FN = false negative.
Cohen’s kappa is a measure of inter-rater agreement between two annotators. In the context of multi-class classification, we can treat the predicted labels and the true labels as two annotators and calculate their agreement using Cohen’s kappa.
where is the probability of agreement, and is the probability of random agreement.
4.2. Experimental Results
The proposed methodology is tested on the RSI-CB256 dataset. The results of other popular architectures are also reported using the same dataset. Table 2 shows the detailed results of different architectures on the aforementioned dataset. EfficientNets in general, and EfficientNet-B7 in particular, has the ability to classify the satellite image data. EfficientNet B7 reports the highest accuracy amongst all architectures. However, it is important to note that accuracy alone may not be the best metric for evaluating the performance of a machine learning model, especially in cases where the classes are imbalanced or there are multiple classes. Looking at the evaluation metrics, it appears that EfficientNet B6 and B7 perform very well across all metrics, with high values for accuracy, precision, recall, F1 score, Cohen’s kappa, and ROC AUC. This indicates that these models are able to effectively classify the input images and maintain high levels of consistency in their predictions. The EfficientNet models are also compared with the ResNet-50 [50], Inception V3 [51], and MobileNet [52] models. ResNet also performs very well, with high values for precision, recall, F1 score, and Cohen’s kappa, as well as a perfect ROC AUC score. This suggests that ResNet is able to correctly classify both positive and negative instances with a high accuracy, and it is also able to balance precision and recall well. Inception V3 and MobileNet show slightly lower scores than ResNet and the EfficientNet models. An important observation is that Inception V3 exhibits the lowest Cohen’s kappa score among the compared models, suggesting that it may exhibit a greater variability in its predictions than the other models, potentially indicating less consistency in its performance.
Table 2.
Interpretation results for different architectures.
Figure 6 shows the confusion matrix for all the methodologies. A confusion matrix is also known as an error matrix. It shows the statistical classification results of the proposed methodology. The horizontal strips correspond to the actual classes, while the vertical pillars showcase the predicted classes. The confusion matrix of EfficientNet shows that most images are classified accurately with fewer classification errors. The EfficientNet B7 model correctly predicts all 150 instances of the “Cloudy” class (TP = 150, FP = 0, and FN = 0), all 114 instances of the “Desert” class (TP = 114, FP = 0, and FN = 0), and all 150 instances of the “Green_area” class (TP = 150, FP = 0, and FN = 0), resulting in a perfect precision and recall for these classes. The model incorrectly predicts 1 instance of the “Water” class as “Cloudy” and 1 instance as “Green_area” (TP = 148, FP = 1, and FN = 1), resulting in a slightly lower precision and recall for this class. ResNet also performs well with most of the images.
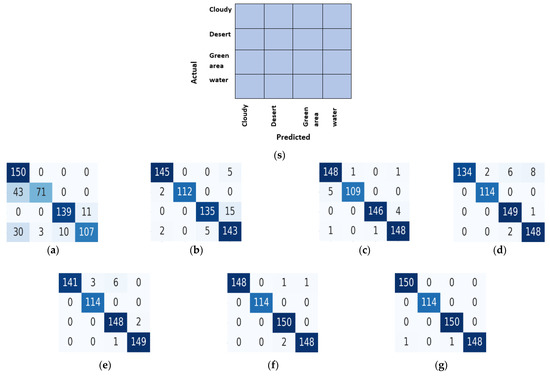
Figure 6.
Confusion matrix: (s) reference labeled matrix; (a) Inception Net; (b) MobileNet; (c) ResNet; (d–g) EfficientNet B4–B7.
Figure 7 shows the feature embedding in the 2-D mapping of all the architectures. T--SNE is used for the visualization of the embeddings. T-SNE is capable of visualizing trends in data in spaces of lower dimensions. T-SNE is a dimensionality reduction technique commonly used for visualizing high-dimensional data. It is particularly useful for visualizing feature vectors because it can reveal the underlying structure of the data in a lower-dimensional space. The basic idea of T-SNE is to transform high-dimensional feature vectors into a low-dimensional space (typically 2D or 3D) while preserving the pairwise similarities between the data points as much as possible. It does this by defining a probability distribution over pairs of high-dimensional points and a similar probability distribution over pairs of corresponding low-dimensional points. The algorithm then tries to minimize the difference between these two distributions using gradient descent. One of the key advantages of T-SNE is that it can reveal non-linear relationships in the data that may not be apparent using other methods. For example, it can help to distinguish between clusters of similar data points, even if those clusters overlap in high-dimensional space. The comparison shown in Figure 7 is evident of the fact that EfficientNets provide better feature embeddings than other methods, forming obvious clusters for different classes. EfficientNet has better feature embeddings due to its ability to cluster data points of similar classes together while keeping them distinct from other classes. Compared to other embeddings, the clusters of different classes are well-separated, showing that the model has learned to differentiate between classes effectively. Other models, however, have more overlapping clusters, indicating that they have difficulty distinguishing between different classes.
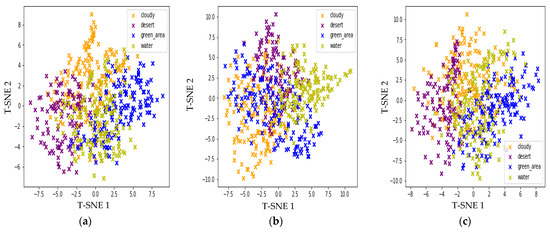
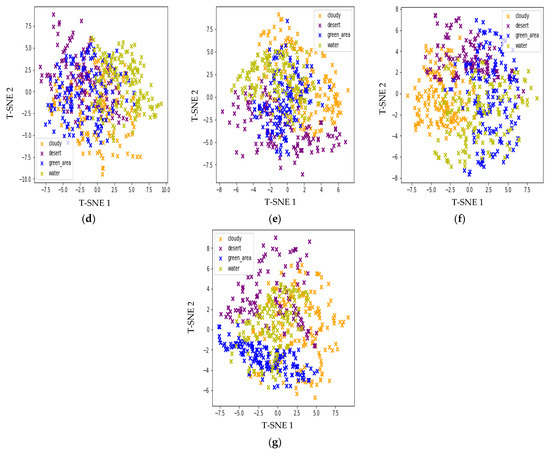
Figure 7.
Feature embeddings: (a) Inception Net; (b) MobileNet; (c) ResNet; (d–g) EfficientNet B4–B7.
Loss–accuracy curves for training and validation are presented in Figure 8. Variation in a number of epochs results in an early stopping feature. Analyzing the loss–accuracy curves of various architectures can offer valuable insights into their training dynamics, convergence rates, and generalization performance. This understanding is crucial for identifying their strengths and weaknesses. The loss–accuracy curves of Inception Net and MobileNet indicate that the model achieves a high accuracy early on in the training process, but the loss continues to fluctuate. However, the loss–accuracy curve of ResNet shows a rapid initial decrease in loss with corresponding accuracy improvements. This suggests that ResNet benefits from its deep residual connections and converges quickly during training. The loss–accuracy curves of EfficientNet B4-B7 exhibit similar trends to those of ResNet, but with potentially even faster convergence and a higher accuracy due to their efficient architecture and advanced scaling methods. The stated results characterize the top accuracy assessments attained with each network configuration.
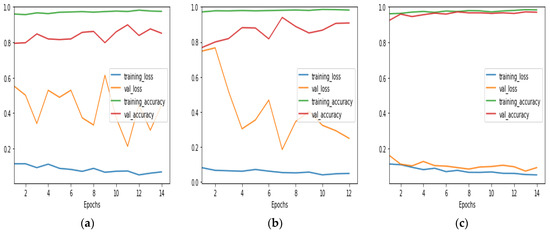
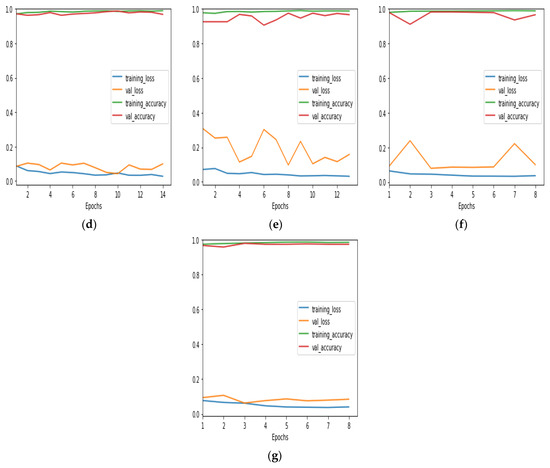
Figure 8.
Loss–accuracy curves for training and validation: (a) Inception Net; (b) MobileNet; (c) ResNet; (d–g) EfficientNet B4–B7.
5. Discussion
The proposed methodology presents the automated interpretation of satellite images. Manual interpretation can be very laborious work. Furthermore, domain expertise is required for the accomplishment of such a task. The proposed solution can classify the images into four different classes. Different state-of-the-art techniques are employed for the said problem. It is evident from the results that EfficientNet B7 provides the best results.
Deep learning is a sub-field of machine learning capable of representing and analyzing data at different abstraction levels. It has achieved very astonishing results in the field of satellite imaging and geoscience. This research experiments with various deep learning models for satellite image interpretation and classification. These models include Inception V3, ResNet, MobileNet, EfficientNet B4, EfficientNet B5, EfficientNet B6, and EfficientNet B7. EfficientNet B7 gives the highest accuracy, F1 score, and ROC AUC. ResNet, a non-scalable network, also gives very promising results. In comparison, Inception Network was unable to give very encouraging results. Inception Network distributes feature extraction processing between scaling and merging, while ResNet provides uni-scale processing and pass-through connections. Inception, ResNet, and MobileNet are convolution-based neural networks that serve for the feature extraction and classification of images. Inception Networks can provide cost-effective solutions for larger data. In contrast to Inception Network, ResNet focuses on delivering a good accuracy.
In some cases, deeper neural networks can face difficulties due to vanishing or exploding gradients, overfitting, and computational complexity. When dealing with limited or noisy data, very deep networks may struggle to learn meaningful representations and require significant computational resources for training. Furthermore, deeper networks may be more prone to overfitting, particularly when the dataset is small or the model is overly complex. Therefore, it is crucial to carefully weigh the trade-offs between depth and performance when designing neural networks for specific tasks and datasets. ResNet can deal better with vanishing gradient problems. This is because it facilitates the smooth flow of gradients through complex neural networks, thereby enabling the training of deeper networks and enhancing convergence properties. MobileNet also gives acceptable results with a 0.949 accuracy, a 0.951 F1 score, and a 0.997 AUC value. MobileNets use depthwise separable convolutions that help in creating lighter networks with fewer resource requirements. MobileNets use regular convolutions for the first layer but use separable convolutions for the rest of the layers.
EfficientNets employ the compound scaling behavior. It provides width, depth, and resolution scalability. A wider net applies more feature maps during the convolution process; deeper networks can employ more layers, while high-resolution processing means feature maps with higher spatial dimensions. Apart from salability, EfficientNet has 3.8× fewer parameters and FLOPs than ResNet. EfficientNet B7 outperforms all the other architectures in the test results by giving a 0.996 accuracy, a 0.997 F1 measure, a 0.995 Cohen’s kappa score, and an ROC AUC value of 0.999. The feature embeddings also show that EfficientNets have the most separable embeddings, with less overlapping areas.
6. Conclusions
Satellite image analyses have a variety of potential applications [28,32,34,53]. Satellite images present many additional challenges as compared with ordinary digital images. This paper presents an end-to-end deep-learning-based satellite image categorization method. The proposed method relies on visual clues from the spatial information of satellite images. Satellite Image Classification Dataset-RSI-CB256 is employed for experiments. The dataset has high intra-class and low inter-class variations. This makes the analysis of satellite images even more challenging. However, the proposed method shows encouraging results.
The proposed model applies scalable networks for feature extraction. EfficientNets are a type of convolutional neural network that specializes in image classification tasks while being designed to be computationally efficient. The network is composed of three main parts: the stem, blocks, and head. The network’s width, resolution, and depth can be adjusted using compound coefficients. The input parameter ϕ determines the size of the network, with a larger ϕ resulting in wider, deeper, and higher-resolution networks. EfficientNet B0 is built on residual blocks from MobileNet and includes squeeze and excitation blocks. Additionally, it utilizes the DConv and PWConv techniques for convolution and a ReLU activation in the PWConv layer.
The proposed model is compared with many popular deep learning models, such as Inception V3, ResNet-50, and MobileNet. The experimental results testify to the proposed methodology’s dominance. The proposed methodology gives a 0.997 F1 score, the highest among all the models studied.
The presented study can be extended by applying it to different datasets. It can also be tested for more than four classes of satellite images. Moreover, other deep learning models can also be analyzed. It can also be a good research direction to see the effect of different backbone models in EfficientNets.
Multi-resolution remote sensing image samples can also be employed for image classification. There is a growing volume of multi-resolution image data. A multi-resolution methodology exploiting the advantage of such a substantial amount of data would be useful.
Author Contributions
Data curation, S.T. and S.K.; Formal analysis, A.J. and D.K.A.; Funding acquisition, D.K.A.; Methodology, S.K.; Project administration, S.T.; Supervision, M.H.; Writing—original draft, S.T. and S.K.; Writing—review and editing, A.J. and M.H. All authors have read and agreed to the published version of the manuscript.
Funding
This research received no external funding.
Institutional Review Board Statement
Not applicable for studies not involving humans or animals.
Informed Consent Statement
Not applicable.
Data Availability Statement
No new data were created or analyzed in this study. Data sharing is not applicable to this article.
Conflicts of Interest
The authors declare no conflict of interest.
References
- Voigt, S.; Kemper, T.; Riedlinger, T.; Kiefl, R.; Scholte, K.; Mehl, H. Satellite image analysis for disaster and crisis-management support. IEEE Trans. Geosci. Remote Sens. 2007, 45, 1520–1528. [Google Scholar] [CrossRef]
- Nguyen, T.M.; Lin, T.H.; Chan, H.P. The environmental effects of urban development in Hanoi, Vietnam from satellite and meteorological observations from 1999–2016. Sustainability 2019, 11, 1768. [Google Scholar] [CrossRef]
- Fu, H.; Shen, Y.; Liu, J.; He, G.; Chen, J.; Liu, P.; Qian, J. Cloud detection for FY meteorology satellite based on ensemble thresholds and random forests approach. Remote Sens. 2018, 11, 44. [Google Scholar] [CrossRef]
- Singh, K.K.; Singh, D.K.; Thakur, N.K.; Dewali, S.K.; Negi, H.S.; Snehmani; Mishra, V.D. Detection and mapping of snow avalanche debris from western Himalaya, India using remote sensing satellite images. Geocarto Int. 2022, 37, 2561–2579. [Google Scholar] [CrossRef]
- Padmanaban, R.; Bhowmik, A.K.; Cabral, P. Satellite image fusion to detect changing surface permeability and emerging urban heat islands in a fast-growing city. PLoS ONE 2019, 14, e0208949. [Google Scholar] [CrossRef]
- Khryaschev, V.; Ivanovsky, L. Urban areas analysis using satellite image segmentation and deep neural network. In E3S Web of Conferences; EDP Sciences: Les Ulis, France, 2019; Volume 135, p. 01064. [Google Scholar]
- Tripodi, S.; Girard, N.; Fonteix, G.; Duan, L.; Mapurisa, W.; Leras, M.; Trastour, F.; Tarabalka, Y.; Laurore, L. Brightearth: Pipeline for on-the-fly 3D reconstruction of urban and rural scenes from one satellite image, ISPRS Annals of the Photogrammetry. Remote Sens. Spat. Inf. Sci. 2022, 3, 263–270. [Google Scholar]
- Dziob, D.; Krupiński, M.; Woźniak, E.; Gabryszewski, R. Interdisciplinary teaching using satellite images as a way to introduce remote sensing in secondary school. Remote Sens. 2020, 12, 2868. [Google Scholar] [CrossRef]
- Voronin, V.; Gapon, N.; Zhdanova, M.; Semenishchev, E.; Cen, Y.; Zelensky, A. Missing area reconstruction in 3D scene from multi-view satellite images for surveillance applications. Count. Crime Fight. Forensics Surveill. Technol. 2020, 11542, 151–157. [Google Scholar]
- Soldi, G.; Gaglione, D.; Forti, N.; Simone, A.D.; Daffinà, F.C.; Bottini, G.; Quattrociocchi, D.; Millefiori, L.M.; Braca, P.; Carniel, S. Space-based global maritime surveillance. IEEE Aerosp. Electron. Syst. Mag. 2021, 36, 8–28. [Google Scholar] [CrossRef]
- Melillos, G.; Themistocleous, K.; Danezis, C.; Michaelides, S.; Hadjimitsis, D.G.; Jacobsen, S.; Tings, B. The use of remote sensing for maritime surveillance for security and safety in Cyprus. Detect. Sens. Mines Explos. Objects Obs. Targets 2020, 11418, 141–152. [Google Scholar]
- Phinn, S.R.; Kovacs, E.M.; Roelfsema, C.M.; Canto, R.F.; Collier, C.J.; McKenzie, L.J. Assessing the potential for satellite image monitoring of seagrass thermal dynamics: For inter-and shallow sub-tidal seagrasses in the inshore great barrier reef world heritage area, Australia. Int. J. Digit. Earth 2018, 11, 803–824. [Google Scholar] [CrossRef]
- Dehkordi, R.H.; Pelgrum, H.; Meersmans, J. High spatio-temporal monitoring of century-old biochar effects on evapotranspiration through the etlook model: A case study with uav and satellite image fusion based on additive wavelet transform. GIScience Remote Sens. 2022, 59, 111–141. [Google Scholar] [CrossRef]
- Löw, F.; Biradar, C.; Dubovyk, O.; Fliemann, E.; Akramkhanov, A.; Narvaez Vallejo, A.; Waldner, F. Regional-scale monitoring of cropland intensity and productivity with multi-source satellite image time series. GIScience Remote Sens. 2018; 55, 539–567. [Google Scholar]
- Klimetzek, D.; Stăncioiu, P.T.; Paraschiv, M.; Ni, M.D. Ecological monitoring with spy satellite images—The case of red wood ants in Romania. Remote Sens. 2021, 13, 520. [Google Scholar] [CrossRef]
- Sasaki, K.; Sekine, T.; Burtz, L.J.; Emery, W.J. Coastal marine debris detection and density mapping with very high resolution satellite imagery. IEEE J. Sel. Top. Appl. Earth Obs. Remote Sens. 2022, 15, 6391–6401. [Google Scholar] [CrossRef]
- Pichugin, M.K.; Gurvich, I.A.; Zabolotskikh, E.V. Severe marine weather systems during freeze-up in the chukchi sea: Cold-air outbreak and mesocyclone case studies from satellite multisensor measurements and reanalysis datasets. IEEE J. Sel. Top. Appl. Earth Obs. Remote Sens. 2019, 12, 3208–3218. [Google Scholar] [CrossRef]
- Kokal, A.T.; Olgun, N.; Musaoğlu, N. Detection of mucilage phenomenon in the sea of marmara by using multi-scale satellite data. Environ. Monit. Assess. 2022, 194, 585. [Google Scholar] [CrossRef]
- Fingas, M. Remote Sensing for Marine Management, in World Seas: An Environmental Evaluation, 2nd ed.; Academic Press: Cambridge, AS, USA, 2019; Volume 3, pp. 103–119. [Google Scholar]
- Gaur, P. Satellite image bathymetry and rov data processing for estimating shallow water depth in andaman region, India. In Proceedings of the 81st EAGE Conference and Exhibition, London, UK, 3–6 June 2019; pp. 1–5. [Google Scholar]
- Adjognon, G.S.; Ballesteros, A.R.; Soest, D.V. Satellite-based tree cover mapping for forest conservation in the drylands of sub saharan Africa: Application to burkina faso gazetted forests. Dev. Eng. 2019, 4, 100039. [Google Scholar] [CrossRef]
- Bendini, D.H.N.; Fonseca, L.M.G.; Schwieder, M.; Körting, T.S.; Rufin, P.; Sanches, I.D.A.; Leitão, P.J.; Hostert, P. Detailed agricultural land classification in the brazilian cerrado based on phenological information from dense satellite image time series. Int. J. Appl. Earth Obs. Geoinf. 2019, 82, 101872. [Google Scholar]
- Gallo, B.C.; Demattê, J.A.; Rizzo, R.; Safanelli, J.L.; Mendes, W.D.S.; Lepsch, I.F.; Sato, M.V.; Romero, D.J.; Lacerda, M.P.C. Multi-temporal satellite images on topsoil attribute quantification and the relationship with soil classes and geology. Remote Sens. 2018, 10, 1571. [Google Scholar]
- Rezaei, A.; Hassani, H.; Moarefvand, P.; Golmohammadi, A. Lithological mapping in sangan region in northeast Iran using aster satellite data and image processing methods. Geol. Ecol. Landsc. 2020, 4, 59–70. [Google Scholar] [CrossRef]
- Anggiratih, E.; Putra, A.E. Ship identification on satellite image using convolutional neural network and random forest, Indonesian. J. Comput. Cybern. Syst. 2019, 13, 117–126. [Google Scholar]
- Bulushi, S.A. From the sky to the streets, and back: Geographies of imperial warfare in east Africa. Soc. Text 2022, 40, 37–59. [Google Scholar] [CrossRef]
- Lap, Q.K.; Luong, V.N.; Hong, X.T.; Tu, T.T.; Thanh, K.T.P. Evaluation of mangrove rehabilitation after being destroyed by chemical warfare using remote sensing technology: A case study in can gio mangrove forest in mekong delta, southern Vietnam. Appl. Ecol. Environ. Res. 2021, 19, 3897–3930. [Google Scholar] [CrossRef]
- Abedi, R.; EslamBonyad, A. Estimation and mapping forest attributes using k-nearest neighbor method on irs-p6 liss-3 satellite image data. Ecol. Balk. 2015, 7, 93–102. [Google Scholar]
- Jog, S.M.; Dixit, M.; Rajgopalan, A.; Ranade, S.D. Knn and svm based satellite image classification. Int. J. Innov. Res. Electr. Electron. Instrum. Control Eng. 2016, 4, 158–162. [Google Scholar]
- Sabanci, M.K.; Ünlerşen, F.; Polat, K. Classification of different forest types with machine learning algorithms. Res. Rural. Dev. 2016, 1, 254–260. [Google Scholar]
- Cheng, G.; Han, J.; Lu, X. Remote sensing image scene classification: Benchmark and state of the art. Proc. IEEE 2017, 105, 1865–1883. [Google Scholar] [CrossRef]
- Kundra, H.; Sadawarti, H. Hybrid algorithm of cuckoo search and particle swarm optimization for natural terrain feature extraction. Res. J. Inf. Technol. 2015, 7, 58–69. [Google Scholar] [CrossRef]
- Alkhelaiwi, M.; Boulila, W.; Ahmad, J.; Koubaa, A.; Driss, M. An efficient approach based on privacy-preserving deep learning for satellite image classification. Remote Sens. 2021, 13, 2221. [Google Scholar] [CrossRef]
- Pan, Z.; Xu, J.; Guo, Y.; Hu, Y.; Wang, G. Deep learning segmentation and classification for urban village using a worldview satellite image based on u-net. Remote Sens. 2020, 12, 1574. [Google Scholar] [CrossRef]
- Lunga, D.; Gerrand, J.; Yang, L.; Layton, C.; Stewart, R. Apache spark accelerated deep learning inference for large scale satellite image analytics. IEEE J. Sel. Top. Appl. Earth Obs. Remote Sens. 2020, 13, 271–283. [Google Scholar] [CrossRef]
- Kalinicheva, E.; Ienco, D.; Sublime, J.; Trocan, M. Unsupervised change detection analysis in satellite image time series using deep learning combined with graph-based approaches. IEEE J. Sel. Top. Appl. Earth Obs. Remote Sens. 2020, 13, 1450–1466. [Google Scholar] [CrossRef]
- Aung, H.T.; Pha, S.H.; Takeuchi, W. Building footprint extraction in Yangon city from monocular optical satellite image using deep learning. Geocarto Int. 2022, 37, 792–812. [Google Scholar] [CrossRef]
- Cheng, G.; Yang, C.; Yao, X.; Guo, L.; Han, J. When deep learning meets metric learning: Remote sensing image scene classification via learning discriminative CNNs. IEEE Trans. Geosci. Remote Sens. 2018, 56, 2811–2821. [Google Scholar] [CrossRef]
- Hamida, A.B.; Benoit, A.; Lambert, P.; Amar, C.B. 3-D deep learning approach for remote sensing image classification. IEEE Trans. Geosci. Remote Sens. 2018, 56, 4420–4434. [Google Scholar] [CrossRef]
- McAllister, E.; Payo, A.; Novellino, A.; Dolphin, T.; Medina-Lopez, E. Multispectral satellite imagery and machine learning for the extraction of shoreline indicators. Coast. Eng. 2022, 174, 104102. [Google Scholar] [CrossRef]
- Thakur, R.; Manekar, V.L. Artificial intelligence-based image classification techniques for hydrologic applications. Appl. Artif. Intell. 2022, 36, 2014185. [Google Scholar] [CrossRef]
- Özbay, E.; Yıldırım, M. Classification of satellite images for ecology management using deep features obtained from convolutional neural network models. Iran J. Comput. Sci. 2023. [Google Scholar] [CrossRef]
- Sharma, A.; Sharma, K.K. A Review on Satellite Image Processing for Landslides Detection. In Artificial Intelligence and Machine Learning in Satellite Data Processing and Services, Proceedings of the International Conference on Small Satellites, ICSS 2022, Punjab, India, 29–30 April 2022; Springer Nature: Singapore, 2023; pp. 123–129. [Google Scholar]
- Mehran, A.; Tehsin, S.; Hamza, M. An effective deep learning model for ship detection from satellite images. Spat. Inf. Res. 2023, 31, 61–72. [Google Scholar] [CrossRef]
- Li, Y.; Zhang, Y.; Zhu, Z. Learning deep networks under noisy labels for remote sensing image scene classification. In Proceedings of the IGARSS, Yokohama, Japan, 28 July–2 August 2019; pp. 3025–3028. [Google Scholar]
- Gargees, R.S.; Scott, G.J. Large-scale, multiple level-of-detail change detection from remote sensing imagery using deep visual feature clustering. Remote Sens. 2021, 13, 1661. [Google Scholar] [CrossRef]
- Kwak, T.; Kim, Y. Semi-Supervised Land Cover Classification of Remote Sensing Imagery Using CycleGAN and EfficientNet. KSCE J. Civ. Eng. 2023, 27, 1760–1773. [Google Scholar] [CrossRef]
- Available online: https://www.kaggle.com/datasets/mahmoudreda55/satellite-image-classification (accessed on 20 October 2022).
- Tan, M.; Le, Q. Efficientnet: Rethinking model scaling for convolutional neural networks. In Proceedings of the International Conference on Machine Learning, Long Beach, CA, USA, 9–15 June 2019; pp. 6105–6114. [Google Scholar]
- He, K.; Zhang, X.; Ren, S.; Sun, J. Identity mappings in deep residual networks. In Computer Vision–ECCV 2016 Part IV 14, Proceedings of the 14th European Conference, Amsterdam, The Netherlands, 11–14 October 2016; Springer International Publishing: Berlin/Heidelberg, Germany, 2016; pp. 630–645. [Google Scholar]
- Szegedy, C.; Vanhoucke, V.; Ioffe, S.; Shlens, J.; Wojna, Z. Rethinking the inception architecture for computer vision. In Proceedings of the IEEE Conference on Computer Vision and Pattern Recognition, Las Vegas, NV, USA, 27–30 June 2016; pp. 2818–2826. [Google Scholar]
- Sandler, M.; Howard, A.; Zhu, M.; Zhmoginov, A.; Chen, L.C. Mobilenetv2: Inverted residuals and linear bottlenecks. In Proceedings of the IEEE Conference on Computer Vision and Pattern Recognition, Salt Lake City, UT, USA, 18–22 June 2018; pp. 4510–4520. [Google Scholar]
- Aleem, A.; Tehsin, S.; Kausar, S.; Jameel, A. Target classification of marine debris using deep learning. Intell. Autom. Soft Comput. 2022, 32, 73–85. [Google Scholar] [CrossRef]
Disclaimer/Publisher’s Note: The statements, opinions and data contained in all publications are solely those of the individual author(s) and contributor(s) and not of MDPI and/or the editor(s). MDPI and/or the editor(s) disclaim responsibility for any injury to people or property resulting from any ideas, methods, instructions or products referred to in the content. |
© 2023 by the authors. Licensee MDPI, Basel, Switzerland. This article is an open access article distributed under the terms and conditions of the Creative Commons Attribution (CC BY) license (https://creativecommons.org/licenses/by/4.0/).