Article

Forest Fragmentation and Landscape Connectivity Changes in Ecuadorian Mangroves: Some Hope for the Future?

by
Julio J. Jaramillo
1,
Carlos A. Rivas
2,3,
José Oteros
4 and
Rafael M. Navarro-Cerrillo
3,*
1
Environmental Engineering Career, Universidad Estatal del Sur de Manabí, Jipijapa 130650, Manabí, Ecuador
2
Facultad de Ciencias Básicas, Universidad Técnica de Manabí, Portoviejo 130105, Manabí, Ecuador
3
Department of Forest Engineering, Laboratory of Dendrochronology, Silviculture and Global Change—DendrodatLab—ERSAF, University of Córdoba, Campus de Rabanales, Crta. IV, km. 396, E-14071 Córdoba, Spain
4
Department of Botany, Ecology and Plant Physiology, Agrifood Campus of International Excellence (ceiA3), University of Córdoba, Rabanales Campus, Celestino Mutis Building, E-14071 Córdoba, Spain
*
Author to whom correspondence should be addressed.
Appl. Sci. 2023, 13(8), 5001; https://doi.org/10.3390/app13085001
Submission received: 27 February 2023 / Revised: 5 April 2023 / Accepted: 13 April 2023 / Published: 16 April 2023
(This article belongs to the Special Issue GIS and Spatial Planning for Natural Hazards Mitigation)

Abstract

:
This study investigates the impact of fragmentation on Ecuador’s coastal mangrove forests. Fragmentation is identified as a primary cause of aquatic ecosystem degradation. We analyzed the relationship between habitat loss, fragmentation, and mangrove connectivity through a multitemporal approach using Global Mangrove Watch and fragmentation and connectivity metrics. The terrain was divided into 10 km2 hexagons, and six fragmentation metrics were calculated. A Getis–Ord Gi* statistical analysis was used to identified areas with the best and worst conservation status, while connectivity analyses were performed for a generic species with a 5 km dispersion. Findings revealed widespread mangrove fragmentation in Ecuador, with geographical differences between the insular region (Galapagos) and the mainland coast. Minimal loss or even expansion of mangrove forests in areas like the Galapagos Islands contrasted with severe fragmentation along the mainland coast. Transformation of forests into fisheries, mainly prawn factories, was the primary driver of change, while only a weak correlation was observed between mangrove fragmentation and conversion to agriculture, which accounts for less than 15% of all deforestation in Ecuador. Fragmentation may increase or decrease depending on the management of different deforestation drivers and should be considered in large-scale mangrove monitoring. Focusing only on mangrove deforestation rates in defining regional conservation priorities may overlook the loss of ecosystem functions and fragmentation.

1. Introduction

South America suffered the highest rates of deforestation in the world between 1990 and 2020, which has led to many South American ecosystems becoming highly fragmented, with low forest integrity [1]. Researchers have studied the spatial patterns of forests across a wide range of geographic locations because they are concerned about the widespread negative effects of fragmentation [2]. High rates of fragmentation may also lead to a loss of connectivity, affecting populations. Population connectivity influences functional ecology and is related to the ability of species to persist and recover from ecological perturbations such as habitat fragmentation and climate change [3]. Loss of connectivity, coupled with climate change, can be terrible for biodiversity. Climate change is expected to modify South American ecosystems, and loss of connectivity will prevent South American populations from migrating [4]. Deforestation is known to affect both the fragmentation and connectivity of forest ecosystems due to restricted gene flow, dispersal, and population exchanges, which may ultimately result in the extinction of some rare and threatened species, particularly those with small populations or restricted distributions [5].
Mangrove forests cover about 147.000 km2 along the coastlines of most tropical, subtropical, and warm-temperate regions of the world [6]. Mangrove species comprise 20 genera from 16 families and 110 species, of which six species are identified in Ecuador; one is included in the IUCN Red List as critically endangered [7]. Mangrove forests are one of the world’s greatest concentrations of biodiversity due to their complex topographic and ecological conditions [8]. These forests mitigate global climate change by storing substantial reserves of blue carbon, preventing erosion, protecting coastal communities from extreme weather, and providing habitat for fisheries species [9]. Mangrove forests are threatened by anthropogenic processes such as deforestation, rising sea levels, overexploitation, loss of habitat, and fragmentation [10,11,12]. Deforestation affected more than 3700 km2 of global mangrove coverage from 1999–2019, with annual deforestation rates of up to 3.6%, which were only partially offset by gains of 1800 km2 [13,14]. Previous studies have demonstrated that deforestation and fragmentation of mangrove populations have reduced population sizes, with an increase in marginal and isolated populations [15,16].
Habitat fragmentation is a leading cause of global biodiversity decline, and it has become a crucial focus in conservation biology [17]. Ecuador is considered one of the twelve most biodiverse countries in the world and is also the country with the smallest area of the twelve. Ecuadorian mangrove forests are found within the Chocó/Darien/Western Ecuador biodiversity hotspot. Fragmented mangrove forests suffer from reduced resilience and ecological functionality, as they experience higher tidal flow, increased erosion, diminished wave mitigation, and biodiversity loss [12,18]. Mangrove ecosystems also play a vital role in mitigating the impacts of natural hazards such as storms, floods, and coastal erosion [19]. These ecosystems serve as natural barriers, protecting coastlines and communities from the adverse effects of such events. Mangrove forests are one of the most endangered ecosystems in Ecuador as a result of anthropogenic pressure [20]. In Ecuador, mangrove forests are concentrated along the estuaries of the Mataje-Santiago-Cayapas, Muisne-Cojimes-Chone-Guayas, Jubones-Santa Rosa-Arenillas, and Mataje-Santiago-Cayapas rivers, with two dominant types: the Chocó tropical mangrove (Esmeraldas) and the Jama Zapotillo mangrove (Manabí, Guayas, and El Oro). The most common major mangrove species in Ecuador are Rhizophora mangle L., R. racemose G. Mey, R. × harrisonii Leechm., Laguncularia racemosa (L.) C.F. Gaertn. var. racemosa, L. racemosa var. glabriflora (C. Presl) Stace, and Avicennia germinans (L.) L. Between 80% and 90% of all mangrove forests in Ecuador are dominated by R. mangle, while the remaining 10% are mostly made up of A. germinans and L. racemose. In Ecuador, the loss of 55,738.77 hectares of mangrove, corresponding to 27.33% of its coverage, has been registered in a period of 37 years from 1969 to 2006 [21]; thus, understanding how mangrove ecosystems have changed over time is necessary for conservation of Ecuadorian biodiversity, coastal productivity, coast protection, and the fight against climate change [22,23]. In this sense, the use of fragmentation and connectivity metrics are effective for calculating precise estimates of the impact of these changes on sustainable development policies for conserving mangrove ecosystems. In this study, we utilized GIS and spatial planning techniques to analyze mangrove forest fragmentation and landscape connectivity changes. By identifying areas of significant fragmentation and reduced connectivity, we could pinpoint locations where mangrove forests are less effective in providing natural hazard mitigation services. In addition, the increase in fragmentation can make mangrove forests more accessible to humans, leading to deforestation and exploitation of species dependent on these habitats. Consequently, fragmentation threatens the mangrove forests’ ability to support various species and store carbon [24,25]. The primary goal of this research was to assess the status of mangrove ecosystems in Ecuador, focusing on their fragmentation and connectivity. To assess these factors, we utilized geographic information systems to analyze land cover data and spatial patterns. By tessellating the terrain into hexagons and calculating fragmentation metrics, we provided a comprehensive understanding of the current state of mangrove ecosystems in Ecuador. Furthermore, we analyzed connectivity changes by using Getis–Ord Gi* analysis. By evaluating the implications of land use change and other human activities, we aimed to determine the effectiveness of existing conservation efforts and identify areas where further action is needed.

2. Materials and Methods

2.1. Study Area

Ecuador has a continental coastline of 1200 km, including the Galapagos Islands, whose coastal profile provinces range from Esmeraldas, Manabí, Santa Elena, Guayas, and Galapagos to the north and El Oro to the south (Figure 1), characterized by a very dynamic coastal profile for both the country’s economy and tourism. For this study, we obtained the polygons of mangrove marine-coastal ecosystem presence in Ecuador for various time periods (1996, 2007, 2015, and 2020) and processed the digital information in ArcGIS 10.8 software using the map overlay method (Figure 1). As a result, six mangrove distribution areas were identified, five of them located in the coastal biogeographic region of Ecuador and one in the Galapagos Islands. Mangrove forests in Ecuador are characterized by their high level of biodiversity, although large areas of forest have been modified by shrimp farming, infrastructure expansion, and extensive and unsustainable agricultural and fishing practices, leading to fragmented landscapes with patches of forest in the range of 5 and 100 ha. Due to their proximity to primary dry forests, these fragmented remnants represent primary forests. However, large tracts of forest suffer from uncontrolled deforestation and unplanned land use changes.

2.2. Compilation and Acquisition of Cartographic Information

Vector models were downloaded using shapefile layers for Ecuador’s provinces and areas of mangrove presence. The political-administrative division of the provinces was obtained from the Military Geographic Institute of Ecuador (available at https://www.geoportaligm.gob.ec/portal/index.php/cartografia-de-libre-acceso-escala-50k/ (accessed on 13 November 2022)). The presence and extent of mangrove forests was uploaded from Global Mangrove Watch (https://data.unep-wcmc.org/datasets/45 (accessed on 13 November 2022)). GMW has generated a global mangrove reference map for 2010 using ALOS PALSAR and Landsat remote sensing data, and between 1996 to 2020 derived from the JERS-1 SAR, ALOS PALSAR, and ALOS-2 PALSAR-2 platforms, generating annual maps from 2018.

2.3. Calculation of Deforestation and Fragmentation

To calculate the deforestation and fragmentation of mangrove forests, areas with mangrove presence were delimited between 1996 to 2020. Once the mangrove areas were obtained, the deforestation rate was calculated using the formula proposed by Puyravaud [26] (Equation (1)):
Deforestation rate (DR) = 1/(t2 − t1) × Ln (A2/A1) × 100,
where A1 and A2 are the mangrove areas at times t1 and t2, respectively.
For the calculation of fragmentation metrics, a 10 km2 hexagonal grid was formed in the study area. Hexagonal polygons are considered the most suitable geometry when studying interaction and connectivity. The use of polygons improves the ability to assess landscape metrics in a more homogeneous manner [27]. We used hexagons as a grid system to analyze fragmentation and connectivity at a landscape level. Each hexagon was assigned one of the Ecuadorian provinces (Esmeraldas, Manabí, Guayas, Santa Elena, El Oro, and Galapagos). The patch analysis tool [28] in ArcGIS 10.8 was used to calculate different fragmentation metrics in each mosaic: number of patches (NumP), class area (CA), mean patch size (MPS), total edge (TE), and edge density (ED) (Table 1). From these metrics, the reticular fragmentation index (RFI) was calculated based on the percentage without forest (PSB%) and edge density percentage (ED%) (Table 1), using the formula proposed by Leautaud Valenzuela [29] and Rivas et al. [30]. A fragment of 1.0 ha was used as a reference value to establish 100% of the PSB% and ED% metrics. This size was used because smaller sizes could distort the calculation.

2.4. Fragmentation Patterns

Getis–Ord Gi* analysis [32] was used to calculate fragmented patterns from the years 1996 and 2020, considering RFI values. The resulting Z-score and p-values indicated significant RFI values between the ranges considered high and low, considering significant results of 5% (p ≤ 0.05); Z-range scores higher than 1.96 were considered hot spots (e.g., areas with lower values of mangrove forests), while Z-scores lower than −1.96 were considered cold spots (e.g., areas with higher values of conserved mangrove forests), and the remaining values were classified as non-significant (−1.96 < Z < 1.96; p > 0.05), considering a random spatial process [33].

2.5. Connectivity Analysis

In the present research, graph theory was applied in order to have a better structural approach and to correctly evaluate mangrove connectivity (forest patches) throughout the mangrove forests of Ecuador. Numerous important natural resources such as forests, agricultural lands, and areas containing sensitive animal and plant species are negatively impacted by indiscriminate construction and tourism in coastal areas [34]. Landscape metrics and connectivity indices were applied according to graph theory [35].
Connectivity was calculated for a set of generic species. Connectivity metrics between mangrove patches were calculated using Graphab software [35,36,37] for 1996 and 2020. Links between mangrove patches were created at a Euclidean distance of 5 km. Subsequently, global connectivity and connectivity per mangrove patch were calculated. Once the connectivity metrics per patch were obtained, they were overlaid with the Ecuadorian provinces to obtain the connectivity of each province. The global connectivity metrics calculated were flux (F), equivalent probability (EC), connectivity probability (PC) and number of components (NC); the connectivity metric per patch calculated was flux (F) (Table 2).

3. Results

3.1. Deforestation and Fragmentation

Table 3 shows that mangrove forests throughout the Ecuadorian coast changed between 1996 and 2020 (an increase of 141.37 km2), despite a slight reduction between 1996 and 2015. Mangrove forests present in the province of Galapagos almost doubled their coverage between 1996 and 2020. It is important to highlight that throughout the distribution area there has been a recovery of the mangrove surface area during the last period considered (2015–2020).
Fragmentation metrics increased in all provinces with a higher number of tiles, which indicated the creation of new mangrove fragments. High rates of forestation were linked to some of these areas (Table 4). The Galapagos Islands had 173 new tiles with new fragments of mangrove forests, and the number of patches within each tile increased. However, they were still below the rest of the provinces, where the number of patches increased over 10 (Guayas and Esmeraldas) or 20 (Manabí and El Oro) times. It can also be observed that the average size of the patches (MPS) was very low, with the highest value in Guayas province (0.4 km2) and the lowest in the Galapagos Islands (0.03 km2).
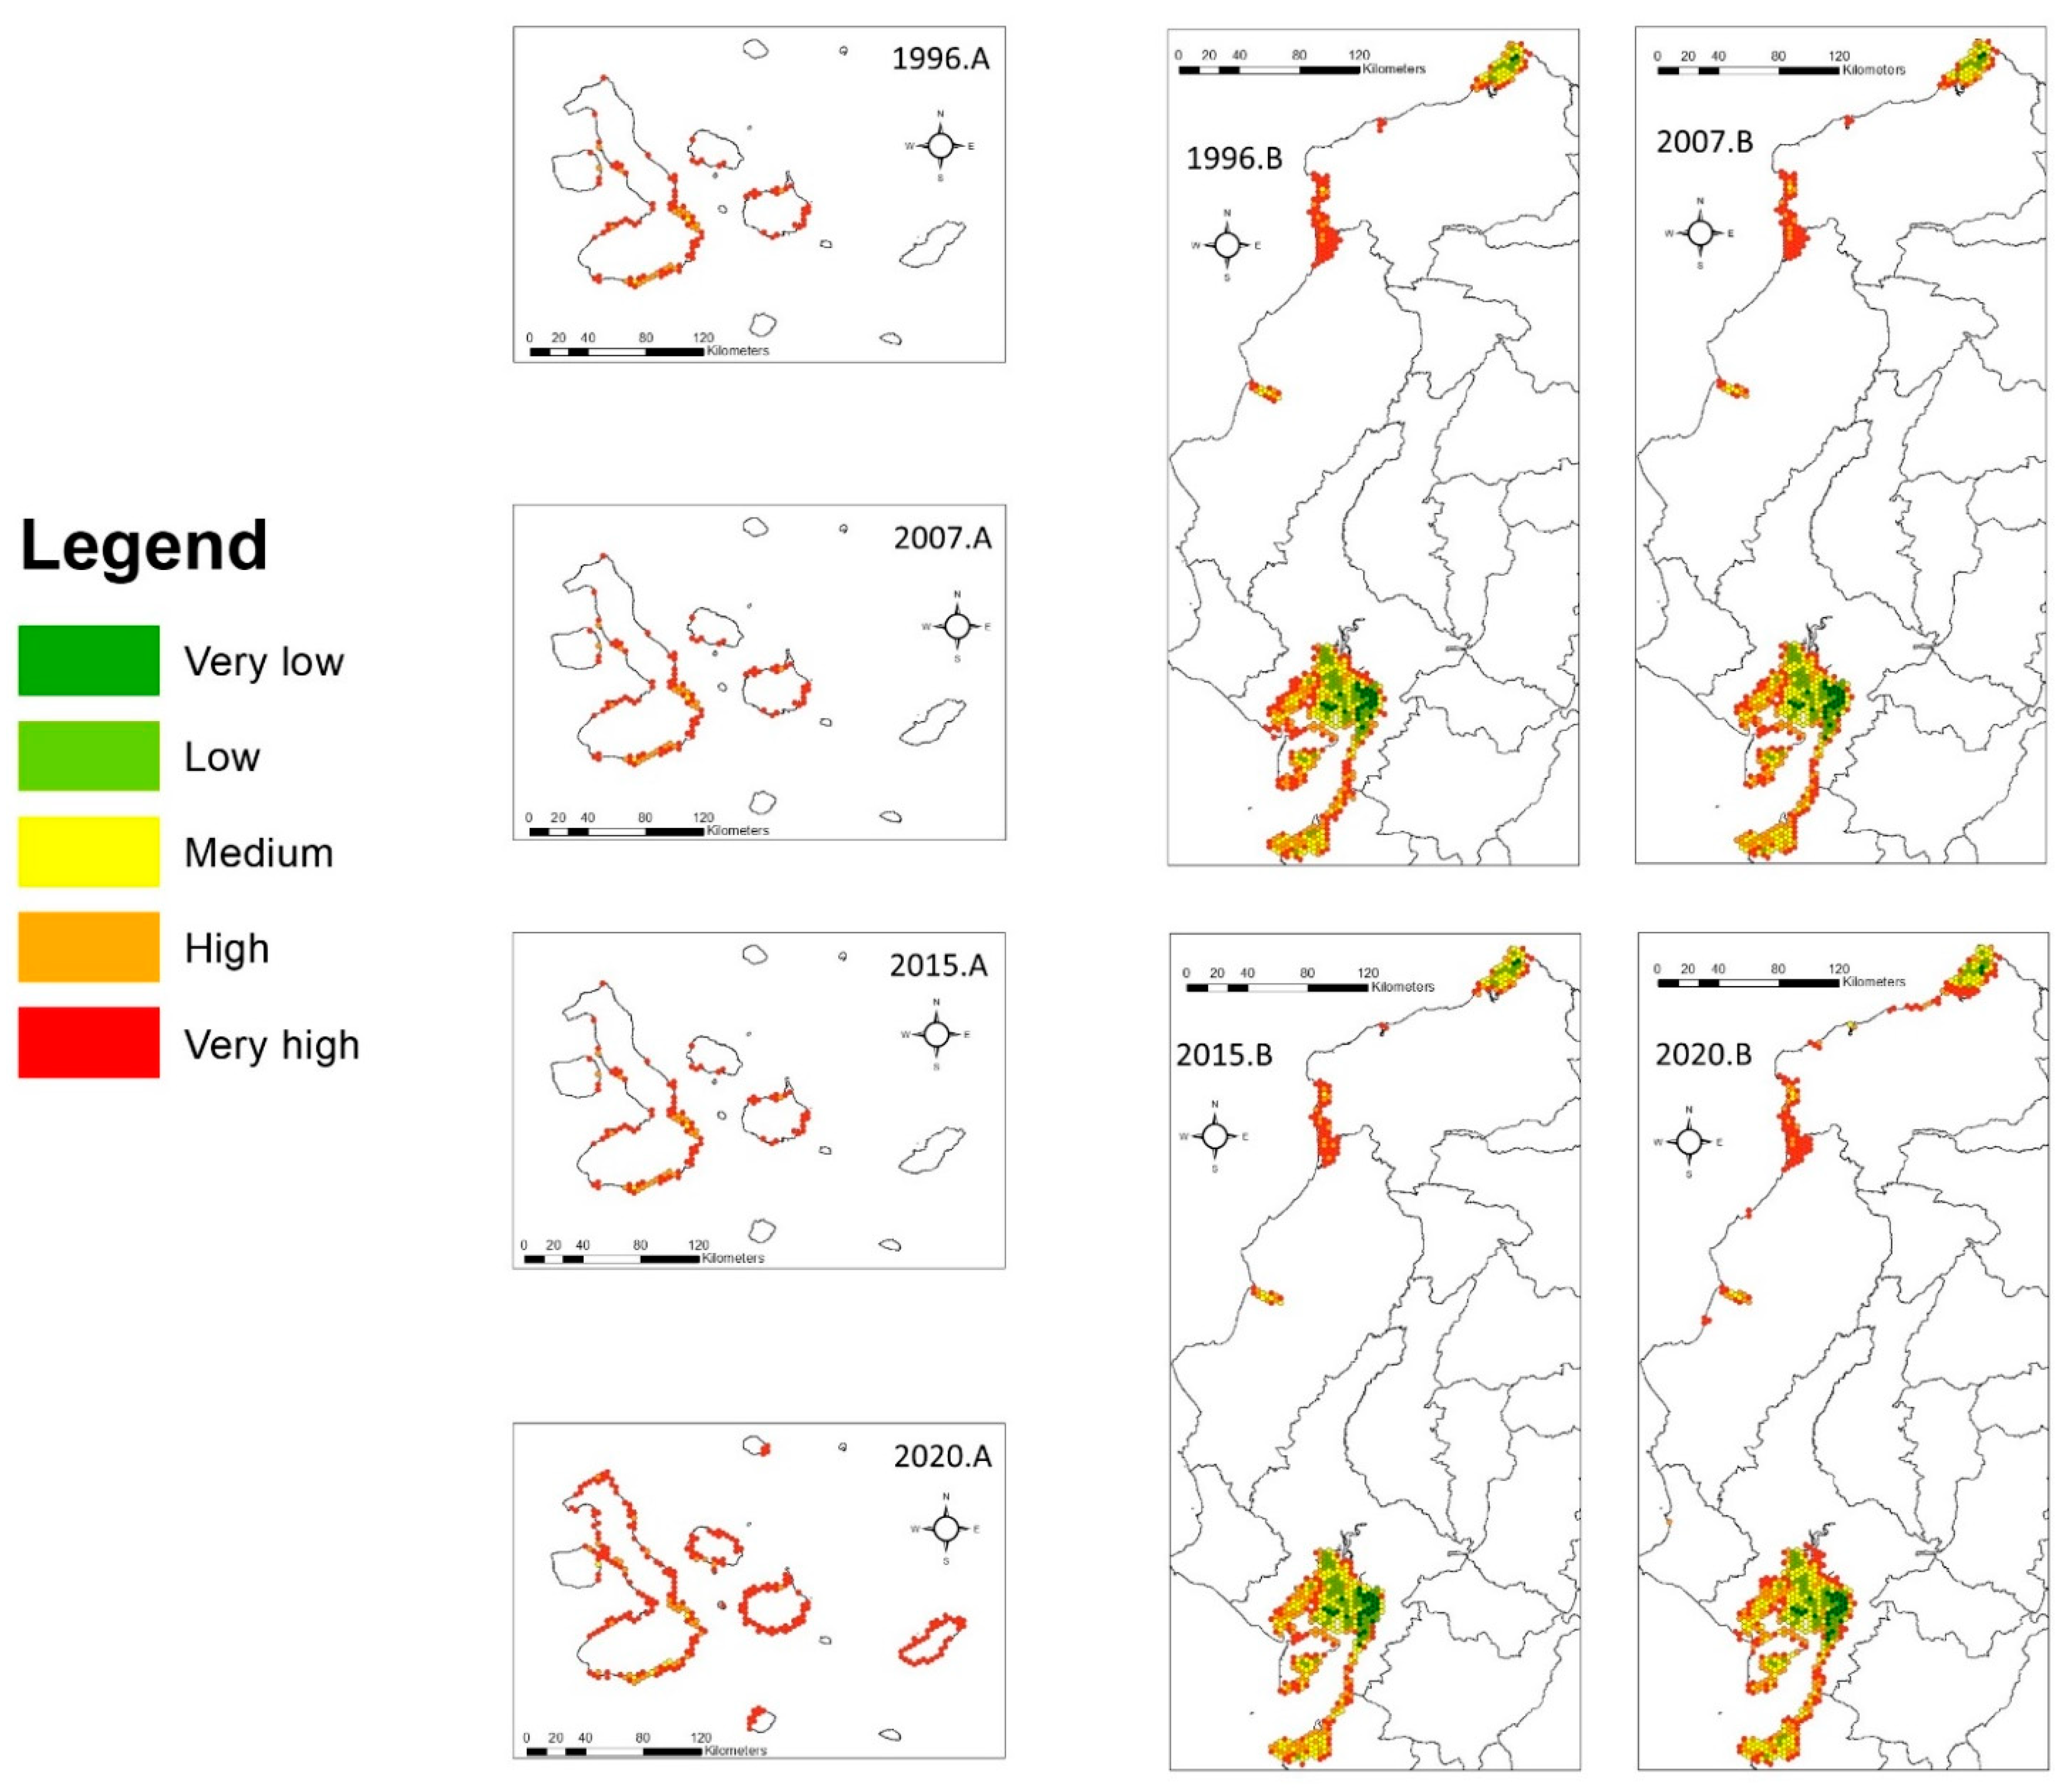
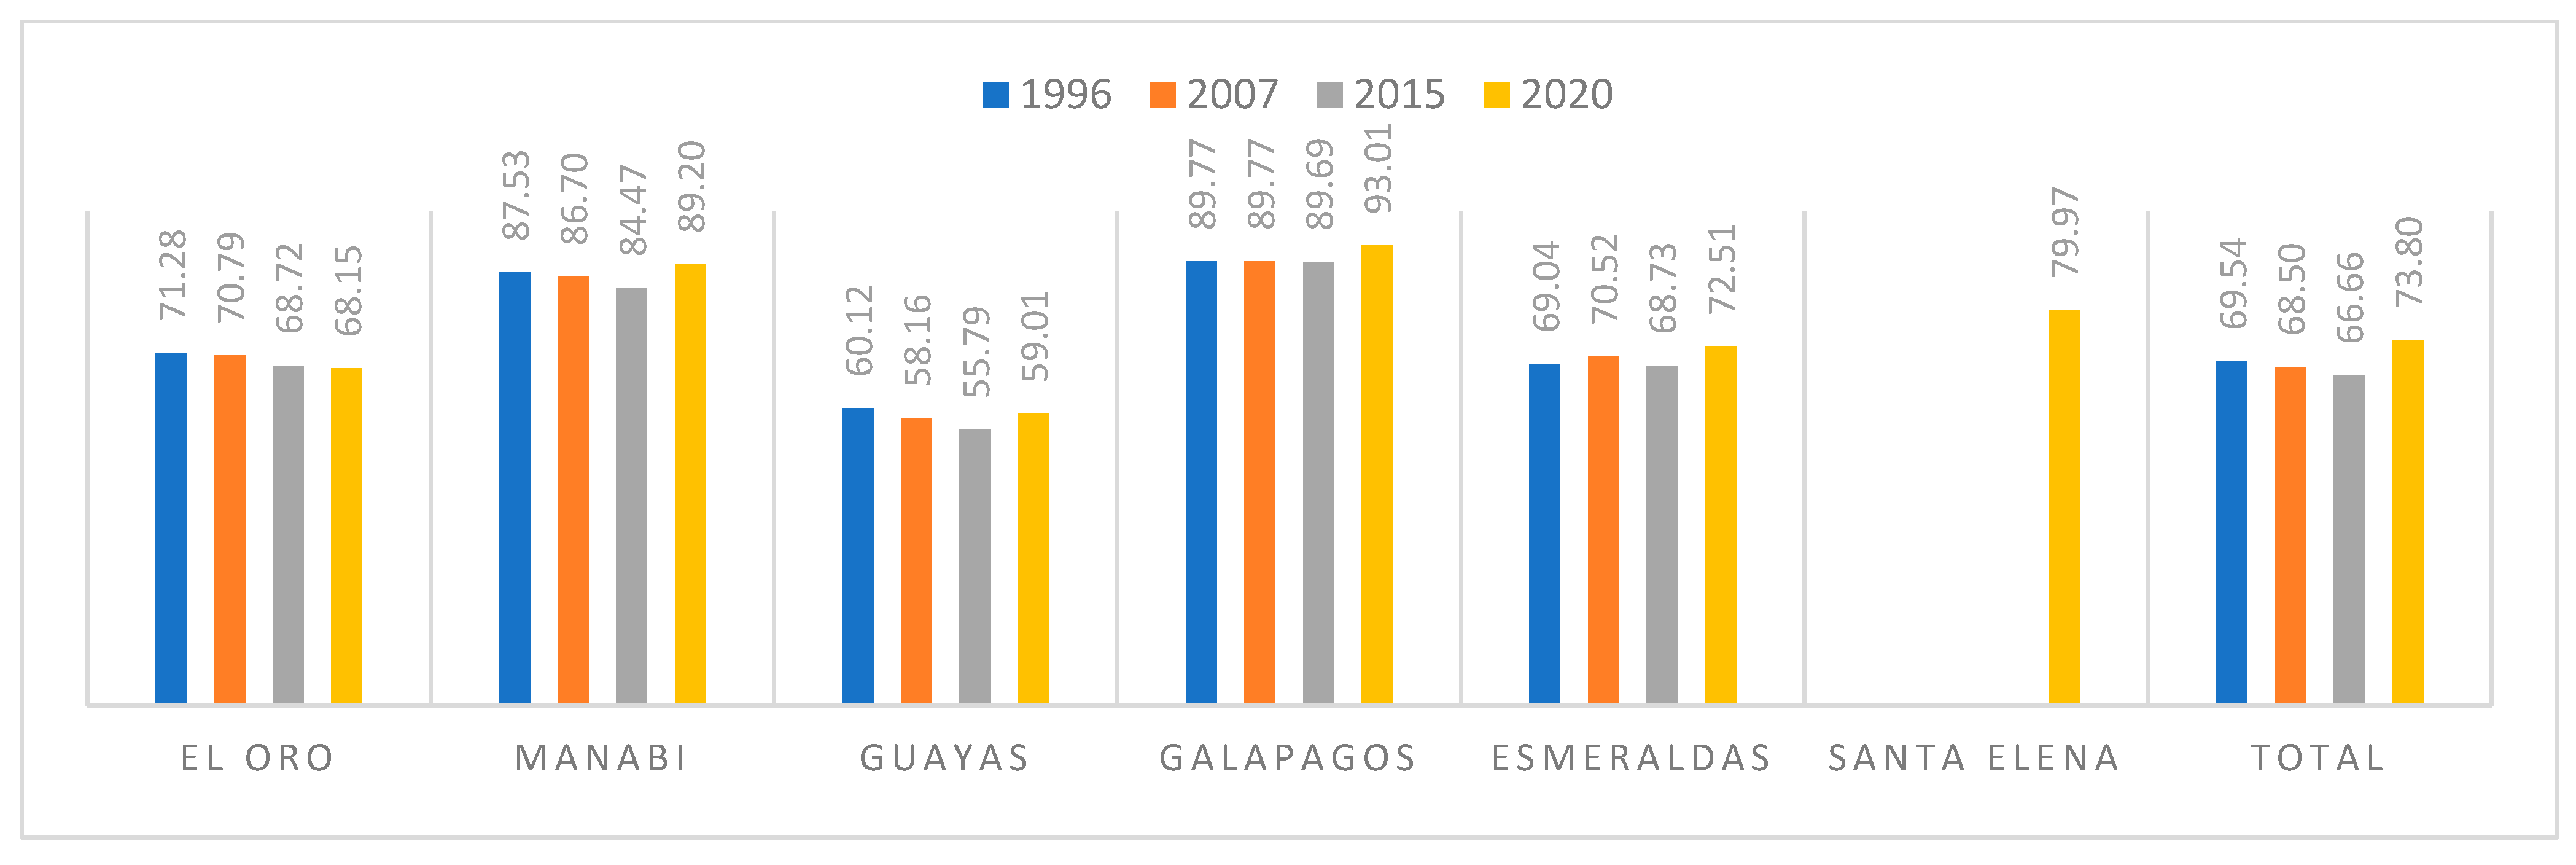
The reticular fragmentation index increased between 1996 and 2020 (Figure 2, Figure 3 and Figure 4), with higher values in the Galapagos Islands and Manabí and lower values in Guayas and El Oro provinces (Table S1). Even in areas with low fragmentation, there was a generalized trend toward mangrove fragmentation throughout Ecuador. The transition between hexagons with mangrove remnants showed that between 2015 and 2020, 27% of them had recovered mangrove forests. Mangrove forests recovered in some areas where the number of patches was higher in 2020 than in 1996, although in general, fragmentation increased between 1996 and 2020. In 2020, 2.09% of the area represented mangrove forest loss (Figure 2).

3.2. Fragmentation Patterns

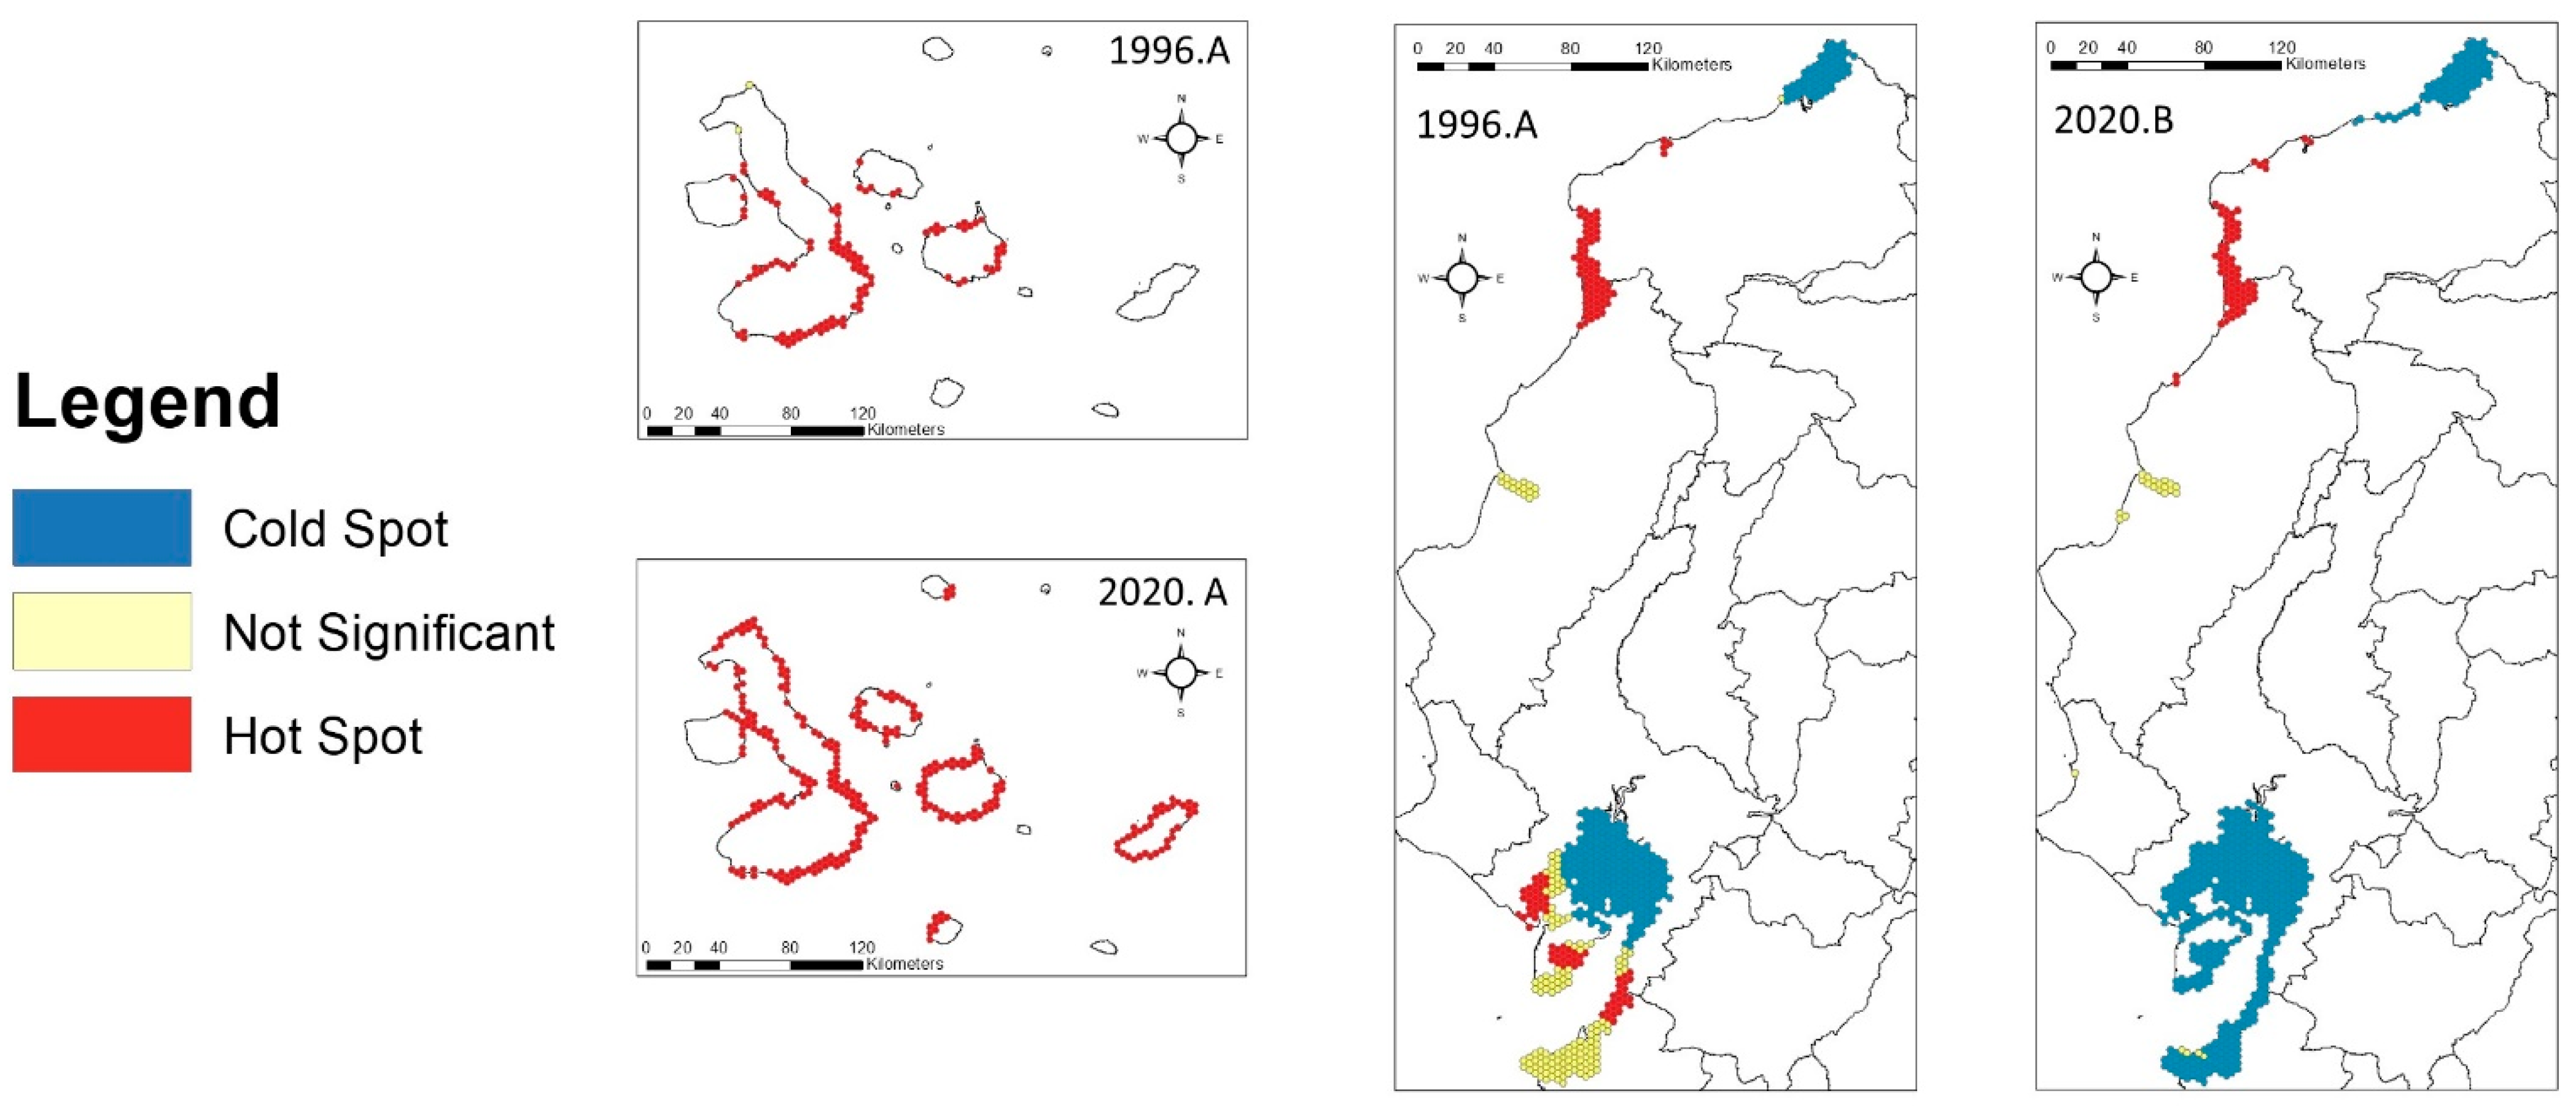
The Getis–Ord Gi* analysis shows the critical areas with the highest (hotspots) and lowest (cold spots) fragmentation values (Figure 5). The areas with the highest fragmentation (hotspots) were the Galapagos Islands, Manabí, and south Esmeraldas provinces. The best-preserved areas (cold spots) were identified in the northern part of Esmeraldas, Guayas, and El Oro provinces. Patterns of mangrove recovery in Ecuador were related to broad patterns of fragmentation.

3.3. Connectivity Analysis

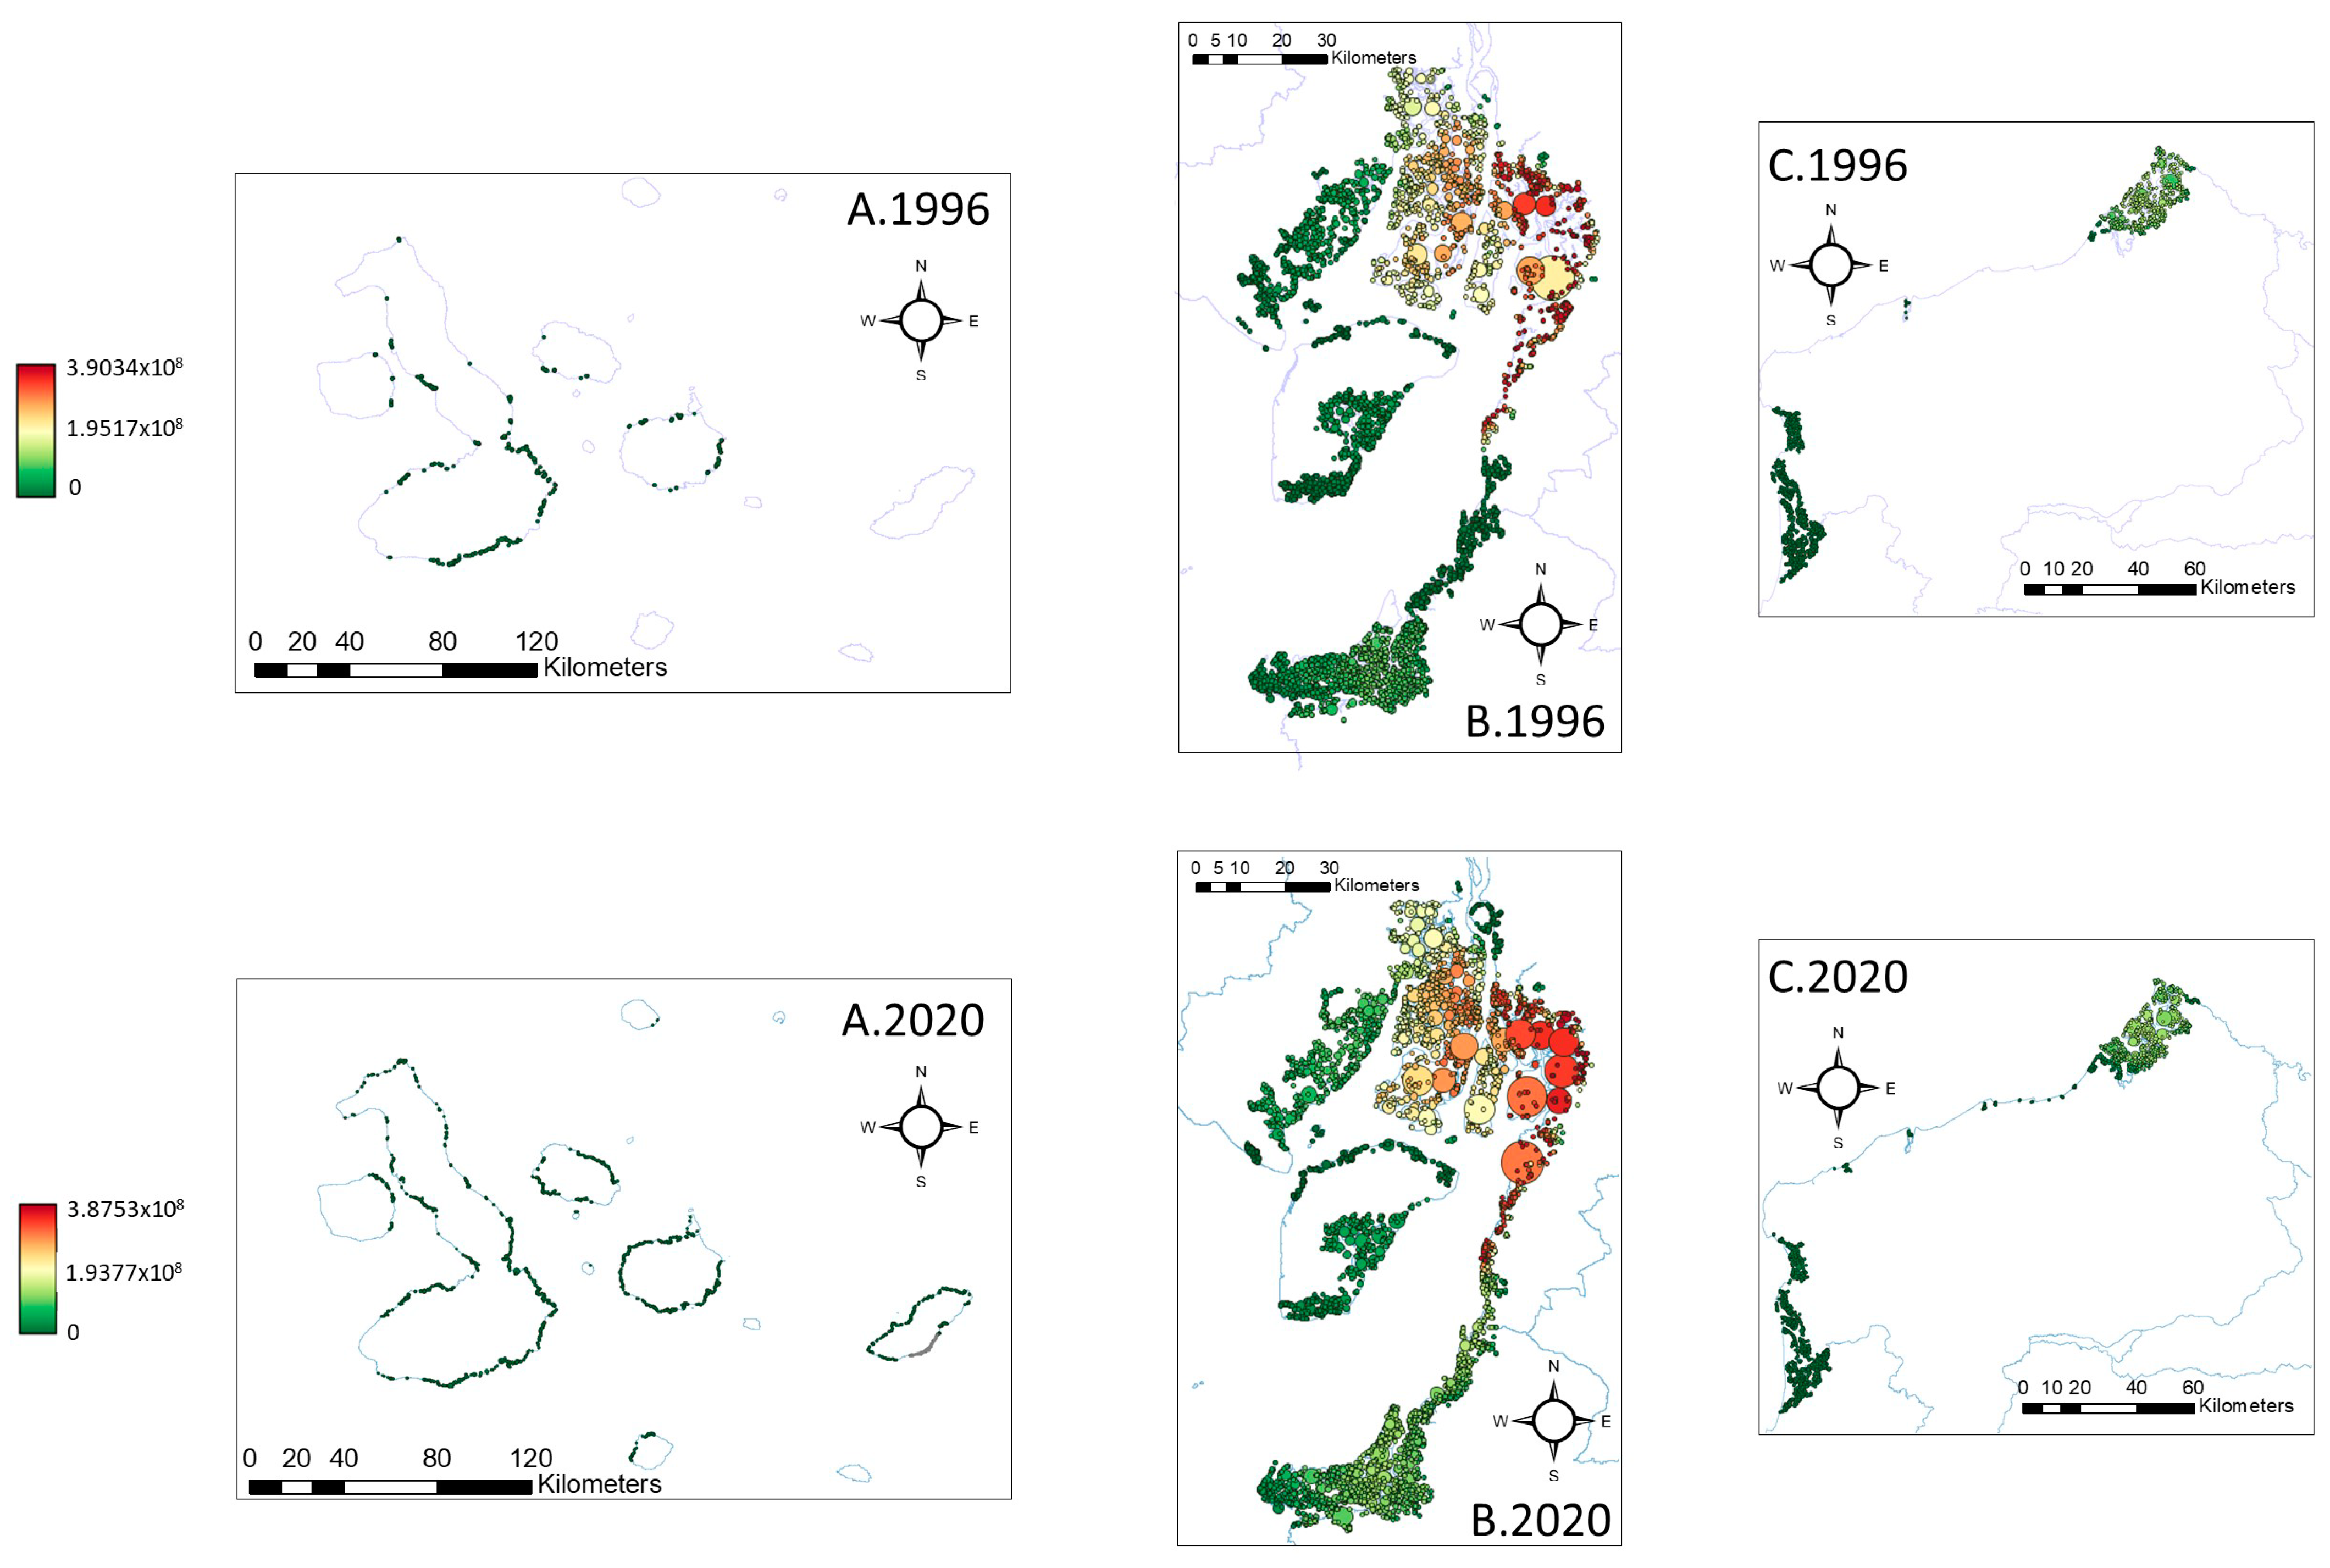
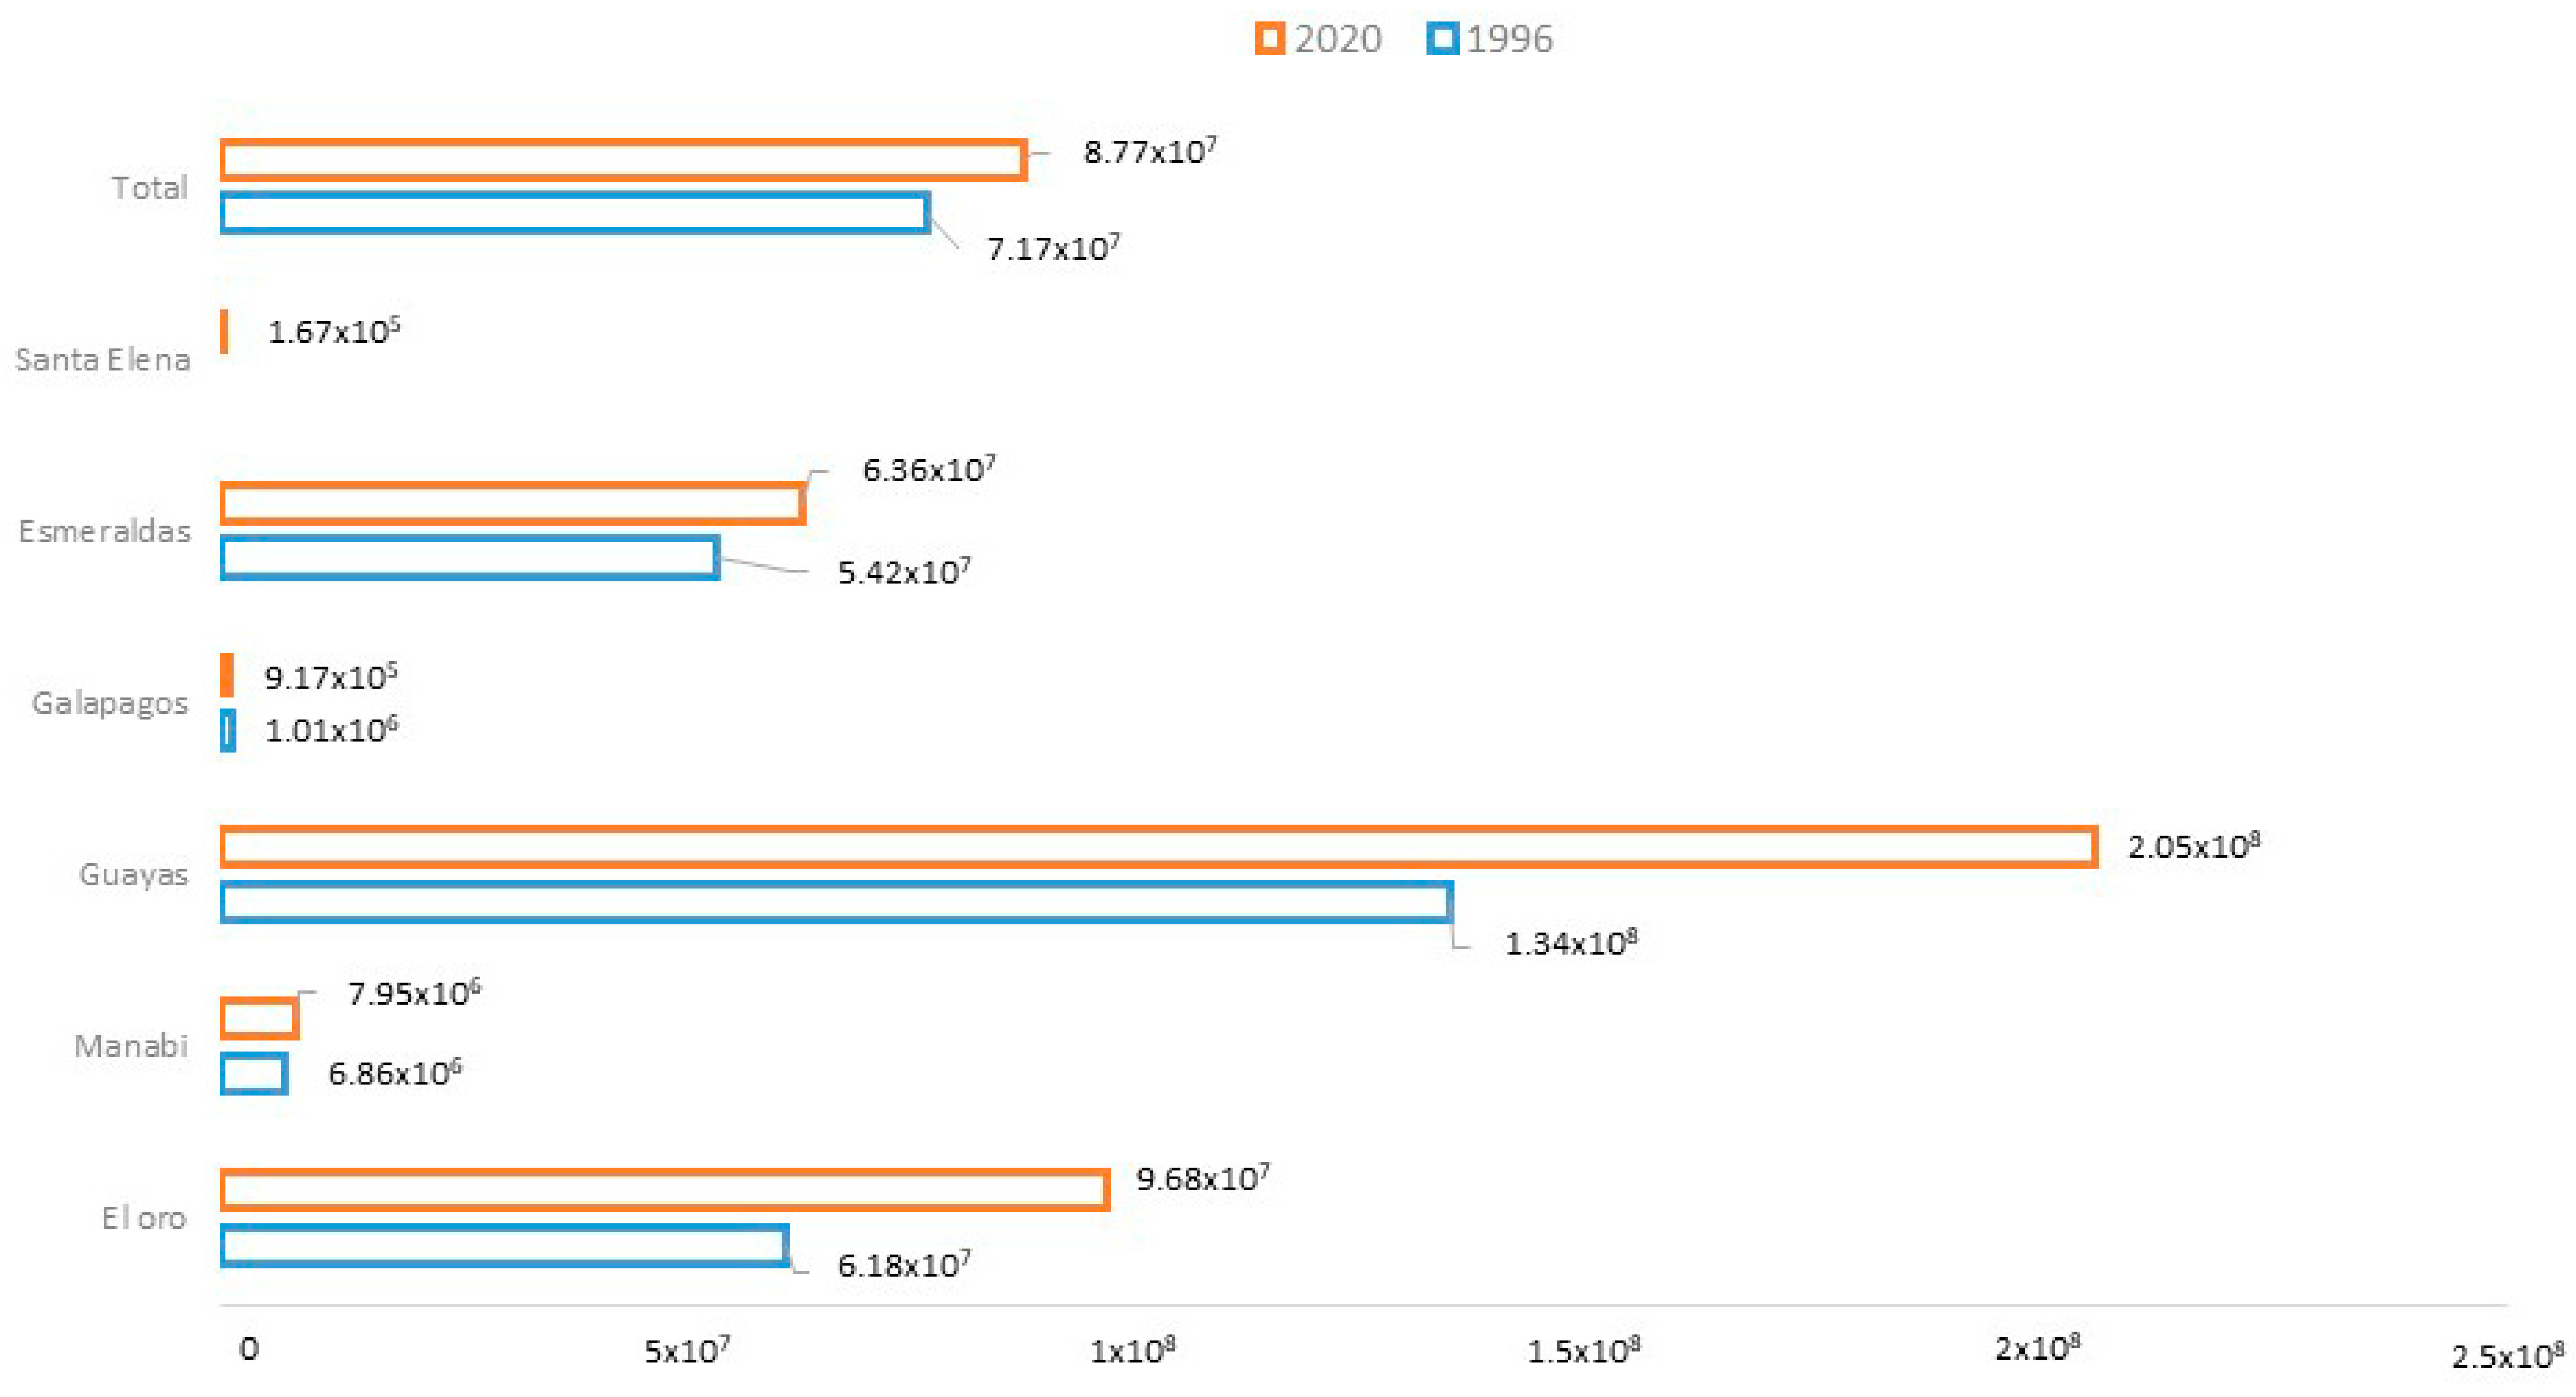
Connectivity increased at global and local scales (Table 5 and Table S2, Figure 6 and Figure 7). Overall connectivity increased to 32.62% in the flux metric, 2.51% in equivalent probability, and 3.15% in connectivity probability, indicating that connectivity in Ecuador’s mangrove forests increased between 1996 and 2020. However, the number of components increased, indicating that zones without connectivity appeared during the study period.

4. Discussion

4.1. Deforestation and Fragmentation

Mangrove ecosystems in Ecuador suffered considerable deforestation between 1969 and 1999, when approximately 45,000 hectares of mangrove forests were converted into shrimp farms. In 1969, mangrove forests covered 203,624 hectares in Ecuador; by 2006, only 147,228.6 hectares remained, reflecting a loss of 56,396 hectares [38]. According to Bravo [39], in these three decades, Ecuador lost 27.6% of its mangrove forests. This deforestation could have led to its current threatened species status (endangered/critically endangered) [40]. In our study, we found that mangrove forests in the Ecuadorian coast partially recovered between 1996 and 2020 (an increase of 141.37 km2), despite a slight reduction between 2007 and 2015. The largest natural regenerations occurred in the province of Galapagos, whose mangrove forest area almost doubled in 2020 (26.6 km2). These results are the opposite of those in the rest of South America, where it is estimated that more than 11% of the mangrove forests existing in the 1980s have been lost or severely degraded [12]. The increase in mangrove areas conserved and recovered in Ecuador is due to the sustainable use and mangrove stewardship agreements signed by the Ministry of Environment between 2000 and 2015 [41]. Mangrove forests have been protected in Ecuador since 1994, and they are recognized as a species prohibited from logging because of the serious impact it causes to this ecosystem [42]. Because Ecuador has the highest deforestation rates, this is a major area of concern for mangrove conservation [16,22]. As fragmentation and connectivity are crucial for maintaining migration corridors and patch resiliency, respectively, different drivers of deforestation, not just the extent of deforestation, may have distinct effects on the functionality of mangrove ecosystems. Consequently, mangrove fragmentation can have a negative impact on a forest’s capacity to support species while maintaining its suitability as a migration route for wildlife [16].

4.2. Fragmentation Metrics

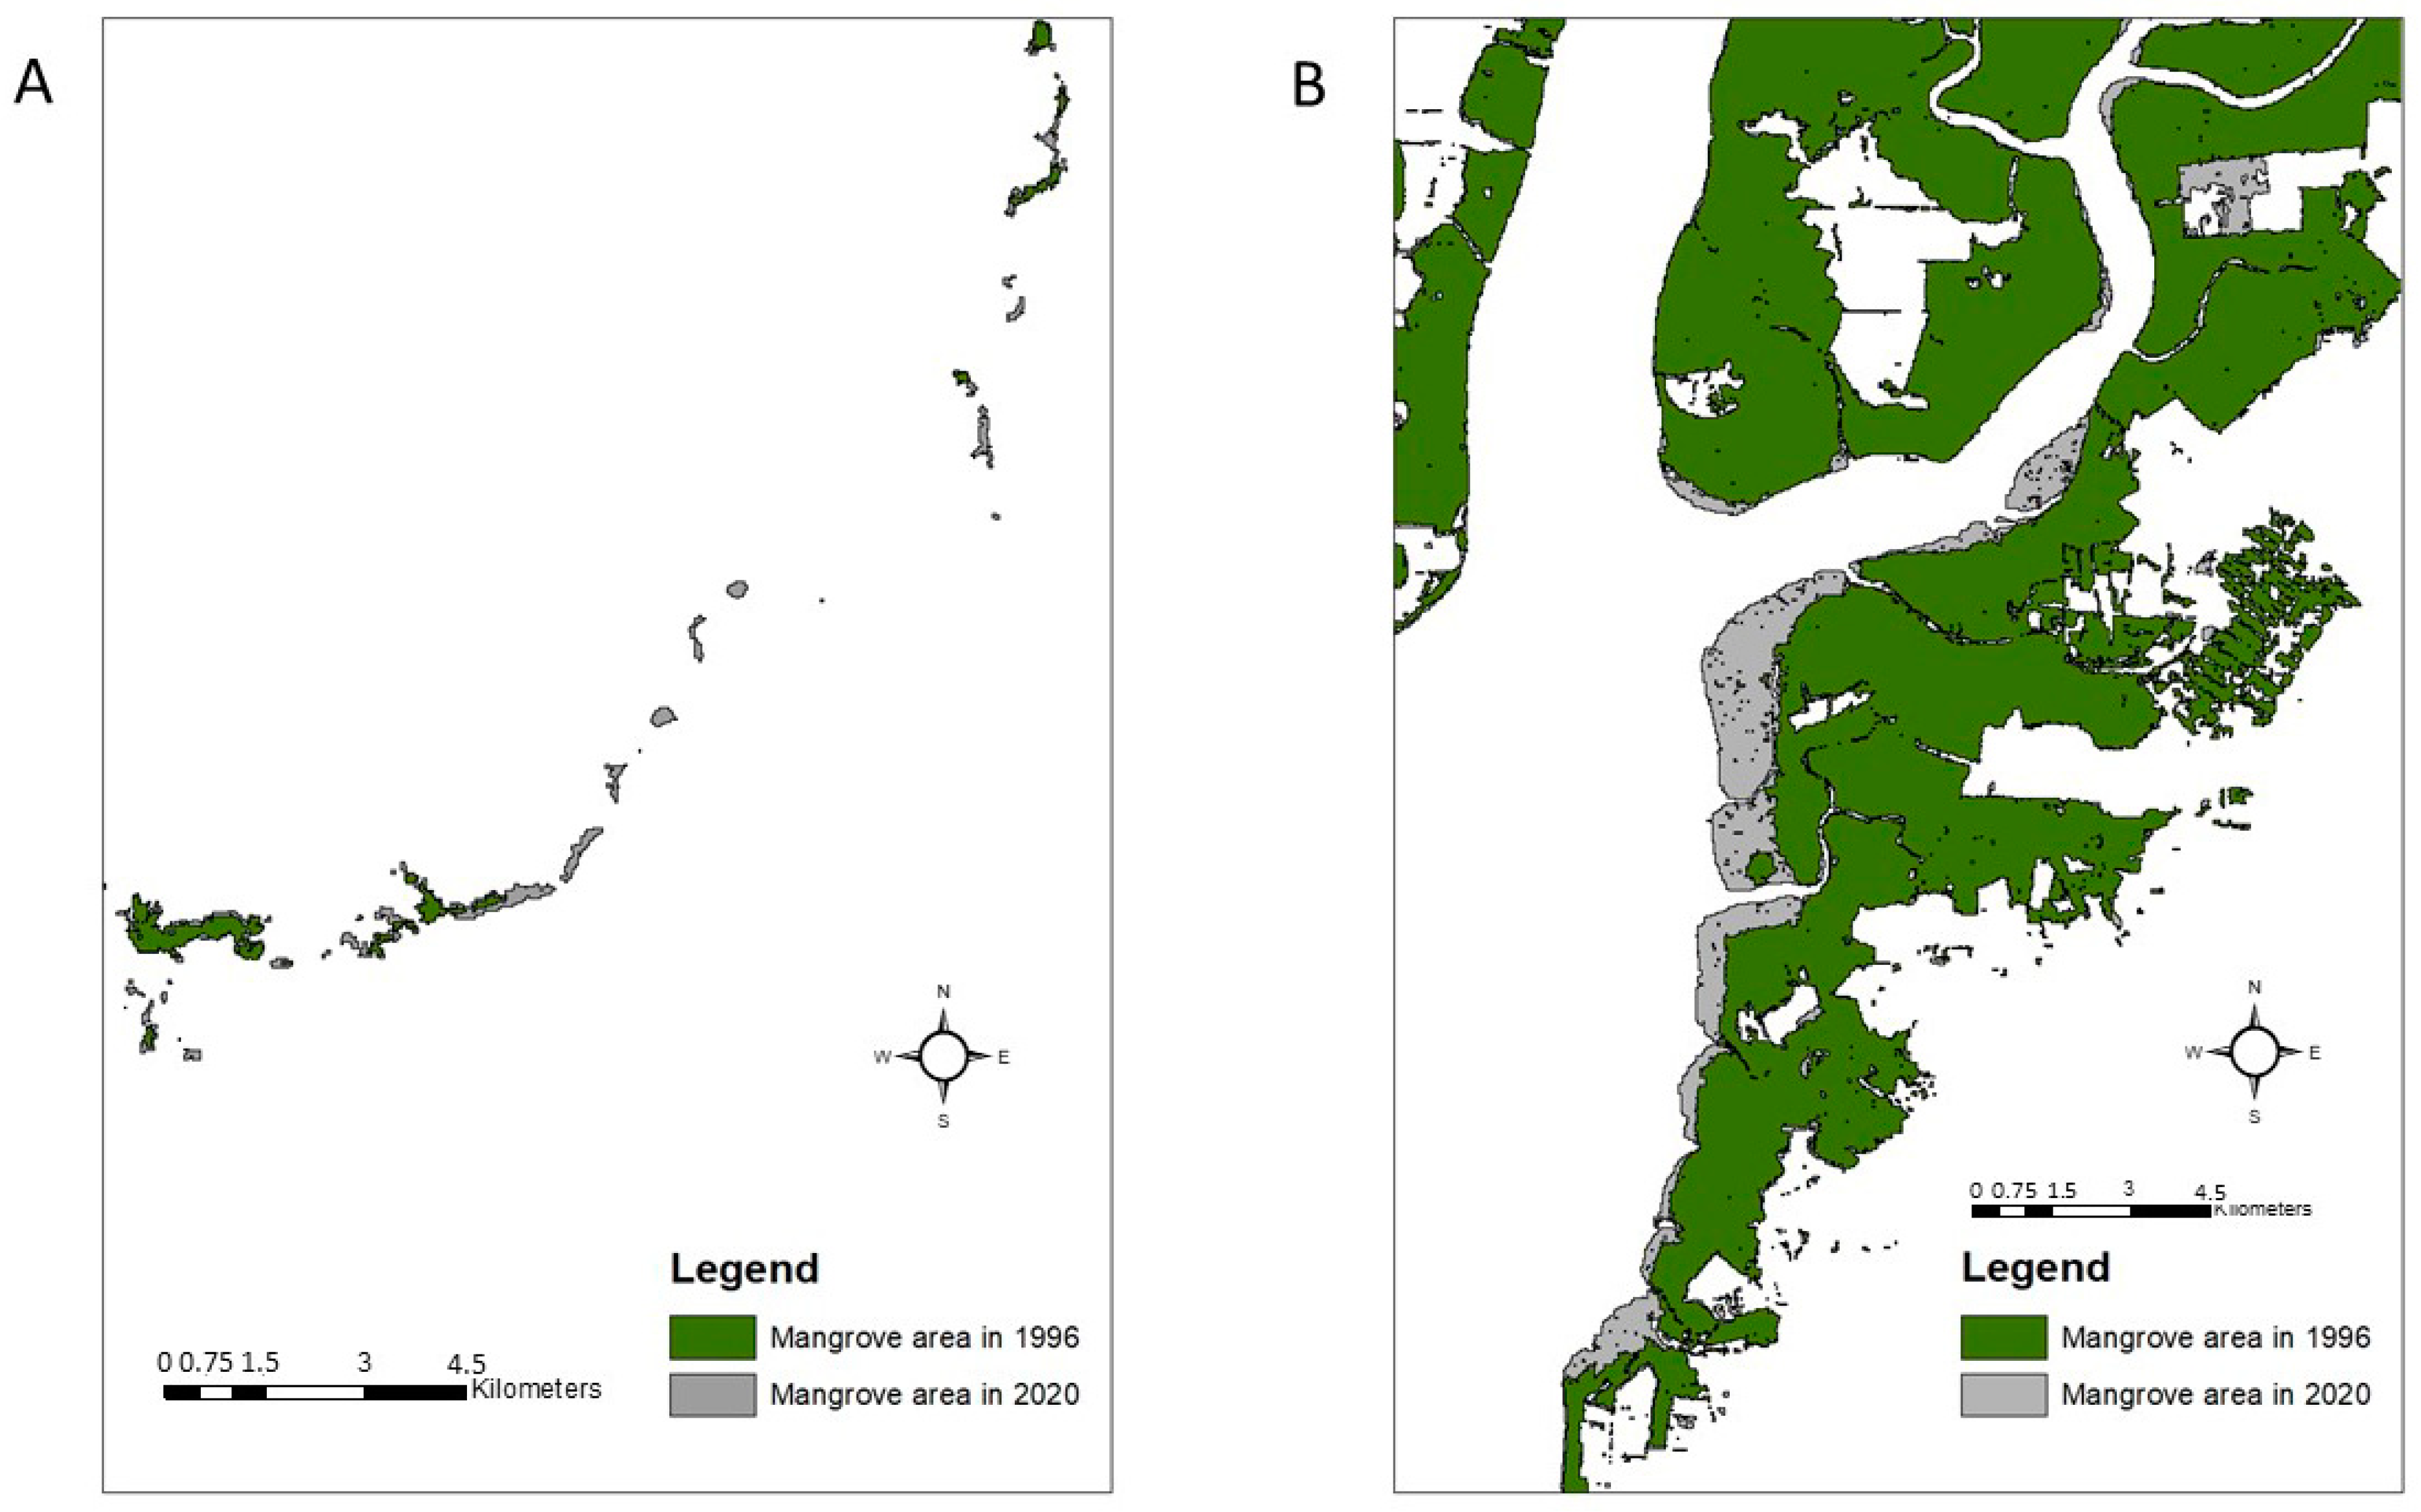
Our results show three distinct dynamics in Ecuadorian mangrove forests. The first were areas where fragmentation increased even though the mangrove cover also increased. This was related to the emergence of new small mangrove patches, which caused the patch size and mean patch size to decrease, but the number of patches, the number of tiles, and the reticular fragmentation index to increase. This occurred in the provinces of Galapagos, Esmeraldas, Manabí, and Santa Elena (Figure 8A). The second dynamic was associated with areas where new forest patches were aggregated to existing ones, which caused an increase in patch size and mean patch size but decreased the number of patches and the reticular fragmentation index. This occurred in the Oro province. The third dynamic occurred in the Guayaquil province (Figure 8B), where although mangrove forest area increased, fragmentation metrics remained unchanged, indicating a mixture of the two previous trends. The ecological functionality of mangrove ecosystems is likely to be compromised in locations where positive or negative changes in fragmentation metrics coincide with loss or gain in area. As a result, mangrove functionality is likely to have been compromised in regions that have been identified as hotspots of mangrove cover loss or fragmentation [43].
One of the negative effects of fragmentation and deforestation is the loss of connectivity, which is essential for the preservation, stability, and integrity of natural ecosystem biodiversity and must be taken into consideration when conserving ecosystems [44]. However, it has also been shown that in certain fragmentation processes, where the patch area increases and new patches are created, connectivity can increase. It should be considered that fragmentation of a landscape is manifested by different effects, such as an increase in the number of patches, a decrease in their size, an increase in the isolation between them, and changes in the shape of the patches [30,45]. It is always important to carry out multi-temporal studies for a better perspective on land use during the period under study. As a result, understanding the temporal evolution of fragmentation is extremely helpful when making decisions and determining the drivers causing fragmentation processes [46]. In this study, it was evident that mangrove forests recovered in some locations in Ecuador. New remote-sensing products such as the Global Mangrove Watch (GMW) dataset, which measures both forest loss and recovery globally, have shown to be very useful in studies designed to better comprehend how mangrove expansion may reconnect fragmented regions over the long term [47].
Fragmentation is a process unrelated to habitat loss and therefore unrelated to habitat gain; it is what is known as “fragmentation per se” [48]. According to our results, Ecuadorian mangrove forests are recovering, but this recovery has two opposite effects: increasing and decreasing fragmentation. In the process of increasing fragmentation, the number of patches increased, decreasing the size of patches and increasing the RFI; this process for example occurred in the Galapagos Islands. On the other hand, some mangrove forests showed a decrease in fragmentation, where there was a decrease in the number of patches and RFI and an increase in patch size. These results may seem contradictory. However, this was because fragmentation has been studied in very homogeneous mangrove ecosystems growing in coastal areas or estuaries. Classical fragmentation metrics may not be very efficient in these types of ecosystems [46], which could explain why the RFI was high in the best-conserved provinces.
The loss of coastal protection is perilous for the conservation of Ecuador’s ecosystems. According to Collins et al. [49], the lack of coastal protection caused by mangrove deforestation is likely to worsen as sea levels rise and intensification of tropical storms caused by climate change continues. In addition, high intertidal levels are obstructed by aquaculture ponds, which means that the remaining mangrove forests are severely affected by coastal changes, limiting opportunities for landward migration [19,50].

4.3. Connectivity of Mangrove Forests in Ecuador

The connectivity of mangrove forests as a result of long-term changes has increased the number of connected mangrove patches in Ecuador relative to the increase in total mangrove area, and despite the increase of fragmentation. Along river and aquaculture channels destined for pools, often only a narrow strip of mangrove or even a few unconnected mangrove forests remain. This process occurs, for example, in the province of Guayas due to its high increase in shrimp farming activity and lack of land use control. According to Ortega-Pacheco et al. [51], in the 1980s and 1990s the major threat to this riparian system was the replacement of mangrove forests by shrimp farming activities, which caused a marked loss of biodiversity in sensitive ecosystems of high priority for preservation worldwide.
We observed that the global and local connectivity of Ecuadorian mangrove forests increased throughout Ecuador and in all provinces. Connectivity is fundamental for processes such as species dispersal and migration, development of population genetic structure, source–sink dynamics, and possible responses to climate change [52]. Increased fragmentation can lead to increased connectivity, creating more heterogeneous landscapes [53]. However, the increase in fragmentation can be due to two different dynamics. In one, new patches are created in areas close to existing patches, fostering new connections and creating more corridors between patches; therefore, species are more likely to benefit from improved connectivity [54]. The second dynamic is that recovery areas (new patches) are created in areas far from existing ones; these areas will have more difficulty recovering and maintaining their biodiversity [55]. This is observed by increasing the number of components, which occurred especially in the Galapagos Islands. This is the reason why the average connectivity of the patches in the Galapagos decreased, because new mangrove areas were very poorly connected to other mangrove areas, presenting low connectivity per patch and decreasing the average connectivity between 1996 and 2020. Nevertheless, although these patches were poorly connected, they had a positive influence on global connectivity [56].

4.4. Implications for Mangrove Conservation

Keeping in mind our results, in order to achieve sustainable mangrove management, practices that cause ecological degradation should be replaced by more sustainable ones [57]. The public and national governments increasingly appreciate mangrove forests, even though they have historically been regarded as unproductive environments [58]. In South America, for instance, all mangrove forests in Ecuador are now protected in some way [59], and a recent study of Brazilian mangrove forests found that approximately three-quarters of all mangrove forests are protected [60]. From the point of view of environmental conservation in Ecuador, governmental policies should be implemented to continue protecting mangrove ecosystems. Mangrove forests provide habitat for many species, reduce the impact of tides, and stabilize the coastline to mitigate erosion, in addition to forming a natural barrier that reduces environmental impact through mud deposition processes, providing better places for living organisms to settle, and improving the lives of many species. Conversation groups and environmental nongovernmental organizations (NGOs) are leading a new wave of global efforts to preserve, restore, and even expand mangrove forests [61]. To outline realistic and attainable national and international goals, such as the Aichi Biodiversity Targets or those recently established by the Global Mangrove Alliance, accurate figures on the historical and current extent and losses of mangrove forests are required. For an initial overview of previous and more recent efforts to map mangrove forests using various methodologies, the FAO provides synopses of mangrove coverage at the national level. Mangrove forests are now valued as one of the most productive and biodiverse natural resources on the planet, providing humans with valuable ecosystem services [62,63,64].
Land use change in Ecuador has resulted in forest loss and mangrove fragmentation, although conservation efforts are in place. Mangrove forests can recover on their own if natural regeneration is promoted by preserving undisturbed areas and protection initiatives. Remote sensing and GIS have improved large-scale mapping and identification of conservation issues by incorporating changes in mangrove area and measurements of fragmentation and connectivity into monitoring efforts. Through this, we can better understand the ecological impact of fragmentation and guide future research on mangrove restoration and reconnection [65].

5. Conclusions

Our study concluded that mangrove ecosystems in Ecuador have experienced both loss and recovery in recent decades. The Galapagos Islands have seen a significant increase in mangrove cover. However, fragmentation dynamics vary across different provinces of Ecuador, with some areas exhibiting increased fragmentation while others show a decrease. This is related to mangrove connectivity, which varies from one province to another. Our study demonstrated that temporal studies of fragmentation and connectivity are critical for spatial planning and mitigating human impact on mangrove forests. Conservation efforts should consider both the cover changes and the spatial arrangement of mangrove habitats in order to address their complex dynamics and protect these vital ecosystems more effectively.

Supplementary Materials

The following are available online at https://www.mdpi.com/article/10.3390/app13085001/s1, Table S1: Evolution of the IRF in the years 1996,2007,2015 and 2020 by province and change between 1996 and 2020. Table S2: Evolution of the Flux in the years 1996 and 2020 by province and change between 1996 and 2020.

Author Contributions

Conceptualization, J.J.J., R.M.N.-C. and C.A.R.; methodology, R.M.N.-C., C.A.R. and J.J.J.; formal analysis, C.A.R., J.J.J., R.M.N.-C. and J.O.; investigation, J.J.J., R.M.N.-C., J.O. and C.A.R., resources, J.J.J.; data cleaning, J.J.J. and C.A.R.; writing—original draft preparation, R.M.N.-C., J.J.J. and C.A.R.; writing—review and editing, all authors; supervision, R.M.N.-C.; project administration, J.J.J.; acquisition of funding, J.J.J. All authors have read and agreed to the published version of the manuscript.

Funding

This research was funded by SILVADAPT.NET (RED2018-102719-T) and EVIDENCE (Ref: 2822/2021).

Institutional Review Board Statement

Not applicable.

Informed Consent Statement

Not applicable.

Data Availability Statement

The data presented in this study are available on request from the corresponding author. The data are not publicly available due to institutional restrictions.

Acknowledgments

We would like to acknowledge support provided by SILVADAPT.NET (RED2018-102719-T) and EVIDENCE (Ref: 2822/2021). We would also like to acknowledge the financial and institutional support of the University of Cordoba-Campus de Excelencia CEIA3.

Conflicts of Interest

The authors declare no conflict of interest.

References

  1. Taubert, F.; Fischer, R.; Groeneveld, J.; Lehmann, S.; Müller, M.S.; Rödig, E.; Wiegand, T.; Huth, A. Global patterns of tropical forest fragmentation. Nature 2018, 554, 519–522. [Google Scholar] [CrossRef]
  2. Grantham, H.S.; Duncan, A.; Evans, T.D.; Jones, K.R.; Beyer, H.L.; Schuster, R.; Walston, J.; Ray, J.C.; Robinson, J.G.; Callow, M.; et al. Anthropogenic modification of forests means only 40% of remaining forests have high ecosystem integrity. Nat. Commun. 2020, 11, 5978. [Google Scholar] [CrossRef]
  3. Ramírez-Delgado, J.P.; Di Marco, M.; Watson, J.E.; Johnson, C.J.; Rondinini, C.; Corredor Llano, X.; Arias, M.; Venter, O. Matrix condition mediates the effects of habitat fragmentation on species extinction risk. Nat. Commun. 2022, 13, 595. [Google Scholar] [CrossRef]
  4. Anjos, L.J.; de Souza, E.B.; Amaral, C.T.; Igawa, T.K.; de Toledo, P.M. Future projections for terrestrial biomes indicate widespread warming and moisture reduction in forests up to 2100 in South America. Glob. Ecol. Conserv. 2021, 25, e01441. [Google Scholar] [CrossRef]
  5. Duke, N.C.; Meynecke, J.O.; Dittmann, S.; Ellison, A.M.; Anger, K.; Berger, U.; Cannicci, S.; Diele, K.; Ewel, K.C.; Field, C.D.; et al. A world without mangroves? Science 2007, 317, 41–42. [Google Scholar] [CrossRef] [PubMed]
  6. Giri, C.; Ochieng, E.; Tieszen, L.L.; Zhu, Z.; Singh, A.; Loveland, T.; Masek, J.; Duke, N. Status and distribution of mangrove forests of the world using earth observation satellite data. Glob. Ecol. Biogeogr. 2011, 20, 154–159. [Google Scholar] [CrossRef]
  7. Leal, M.; Spalding, M.D. The State of the World’s Mangroves. 2022. Available online: https://www.mangrovealliance.org/wp-content/uploads/2022/09/The-State-of-the-Worlds-Mangroves-Report_2022.pdf (accessed on 13 November 2022).
  8. Tomlinson, P.B. The Botany of Mangroves; Cambridge University Press: Cambridge, UK, 2016. [Google Scholar]
  9. Hilty, J.; Worboys, G.L.; Keeley, A.; Woodley, S.; Lausche, B.J.; Locke, H. Guidelines for Conserving Connectivity through Ecological Networks and Corridors; IUCN: Gland, Switzerland, 2020. [Google Scholar]
  10. Hogarth, P.J. The Biology of Mangroves; Oxford University Press: Oxford, UK, 1999. [Google Scholar]
  11. Hamilton, S.E.; Friess, D.A. Global carbon stocks and potential emissions due to mangrove deforestation from 2000 to 2012. Nat. Clim. Chang. 2018, 8, 240–244. [Google Scholar] [CrossRef]
  12. Gorman, D. Historical losses of mangrove systems in South America from human-induced and natural impacts. In Threats to Mangrove Forests: Hazards, Vulnerability, and Management; Springer: Berlin/Heidelberg, Germany, 2018; pp. 155–171. [Google Scholar]
  13. Blanco-Libreros, J.F.; Estrada-Urrea, E.A. Mangroves on the edge: Anthrome-dependent fragmentation influences ecological condition (Turbo, Colombia, Southern Caribbean). Diversity 2015, 7, 206–228. [Google Scholar] [CrossRef]
  14. Polidoro, B.A.; Carpenter, K.E.; Collins, L.; Duke, N.C.; Ellison, A.M.; Ellison, J.C.; Farnsworth, E.J.; Fernando, E.S.; Kathiresan, K.; Koedam, N.E.; et al. The loss of species: Mangrove extinction risk and geographic areas of global concern. PLoS ONE 2010, 5, e10095. [Google Scholar] [CrossRef]
  15. Bunting, P.; Rosenqvist, A.; Lucas, R.M.; Rebelo, L.M.; Hilarides, L.; Thomas, N.; Hardy, A.; Itoh, T.; Shimada, M.; Finlayson, C.M. The global mangrove watch—A new 2010 global baseline of mangrove extent. Remote Sens. 2018, 10, 1669. [Google Scholar] [CrossRef]
  16. Murray, N.J.; Worthington, T.A.; Bunting, P.; Duce, S.; Hagger, V.; Lovelock, C.E.; Lucas, R.; Saunders, M.I.; Sheaves, M.; Spalding, M.; et al. High-resolution mapping of losses and gains of Earth’s tidal wetlands. Science 2022, 376, 744–749. [Google Scholar] [CrossRef]
  17. Blanco-Libreros, J.F.; Ramírez-Ruiz, K. Threatened mangroves in the Anthropocene: Habitat fragmentation in urban coastalscapes of Pelliciera spp.(Tetrameristaceae) in northern South America. Front. Mar. Sci. 2021, 8, 670354. [Google Scholar] [CrossRef]
  18. Bryan-Brown, D.N.; Connolly, R.M.; Richards, D.R.; Adame, F.; Friess, D.A.; Brown, C.J. Global trends in mangrove forest fragmentation. Sci. Rep. 2020, 10, 7177. [Google Scholar] [CrossRef] [PubMed]
  19. Foley, J.A.; DeFries, R.; Asner, G.P.; Barford, C.; Bonan, G.; Carpenter, S.R.; Chapin, F.S.; Coe, M.T.; Daily, G.C.; Gibbs, H.K.; et al. Global consequences of land use. Science 2005, 309, 570–574. [Google Scholar] [CrossRef] [PubMed]
  20. Morocho, R.; González, I.; Ferreira, T.O.; Otero, X.L. Mangrove forests in ecuador: A two-decade analysis. Forests 2022, 13, 656. [Google Scholar] [CrossRef]
  21. Ward, R.D.; Friess, D.A.; Day, R.H.; Mackenzie, R.A. Impacts of climate change on mangrove ecosystems: A region by region overview. Ecosyst. Health Sustain. 2016, 2, e01211. [Google Scholar] [CrossRef]
  22. Sócola Sánchez, J.; Corgne, S.; González Bonilla, M. Mangroves of Latin America. In Manglares de América; Moreira, N., Galvis, F., Eds.; Universidad Espíritu Santo: Guayaquil. Ecuador, 2020. [Google Scholar]
  23. López-Rodríguez, F. Mangrove in Ecuador: Conservation and management strategies. In Coastal Environments; IntechOpen: London, UK, 2021. [Google Scholar]
  24. Dahdouh-Guebas, F.; Friess, D.A.; Lovelock, C.E.; Connolly, R.M.; Feller, I.C.; Rogers, K.; Cannicci, S. Cross-cutting research themes for future mangrove forest research. Nat. Plants 2022, 8, 1131–1135. [Google Scholar] [CrossRef] [PubMed]
  25. Lacerda, L.D.; Conde, J.E.; Kjerfve, B.; Alvarez-León, R.; Alarcón, C.; Polanía, J. American mangroves. In Mangrove Ecosystems: Function and Management; Springer: Berlin/Heidelberg, Germany, 2002; pp. 1–62. [Google Scholar]
  26. Puyravaud, J.P. Standardizing the calculation of the annual rate of deforestation. For. Ecol. Manag. 2003, 177, 593–596. [Google Scholar] [CrossRef]
  27. Birch, C.P.; Oom, S.P.; Beecham, J.A. Rectangular and Hexagonal Grids Used for Observation, Experiment and Simulation in Ecology. Ecol. Model. 2007, 206, 347–359. [Google Scholar]
  28. Rempel, R.S.; Kaukinen, D.; Carr, A.P. Patch Analyst and Patch Grid Ontario; Ontario Ministry of Natural Resources, Centre for Northern Forest Ecosystem Research: Thunder Bay, ON, Canada, 2012. [Google Scholar]
  29. Leautaud Valenzuela, P. Fragmentación Forestal de la Reserva Monarca: Cuantificación, Caracterización, y Correlaciones (1990–2010); Universidad Nacional Autónoma de México: Ciudad de México. México, 2014. [Google Scholar]
  30. Rivas, C.A.; Guerrero-Casado, J.; Navarro-Cerillo, R.M. Deforestation and fragmentation trends of seasonal dry tropical forest in Ecuador: Impact on conservation. For. Ecosyst. 2021, 8, 46. [Google Scholar] [CrossRef]
  31. McGarigal, K. FRAGSTATS: Spatial Pattern Analysis Program for Quantifying Landscape Structure; US Department of Agriculture, Forest Service, Pacific Northwest Research Station: Portland, OR, USA, 1995; Volume 351.
  32. Ord, J.K.; Getis, A. Local Spatial Autocorrelation Statistics: Distributional Issues and an Application. Geogr. Anal. 1995, 27, 286–306. [Google Scholar] [CrossRef]
  33. Feng, Y.; Chen, X.; Gao, F.; Liu, Y. Impacts of Changing Scale on Getis-Ord Gi* Hotspots of CPUE: A Case Study of the Neon Flying Squid (Ommastrephes bartramii) in the Northwest Pacific Ocean. Acta Oceanol. Sin. 2018, 37, 67–76. [Google Scholar] [CrossRef]
  34. Cetin, M. Sustainability of urban coastal area management: A case study on Cide. J. Sustain. For. 2016, 35, 527–541. [Google Scholar] [CrossRef]
  35. Foltête, J.C.; Clauzel, C.; Vuidel, A. software tool dedicated to the modelling of landscape networks. Environ. Model. Softw. 2012, 38, 316–327. [Google Scholar] [CrossRef]
  36. Urban, D.; Keitt, T. Landscape connectivity: A graph-theoretic perspective. Ecology 2001, 82, 1205–1218. [Google Scholar] [CrossRef]
  37. Saura, S.; Torné, J. Conefor Sensinode 2.2: A software package for quantifying the importance of habitat patches for landscape connectivity. Environ. Model. Softw. 2009, 24, 135–139. [Google Scholar] [CrossRef]
  38. CLIRSEN. Update of the Multitemporal Study of Mangroves, Shrimp Farms and Saline Areas on the Ecuadorian Continental Coast; Coastal Resource Management Programme (PMRC): Quito, Ecuador, 2006. [Google Scholar]
  39. Bravo, M. Alianza público privada para la gestión de los manglares del Ecuador; USAID Sustainable Coasts and Forests: Quito, Ecuador, 2013.
  40. Ferrer-Paris, J.R.; Zager, I.; Keith, D.A.; Oliveira-Miranda, M.A.; Rodríguez, J.P.; Josse, C.; González-Gil, M.; Miller, R.M.; Zambrana-Torrelio, C.; Barrow, E. An ecosystem risk assessment of temperate and tropical forests of the Americas with an outlook on future conservation strategies. Conserv. Lett. 2019, 12, e12623. [Google Scholar] [CrossRef]
  41. Santillán, X.; Rosero, P. Proceso histórico de creación del Plan de Acción Nacional para la conservación de los manglares del Ecuador continental como herramienta de gestión. In Primer Congreso Manglares de América; Universidad Espíritu Santo: Guayaquil, Ecuador, 2019. [Google Scholar]
  42. Rodríguez, F.V. Mangrove concessions: An innovative strategy for community mangrove conservation in Ecuador. In Threats to Mangrove Forests: Hazards, Vulnerability, and Management; Springer: Berlin/Heidelberg, Germany, 2018; pp. 557–578. [Google Scholar]
  43. Thornton, H.; Branch, L.C.; Sunquist, E. The influence of landscape, patch, and within-patch factors on species presence and abundance: A review of focal patch studies. Landsc. Ecol. 2011, 26, 7–18. [Google Scholar] [CrossRef]
  44. Turschwell, M.P.; Tulloch, V.J.; Sievers, M.; Pearson, R.M.; Andradi-Brown, D.A.; Ahmadia, G.N.; Connolly, R.M.; Bryan-Brown, D.; Lopez-Marcano, S.; Adame, M.F.; et al. Multi-scale estimation of the effects of pressures and drivers on mangrove forest loss globally. Biol. Conserv. 2020, 247, 108637. [Google Scholar] [CrossRef]
  45. Kanniah, K.D.; Kang, C.S.; Sharma, S.; Amir, A.A. Remote sensing to study mangrove fragmentation and its impacts on leaf area index and gross primary productivity in the South of Peninsular Malaysia. Remote Sens. 2021, 13, 1427. [Google Scholar] [CrossRef]
  46. Rivas, C.A.; Guerrero-Casado, J.; Navarro-Cerrillo, R.M. A new combined index to assess the fragmentation status of a forest patch based on its size, shape complexity, and isolation. Diversity 2022, 14, 896. [Google Scholar] [CrossRef]
  47. Zulfiqar, A.; Ghaffar, M.M.; Shahzad, M.; Weis, C.; Malik, M.I.; Shafait, F.; Wehn, N. AI-ForestWatch: Semantic segmentation based end-to-end framework for forest estimation and change detection using multi-spectral remote sensing imagery. J. Appl. Remote Sens. 2021, 15, 024518. [Google Scholar] [CrossRef]
  48. Fahrig, L. Effects of Habitat Fragmentation on Biodiversity. Annu. Rev. Ecol. Evol. Syst. 2003, 34, 487–515. [Google Scholar] [CrossRef]
  49. Collins, S.; Hamilton, E. Livelihood responses to mangrove deforestation in the northern provinces of Ecuador. Bosque 2013, 34, 143–153. [Google Scholar]
  50. Cohen, M.C.; Rodrigues, E.; Rocha, D.O.; Freitas, J.; Fontes, N.A.; Pessenda, L.C.; de Souza, A.V.; Gomes, V.L.; França, M.C.; Bonotto, D.M.; et al. Southward migration of the austral limit of mangroves in South America. Catena 2020, 195, 104775. [Google Scholar] [CrossRef]
  51. Ortega-Pacheco, D.; Mendoza-Jimenez, M.J.; Herrera, P. Mangrove Conservation Policies in the Gulf of Guayaquil. In Handbook of Climate Change and Biodiversity; Springer: Berlin/Heidelberg, Germany, 2019; pp. 25–43. [Google Scholar]
  52. Kool, J.T.; Moilanen, A.; Treml, E.A. Population connectivity: Recent advances and new perspectives. Landsc. Ecol. 2013, 28, 165–185. [Google Scholar] [CrossRef]
  53. Tabor, G.; Bankova-Todorova, M.; Correa Ayram, C.A.; Garcia, L.C.; Kapos, V.; Olds, A.; Stupariu, I. Ecological connectivity: A bridge to preserving biodiversity. In Frontiers 2018/19 Emerging Issues of Environmental Concern; Emerging, I., Ed.; United Nations Environment Programme: Nairobi, Kenya, 2019. [Google Scholar]
  54. Bailey, S. Increasing connectivity in fragmented landscapes: An investigation of evidence for biodiversity gain in woodlands. For. Ecol. Manag. 2007, 238, 7–23. [Google Scholar] [CrossRef]
  55. Navarro-Cerrillo, R.M.; Rivas, C.A.; Quinto, L.; Navarro, S.H.; Varo-Martínez, M.Á.; Palacios-Rodríguez, P. Afforestation on agricultural land in southern Spain: An important driver to improve forest landscape connectivity. New For. 2022, 1–24. [Google Scholar] [CrossRef]
  56. Tulloch, A.I.; Barnes, M.D.; Ringma, J.; Fuller, R.A.; Watson, J.E. Understanding the importance of small patches of habitat for conservation. J. Appl. Ecol. 2016, 53, 418–429. [Google Scholar] [CrossRef]
  57. Field, R.D.; Parrott, L. Multi-ecosystem services networks: A new perspective for assessing landscape connectivity and resilience. Ecol. Complex. 2017, 32, 31–41. [Google Scholar] [CrossRef]
  58. Li, F.; Liu, X.; Zhang, X.; Zhao, D.; Liu, H.; Zhou, C.; Wang, R. Urban ecological infrastructure: An integrated network for ecosystem services and sustainable urban systems. J. Clean. Prod. 2017, 163, S12–S18. [Google Scholar] [CrossRef]
  59. Primavera, H. Mangroves, Fishponds, and the Quest for Sustainability. Science 2000, 310, 57–59. [Google Scholar] [CrossRef] [PubMed]
  60. Ellison, A.M.; Farnsworth, E.J. Anthropogenic Disturbance of Caribbean Mangrove Ecosystems: Past Impacts, Present Trends, and Future Predictions. Biotropica 1996, 28, 549–565. [Google Scholar] [CrossRef]
  61. Hamilton, S.E.; Lovette, J. Ecuador’s mangrove forest carbon stocks: A spatiotemporal analysis of living carbon holdings and their depletion since the advent of commercial aquaculture. PLoS ONE 2015, 10, e0118880. [Google Scholar] [CrossRef] [PubMed]
  62. Magris, R.A.; Barreto, R. Mapping and assessment of protection of mangrove habitats in Brazil. Pan Am. J. Aquat. Sci. 2010, 5, 546–556. [Google Scholar]
  63. López-Portillo, J.; Lewis, R.R., III; Saenger, P.; Rovai, A.; Koedam, N.; Dahdouh-Guebas, F. Mangrove Ecosystems: A Global Biogeographic Perspective; Springer: Berlin/Heidelberg, Germany, 2017. [Google Scholar]
  64. Brander, M.; Wagtendonk, J.; Hussain, S.; McVittie, H.; Verburg, H.; De Groot, S. Ecosystem service values for mangroves in Southeast Asia: A meta-analysis and value transfer application. Ecosyst. Serv. 2012, 12, 62–69. [Google Scholar] [CrossRef]
  65. Wang, L.; Jia, M.; Yin, D.; Tian, J. A review of remote sensing for mangrove forests: 1956–2018. Remote Sens. Environ. 2019, 231, 111223. [Google Scholar] [CrossRef]
Figure 1. Study area: (A) Geographical location of Ecuador; (B) insular and coastal region of Ecuador; (C) provinces with mangrove presence.
Applsci 13 05001 g001
Figure 2. Sankey matrix with the evolution of the reticular fragmentation index of Ecuadorian mangrove forests in the years 1996, 2007, 2015, and 2020.
Applsci 13 05001 g002
Figure 3. Spatial evolution of RFI in each period. (A) Galapagos province. (B) Ecuadorian coastal profile.
Applsci 13 05001 g003
Figure 4. Reticular fragmentation index changes of mangrove forests in the years 1996, 2007, 2015, and 2020 by province.
Applsci 13 05001 g004
Figure 5. Comparison of the hot and cold spots of Ecuadorian mangrove forests by means of Getis–Ord Gi* analysis in the years 1996 and 2020. Zone (A) corresponds to the Galapagos and zone (B) to the continental coast.
Applsci 13 05001 g005
Figure 6. Connectivity of Ecuadorian mangrove forests per patch in the years 1996 and 2020. The size of the circle indicates the size of the patch and the color its connectivity. (A) Galapagos. (B) Guayas and the El Oro region. (C) North of Manabí and Esmeraldas.
Applsci 13 05001 g006
Figure 7. Average connectivity of mangrove forests per patch in the years 1996 and 2020 by province.
Applsci 13 05001 g007
Figure 8. Differences between mangrove area in 1996 and 2020. (A) Eastern part of Santa Cruz Island, in the Galapagos Islands; (B) mouth and estuary of the Guayas River.
Applsci 13 05001 g008
Table 1. Description of the fragmentation metrics [30,31].
ParameterNameDefinitionUnit
Number of PatchesNumPTotal number of patches inside the tiles. The more patches there are, the more fragmented the forest is considered to be.Number
Class areaCASum of areas of all patches belonging to a hexagon.m2
Median patch sizeMPSThe average patch size of the forest within the tile. A smaller average forest patch size is considered indicative of a more fragmented forest.m2
Total edgeTEPerimeter of patches within each tile. The greater the perimeter, the more exposed to disturbances. Greater TE patches may be associated with more fragmented forests (if the fragmentation is related to an anthropogenic disturbance).m
Edge densityEDAmount of edge (km) relative to the forest area (km2) within the tile.
ED = TE/CA
A high ratio of perimeter to forest patch area may be associated with more fragmented forests (if fragmentation is related to anthropogenic disturbance).
m/m2
Edge density percentageEDEdge percentage relative to landscape area. A high ratio of perimeter to forest patch area may be associated with more fragmented forests (if fragmentation is related to anthropogenic disturbance).%
Percentage without forestPSBNon-mangrove area (%) without forest within the tile. Higher percentage of area without forest within the tile would indicate greater fragmentation.%
Reticular fragmentation indexRFIReticular fragmentation index of each tile.
RFI = P S B % + D B % 2
A higher RFI means a greater percentage of fragmentation within the tile.
%
Table 2. Description of connectivity metrics analyzed according to Foltête et al. [35].
MetricLevelFormulaMeaningReferences
Flux (F)Global level and component level F = i = 1 n j = 1 J i n a j β e a d i j Sum of potential dispersion from all patches.[32,33,34]
Equivalent probability (EC)Global level E C = i = 1 n j = 1 n a i a j e a d i j Square root of the sum of the products of the capacity of all pairs of patches weighted by their interaction probability.[35]
Probability of connectivity (PC)Global level P C = 1 A 2 i = 1 n j = 1 n a i a j e a d i j Sum of the products of the capacity of all pairs of patches weighted by their interaction probability, divided by the square of the area of the study zone. This ratio is equivalent to the probability that two points randomly placed in the study area are connected.[36]
Number of components (NC)Global levelNC = ncNumber of components of the graph.[37]
where: N: number of patches, nc: number of components, nk: number of patches in component k, Ni: all patches close to the patch I, ai: capacity of patch i (generally the surface area), ack: capacity of component k (sum of the capacity of the patches composing k), A: area of the study zone, dij: distance between patches i and j (generally the least-cost distance between them), e−αdij: probability of movement between patches i and j, α = brake on movement distance, β = exponent to weight more or less capacity.
Table 3. Deforestation rate and area per province in the years 1996, 2007, 2015, and 2020.
Year
Provinces 1996200720152020
El OroArea (km2)177.30153.81152.09189.18
Deforestation rate −1.29−0.144.36
ManabíArea (km2)35.8328.0824.9431.70
Deforestation rate −2.22−1.484.80
GuayasArea (km2)973.24958.63954.771008.16
Deforestation rate −0.14−0.051.09
GalapagosArea (km2)25.1725.1725.1051.72
Deforestation rate 0.00−0.0314.46
EsmeraldasArea (km2)235.13223.51222.32240.31
Deforestation rate −0.46−0.071.56
Santa ElenaArea (km2)0.000.000.000.23
Deforestation rate
TotalArea (km2)1446.681389.201379.221521.30
Deforestation rate −0.37−0.091.96
Table 4. Variation between 1990 and 2018 as regards the values obtained for the different fragmentation indicators, by province.
El OroEsmeraldasManabíGuayasGalapagosSanta Elena
199620201996202019962020199620201996202019962020
No. of tesserae92941041244953363379112285 1
No. of patchesMedia25.2121.4319.1117.3935.7922.3411.8612.563.738.21 4.00
Median23.0018.0011.0013.0026.0018.008.0010.003.006.00
D.E17.4515.0224.3817.1034.0918.5612.7010.622.697.52
CAMedia1,946,635.912,010,785.002,227,188.181,903,931.99802,363.64652,096.312,681,125.612,660,761.05224,724.32181,408.21 230,058.70
Median1,696,904.731,913,977.321,132,075.13781,943.33635,734.56414,483.581,970,581.361,932,550.15106,937.5665,810.02
D.E1,593,176.851,506,126.982,297,435.832,238,564.03819,943.25736,706.882,573,196.572,529,074.78316,142.77299,890.39
MPS Media120,265.85131,660.95217,648.19150,965.3243,065.6331,498.59505,207.61397,775.0858,117.4233,335.31 57,514.67
Median64,866.7778,361.8178,157.1642,940.8719,371.3018,717.56150,966.99150,113.0234,562.5511,424.89
D.E238,725.94167,385.28325,148.44224,003.1070,260.6435,848.341,018,677.41682,903.9286,536.6595,691.39
Total edge Media37,849.2133,280.2935,647.8327,103.3624,768.8931,498.5925,837.5724,884.245351.225178.30 5718.37
Median34,134.5635,437.5029,639.0520,507.5722,274.1718,717.5625,575.4723,836.673929.992986.24
D.E27,322.8020,924.4728,386.3223,556.5320,868.2435,848.3418,518.4517,091.425252.645483.67
Edge densityMedia0.030.030.030.030.050.050.020.030.170.06 0.02
Median0.020.020.030.030.040.040.020.010.040.05
D.E0.020.020.020.030.040.060.040.041.290.05
Table 5. Global connectivity in the years 1996 and 2020.
19962020Δ 2020−1996
Flux7.06 × 10119.37 × 101132.62
EC5.38 × 1085.52 × 1082.51
PC4.86 × 10−75.01 × 10−73.15
NC303516.67
Disclaimer/Publisher’s Note: The statements, opinions and data contained in all publications are solely those of the individual author(s) and contributor(s) and not of MDPI and/or the editor(s). MDPI and/or the editor(s) disclaim responsibility for any injury to people or property resulting from any ideas, methods, instructions or products referred to in the content.