Abstract
A reliable high-performance liquid chromatography-tandem mass spectrometry (HPLC-MS/MS) method was established for the simultaneous detection of zearalenone-14-glucoside (ZEN-14G) and its metabolite, zearalenone (ZEN), in the plasma, urine, and various tissues of rats. The performance of the developed method was validated by determining the selectivity, linearity (R2 > 0.99), sensitivity (lower limit of quantification, 0.1–1 μg/L), recovery (80.7 ± 3.0–112.3 ± 3.1%), precision (0.6–16.5%), and stability (81.7 ± 1.7–104.1 ± 3.9%). Through use of the methodological advances, the subsequent kinetics and distribution after administration of ZEN-14G by gavage were thoroughly investigated. ZEN-14G and ZEN exhibited similar trends in the plasma, and reached their peak concentrations at 10 min and then rapidly decreased. ZEN-14G could be quantified in the stomach, small intestine, and large intestine 24 h after administration, while ZEN was detectable in all tested tissues. Interestingly, ZEN-14G (7.6 ± 3.0 μg/L) and ZEN (977.5 ± 98.0 μg/L) were also detected in the urine 24 h after administration, indicating that ZEN-14G was prone to be slowly and continuously hydrolyzed into ZEN to be absorbed into the plasma and distributed to various tissues, thus leading to a cumulative exposure. Continuous attention should be paid to the co-exposure of ZEN and ZEN-14G, which might pose additional health risks to humans and animals.
1. Introduction
Zearalenone (ZEN), mainly produced by F. graminearum and other Fusarium species, is one of the most important mycotoxins frequently found in maize, barley, wheat, and compound feeds (poultry, pig, dairy, cattle, and pet feeds) [1,2,3,4]. A number of toxicities were revealed to be associated with ZEN, including teratogenicity, mutagenicity, nephrotoxicity, immunotoxicity, genotoxicity, and carcinogenicity [5]. It is also an estrogen analogue, which can affect the reproductive system and lead to abnormal reproductive functions [6,7,8,9]. Due to its widespread occurrence and high toxicity, the maximum regulation level of 100–3000 μg/kg has been set for ZEN in feeds and feed materials by the European Union (EU) [10]. The European Food Safety Authority (EFSA) set a tolerable daily intake (TDI) for ZEN of 0.25 μg/kg body weight (BW) per day [11].
In recent years, masked mycotoxins generated by plants during detoxification have aroused more and more attention due to their potential toxicities and the difficulties in their detection [12,13,14]. As a masked form of ZEN, zearalenone-14-glucoside (ZEN-14G) was discovered to occur in grains such as maize (16.7%), barley (17.6%), and rice bran (60%), with the levels ranging from 1.3 μg/kg to 274 μg/kg [15,16,17]. Common foods such as fiber-enriched bread (29%), oatmeal (38%), and breakfast cereals (40%) were also contaminated with ZEN-14G [18]. ZEN-14G frequently co-occurs with ZEN in wheat (42%) and various feed products (formula feed, concentrated feed, and premixed feed) (35%) at concentration ranges of 17–104 μg/kg and 0.89–15.31 μg/kg, respectively [19,20]. Although it has low toxicity, ZEN-14G could be converted to ZEN within the digestive tract of mammals, posing potential health risks to humans and/or animals [21,22,23]. Therefore, the European Commission declared that it is essential to assess the exposure of ZEN-14G apart from ZEN [24].
In recent years, comprehensive investigations on the absorption, distribution, metabolism, and excretion of ZEN have been extensively conducted in different animal species [25,26,27]. Among them, pigs were reported by Biehl et al. to have absorption ratios of approximately 80–85%, and Fleck et al. revealed that the absolute oral bioavailability was about 51.5% [25,28]. In comparison, fewer studies could be found on ZEN-14G. An in vitro study carried out by Cirlini et al. clearly indicated that ZEN-14G could pass through the cell barrier to be absorbed by a human colorectal cancer cell line (Caco-2) and further converted into ZEN [29]. Dellafiora et al. revealed that ZEN-14G could be absorbed into a human breast cancer cell line (MCF-7) and cleaved to ZEN by an estrogen-sensitive cell culture [30]. Additionally, as reported, more than 97% of ZEN-14G could be rapidly and efficiently hydrolyzed to ZEN by the colonic microbiota, and even completely cleaved after 24 h of fecal fermentation [12,31]. The investigations of Yang et al. indicated that ZEN-14G could be deglucosylated into ZEN in the liver microsomes of several animals (swine, rats, goats, cows, and chickens) and humans [32]. However, knowledge of the in vivo kinetics and transformations of ZEN-14G are still insufficient, hindering the assessment of the exposure risks to humans and animals related to this masked mycotoxin.
The development of reliable and sensitive analytical technologies is the primary requirements for investigations into the in vivo kinetics and distributions of ZEN-14G and its metabolite, ZEN. Various analytical methods have been developed to detect ZEN, including the enzyme-linked immunosorbent assay (ELISA), thin-layer chromatography (TLC), gas chromatography–mass spectrometry (GC-MS), and high-performance liquid chromatography–tandem mass spectrometry (HPLC-MS/MS) [25,33,34]. ELISA provides high sensitivity, but it only serves as a supplementary method due to its erratic accuracy and the possibility of cross-reactivity [35,36]. Although it is simple and rapid, the unsatisfactory accuracy and poor separation of TLC limit its application [37,38]. Detection by GC-MS is a frequently used method, but requires critical and time-consuming derivatization steps [39]. HPLC-MS/MS is regarded as the most promising tool because of its high selectivity and sensitivity [40,41,42]. However, the current analytical methods can barely be utilized for the simultaneous detection of ZEN and ZEN-14G in various biomatrices due to the great challenges posed by their different polarities, along with the significant matrix effects.
In the current study, a rapid and sensitive HPLC-MS/MS method was established for the simultaneous detection of ZEN and ZEN-14G in the plasma, urine, and various tissues of rats, i.e., the liver, kidney, stomach, small intestine, large intestine, and ovary. The greatest advantage of this proposed analytical method was that identical conditions could be utilized for analyzing ZEN and ZEN-14G in all the above mentioned biomatrices to achieve high sensitivity, accuracy, and reliability. Through use of the methodological advantages, the kinetics and tissue distribution of ZEN-14G after oral administration to rats was successfully investigated.
2. Materials and Methods
2.1. Reagents and Chemicals
ZEN-14G was acquired from HPC Standards GmbH (Borsdorf, Germany). ZEN was bought from Sigma-Aldrich (Saint Louis, MO, USA). Acetonitrile and methanol are commercially available from Merck (Darmstadt, Germany). Milli-Q quality water was used for analysis (Millipore, Billerica, MA, USA). The chemical reagents used were of either HPLC or analytical grade.
2.2. Animal Trials
Sprague–Dawley rats (female, 200–250 g, 6–8 weeks) were bought from Shanghai Jihui Laboratory Animal Care Co., Ltd. (Shanghai, China). The rats were kept for a week at a relative humidity of 50–65%, a temperature of 22 ± 3 °C, and a dark/light cycle of 12 h to adapt them to the experimental environments. They were subjected to 12-hour fasting before administration of the gavage. The control group was given a normal diet without any treatment, while the experimental group, reared in independent metabolic cages, was administered ZEN-14G dissolved in an ethanol aqueous solution (25%, v/v) (4 mg/kg BW, n = 3) by gavage. No adverse effects were observed in the rats after administration by gavage. The animal experiments were conducted in accordance with the Laboratory Animal Ethics Committee of the Shanghai Academy of Agricultural Science (Shanghai, China) (SAASPZ0921015).
2.3. Sample Collection
After analysis by the developed HPLC-MS/MS method, the samples of plasma, different tissues, and urine obtained from the control group were free from ZEN or ZEN-14G, and were thus used as the blank matrices to establish and validate the analytical method (Figure 1A).

Figure 1.
MRM chromatograms of zearalenone (ZEN) and zearalenone-14-glucoside (ZEN-14G) in blank plasma, small intestine, and urine samples (A); plasma, small intestine, and urine samples spiked with ZEN and ZEN-14G at the level of 20 μg/L (B); and the plasma samples gathered at 10 min, small intestine samples gathered at 24 h, and urine samples gathered at 6 h after the administration of ZEN-14G by gavage (4 mg/kg body weight) in rats (C).
Plasma samples were individually collected from rats via the tail vein at 5, 10, 15, 30, 60, 120, 240, 480, and 1440 min after the administration of ZEN-14G by gavage (4 mg/kg BW). The supernatant was transferred into K2-ethylenediaminetetraacetic acid (EDTA) tubes (Becton Dickinson and Co., Franklin Lakes, NJ, USA) after centrifugation (800× g, 4 °C, 20 min) and kept at −20 °C. Urine was collected for the periods 0–6 h, 6–12 h, and 12–24 h after administration and stored at −20 °C. All rats were sacrificed 24 h after administration, and the liver, kidney, stomach, small intestine, large intestine, and ovary were collected. After harvesting, the tissues were rinsed with saline, individually homogenized with triple volumes of normal saline, and stored at −20 °C until analysis.
2.4. Sample Preparation
The samples of the plasma, urine, and tissue homogenates (200 μL) were ultrasonically extracted (Shanghai Ampu Experimental Technology Co., Ltd., Shanghai, China) with 1 mL of formic acid/acetonitrile (1/99, v/v) for 10 min at 40 °C, followed by vortexing (Bono Biotechnology Co., Ltd., Shanghai, China) for 5 min. After centrifugation (13,000× g, 5 min) (Eppendorf, Hamburg, Germany), the supernatant was gathered and dried at 40 °C with nitrogen (Organomation Associates, Inc., Dublin, OH, USA). The residues were redissolved in a 200 µL acetonitrile–water mixture containing 5 mmol/L ammonium acetate (30/70, v/v), filtered through a 0.22 μm nylon filter (Pall, Port Washington, NY, USA), and stored for analysis.
2.5. HPLC-MS/MS Analysis
The target analytes were separated by a Waters ACQUITY UPLC system at 40 °C using an XBridge® C18 column XP (3.0 × 100 mm, 2.5 μm) (Waters, Milford, MA, USA). A linear gradient elution program using a mobile phase consisting of (A) methanol and (B) water containing 5 mmol/L ammonium acetate was set as follows: 0–1 min, 10% A; 1–6 min, 90% A; 6–6.5 min, 90% A; 6.5–6.7 min, 10% A; 6.7–8 min, 10% A. The injection volume was 3 μL and the flow rate was 0.4 mL/min.
The MS/MS acquisition was realized by a Triple-Quad™ 5500 mass spectrometer equipped with an electrospray ionization (ESI) interface operating in both negative (ESI−) and positive (ESI+) modes (AB SCIEX, Foster City, CA, USA). The analysis was conducted with the following parameters: ion spray voltage, 4.5–5.5 kV; source temperature, 450 °C; curtain gas pressure, 35 psi; nebulizer gas, 50 psi; turbo gas pressure, 50 psi. ZEN and ZEN-14G were quantitatively analyzed by multiple reaction monitoring (MRM) (Table 1). Data were processed and analyzed with MultiQuant 3.0.2 software (AB SCIEX, Foster City, CA, USA).

Table 1.
MS/MS parameters of the masked mycotoxin zearalenone-14-glucoside (ZEN-14G) and its metabolite, zearalenone (ZEN).
2.6. Method Validation
The newly developed method was validated by examining the selectivity, the lower limit of detection (LLOD), the lower limit of quantification (LLOQ), linearity, recovery, precision, and stability according to the FDA guidelines [43]. The blank matrices, the matrices spiked with ZEN and ZEN-14G (20 μg/L), and the real collected samples after administration of ZEN-14G by gavage were investigated to illustrate the selectivity of the developed method. Standard solutions with concentrations of 0.1, 0.2, 0.5, 1, 2, 5, 10, 20, 50, 100, and 200 μg/L for ZEN and ZEN-14G were prepared in the blank matrices of the plasma, liver, kidney, stomach, small intestine, large intestine, ovary, urine and acetonitrile–water containing 5 mmol/L ammonium acetate (30/70, v/v). The responses of MS (peak areas) to the concentrations of the analytes were plotted to construct the calibration curves (1/x weighted). The ratio of the slope of the matrix-matched calibration curve to that of pure solvent was calculated to illustrate the matrix effect (signal suppression/enhancement, SSE). The sensitivity was expressed as the LLOD and LLOQ. The LLOQ was defined as the lowest concentration of the calibration curve that acquired a signal-to-noise ratio (S/N) value of 10, with the precision within 20%, and an accuracy of 80–120%. The LLOD was obtained by dividing the LLOQ by 3.
Samples of blank plasma, urine, and various tissues spiked with ZEN and ZEN-14G at the LLOQ, and low (5 μg/L), intermediate (20 μg/L), and high (50 μg/L) levels were used for the recovery, precision, and stability tests (n = 5). Equation (1) was used to calculate the recovery through a comparison of the detected concentrations with the ideal (spiked) levels of each analyte [44]. The relative standard deviation (RSD) measured within one day and on five consecutive days represented the intra-day and inter-day precision, respectively. Plasma, urine, and various tissue samples containing ZEN and ZEN-14G at the LLOQ and low, intermediate, and high concentrations were determined to assess the short-term (room temperature, 8 h), long-term (−20 °C, 20 days), and freeze–thaw (three cycles) stability.
Recovery = Concentration measured/Concentration spiked × 100%
2.7. Statistical Analysis
Toxicokinetic data were processed by the non-compartmental method with WinNonlin 8.1 software (Pharsight Co., Mountain View, CA, USA). SPSS 27 software (SPSS Inc., Chicago, IL, USA) was applied for statistical analyses of the data.
3. Results and Discussion
3.1. Optimization of the HPLC Conditions
The HPLC conditions were carefully optimized according to our previously described protocols [20]. The results revealed that a methanol–water mixture containing 5 mmol/L ammonium acetate resulted in the highest ionization efficiency and good peak shapes for both analytes (Supplemental Figures S1 and S2).
3.2. Optimization of Sample Preparation
3.2.1. Sample Extraction
Three candidate extraction solvents, i.e., methanol, acetone, and acetonitrile, were compared in spiked plasma (50 μg/L). The extraction recovery (RE) was determined by Equation (2) [45]. As shown in Figure 2A, when methanol and acetone were utilized, the recovery of ZEN-14G was above 85%, but ZEN achieved relatively lower recovery levels (only 79.1 ± 2.1% for methanol and 78.3 ± 3.6% for acetone). The highest RE values (ZEN: 91.7 ± 5.8%; ZEN-14G: 90.9 ± 7.0%) were found for acetonitrile. Studies have reported that an acidic medium would break the chemical bonds between the analyte and other molecules to benefit their transfer to the organic solvent, contributing to an improved extraction efficiency [46,47]. Then the extraction effects of acetonitrile containing different contents of formic acid (0.25, 0.5, 0.75, 1, 2, 3, and 4%) were investigated. The highest RE values were achieved when acetonitrile containing 1% formic acid was chosen as the extraction solution (Figure 2B).
where A represents the peak area of the analyte in the plasma spiked before extraction, and B represents the peak area of the analyte in the plasma spiked after extraction.
RE = A/B × 100%
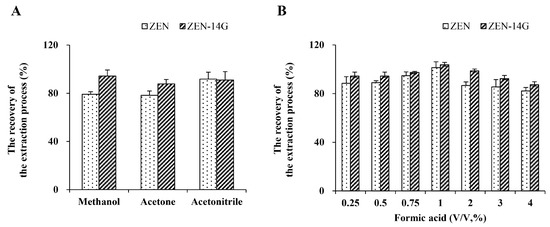
Figure 2.
The extraction efficiencies of zearalenone (ZEN) and zearalenone-14-glucoside (ZEN-14G) by three candidate solvents (A) and acetonitrile containing different contents of formic acid (0.25–4%, v/v) (B) were compared. The concentration is 50 μg/L. Acceptable recovery rates are between 70% and 120%.
3.2.2. Re-Dissolution of the Samples
Re-dissolution is a basic operation in the pretreatment of samples because its efficiency directly affects the recovery. To optimize the re-dissolution effects of the analytes, the efficiency of solutions with different percentages were compared, including: (1) an acetonitrile–water mixture containing 5 mmol/L ammonium acetate (10/90, v/v), (2) an acetonitrile–water mixture containing 5 mmol/L ammonium acetate (20/80, v/v), (3) an acetonitrile–water mixture containing 5 mmol/L ammonium acetate (30/70, v/v), (4) an acetonitrile–water mixture containing 5 mmol/L ammonium acetate (40/60, v/v), and (5) an acetonitrile–water mixture containing 5 mmol/L ammonium acetate (50/50, v/v). As shown in Table S1, with an increase in the proportion of acetonitrile, the recovery of ZEN increased sharply and then decreased slowly, while ZEN-14G always showed a steady trend. Satisfactory recovery rates were obtained for the two analytes when the acetonitrile–water mixture containing 5 mmol/L ammonium acetate in water (30/70, v/v) was chosen. This might be related to the fact that both analytes, which had different properties, had relatively good solubility in this re-dissolving solution.
3.3. Validation of the Method
The analytical performance of HPLC-MS/MS was evaluated by the selectivity, linearity, sensitivity, precision, and stability parameters. The method was selective for both ZEN and ZEN-14G in the plasma, different tissues, and urine, since no interference peaks appeared during the retention time in blank samples, also indicating that no ZEN or ZEN-14G existed in the regular rat feed (Figure 1). The SSE values for ZEN and ZEN-14G were 31–79% and 70–87%, respectively. The matrix-matched calibration curves were constructed to compensate for the matrix effects to accurately quantify the two analytes. Satisfactory linear relationships of the two target analytes were observed, with the coefficients of determination (R2) greater than 0.99. The LLOD and LLOQ obtained were 0.03–0.3 μg/L and 0.1–1.0 μg/L, respectively (Table 2), which were obviously lower than those in plasma reported by Catteuw et al. (ZEN, 7.4 μg/L) [48] and Catteuw et al. (ZEN-14G, 1.7 μg/L) [49], but higher than those in plasma reported by Sun et al. (ZEN, 0.1 μg/L; ZEN-14G, 0.03 μg/L) [24]. To date, there have been few studies on the simultaneous detection of ZEN and ZEN-14G in the plasma, different tissues, and urine of rats. The LLOQ values in this approach were obviously lower than or comparable with those in several tissues and urine reported (0.6–0.8 μg/L) by Veršilovskis et al. [50], proving that the sensitivity of the established method was sufficient for measuring both analytes in different biological matrices. Acceptable recovery rates of ZEN (80.7 ± 3.0–112.3 ± 3.1%) and ZEN-14G (85.0 ± 4.9–109.3 ± 2.4%) were obtained with the RSD values of intra-day and inter-day precision being in the range of 0.9–14.6% and 0.6–16.5%, respectively (Table 3). After a detailed study of the stability under different conditions, ZEN and ZEN-14G were fully verified to be stable (81.7 ± 1.7–104.1 ± 3.9%) in the plasma, different tissues, and urine of rats (Table S2). These satisfactory parameters proved that the developed method was selective, accurate, sensitive, and stable, and could be used for studies of the kinetics and distribution of ZEN and ZEN-14G in rats.
Table 2.
Linearity, lower limit of detection (LLOD), lower limit of quantification (LLOQ), and matrix effect (SSE) of zearalenone (ZEN) and zearalenone-14-glucoside (ZEN-14G).
Table 3.
Recovery rates, and intra- and inter-day precision of zearalenone (ZEN) and zearalenone- 14-glucoside (ZEN-14G) (n = 5).
To better understand the strengths and weaknesses of the developed HPLC-MS/MS method, we further compared it with previously reported methods of determining ZEN and ZEN-14G. In comparison with the rapid detection methods, namely immunoassays or aptasensors [51,52], the current method exhibited comparable sensitivity and accuracy, and could be applied for the simultaneous determination of two compounds with different polarities in a variety of matrices. The method of ultra-high performance liquid chromatography coupled with quadrupole time-of-flight tandem mass spectrometry (UHPLC-Q-TOF/MS) previously developed in our lab was also tested and showed high selectivity for the targets in different matrices (Figures S3–S8), but the sensitivity with the screening detection limits (SDLs) ranging from 50 μg/L to 200 μg/L seemed relatively lower (Table S3) [53]. A parallel analysis was carried out using the current method and a series of previously established LC-MS/MS methods for the analysis of ZEN and its glucoside in the plasma [54], liver [50], and urine [55] (Table S4). Accurate results were obtained independent of the matrix tested, proving it to be a promising tool for studies of the kinetics and distribution of ZEN and ZEN-14G in rats.
3.4. Kinetics and Tissue Distribution
For the in vivo study of the kinetics and tissue distribution, different solvents, i.e., ethanol/water (10/90, v/v), ethanol/water (20/70, v/v), ethanol/water (25/75, v/v), ethanol/water (30/70, v/v), and ethanol/water (40/60, v/v), were compared for the solubility of ZEN-14G for administration to rats by gavage. When the percentage of ethanol was no less than 25%, satisfactory solubility (>99%) was achieved, and therefore ethanol/water (25/75, v/v) was selected (Table S5).
After administration by gavage, ZEN-14G could be absorbed and converted into its prototype, ZEN, resulting in additional health risks to humans or animals. Both ZEN and ZEN-14G exhibited similar metabolic trends and reached peak concentrations of 4.4 ± 1.2 µg/L and 2.8 ± 0.2 µg/L in 10 min, respectively (Table 4). After that, ZEN and ZEN-14G rapidly decreased (Figure 3). The low plasma concentrations of ZEN-14G might be due to its poor absorption (oral bioavailability <10%) [24]. The elimination half-life of ZEN-14G was consistent with that acquired by Sun et al. [24] but was lower than that for ZEN obtained by Lu et al., attributed to the higher polarity of the glycoside’s structure [56].
Table 4.
Kinetic parameters after the administration of zearalenone-14-glucoside (ZEN-14G) by gavage to rats (dose of 4 mg/kg body weight, n = 3).
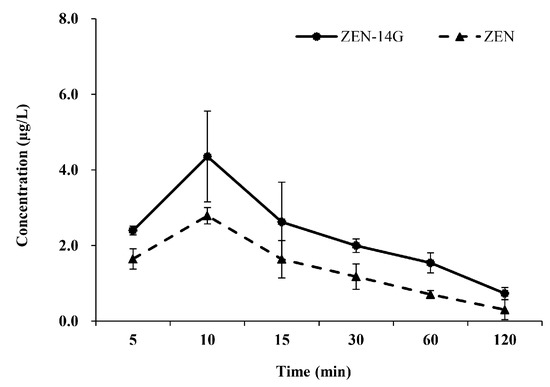
Figure 3.
The plasma concentration vs. time profiles after the administration of zearalenone-14-glucoside (ZEN-14G) by gavage to rats (dose of 4 mg/kg body weight, n = 3).
The tissue distribution of ZEN-14G and its metabolite, ZEN, is shown in Figure 4. ZEN-14G was still detectable in the stomach, small intestine, and large intestine 24 h after administration by gavage, and this could be hydrolyzed into ZEN in the digestive tract by the intestinal flora during digestion [57,58]. Compared with investigations into ZEN-14G in the digestive tract for a short time (55 min) [50], our results suggested that ZEN-14G may be continuously and slowly converted to low levels of ZEN that are absorbed into the plasma and subsequently distributed to various tissues. Relatively higher amounts of ZEN were quantified in all tested tissues. The ranked order was as follows: small intestine > large intestine > liver > stomach > ovary > kidney. The highest concentration detected in the small intestine was 1004.9 ± 155.0 µg/L.

Figure 4.
Tissue distribution of zearalenone-14-glucoside (ZEN-14G) and its metabolite, zearalenone (ZEN), in rats (dose of 4 mg/kg body weight, n = 3).
Both ZEN-14G and its metabolite, ZEN, were detected in the urine (Figure 5). The amounts of urinary ZEN-14G were low and showed a decreasing trend at concentration levels from 43.9 ± 11.1 μg/L to 7.6 ± 3.0 μg/L within 24 h. These results were consistent with our data in plasma showing that ZEN-14G could be absorbed directly into the plasma in small amounts. Compared with ZEN-14G, ZEN maintained relatively higher levels ranging from 301.4 ± 36.7 μg/L to 4801.5 ± 424.8 μg/L, with the highest concentration detected at 6–12 h, indicating that ZEN-14G was slowly and continuously cleaved to ZEN, followed by sustainable absorption and excretion (Figure 6). Although ZEN-14G is less toxic than ZEN, the cumulative health risks related ZEN-14G cannot be neglected.
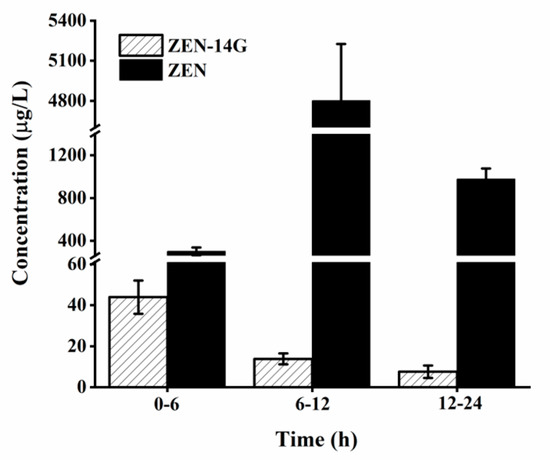
Figure 5.
The concentrations of zearalenone-14-glucoside (ZEN-14G) and zearalenone (ZEN) in urine collected 6–24 h after oral administration to rats (dose of 4 mg/kg body weight, n = 3).
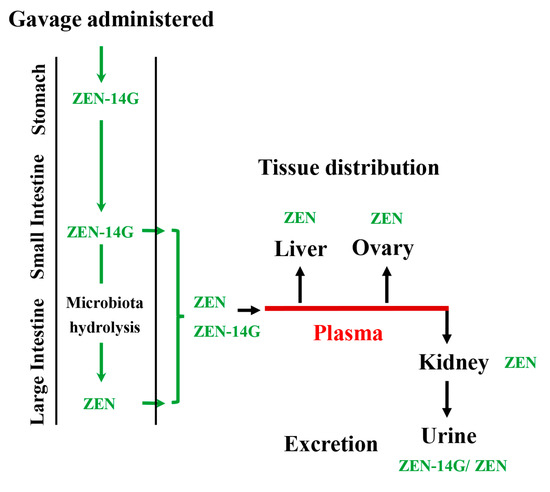
Figure 6.
The supposed biotransformation characteristics in the plasma, tissue distribution, and urinary excretion after the administration of ZEN-14G by gavage to rats.
4. Conclusions
An effective HPLC-MS/MS method was established for the analysis of ZEN-14G and its metabolite, ZEN, in the plasma, various tissues, and urine of rats. After careful validation, the developed method was proved to be selective, accurate, sensitive, and stable, and was subsequently applied to explore the kinetics and tissue distribution after the administration of ZEN-14G by gavage to rats. ZEN-14G could be partially absorbed into the plasma and partially converted into ZEN, followed by sustained absorption and excretion. After 24 h, ZEN-14G could still be detected in the digestive tract and urine, while its metabolite, ZEN, could be found in all biosamples at high concentrations, verifying the cumulative health risks to humans and animals. Therefore, it is recommended to include masked mycotoxins in monitoring and control programs of agricultural practices and food safety authorities, with the established method as a powerful tool.
Supplementary Materials
The following supporting information can be downloaded at: https://www.mdpi.com/article/10.3390/app13084990/s1. Figure S1. Comparison of the ionization efficiencies of zearalenone (ZEN) and zearalenone-14-glucoside (ZEN-14G) among four candidate mobile phases. (A) a methanol–water mixture, (B) a methanol–water mixture containing 0.1% formic acid, (C) a methanol–water mixture containing 5 mmol/L ammonium acetate, and (D) a methanol–water mixture containing 5 mmol/L ammonium acetate and 0.1% formic acid. The concentration of ZEN and ZEN-14G was 50 μg/L. Figure S2. Ionization efficiencies of ZEN and ZEN-14G compared among different mobile phases. (A) a methanol–water mixture containing 1 mmol/L ammonium acetate, (B) a methanol–water mixture containing 3 mmol/L ammonium acetate, (C) a methanol–water mixture containing 5 mmol/L ammonium acetate, and (D) a methanol–water mixture containing 7 mmol/L ammonium acetate. The concentration of ZEN and ZEN-14G was 50 μg/L. Figure S3. Detection and identification of ZEN-14G by the established UHPLC-Q-TOF/MS method in (A) the blank small intestine sample, (B) the neat solution (200 μg/L), (C) the spiked small intestine sample (200 μg/L), and (D) the small intestine samples gathered at 24 h after the administration of ZEN-14G by gavage (4 mg/kg body weight) to rats. Figure S4. Detection and identification of ZEN by the established UHPLC-Q-TOF/MS method in (A) the blank small intestine sample, (B) the neat solution (200 μg/L), (C) the spiked small intestine sample (200 μg/L), and (D) the small intestine samples gathered at 24 h after the administration of ZEN-14G (4 mg/kg body weight) by gavage to rats. Figure S5. Detection and identification of ZEN-14G by the established UHPLC-Q-TOF/MS method in (A) the blank large intestine sample, (B) the neat solution (200 μg/L), (C) the spiked large intestine sample (200 μg/L), and (D) the large intestine samples gathered at 24 h after the administration of ZEN-14G by gavage (4 mg/kg body weight) to rats. Figure S6. Detection and identification of ZEN by the established UHPLC-Q-TOF/MS method in (A) the blank large intestine sample, (B) the neat solution (200 μg/L), (C) the spiked large intestine sample (200 μg/L), and (D) the large intestine samples gathered at 24 h after the administration of ZEN-14G by gavage (4 mg/kg body weight) to rats. Figure S7. Detection and identification of ZEN-14G by the established UHPLC-Q-TOF/MS method in (A) the blank urine sample, (B) the neat solution (200 μg/L), (C) the spiked urine sample (200 μg/L), and (D) the urine samples gathered at 6 h after the administration of ZEN-14G by gavage (4 mg/kg body weight) to rats. Figure S8. Detection and identification of ZEN by the established UHPLC-Q-TOF/MS method in (A) the blank urine sample, (B) the neat solution (200 μg/L), (C) the spiked urine sample (200 μg/L), and (D) the urine samples gathered at 6 h after the administration of ZEN-14G by gavage (4 mg/kg body weight) to rats. Table S1. Comparison of the re-dissolution effects of zearalenone (ZEN) and zearalenone-14-glucoside (ZEN-14G) among the different solvents. Table S2. Stability of zearalenone (ZEN) and zearalenone-14-glucoside (ZEN-14G) (n = 5). Table S3. The screening detection limits (SDLs) obtained by UHPLC-Q-TOF/MS for the investigated zearalenone (ZEN) and zearalenone-14-glucoside (ZEN-14G) in different matrices. Table S4. In-parallel analysis of the concentration of zearalenone (ZEN) and zearalenone-14-glucoside (ZEN-14G) in the plasma (10 min), liver (24 h), and urine (24 h) samples after the administration of ZEN-14G by gavage (dose of 4 mg/kg body weight, n = 3) to rats determined by the current established method and the previously reported LC-MS/MS method (mean ± SD, μg/L). Table S5. Comparison of the solubility of zearalenone-14-glucoside (ZEN-14G) at a concentration of 100 μg/L in different solvents for administration by gavage.
Author Contributions
Investigation, methodology, writing—original draft, writing—review and editing, Y.C.; investigation, methodology, writing—review and editing, Z.Z. (Zhiqi Zhang); data curation, F.D.; software, Z.M.; methodology, validation, K.F.; funding acquisition, methodology, supervision, writing—review and editing, Z.H.; validation, writing—review and editing, supervision, project administration, Z.L.; funding acquisition, methodology, supervision, Z.Z. (Zhihui Zhao). All authors have read and agreed to the published version of the manuscript.
Funding
This work was funded by the Shanghai Agriculture Applied Technology Development Program, China (grant number X2020-02-08-00-12-F01453); the Natural Science Foundation of Shanghai (grant numbers 23ZR1442900); and the National Key Research and Development Plan (2017YFC 1600304).
Institutional Review Board Statement
The study was conducted in accordance with the Declaration of Helsinki, and approved by the Laboratory Animal Ethics Committee at the Shanghai Academy of Agricultural Science of China (protocol code: SAASPZ0921015; date of approval: 2022).
Informed Consent Statement
Not applicable.
Data Availability Statement
The data presented in this study are available in this article and the Supplementary Material. Further inquiries regarding the data will be made available on request.
Conflicts of Interest
The authors declare no conflict of interest.
References
- Yu, H.; Zhang, J.; Chen, Y.; Zhu, J. Zearalenone and its masked forms in cereals and cereal-derived products: A review of the characteristics, incidence, and fate in food processing. J. Fungi. 2022, 8, 976. [Google Scholar] [CrossRef] [PubMed]
- Ropejko, K.; Twarużek, M. Zearalenone and its metabolites-general overview, occurrence, and toxicity. Toxins 2021, 13, 35. [Google Scholar] [CrossRef] [PubMed]
- Rai, A.; Das, M.; Tripathi, A. Occurrence and toxicity of a fusarium mycotoxin, zearalenone. Crit. Rev. Food Sci. Nutr. 2020, 60, 2710–2729. [Google Scholar] [CrossRef]
- Seo, H.; Jang, S.; Jo, H.; Kim, H.; Lee, S.; Yun, H.; Jeong, M.; Moon, J.; Na, T.; Cho, H. Optimization of the QuEChERS-based analytical method for investigation of 11 mycotoxin residues in feed ingredients and compound feeds. Toxins 2021, 13, 767. [Google Scholar] [CrossRef]
- Caglayan, M.O.; Şahin, S.; Üstündağ, Z. Detection strategies of zearalenone for food safety: A review. Crit. Rev. Anal. Chem. 2022, 52, 294–313. [Google Scholar] [CrossRef] [PubMed]
- Escrivá, L.; Font, G.; Manyes, L.; Berrada, H. Studies on the presence of mycotoxins in biological samples: An overview. Toxins 2017, 9, 251. [Google Scholar] [CrossRef] [PubMed]
- Mahato, D.K.; Devi, S.; Pandhi, S.; Sharma, B.; Maurya, K.K.; Mishra, S.; Dhawan, K.; Selvakumar, R.; Kamle, M.; Mishra, A.K.; et al. Occurrence, impact on agriculture, human health, and management strategies of zearalenone in food and feed: A review. Toxins 2021, 13, 92. [Google Scholar] [CrossRef] [PubMed]
- Jing, S.; Liu, C.; Zheng, J.; Dong, Z.; Guo, N. Toxicity of zearalenone and its nutritional intervention by natural products. Food Funct. 2022, 13, 10374–10400. [Google Scholar] [CrossRef]
- Ekwomadu, T.I.; Dada, T.A.; Nleya, N.; Gopane, R.; Sulyok, M.; Mwanza, M. Variation of fusarium free, masked, and emerging mycotoxin metabolites in maize from agriculture regions of South Africa. Toxins 2020, 12, 149. [Google Scholar] [CrossRef]
- Commission of the European Communities. Commission Recommendation (EC) No 576/2006 of 17 August 2006 on the presence of deoxynivalenol, zearalenone, ochratoxin A, T-2 and HT-2 and fumonisins in products intended for animal feeding. Off. J. Eur. Union. 2006, L229, 7–9. [Google Scholar]
- Chain, E. Appropriateness to set a group health-based guidance value for zearalenone and its modified forms. EFSA J. 2016, 14, e04425. [Google Scholar] [CrossRef]
- Zhang, Z.; Nie, D.; Fan, K.; Yang, J.; Guo, W.; Meng, J.; Zhao, Z.; Han, Z. A systematic review of plant-conjugated masked mycotoxins: Occurrence, toxicology, and metabolism. Crit. Rev. Food Sci. Nutr. 2020, 60, 1523–1537. [Google Scholar] [CrossRef] [PubMed]
- Santos, A.R.; Carreiró, F.; Freitas, A.; Barros, S.; Brites, C.; Ramos, F.; Sanches Silva, A. Mycotoxins contamination in rice: Analytical methods, occurrence and detoxification strategies. Toxins 2022, 14, 647. [Google Scholar] [CrossRef] [PubMed]
- Tan, H.; Zhou, H.; Guo, T.; Zhou, Y.; Zhang, Q.; Zhang, Y.; Ma, L. Recent advances on formation, transformation, occurrence, and analytical strategy of modified mycotoxins in cereals and their products. Food Chem. 2022, 405, 134752. [Google Scholar] [CrossRef]
- Boevre, M.D.; Mavungu, J.D.D.; Maene, P.; Audenaert, K.; Deforce, D.; Haesaert, G.; Eeckhout, M.; Callebaut, A.; Berthiller, F.; Van Peteghem, C.; et al. Development and validation of an LC-MS/MS method for the simultaneous determination of deoxynivalenol, zearalenone, t-2-toxin and some masked metabolites in different cereals and cereal-derived food. Food Addit. Contam. 2012, 29, 819–835. [Google Scholar] [CrossRef]
- Nathanail, A.V.; Syvähuoko, J.; Malachov, A.; Jestoi, M.; Varga, E.; Michlmayr, H.; Adam, G.; Sieviläinen, E.; Berthiller, F.; Peltonen, K. Simultaneous determination of major type A and B trichothecenes, zearalenone and certain modified metabolites in finnish cereal grains with a novel liquid chromatography-tandem mass spectrometric method. Anal. Bioanal. Chem. 2015, 407, 4745–4755. [Google Scholar] [CrossRef]
- Siri-Anusornsak, W.; Kolawole, O.; Mahakarnchanakul, W.; Greer, B.; Petchkongkaew, A.; Meneely, J.; Elliott, C.; Vangnai, K. The occurrence and co-occurrence of regulated, emerging, and masked mycotoxins in rice bran and maize from Southeast Asia. Toxins 2022, 14, 567. [Google Scholar] [CrossRef]
- Boevre, M.D.; Jacxsens, L.; Lachat, C.; Eeckhout, M.; Mavungu, J.; Audenaert, K.; Maene, P.; Haesaert, G.; Kolsteren, P.; De Meulenaer, B.; et al. Human exposure to mycotoxins and their masked forms through cereal-based foods in Belgium. Toxicol. Lett. 2013, 218, 281–292. [Google Scholar] [CrossRef]
- Schneweis, I.; Meyer, K.; Engelhardt, G.; Bauer, J. Occurrence of zearalenone-4-beta-D-glucopyrano side in wheat. J. Agric. Food Chem. 2002, 50, 1736–1738. [Google Scholar] [CrossRef]
- Zhang, Z.; Cai, Y.; Fan, K.; Huang, Q.; Zhao, X.; Cao, H.; Zhao, Z.; Tangni, E.K.; Han, Z. Development of a reliable UHPLC-MS/MS method for simultaneous determination of zearalenone and zearalenone-14-glucoside in various feed products. Front. Chem. 2022, 10, 955266. [Google Scholar] [CrossRef]
- Binderm, S.B.; Schwartz-Zimmermann, H.E.; Varga, E.; Bichl, G.; Michlmayr, H.; Adam, G.; Berthiller, F. Metabolism of zearalenone and its major modified forms in pigs. Toxins 2017, 9, 56. [Google Scholar] [CrossRef] [PubMed]
- Ekwomadu, T.I.; Akinola, S.A.; Mwanza, M. Fusarium mycotoxins, their metabolites (free, emerging, and masked), food safety concerns, and health impacts. Int. J. Environ. Res. Public Health. 2021, 18, 11741. [Google Scholar] [CrossRef]
- Lu, Q.; Qin, J.A.; Fu, Y.W.; Luo, J.Y.; Yang, M.H. Modified mycotoxins in foodstuffs, animal feed, and herbal medicine: A systematic review on global occurrence, transformation mechanism and analysis methods. Trends Anal. Chem. 2020, 133, 116088. [Google Scholar] [CrossRef]
- Sun, F.; Tan, H.; Li, Y.; Boevre, M.D.; Saeger, S.D.; Zhou, J.; Li, Y.; Rao, Z.; Yang, S.; Zhang, H. Metabolic profile, bioavailability and toxicokinetics of zearalenone-14-glucoside in rats after oral and intravenous administration by liquid chromatography high-resolution mass spectrometry and tandem mass spectrometry. Int. J. Mol. Sci. 2019, 20, 5473. [Google Scholar] [CrossRef]
- Liu, J.; Applegate, T. Zearalenone (ZEN) in livestock and poultry: Dose, toxicokinetics, toxicity and estrogenicity. Toxins 2020, 12, 377. [Google Scholar] [CrossRef]
- Pierzgalski, A.; Bryła, M.; Kanabus, J.; Modrzewska, M.; Podolska, G. Updated review of the toxicity of selected fusarium toxins and their modified forms. Toxins 2021, 13, 768. [Google Scholar] [CrossRef] [PubMed]
- Woźny, M.; Obremski, K.; Hliwa, P.; Gomułka, P.; Różyński, R.; Wojtacha, P.; Brzuzan, P. Feed contamination with zearalenone promotes growth but affects the immune system of rainbow trout. Fish Shellfish Immun. 2019, 84, 680–694. [Google Scholar] [CrossRef]
- Fleck, S.C.; Churchwell, M.I.; Doerge, D.R. Metabolism and pharmacokinetics of zearalenone following oral and intravenous administration in juvenile female pigs. Food Chem. Toxicol. 2017, 106, 193–201. [Google Scholar] [CrossRef]
- Cirlini, M.; Barilli, A.; Galaverna, G.; Michlmayr, H.; Adam, G.; Berthiller, F.; Dall’Asta, C. Study on the uptake and deglycosylation of the masked forms of zearalenone in human intestinal caco-2 cells. Food Chem. Toxicol. 2016, 98, 232–239. [Google Scholar] [CrossRef]
- Dellafiora, L.; Perotti, A.; Galaverna, G.; Buschini, A.; Dall’Asta, C. On the masked mycotoxin zearalenone-14-glucoside, does the mask truly hide? Toxicon 2016, 111, 139–142. [Google Scholar] [CrossRef]
- Lu, Q.; Luo, J.; Ruan, H.; Wang, C.; Yang, M. Structure-toxicity relationships, toxicity mechanisms and health risk assessment of food-borne modified deoxynivalenol and zearalenone: A comprehensive review. Sci. Total. Environ. 2021, 806, 151192. [Google Scholar] [CrossRef] [PubMed]
- Yang, S.; Zhang, H.; Zhang, J.; Li, Y.; Jin, Y.; Zhang, S.; Saeger, S.D.; Li, Y.; Zhou, J.; Sun, F. Deglucosylation of zearalenone-14-glucoside in animals and human liver leads to underestimation of exposure to zearalenone in humans. Arch. Toxicol. 2018, 92, 2779–2791. [Google Scholar] [CrossRef] [PubMed]
- Pei, S.C.; Lee, W.J.; Zhang, G.P.; Hu, X.F.; Eremin, S.A.; Zhang, L.J. Development of Anti-Zearalenone Monoclonal Antibody and Detection of Zearalenone in Corn Products from China by ELISA. Food Control 2013, 31, 65–70. [Google Scholar] [CrossRef]
- Rodríguez-Carrasco, Y.; Moltó, J.C.; Mañes, J.; Berrada, H. Development of a GC-MS/MS strategy to determine 15 mycotoxins and metabolites in human urine. Talanta 2014, 128, 125–131. [Google Scholar] [CrossRef]
- Eshelli, M.; Qader, M.M.; Jambi, E.J.; Hursthouse, A.S.; Rateb, M.E. Current status and future opportunities of omics tools in mycotoxin research. Toxins 2018, 10, 433. [Google Scholar] [CrossRef]
- Suo, Z.; Niu, X.; Wei, M.; Jin, H.; He, B. Latest strategies for rapid and point of care detection of mycotoxins in food: A review. Anal. Chim. Acta 2023, 340888. [Google Scholar] [CrossRef]
- Fan, Z.; Bai, B.; Jin, P.; Fan, K.; Guo, W.; Zhao, Z.; Han, Z. Development and validation of an ultra-high performance liquid chromatography-tandem mass spectrometry method for simultaneous determination of four type b trichothecenes and masked deoxynivalenol in various feed products. Molecules 2016, 21, 747. [Google Scholar] [CrossRef]
- Lv, S.; Wu, X.; Guan, J.; Yan, Y.; Ge, M.; Zhu, G. Quantification and confirmation of zearalenone using a LC-MS/MS QTRAP system in multiple reaction monitoring and enhanced product ion scan modes. Food Anal. Method 2021, 14, 1843–1851. [Google Scholar] [CrossRef]
- Shin, B.S.; Hong, S.H.; Hwang, S.W.; Kim, H.J.; Yoo, S.D. Determination of zearalenone by liquid chromatography/tandem mass spectrometry and application to a pharmacokinetic study. Biomed. Chromatogr. 2010, 23, 1014–1021. [Google Scholar] [CrossRef]
- Schelstraete, W.; Devreese, M.; Croubels, S. Comparative toxicokinetics of fusarium mycotoxins in pigs and humans. Food Chem. Toxicol. 2020, 137, 111140. [Google Scholar] [CrossRef]
- Habschied, K.; Šarić, G.K.; Krstanović, V.; Mastanjević, K. Mycotoxins-biomonitoring and human exposure. Toxins 2021, 13, 113. [Google Scholar] [CrossRef] [PubMed]
- Singh, J.; Mehta, A. Rapid and sensitive detection of mycotoxins by advanced and emerging analytical methods: A review. Food Sci. Nutr. 2020, 8, 2183–2204. [Google Scholar] [CrossRef] [PubMed]
- Guidance for Industry, Bioanalytical Method Validation, U.S. Department of Health and Human Services, Food and Drug Administration, Center for Drug Evaluation and Research (CDER), Center for Veterinary Medicine (CMV). 2018. Available online: https://www.fda.gov/downloads/drugs/guidances/ucm070107.pdf7 (accessed on 24 May 2018).
- Wang, Y.; Wang, X.; Wang, S.; Fotina, H.; Wang, Z. Development of a highly sensitive and specific monoclonal antibody based on indirect competitive enzyme-linked immunosorbent assay for the determination of zearalenone in food and feed samples. Toxins 2022, 14, 220. [Google Scholar] [CrossRef] [PubMed]
- Cho, H.D.; Suh, J.H.; Feng, S.; Eom, T.; Kim, J.; Hyun, S.M.; Kim, J.; Wang, Y.; Han, S.B. Comprehensive analysis of multi-class mycotoxins in twenty different species of functional and medicinal herbs using liquid chromatography-tandem mass spectrometry. Food Control 2019, 96, 517–526. [Google Scholar] [CrossRef]
- Alshannaq, A.; Yu, J.H. Occurrence, toxicity, and analysis of major mycotoxins in food. Int. J. Environ. Res. Public Health 2017, 14, 632. [Google Scholar] [CrossRef] [PubMed]
- Muñoz-Solano, B.; González-Peñas, E. Mycotoxin determination in animal feed: An LC-FLD method for simultaneous quantification of aflatoxins, ochratoxins and zearelanone in this matrix. Toxins 2020, 12, 374. [Google Scholar] [CrossRef]
- Catteuw, A.; Broekaert, N.; Baere, S.D.; Lauwers, M.; Gasthuys, E.; Huybrechts, B.; Callebaut, A.; Ivanova, L.; Uhlig, S.; Boevre, M.D.; et al. Insights into in vivo absolute oral bioavailability, biotransformation and toxicokinetics of zearalenone, α-zearalenol, β-zearalenol, zearalenone-14-glucoside and zearalenone-14-sulfate in pigs. J. Agric. Food Chem. 2019, 67, 3448–3458. [Google Scholar] [CrossRef]
- Catteuw, A.; Devreese, M.; Baere, S.D.; Antonissen, G.; Huybrechts, B.; Ivanova, L.; Uhlig, S.; Martens, A.; Saeger, S.D.; Boevre, M.D.; et al. Toxicokinetic studies in piglets reveal age-related differences in systemic exposure to zearalenone, zearalenone-14-glucoside, and zearalenone-14-sulfate. J. Agric. Food Chem. 2020, 68, 7757–7764. [Google Scholar] [CrossRef]
- Veršilovskis, A.; Geys, J.; Huybrechts, B.; Goossens, E.; De Saeger, S.; Callebaut, A. Simultaneous determination of masked forms of deoxynivalenol and zearalenone after oral dosing in rats by LC-MS/MS. World Mycotoxin J. 2012, 5, 303–318. [Google Scholar] [CrossRef]
- Shang, C.; Li, Y.; Zhang, Q.; Tang, S.; Tang, X.; Ren, H.; Hu, P.; Lu, S.; Li, P.; Zhou, Y. Alkaline phosphatase-triggered dual-signal immunoassay for colorimetric and electrochemical detection of zearalenone in cornmeal. Sensors Actuat. B-Chem. 2022, 358, 131525. [Google Scholar] [CrossRef]
- Yang, Y.; Yin, Y.; Wang, S.; Dong, Y. Simultaneous determination of zearalenone and ochratoxin a based on microscale thermophoresis assay with a bifunctional aptamer. Anal. Chim. Acta. 2021, 1155, 338345. [Google Scholar] [CrossRef] [PubMed]
- Huang, Q.; Guo, W.; Zhao, X.; Cao, H.; Fan, K.; Meng, J.; Nie, D.; Wu, Y.; Han, Z. Universal screening of 200 mycotoxins and their variations in stored cereals in Shanghai, China by UHPLC-Q-TOF MS. Food Chem. 2022, 387, 132869. [Google Scholar] [CrossRef]
- Dellafiora, L.; Galaverna, G.; Righi, F.; Cozzini, P.; Dall’Asta, C. Assessing the hydrolytic fate of the masked mycotoxin zearalenone-14-glucoside-a warning light for the need to look at the “maskedome”. Food Chem. Toxicol. 2017, 9, 9–16. [Google Scholar] [CrossRef] [PubMed]
- Warth, B.; Petchkongkaew, A.; Sulyok, M.; Krska, R. Utilising an LC-MS/MS-based multi-biomarker approach to assess mycotoxin exposure in the Bangkok metropolitan area and surrounding provinces. Food Addit. Contam. Part A Chem. Anal. Control. Expo. Risk. Assess. 2014, 31, 2040–2046. [Google Scholar] [CrossRef]
- Lu, Q.; Sui, M.; Luo, Y.; Luo, J.; Yang, M. Further insight into the potential toxicity of zearalenone-14-glucoside based on toxicokinetics, tissue distribution, transformation, and excretion in rats. Ecotoxicol. Environ. Saf. 2020, 246, 114184. [Google Scholar] [CrossRef]
- Dall’Erta, A.; Cirlini, M.; Dall’Asta, M.; Del Rio, D.; Galaverna, G.; Dall’Asta, C. Masked mycotoxins are efficiently hydrolyzed by human colonic microbiota releasing their aglycones. Chem. Res Toxicol. 2013, 26, 305–312. [Google Scholar] [CrossRef] [PubMed]
- Gratz, S.W.; Dinesh, R.; Yoshinari, T.; Holtrop, G.; Richardson, A.J.; Duncan, G.; MacDonald, S.; Lloyd, A.; Tarbin, J. Masked trichothecene and zearalenone mycotoxins withstand digestion and absorption in the upper GI tract but are efficiently hydrolyzed by human gut microbiota in vitro. Mol. Nutr. Food Res. 2017, 61, 1600680. [Google Scholar] [CrossRef]


Disclaimer/Publisher’s Note: The statements, opinions and data contained in all publications are solely those of the individual author(s) and contributor(s) and not of MDPI and/or the editor(s). MDPI and/or the editor(s) disclaim responsibility for any injury to people or property resulting from any ideas, methods, instructions or products referred to in the content. |
© 2023 by the authors. Licensee MDPI, Basel, Switzerland. This article is an open access article distributed under the terms and conditions of the Creative Commons Attribution (CC BY) license (https://creativecommons.org/licenses/by/4.0/).