1. Introduction
Rapid health deterioration brought on by heart attack or stroke diagnosis results in substantial economic costs along with extended patient stays in clinics, hospitals, and other care facilities. Given that the outcome of healthcare systems has a large impact on living quality, a nation’s production, and a nation’s finances as well, this circumstance has drawn attention to them on a global scale. It has become more crucial that people live longer, happier lives, and not just from an economic perspective. In order to offer individuals professional and prompt healthcare in an emergency, numerous researchers across a wide range of scientific disciplines have been working very hard [
1,
2,
3,
4,
5,
6,
7].
One of the entities providing urgent care is the emergency medical service (EMS), which we focus on in this article. We identify with the claim that any possible investments to improve the accessibility of such a service for affected people are crucial.
EMS system design usually consists of searching for the optimal deployment of locations where the ambulances are dispatched to the affected patients. Several review papers that have been published in recent years demonstrate the extensive research that has been conducted on locating EMS vehicles [
8,
9,
10,
11,
12,
13].
Obviously, many different demands and objectives may arise during the decision-making. Therefore, the EMS system design assumes making compromises between various contradictory objectives.
The differences in used objectives follow from the way in which the EMS system satisfies randomly emerging demands of the system users. Whereas the service is provided from a considerably small number of service centers, the users–inhabitants of a serviced region are concentrated in a much higher number of dwelling places such as city quarters, towns, villages, and hamlets. If a user’s request for service is made, then a system dispatcher assigns the demand to the closest available center, and the associate response time is approximately proportional to the distance from the assigned service provider to the client’s place. Average response time is one of the common criteria to minimize.
Because the individual dwelling places significantly differ in the distance from the nearest service center, this inequality raises different goals, which the public representatives apply when designing the system. As already mentioned, a commonly used quality criterion is the minimal average response time to user requests. This so-called system criterion ensures maximal efficiency of the service system, but it may cause the following problem: even if the average response time is minimal, there may be some locations shared by such users who are very far from any located service center. Although all users of the system contribute to the building and operational costs, not all of them have equal access to the service. Users from less densely populated areas, in particular, find this approach unfair because, despite contributing the same amount to system costs as the others, they live considerably further away from the nearest center than the average.
Several solidarity criteria have been developed in response to the users’ need for equity in service accessibility [
14,
15]. However, if we optimized only a fair criterion defined in any way, the previously mentioned system criterion may get worse. From this small example, it is obvious that it is not possible to satisfy all at once, especially if the requirements are in conflict. Simultaneous optimization of both criteria is hard, and it may bring serious difficulties to the associated solving process.
Let us focus on the output of the EMS system design. If we wanted to consider two (or even more) conflicting criteria, it would not be possible to bring only one solution to the location problem as a result. Such a situation could cause unintentional contradictions and reluctance to come up with a consensus acceptable to all partners involved. From the viewpoint of final decision-making and the possibility of finding a suitable compromise, we needed to bring more system designs, not just one. The basic premise is that for any final judgment, a particular set of solutions known as the
Pareto front is presented. Such a collection of system designs is represented by the Pareto front of solutions, which cannot be improved in one of the criteria without at least one of the other criteria deteriorating [
16,
17,
18,
19,
20,
21,
22].
In general, determining the exact Pareto set is very time-demanding [
18,
19]. To reduce computation time and complexity, the approximate Pareto front should be used instead of the complete one. The construction of the exact Pareto front of non-dominated EMS system designs represents a severe computational difficulty. The scientific topic of this paper aims at possible ways to obtain a good approximation of the original Pareto front. In addition to the theoretical explanation, we provide the readers with the results of numerical experiments to evaluate the quality of the proposed algorithms. Contrary to [
20], the keystones are obtained using solutions from the area of feasible solutions, and from this starting solution, by minimization, we have achieved members, which are near the Pareto front. Thus, we use a reverse approach. In the current form of the presented algorithm, we do not use any learning process as in [
21], but it is a good direction for future development.
The structure of this paper is organized as follows. In the following section, we discuss the conflicting objectives and the idea of non-dominated solutions to EMS design problems. The third section is devoted to the suggested swap algorithm and non-dominated solution set. After that, the fourth section contains an explanation of the directed search for members of the non-dominated set of solutions. This section also closes the theoretical part of the paper. The practical part is formed by a computational study, the results of which are summarized in the fifth section. Finally, the last part presents the results as well as potential topics for further research.
2. Conflicting Objectives and Non-Dominated Solutions of EMS Design Problem
The emergency medical service system design is handled as a task to deploy p service centers in a set of m various candidates taking into account the demands of system users concentrated at n dwelling places of the serviced region. The basic decisions on the design can be modeled by a series of m zero–one decision variables connected to individual possible center locations. If there is a service center at location i, the variable yi has a value of one; otherwise, it takes a value of zero.
Considering the given total number
p of centers, the set of feasible solutions can be studied as a sub-set of vertices of the unit
m-dimensional hypercube, where the Hamming distance of each feasible vertex from the origin of coordinates is exactly
p, and the shortest Hamming distance between two feasible solutions equals two. The set of all feasible solutions can be denoted by
Y and defined by (1).
The above-mentioned Hamming distance of two vertices,
y and
x, of the
m-dimensional unit hypercube is defined by (2).
To describe the average system response time with respect to users, several formulations have been developed. The simplest one models the response time of the system to an individual user by the time-distance
tij from the user
j to the nearest center
i. In this case, the EMS system design problem collapses to a simple weighted
p-median problem, which is able to be solved to optimality by tools of integer programming [
13,
23,
24,
25,
26].
Nevertheless, this approach does not take into account the random occurrence in the demands for service, which is a natural characteristic of emergency medical service systems.
Because of the random occurrence in the demands for service, the public service system design model must reflect the characteristics of a queueing system, where a temporary occupancy of the nearest center must be taken into account. This real system property is modeled by a series of
r probability values. They express the probability of the case that the
k-th nearest center to the current demand point is the first available one. Similar to [
2], it is supposed that the probability values are approximately the same in all considered regions.
The more accurate model of the response time for a system user
j is expressed by the formula
q1ti1(j) +
q2ti2(j) + … +
qrtir(j). The symbol
ik(
j) represents the
k-th nearest service center to the user location
j, and
qk is the probability that the
k-th nearest service center is the first one, which is available due to occupancy of the nearer centers. Thus, the formula expresses the expected response time of the system to the user
j. To obtain the value proportional to the average response time, it is necessary to multiply the expected response time to the user location
j by the expected frequency
bj of the calls for demand satisfaction. After these preliminaries, the system objective function can be formulated by (3), where the result of the operator min
k{
tij:
i ∈
P} returns the
k-th minimal value of
tij for
i ∈
P.
Contrary to the system criterion, a fair criterion reflects disutility affecting the worst-situated minority of the concerned users. A fair criterion can be formulated in different ways, such as a min–max problem, a lexicographical min–max problem, or in many other forms. In this paper, we will consider the criterion of the number of demands (or calls) that are located outside a radius
T from the closest medical center. The following expression (4) can present the objective function describing the criterion.
These two criteria stand in conflict, as shown in [
18]. When one of the objective functions is minimized, it signifies that an increase in the other objective function compensates for the drop in the other.
To make the final decision on suitable EMS design easier, we try to offer a significant spectrum of designs containing such solutions, which cannot be dominated by any other solution. We say that the solution y∈Y is non-dominated if there is no such solution x∈Y that f1,(y) ≠ f1,(x) or f2,(y) ≠ f2,(x) and f1,(y) ≥ f1,(x) and f2,(y) ≥ f2,(x). The maximal set of non-dominated solutions is called the Pareto front of solutions.
As concerns the Pareto front identification, various methods were developed. Most of them are based on the usage of solving tools for Problems (5) and (6).
To describe some of the methods, we introduce the following functions, which produce the optimal solutions of (5) and (6). The procedure producing the optimal solution of (5) will be denoted by GetSol1(u), and the procedure for Problem (6) will be denoted by GetSol2(u).
Then, the leftmost component of the Pareto front for the given EMS design problem can be obtained by performing GetSol1(f2,(GetSol2(+∞))), and the rightmost member can be obtained by GetSol2(f1,(GetSol1(+∞))).
We mention here two different approaches to obtaining the Pareto front or its very good approximation with ε accuracy.
The first approach is based on the bisection process. It makes use of the proposition that if the inequality
f1,(
GetSol1(
u)) >
f1,(
GetSol1(
v)) holds for
u <
v, then there must be at least one member
y of the Pareto front, for which the following inequalities are fulfilled:
u <
f2,(
y) ≤
v. Otherwise, there is no member of the Pareto front, for which the above inequalities hold. This proposition is used for a bisection process, which proved to be able to identify the complete Pareto front of the EMS designs [
18].
Another approach [
27,
28] alternatively changes the usage of
GetSol1 and
GetSol2 to determine the next member of the Pareto front with a lower value of
f2,. If
x is a member of the Pareto front, the next member with a better value of
f2, can be obtained by the following two optimization processes with an accuracy of
ε:
Perform z = GetSol1(f2,(x) − ε).
Determine y = GetSol2(f1,(z)).
3. Swap Algorithm and Non-Dominated Solution Set
As the exact approaches proved to be very demanding concerning computational time, the attention of researchers has been concentrated on a family of heuristic tools, the performance of which may serve as a source of candidates for membership in a non-dominated solution set (NDSS).
A starting list of non-dominated designs may be easily constructed from two solutions, where each one is obtained by the minimization process of f1, or f2, in the set Y of feasible solutions. If a current set of non-dominated solutions is kept in the form of a sequence ordered according to increasing values of one of the objective functions, then it can be easily decided on an arbitrary feasible solution y, whether it is dominated by a solution of the current NDSS or it can be included to the NDSS. Thus, the procedure UpdateNDSS(NDSS, y) can be implemented.
Because most heuristics and metaheuristics produce a series of newly designed feasible solutions, the UpdateNDSS procedure can be applied to each of these solutions and used to build a good set of non-dominated components gradually.
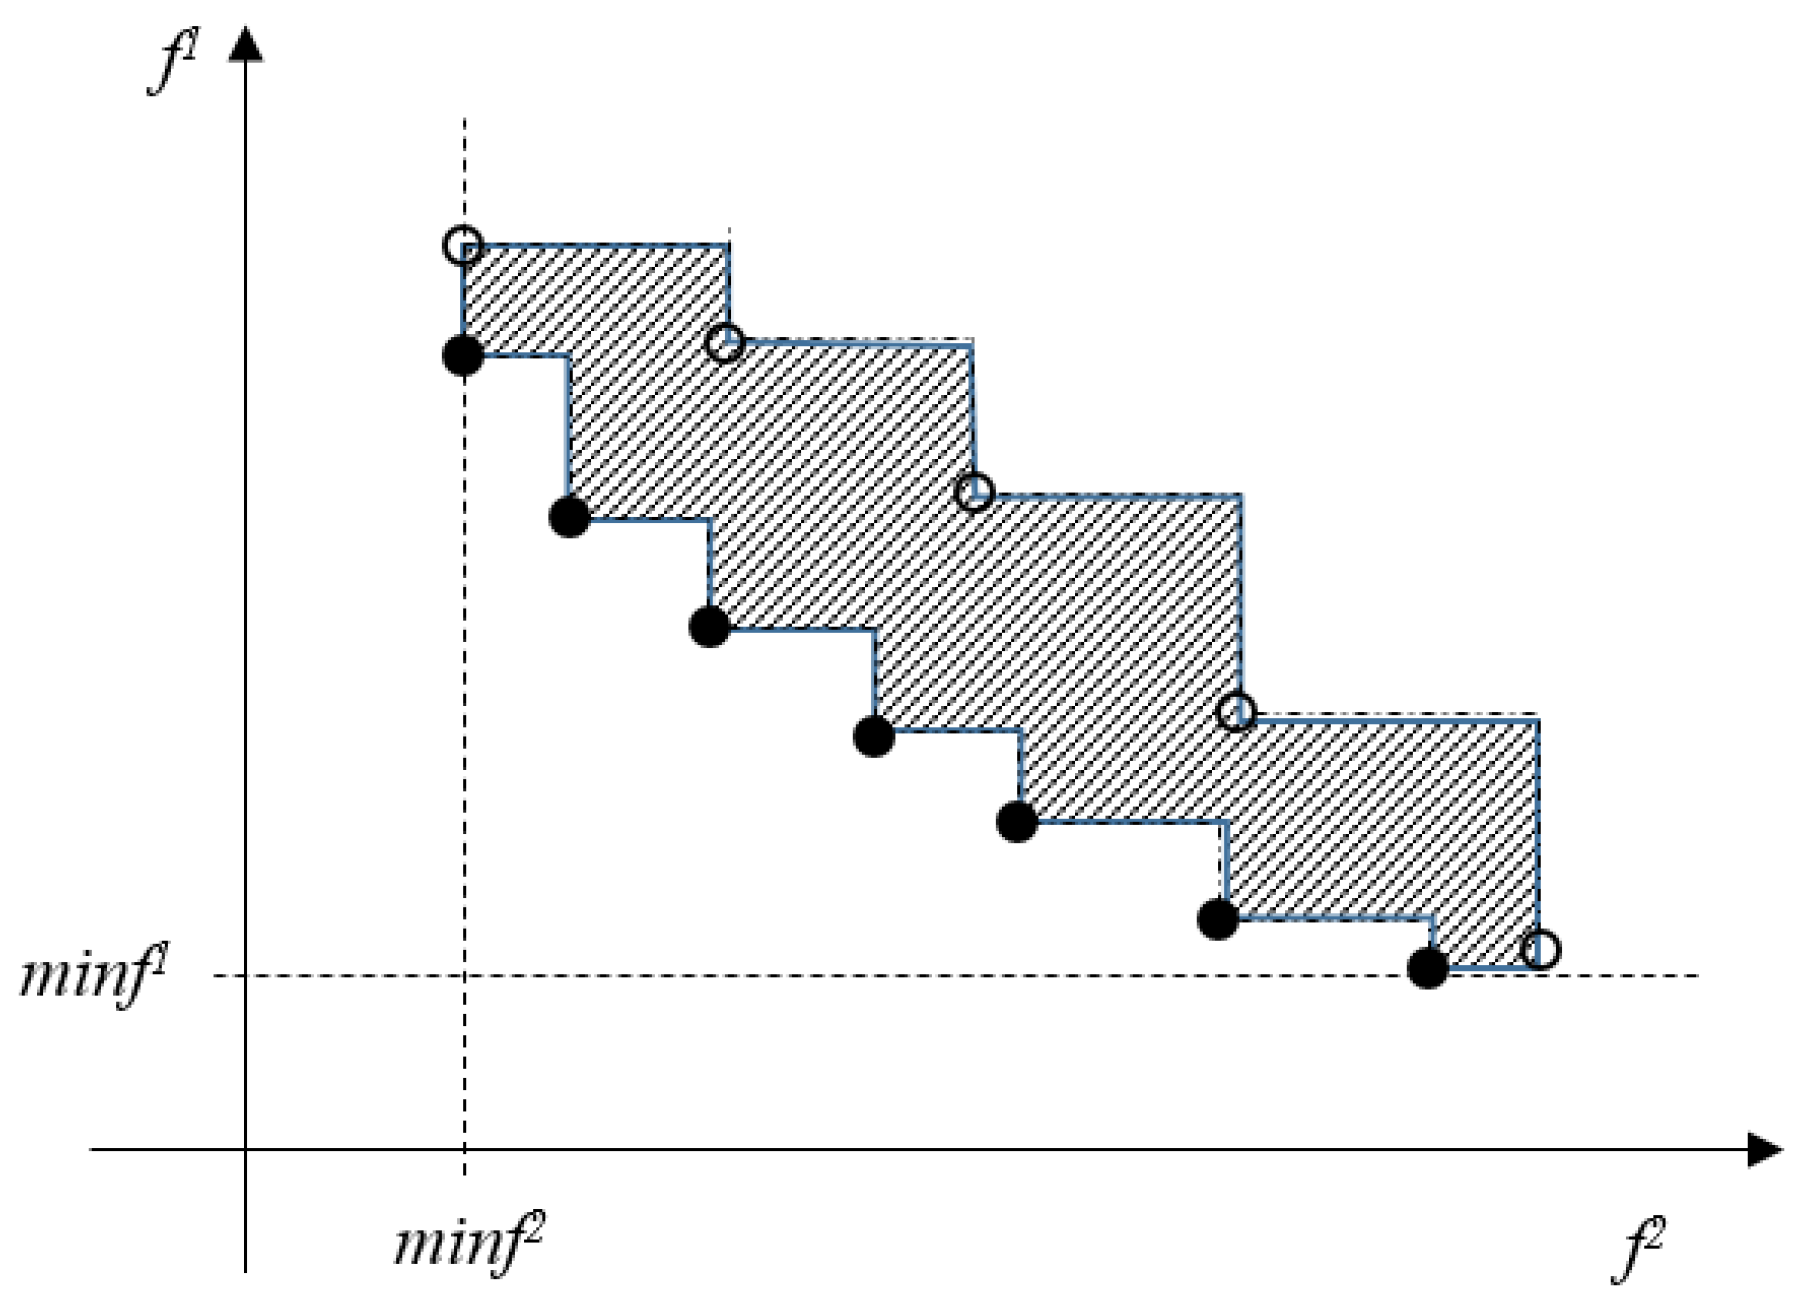
It must be noted that heuristic methods equipped with the procedure
UpdateNDSS will give only an approximation of the Pareto front for the given instance. To be able to study the efficiency of particular approaches, a measure of proximity of the final
NDSS to the Pareto front must be defined. Under the assumption that the minimal values of
f1, and
f2, are determined accurately enough, the proximity can be expressed by the difference in the areas under the curve given by the element of the Pareto front and the
NDSS (see
Figure 1).
Previously obtained experience with the swap algorithm [
27,
28] induced an idea of using the swap algorithm in connection with the procedure
UpdateNDSS for the construction of an approximation of the Pareto front for the two-objective EMS system.
Applying the swap algorithm’s fundamental operation to a workable solution y entails shifting a station from its actual point i to a vacant position j. The outcome may be represented as Exchange(y, i, j) = [y1, y2, …, yi−1, 0, yi+1, …, yj−1, 1, yj+1, …, ym].
The procedure defined by the below steps requires an input solution y, a starting set NDSS of non-dominated elements, and a pair a of coefficients a1 and a2:
Swap(y, a, NDSS)
- 3.
Initialize F = a1 f1(y) + a2 f2(y) and BestF = F.
- 4.
For each i = 1, …, m, yi = 1 and j = 1, …, m, yj = 0 repeat Step 2 and go to Step 3.
- 5.
Perform UpdateNDSS (NDSS, Exchange (y, i, j)). If F > a1 f1 (Exchange (y, i, j)) + a2 f2 (Exchange (y, i, j)), then put F = a1 f1 (Exchange (y, i, j)) + a2 f2 (Exchange (y, i, j)) and i* = i, j* = j.
- 6.
If F < BestF then set y = Exchange (y, i*, j*) and go to Step 1. In the opposite case, return y and NDSS and finish.
The performance of the presented swap algorithm has been considerably reinforced by a meticulous implementation of functions f1, and f2,. It was taken into account that most of the computational effort is paid to objective function value enumeration of the solutions, which is a member of a current solution neighborhood, i.e., the solution differs from the current one only in one center location. This fact enabled the enumeration of an auxiliary ordered list of r nearest centers of the current solution for each user, and then the computational complexity of the objective function values of the neighboring solutions can be reduced to O(rn) instead of the usual O(pn).
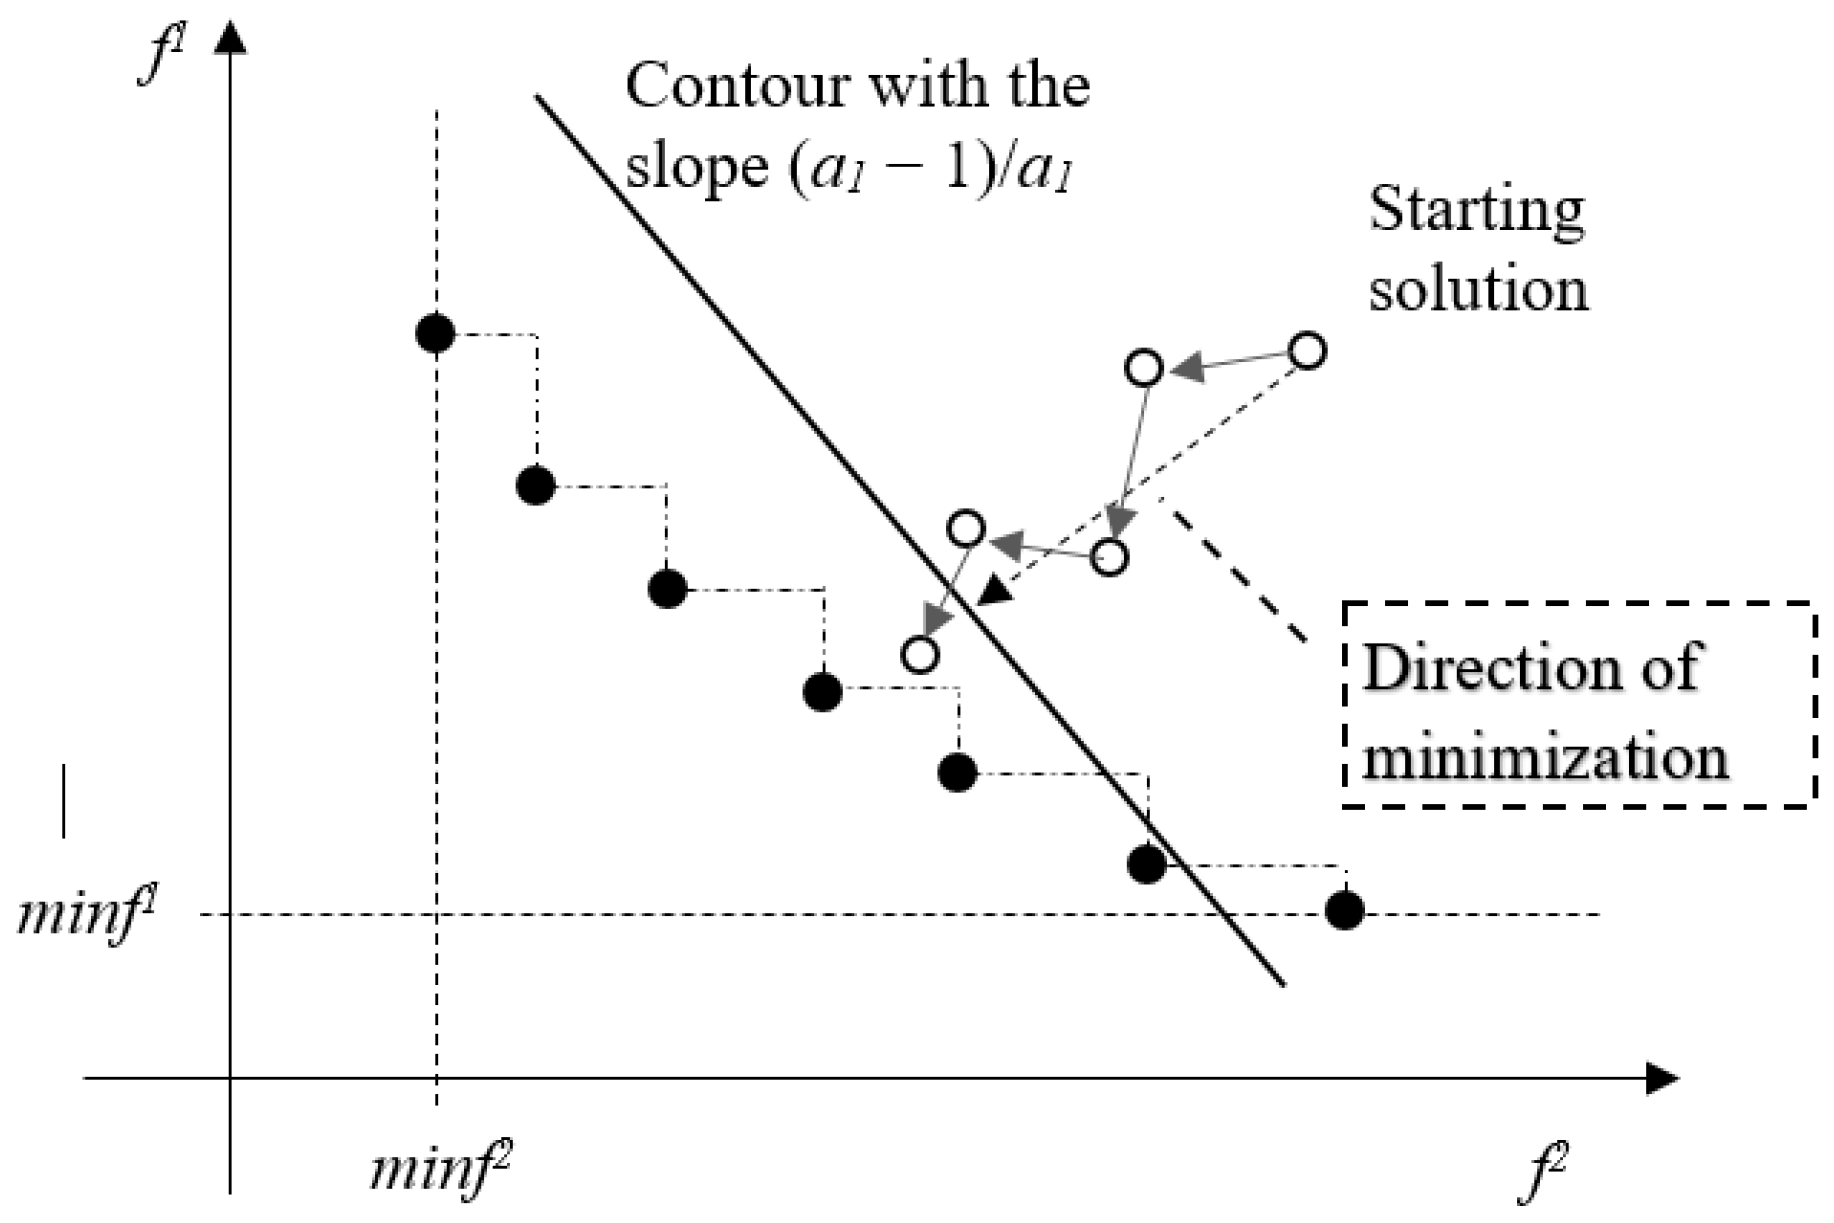
The experiments with the swap algorithm published in [
22] were performed under the following adjustments. The coefficient
a1 was changed with a step size Δ from 0 to 1, and the coefficient
a2 was determined according to
a2 = 1 −
a1. The performance of the swap algorithm for the individual values of
a1 and
a2 updated the current
NDSS. The survey of the result showed big differences between cardinalities of the Pareto front and resulting
NDSS. To find a source of the differences, the used scheme of optimization was submitted for analysis, and the following facts were established.
The starting solution for the above-mentioned experiments was chosen far from the leftmost and rightmost members of the Pareto front, as depicted in the two-dimensional space of values of
f1, and
f2, in
Figure 2.
In addition, the choice of the coefficients under rules a1 ∈ [0, 1] and a2 = 1 − a1 causes the contour of the solutions with the same value of the minimized function a1 f1,(y) + a2 f2,(y) to have a negative slope. Thus, the direction in which the swap algorithm proceeds is approximately perpendicular to a tangent line to a curve given by solutions of the Pareto front. During such a minimization process performed for a fixed value of a1, there is only a little chance that more than one member of the Pareto front will be met.
4. Directed Search for NDSS Members
The analysis performed in the previous section has induced an idea of the suggested directed search algorithm. Similar to the approach presented in [
22], the newly suggested algorithm starts with an approximation of the leftmost and rightmost members of the Pareto front. These approximations are obtained by applying the algorithm
Swap (
y,
a,
NDSS) to the starting solution
y mentioned in [
22] for
a = [0, 1] and
a = [1, 0], respectively. The starting step of the algorithm consists of the determination of
noT of triangulation points, where the number of points
noT is an input parameter of the approach. Two triangular points are the above-mentioned leftmost and rightmost members. Then, other
noT − 2 approximations of the Pareto front members are obtained by application of the swap algorithm for
ak = [
k*Δ, 1 −
k*Δ] for Δ = 1/(
noT − 1) and
k = 1, …,
noT − 2. The
noT obtained approximations are ordered increasingly according to the values of
f2, and form a list
sT of so-called “triangulation” points or milestones. The list
sT and starting set
NDSS of non-dominated designs represent the inputs of the
DirectedSearch algorithm.
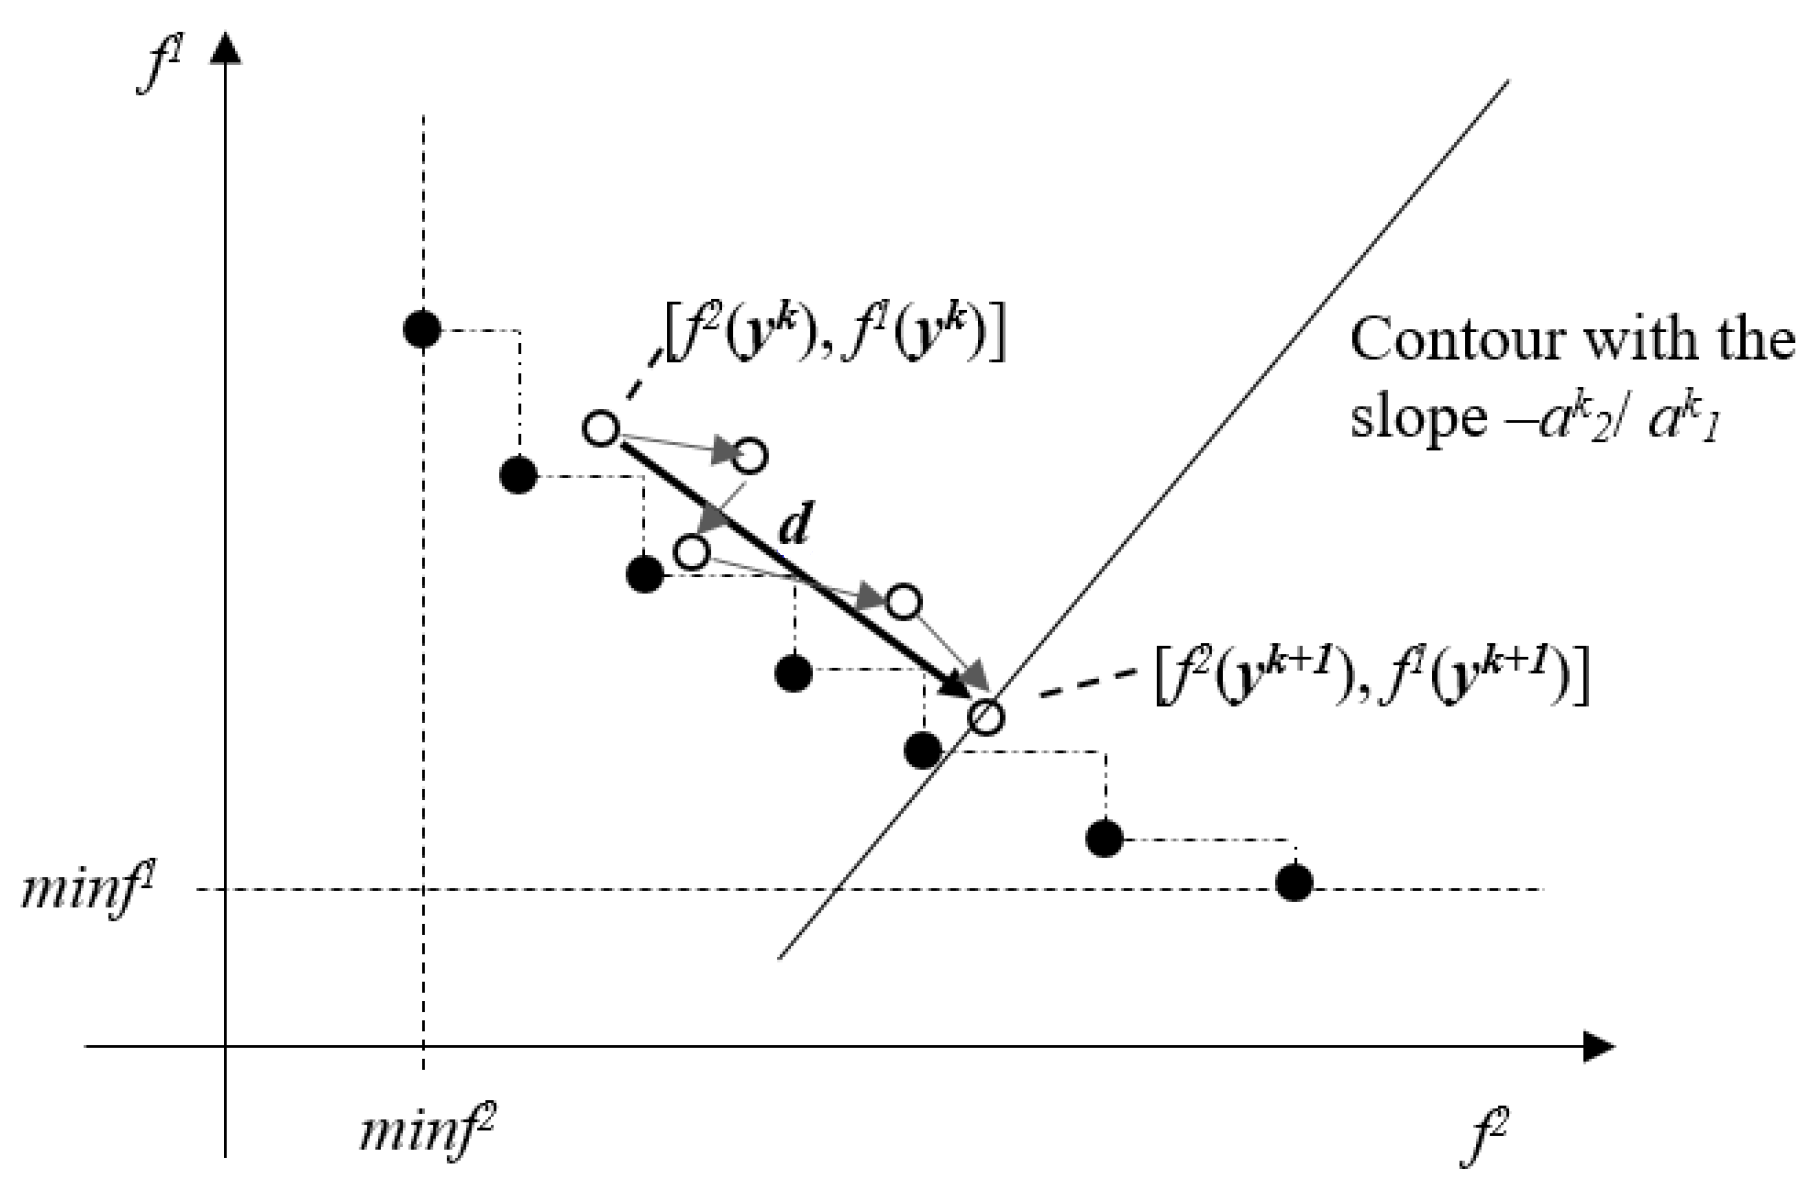
The basic step of the algorithm consists of the determination of the direction
d from the
k-th member of the list
sT to the (
k + 1)-th member in the space given by coordinates
f2, and
f1,. Expression (7) determines the vector specifying this direction in the two-dimensional Euclidean space.
The search in the direction
d from the point determined by the solution
yk is performed by the algorithm
Swap (
yk, ak,
NDSS), where components of
ak are computed according to (8).
If the algorithm
Swap is performed for specified
yk and
ak according to (8), then the direction of its progress is depicted in
Figure 3.
The chance of obtaining more approximations of the Pareto front members is bigger. The DirectedSearch algorithm performs according to the following steps:
DirectedSearch (noT, T, NDSS)
- 7.
Set k = 0.
- 8.
While k < noT – 1, perform Step 2; otherwise, terminate and return the current NDSS.
- 9.
For the k-th and (k + 1)-th members yk and yk+1 of the list T, determine ak according to (8) and perform Swap(yk, ak, NDSS). Set k = k + 1.
5. Numerical Experiments
This section represents the practical part of the paper because, here, we report the results of the performed numerical experiments. The main goal of the following computational study was to analyze the suggested algorithm from the viewpoint of Pareto front approximation quality and computational requirements measured by consumed computational time.
As far as available technical research support is concerned, a common PC equipped with the Intel® Core™ i7 4790 CPU@ 3.60 GHz processor and 8 GB RAM was used to implement all necessary functionalities. The suggested algorithm was coded in Java, making use of the NetBeans IDE 8.2 toolkit.
The benchmark dataset that was employed came from our earlier research projects, the findings of which may be seen in [
21,
22,
27,
28]. As all problem instances have their exact Pareto fronts, it is simple to assess the effectiveness of a suggested heuristic method.
The dataset consists of the middle-sized instances representing real EMS systems operated in selected self-governing regions of Slovakia. The list of regions contains Bratislava (BA), Nitra (NR), Trenčín (TN), Trnava (TT), and Žilina (ZA). The abbreviation in the brackets after each region name references a particular instance in the following tables reporting the achieved results. In the test problems, all inhabited network nodes represent both the set of candidates for an EMS station and the set of patients’ locations.
As the system criterion described by Expression (3) assumes that urgent pre-hospital healthcare is provided by the closest available service center, the parameter
r was set to three. The associated probability coefficients
qk for
k = 1, …,
r were set in percentage as follows:
q1 = 77.063,
q2 = 16.476, and
q3 = 100 −
q1 −
q2. These values come from a simulation model of the EMS system in Slovakia [
10]. The parameter
T used in (4) was set to 10 min [
21,
22,
27,
28].
Table 1 summarizes the basic characteristics of all studied problem instances. The left part of the table contains the problem size defined by the cardinality of the set of candidates for locating an EMS station. This value is denoted by
m. Then, the number
p of located service centers is reported. The remaining part of the table reports the information about the exact Pareto fronts of included system designs. The symbol
NoS denotes the number of Pareto front members. The total area of the polygon that the Pareto front’s members created is given in the column designated by
Area. The right part of the table contains some additional information about the exact Pareto front for each benchmark. For each instance, we report four characteristics: Let
MLM denote the leftmost component of the Pareto front and let
MRM identify the rightmost one. Then, let
f1(
MLM) denote the objective function value (3) for
MLM, and similarly, let
f2(
MLM) express Criterion (4) for
MLM. We will follow the above-mentioned denotation also for the rightmost element,
MRM. These four values can serve quite well to evaluate the Pareto front approximation quality when studying the heuristic method.
Let us focus now on the experiments aimed at the suggested approach to Pareto front approximation. The obtained results are summarized in the following two tables.
The left part of
Table 2, denoted by
Exact, contains the number of solutions
NoS forming the exact Pareto front together with the corresponding value of
Area. The value of
Area expresses the absolute size of the polygon formed by all members of the Pareto front. The middle part of the table, denoted by
Currently available, is used to report the results of the previously developed method, the results of which were published in [
28]. For each problem instance, we report the number of the Pareto front approximation elements denoted by
NoS, the value of
Area, and the value of
gap computed in the following way. Let the symbol
AreaAp denote the
Area of the approximate Pareto front. Similarly, let
AreaEx denote the
Area of the exact Pareto front. Then the quality of the approximation can be evaluated by
gap expressed as a relative difference in percentage computed according to Formula (9).
The results of recently completed tests using the suggested algorithm are presented in the right part of
Table 2. The first reported series of experiments was performed so that the number of permitted milestones
NPM was set to 20. The real number of milestones
RNM is reported in the last column of the table.
Table 3 summarizes the results, in which the number of permitted milestones
NPM was set to 15, 10, and 5, respectively. The table structure follows the right part of
Table 2.
The results reported in
Table 2 and
Table 3 confirm that the suggested approximate algorithm is able to bring much better results than the former solving method published in [
28]. Based on the achieved results, the following observation can be stated as a particular conclusion. The higher the number of permitted milestones (
NPM) was set, the lower the value of
Area that was achieved, and thus, the better the approximation of the exact Pareto front was returned as the output of the suggested algorithm. From the viewpoint of solution accuracy, we have constructed a very useful tool for bi-criteria optimization problems.
As far as the efficiency is concerned, it must be noted that the computational demands of the suggested solving approach are in order smaller than those required by the former exact method to Pareto front determination. Average computational times are summarized in
Table 4. The computational times of the exact approach were taken from [
18].
As far as the computational time is concerned, the result was obtained within several seconds to a few minutes, depending on the problem size. Even if the values of time are not directly reported, the suggested approach is able to find a good Pareto front approximation in a short time. This fact makes the method applicable to a wide spectrum of problems.
6. Conclusions
Bi-criteria optimization plays an important role when the specifics of the solved problem do not allow using a simple model minimizing only one objective function. A common example can be found in emergency medical service design, which was the core application domain of our research.
Specifically, the emergency medical service system design faces two contradictory quality criteria. First, the system objective follows the idea of minimizing the response time of the system to an average user and comes from the statistical fact that minimization of the average response time saves the largest number of lives in total. Nevertheless, this criterion does not take into account worse-located and less populated dwelling places, for which the response time may considerably exceed an acceptable value. That is why the fairness criterion has been simultaneously applied to minimize disutility perceived by the worst-situated minorities.
This paper was focused on providing the responsible authorities with a finite collection of non-dominated system designs from which the final solution can be chosen.
Since searching for the optimal Pareto front proved to be very demanding, the attention of operations researchers has been focused on the development of heuristic methods, which could approximate the original Pareto front in a much shorter time. In addition to the theoretical explanation, we provided the readers with the results of numerical experiments in order to evaluate the quality of the proposed algorithms. Based on the reported results, a conclusion can be made that the suggested algorithm significantly extends the state-of-the-art solving tools for specific location problems in which two contradictory objectives need to be optimized.
Future studies in this area of science may focus on building new algorithms that would produce a close approximation of the Pareto front of non-dominated system designs or on modifying certain existing techniques to obtain findings that are more accurate. The promising research direction can be seen in the application of self-learning methods for heuristic parameter adjustment.


