Abstract
(1) Background: Fractal analysis has been used as a mathematical method for studying the complexity of fractal structures such as trabecular bone that look similar at different scales. Bruxism is a disorder involving nonfunctional grinding and clenching of the teeth that leads to bone resorption and fractal dimension reduction. This study aimed to evaluate the trabecular pattern of the mandibular condyle, angle, and dental region in panoramic radiographs of individuals with and without bruxism using fractal analysis and a larger sample size. (2) Methods: A total of 365 panoramic radiographs belonging to two groups consisting of bruxism and non-bruxism individuals were assessed using fractal analysis. Fractal dimension (FD) values were calculated on each side for the three regions of interest (ROIs): the mandibular condylar head, mandibular angle, and interdental region between the second premolar and first molar. Statistical analysis was performed using binominal and chi-square tests, the Shapiro–Wilk test, and the Mann–Whitney test (α = 0.05). (3) Results: No significant differences were observed between the FD values of the ROIs in the two groups (p > 0.05). (4) Conclusions: No significant differences existed in the FD values of the ROIs in patients with and without bruxism. This result shows that fractal analysis of panoramic radiographs cannot be useful in detecting patients with bruxism.
1. Introduction
Fractals are patterns that look similar at different scales in which each small part resembles the whole. Fractal patterns are seen in many natural structures, including biological structures. In fact, many human organs display fractal properties. For instance, trabecular bone structures have fractal or fractal-like properties [1]. Fractal analysis is a mathematical method that is increasingly used to study the complexity of fractal structures due it to not being affected by imaging conditions, such as projection angle; its easy accessibility; and the fact that it provides a quantitative outcome, the fractal dimension (FD), for structural complexity [2,3]. A higher FD is associated with a more complex fractal structure; therefore, a higher FD demonstrates a more complex trabecular bone pattern [4]. In dentistry, fractal analysis is most frequently applied to panoramic and preapical radiographs to detect local or systemic disorders that can potentially change the fractal pattern [3]. Fractal analysis has been used to study various areas, such as in evaluating the relation between jaw bone structure and lactation [4], evaluating trabecular changes in periodontitis [5,6], detecting osteoporosis [7], implant osseointegration prediction [8], evaluating the effect of histogram algorithms on periapical radiographs [9], and investigating mandibular trabecular bone in bruxism [2], as it has the potential to determine the jaw bone internal trabecular pattern [3].
Bruxism is a disorder and an oral habit characterized by nonfunctional grinding and clenching of the teeth that occurs in 12.8% of adult individuals [10,11,12]. Bruxism can happen during sleep (nocturnal bruxism) or while awake (diurnal bruxism). Self-reports, clinical examination, and polysomnographic or electromyographic records of patients are used for diagnosis of bruxism [2,13]. Bruxism and other parafunctional habits result in condylar resorption as a consequence of mechanical stress [14], and it can cause TMD, disc displacement, and masticatory muscle pain [15].
Studies show that trabecular bone structure is affected in patients with bruxism in the mandibular condyle, gonial angle, and the region between the second premolar and first molar [2,13]. However, these studies have conflicting results. In one study, FD value measurements were only statistically different between bruxism and control groups in the condylar regions; FD values were lower in the right condyle in individuals with bruxism than in non-bruxer individuals [2]. Another study reported that, in individuals with bruxism, the gonial bone region FDs on both sides were significantly lower compared with control patients, while no significant difference was observed between the FD values of the condylar region between the groups [13]. This study aimed to evaluate the trabecular pattern of the mandibular condyle, angle, and dental region in panoramic radiographs of individuals with and without bruxism using fractal analysis and a larger sample size.
2. Materials and Methods
2.1. Patient Selection and Image Acquisition
In this study, panoramic radiographs from patients who attended to the Department of Oral Medicine and Radiology, King George’s Medical University, Lucknow, India, from November 2017 to September 2018 with no systemic condition affecting the bone, such as hyperparathyroidism, hypoparathyroidism, or Paget’s disease, were included. All procedures followed were in accordance with the ethical standards of the responsible committee on human experimentation (institutional and national) and with the Helsinki Declaration of 1975, as revised in 2008. This study was approved by the King George’s Medical University U.P. Institutional Ethical Committee (code: 104th ECM IIA/PI9). Patients included in the study were informed before the examination, and an informed consent form was signed by all participants. In accordance with the exclusion criteria, radiographs from patients not willing to participate or with inadequate exposure parameters, patient movement, surgical fixation plates, or any pathological lesions in the mandible, as well as those lacking the second premolar and first molar teeth, were eliminated. All radiographs were taken with a Planmeca PM 2002 CC Proline Panoramic X-ray device (Helsinki, Finland) with 60 kVp, 10 mA, and 18 s exposure parameters.
The required sample size was calculated to be a minimum of 311 using the below equation:
Bruxism in the patients was determined based on the polysomnography test, which was performed by one investigator on masseter muscles; observation of clinically flattened teeth upon examination; and a history of conscious or subconscious teeth clenching and grinding. Polysomnographic analysis was performed based on the procedure described in the study by Kapagiannidou et al. [16].
2.2. Image Preparation
All radiographs were obtained in DICOM format and imported to the ImageJ 1.8 software (NIH, USA) for fractal analysis. The program is available at https://imagej.nih.gov/ij/download.html, accessed on 13 December 2021.
Six regions of interest (ROIs) were specified for computing fractal dimensions (FDs) by two trained dentists (KTT and KB): two 50 × 50 pixel ROIs in each superior section of the condyle that were not in contact with cortical bone, two 100 × 100 pixel ROIs in each gonial area on the angle bisector of two lines crossing the inferior border of the mandible and the posterior border of the mandibular ramus without contact with the cortical bone, and two 50 × 50-pixel ROIs in the region between the second premolars’ apex and the mesial apex of the first molars without contact with the dental structure or lamina dura (Figure 1). The observers repeated the analysis with 20% of the images 1 month after the initial assessment.
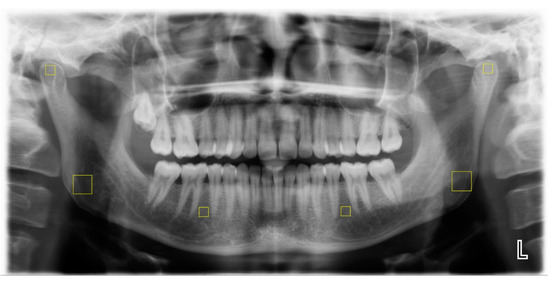
Figure 1.
Selection of ROIs (marked by yellow squares).
The FD is called a dimension due to its measurement of how completely an object fills space. For the FD value as an integer, an ideal point has zero dimensions, an ideal line has one dimension, an ideal plane has two dimensions, and an ideal volume has three dimensions. As the trabecular bone structures in two dimensions are not perfectly straight lines and do not fill the two-dimensional space entirely, their FD values range from 1 to 2 [17]. For example, compared to the trabecular bone structures with higher FD values, such as 1.45, those with low FD values, such as 1.2, would have fewer trabecular structures and would not entirely fill the two-dimensional space. While it is theoretically impossible to determine the FD value for a fractal point set created from digital radiographs from natural objects, such as bone structures, a good approximation can be achieved for the evaluation of FD values by using various fractal analysis techniques. All techniques rely on the association between a measuring tool and the geographical distribution of the object. There are various techniques for calculating FD values, such as the Hausdorff dimension, the Minkowski–Bouligand dimension, the mass–radius method, and the box-counting method [17]. In the box-counting method, the image’s Euclidean space is divided into a grid of boxes with the size of r, with the initial box size being equal to the original image’s size, in order to estimate the FDs. Then, as r gets smaller, the number of nonempty boxes (N(r)) is counted [17]. The gradient of a line in a diagram of the logarithm of N(r) versus the logarithm of r equates to the FD value (Figure 2). Grid box sizes typically decrease by a factor of 0.5 sequentially.
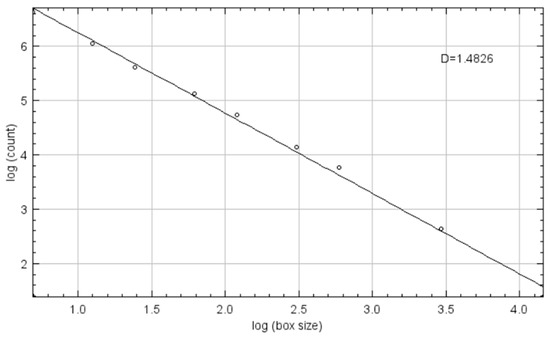
Figure 2.
Logarithm of N(r) versus logarithm of r diagram.
As a result of the box-counting approach being used in previous studies for calculating FD values [2,6,9], in this study, the fractal analysis was performed as explained below.
First, after ROI selection, they were cropped and isolated with the “clear outside” tool and then duplicated (Figure 3a). Afterwards, the “Gaussian Blur” function with 10 pixel sigma was applied to the second image for noise reduction (Figure 3b). Thereafter, the blurred images were subtracted from the raw images (Figure 3c) and converted to black and white by employing the “Make Binary” function to differentiate bone marrow and trabecular structures (Figure 3d). Finally, with the aim of computing FD values, fractal analysis was performed by using the “fractal box-counting” approach (mean intensity: 128). Image analysis was performed by two trained senior dental students who were blind to the existence of bruxism in the patients.
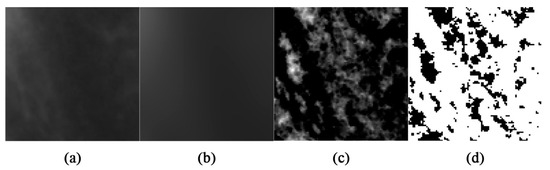
Figure 3.
ROIs after the (a) clear outside, (b) Gaussian blur, (c) subtracting, and (d) make binary functions.
2.3. Statistical Analysis
Interobserver and intraobserver agreements were determined using the intraclass correlation coefficient (ICC). Binominal and chi-square tests were utilized to compute descriptive statistics for gender and the existence of bruxism in the participants. The Shapiro–Wilk test analyzed variables’ conformity to the normal distribution. As a result, it was found that variables did not conform to a normal distribution. Thus, non-parametric tests were applied. The Mann–Whitney U test was employed to compare the FD values within the two groups (patients with bruxism and those without bruxism). The level of significance was set to 0.05. Data were analyzed using Statistical Package for the Social Sciences (SPSS, v.26, IBM Statistics, Armonk, NY, USA).
3. Results
A total of 488 images were initially included in this study. After excluding 123 radiographs, 365 images were analyzed in this study. There was adequate inter- and intraobserver concurrence in image fractal dimension assessment due to the high two-way random consistency ICC (>0.75, p value < 0.001). A total of 54.8% of the individuals (200) were male, and 45.2% (165) were female. The sex and age ranges of all participants divided according to the existence of bruxism are demonstrated in Table 1.

Table 1.
Demographic information for study participants.
A total of 45% of men and 50.3% of women had bruxism. The chi-square test did not show any significant difference between the sexes in the prevalence of bruxism (p value = 0.313).
Using the Mann–Whitney U test, there were no significant differences in FD values in the six ROIs between the two groups (bruxer individuals and non-bruxers) (p value > 0.05) (Table 2).
Table 2.
FD values of different ROIs in the study groups.
Furthermore, the Mann–Whitney U test showed that the FD values were not significantly different between the two sexes for the bruxer (Table 3) and non-bruxer groups (Table 4) (p value > 0.05). Comparing the mean FD values in different ROIs with the Mann–Whitney U test demonstrated that the alveolar regions in both sides had significantly lower FD values compared to other ROIs (p values < 0.001), except for the right gonial region (p value = 0.137).
Table 3.
FD values of different ROIs for the two sexes in the bruxer group.
Table 4.
FD values of different ROIs for the two sexes in the non-bruxer group.
Moreover, the Kruskal–Wallis test showed a significant difference between ROIs, and the Mann–Whitney test, as a post hoc test, demonstrated that the FD values were significantly different between age ranges for the right condyle (p value = 0.03), right gonial region (p value = 0.001), left gonial region (p value = 0.002), and left alveolar region (p value < 0.001). Further information about the FD values in different age ranges after performing the Kruskal–Wallis test is mentioned in Table 5.
Table 5.
Mean FDs ± standard deviation for different ROIs in different age ranges.
Additionally, the Mann–Whitney post hoc test showed that FD values were significantly higher in the 60–69 age range compared to 70–79 in the right condyle (p value = 0.034), right gonial region (p value = 0.001), left gonial region (p value = 0.001), and left alveolar region (p value < 0.001).
4. Discussion
Based on our findings, no significant differences existed in the FD values for the ROIs in patients with and without bruxism of different sexes. This result showed that fractal analysis of panoramic radiographs cannot be useful in detecting patients with bruxism. Moreover, the findings of this study showed that, in different age ranges, there were significant differences in the right condyle and gonial region and left gonial and alveolar region, and the FD values were significantly higher in 60–69 year old individuals compared to 70–79 year old individuals in these ROIs. Moreover, the results of this study showed that the maximum and minimum mean FD values in both sides were obtained for the condylar and alveolar regions, respectively.
No consensus exists regarding the diagnosis of bruxism due to its subjective and unspecific nature [18]. Several methods have been suggested for diagnosing bruxism, including polysomnography, questionnaires, clinical examination, and electromyography [12,19]. However, based on existing literature, a combination of polysomnography, clinical evidence of flat facets in the teeth, and a history of clenching and grinding was used in this study to confirm bruxism [20].
While the application of image enhancement techniques to medical images is a crucial stage in many diagnostic processes and leads to better diagnosis in oral radiographs, such as in evaluating the periapical region [9], for visual recognition of changes in bone structures in radiographs, a minimum change of 30% is needed [21]. One technique that has the potential to improve the diagnostic accuracy of radiographs, even when the changes are below 30%, is fractal analysis, which employs mathematical morphology for evaluation of bone trabecular structures [22]. Various studies have been carried out using fractal analysis as a tool for evaluating bone structure. According to a study by Soltani et al. from 2021, FD levels decrease in moderate and severe periodontitis [6].
In Shrout et al.’s study, 45 digital bitewing radiographs were taken obtained individuals. Afterward, the FD values of four different ROIs (maxillary and mandibular premolar and molar regions) were determined. This study found that FD values were affected by the dimensions of ROIs more than their gray level values [23]. Thus, in the current study, for ROI selection in the condyle and alveolar area, 50 × 50 pixel regions of trabecular bone without teeth, periodontia, or cortical bone were selected for fractal analysis. Moreover, for applying fractal analysis in the gonial regions, 100 × 100 pixel ROIs were selected from the trabecular bone of the mandible, excluding the cortical bone because of its effect on FD values.
In a study performed by Gulec et al. in 2021 with 212 individuals, three bilateral regions of interest (ROIs) were selected: the mandibular condyle, the mandibular angle, and the area between the apical regions of the mandibular second premolar and the first molar teeth. It was determined that FD values were lower in the right condyle in patients with bruxism compared to those without bruxism [2]. However, another study by Eninanç et al. from 2021 with 252 individuals evaluated eight paired mandibular regions of interest (the bilateral condylar and gonial regions and the bilateral dentate regions between the apical areas of the first molar and second premolar and between the first premolar and canine). Fractal dimensions (FDs) were calculated at each site. This study showed that FD values in the gonial region on both sides in patients with bruxism were significantly lower compared to control individuals [13]. The inconsistency observed between the findings of these studies may indicate that panoramic radiographs are not a suitable screening tool for diagnosis of bruxism. Additionally, performing fractal analysis on panoramic radiographs does not always yield accurate FD values, as panoramic radiographs are prone to technical errors, superimpositions, and low quality. A study performed by Bollen et al. showed that FD values in panoramic radiographs were lower than those in periapical radiographs for the same ROIs [24]. However, since, in this study, ROIs located in the condylar and gonial region were investigated, panoramic radiographs were selected as the screening tool.
Another study was performed by Kolcakoglu et al. in 2022 to evaluate bone density in sleep bruxers among pediatric patients using panoramic radiographs, and three regions (the geometric center of the condyle, the angle region under the mandibular canal, and the distal region of the mental foramen) were evaluated. It was determined that there were no differences in FD values in the right and left in all regions in either sex. Moreover, for the angle and condyle regions, the sleep bruxism group had significantly higher FD values than the control group and a moderate negative correlation existed between age and condyle FD values among controls. Therefore, the FD values used to evaluate trabeculation of the mandibular bone are affected by sleep bruxism in the mandibular angle and condyle regions [25].
Furthermore, in 2023, Kurut et al. compared bone structure in bruxer and non-bruxer individuals with bone apposition. A total of 200 bilateral jaw samples were studied (80 probable bruxer and 20 non-bruxer G0 individuals). Each mandibular apposition was classified in the groups G0, G1, G2, or G3 based on severity. FDs were calculated by selecting seven regions of interest from each sample. When the probable bruxer group was compared to the non-bruxer G0 group, it was discovered that FDs were statistically higher in the mandibular angle and cortical bone regions in the probable bruxer group. Regarding FD averages in cortical bone, there was a statistically significant difference between probable bruxer G0 and non-bruxer G0 grades. The relationship between FDs and gender was observed to be significant for the canine apex and canine distal regions. In comparison to G0 non-bruxer individuals, bruxer individuals were observed to have higher levels of FDs in the mandibular angle region and cortical bone [26].
The findings of the present study indicated that the condylar regions in both sides had the highest FD values compared to other examined ROIs and, therefore, the condylar regions had higher trabecular complexity than other locations. Moreover, this study showed that the FD values of alveolar regions were lowest. Yasar et al.’s study from 2005 compared the trabecular structures of dentate and edentulous regions and their FD values. They showed that the lower FD values in the alveolar regions with dentition were because these regions had a more organized trabecular structure and were better designed to resist occlusal forces compared to edentulous regions [27]. In agreement with the findings of this study, Gulec et al., who used the box-counting method to determine FDs in individuals with bruxism, showed that the lowest FD values were related to the alveolar regions in both the bruxer and non-bruxer groups [2]. Furthermore, Sener et al. used fractal analysis with osteoporotic patients using bisphosphonates to assess the trabecular structure in three separate ROIs from the mandibular corpus, the gonial, and the interdental areas. Their findings showed that FD values were lower in the interdental region [28]. In contrast to previous studies, Wilding et al. demonstrated that the FD values obtained from the alveolar region with dentition were higher than those from the edentulous region [29]. It is probable that the employment of different methods for measuring FDs (based on volume calculation) throughout the fractal analysis procedures led to the discrepancy between the findings of Wilding et al. and those of the present study. The authors of the current study utilized the box-counting method, which has been reported in the literature the most frequently [3].
Unlike the present study, some previous studies showed that individuals’ sex affects FD values [2,30,31]. In Kayipmaz et al.’s study, the authors calculated the FD values of 70 participants, 35 of whom had TMJ arthritis, in the condylar region by using cone beam computed tomography images [31]. This study showed that FD values in females were significantly lower than in males. In addition, Gulec et al.’s study demonstrated that FD values were lower in females compared to males [2]. On the other hand, some studies showed that the sex of the participants and FD values had no effects on each another [5,32,33]. Updike et al.’s study from 2008 determined the effect of chronic periodontitis on FD values using the periapical radiographs of 56 males and 52 females. It was shown that gender and FD were not correlated [5]. Moreover, Gumussoy et al.’s study utilized fractal analysis of the panoramic radiographs of 28 females and 23 males to evaluate the effect of chronic renal failure on the trabecular structure of the mandible. In this study, gender did not lead to significant differences in FD values [32]. The reason for these discrepancies between the findings of previous studies and this study could be related to the various modalities of the radiographs used.
Due to the more dynamic structure of trabecular bone compared to cortical bone, age-related alterations have a greater impact on trabecular bone structures [34]. The results of this study showed that there were significant differences between the age ranges of 60–69 and 70–79 in right condyle and gonial region and left gonial and alveolar region and, therefore, that higher age leads to lower FD values in individuals in these age ranges. Unlike the present study, Gulec et al.’s study showed a relation between age, osteoporosis, and FD values. In Gulec et al.’s study, the changes in the trabeculation of the mandibular bones in individuals who had bruxism were examined and only a slight negative connection between age and FD measures was found in the right condyle region; no other significant correlations were found [2]. The difference between the findings of the present study and those of Gulec et al.’s study may be related to the lower sample size of Gulec et al.’s study compared to this study. Moreover, in contrast to the findings of the present study, Ruttimann et al. randomly selected six premenopausal females and six postmenopausal males and measured their FD values from their periapical radiographs. They observed that the group with the higher average age had greater FD values [35]. It is reasonable to conclude that variations in the modalities of the employed radiographs are the cause of the discrepancy between the findings of the two studies.
One of the limitations of this study was that, due to anatomic variations and technical errors, the ROIs in the panoramic radiographs could not be standardized in all cases. However, since panoramic radiographs are commonly obtained for dental patients, they application for different diagnostic purposes must be investigated. Further studies on existing CBCT images of patients with bruxism can be performed to test the observed findings. Another limitation of the present study was that bruxism was not subcategorized based on the etiology. Since the etiological factors contributing to habits such as bruxism are complex, reaching a conclusion regarding the reason for bruxism was beyond the scope of the present study. The findings of the present study need to be validated with different populations, as racial anatomical differences can affect how the stomatognathic complex responds to excessive stress resulting from bruxism.
5. Conclusions
Based on our findings, no significant differences existed in the FD values of the ROIs in patients with and without bruxism. This result shows that fractal analysis of panoramic radiographs cannot be useful in detecting patients with bruxism. Moreover, there were no significant differences in the FD values between sexes.
Author Contributions
P.S. designed and supervised the study, interpreted the data, and critically reviewed the original draft. K.B. and K.T.T. performed the fractal analysis and wrote the initial draft. A.M. designed the study, validated the data, and critically reviewed the original draft. A.C. supervised the study and critically reviewed the original draft. A.V. designed the study and critically reviewed the original draft. G.S. designed the study and critically reviewed the original draft. All authors have read and agreed to the published version of the manuscript.
Funding
This research received no external funding.
Institutional Review Board Statement
All procedures followed were in accordance with the ethical standards of the responsible committee on human experimentation (institutional and national) and with the Helsinki Declaration of 1975, as revised in 2008. This study was approved by the King George’s Medical University U.P. Institutional Ethical Committee (code: 104th ECM IIA/PI9).
Informed Consent Statement
Informed consent was obtained from all subjects involved in the study.
Data Availability Statement
The datasets analyzed during the current study are not publicly available due to the authors not having consent from all patients to publicly publish these data, but they are available from the corresponding author upon reasonable request.
Acknowledgments
The authors would like to thank Paul Updike and Sajad Sami for their support.
Conflicts of Interest
The authors declare no conflict of interest.
References
- MeSH Fractals. 1994. Available online: https://www.ncbi.nlm.nih.gov/mesh/?term=fractal (accessed on 3 January 2023).
- Gulec, M.; Tassoker, M.; Ozcan, S.; Orhan, K. Evaluation of the mandibular trabecular bone in patients with bruxism using fractal analysis. Oral Radiol. 2021, 37, 36–45. [Google Scholar] [CrossRef] [PubMed]
- Kato, C.N.; Barra, S.G.; Tavares, N.P.; Amaral, T.M.; Brasileiro, C.B.; Mesquita, R.A.; Abreu, L.G. Use of fractal analysis in dental images: A systematic review. Dentomaxillofac. Radiol. 2020, 49, 20180457. [Google Scholar] [CrossRef]
- Coşgunarslan, A.; Canger, E.M.; Soydan Çabuk, D.; Kış, H.C. The evaluation of the mandibular bone structure changes related to lactation with fractal analysis. Oral Radiol. 2020, 36, 238–247. [Google Scholar] [CrossRef] [PubMed]
- Updike, S.X.; Nowzari, H. Fractal analysis of dental radiographs to detect periodontitis-induced trabecular changes. J. Periodontal. Res. 2008, 43, 658–664. [Google Scholar] [CrossRef] [PubMed]
- Soltani, P.; Sami, S.; Yaghini, J.; Golkar, E.; Riccitiello, F.; Spagnuolo, G. Application of Fractal Analysis in Detecting Trabecular Bone Changes in Periapical Radiograph of Patients with Periodontitis. Int. J. Dent. 2021, 2021, 3221448. [Google Scholar] [CrossRef]
- Franciotti, R.; Moharrami, M.; Quaranta, A.; Bizzoca, M.E.; Piattelli, A.; Aprile, G.; Perrotti, V. Use of fractal analysis in dental images for osteoporosis detection: A systematic review and meta-analysis. Osteoporos. Int. 2021, 32, 1041–1052. [Google Scholar] [CrossRef] [PubMed]
- Soylu, E.; Coşgunarslan, A.; Çelebi, S.; Soydan, D.; Demirbaş, A.E.; Demir, O. Fractal analysis as a useful predictor for determining osseointegration of dental implant? A retrospective study. Int. J. Implant Dent. 2021, 7, 14. [Google Scholar] [CrossRef]
- Mehdizadeh, M.; Tavakoli Tafti, K.; Soltani, P. Evaluation of histogram equalization and contrast limited adaptive histogram equalization effect on image quality and fractal dimensions of digital periapical radiographs. Oral Radiol. 2023, 39, 418–424. [Google Scholar] [CrossRef]
- The glossary of prosthodontic terms. J. Prosthet. Dent. 2005, 94, 10–92. [CrossRef]
- MeSH, Bruxism. 1965. Available online: https://www.ncbi.nlm.nih.gov/mesh/68002012 (accessed on 3 January 2023).
- Manfredini, D.; Serra-Negra, J.; Carboncini, F.; Lobbezoo, F. Current Concepts of Bruxism. Int. J. Prosthodont. 2017, 30, 437–438. [Google Scholar] [CrossRef]
- Eninanç, İ.; Yalçın Yeler, D.; Çınar, Z. Investigation of mandibular fractal dimension on digital panoramic radiographs in bruxist individuals. Oral Surg. Oral Med. Oral Pathol. Oral Radiol. 2021, 131, 600–609. [Google Scholar] [CrossRef]
- Arnett, G.W.; Milam, S.B.; Gottesman, L. Progressive mandibular retrusion--idiopathic condylar resorption. Part I. Am. J. Orthod Dentofac. Orthop. 1996, 110, 8–15. [Google Scholar] [CrossRef]
- Jiménez-Silva, A.; Peña-Durán, C.; Tobar-Reyes, J.; Frugone-Zambra, R. Sleep and awake bruxism in adults and its relationship with temporomandibular disorders: A systematic review from 2003 to 2014. Acta Odontol. Scand. 2017, 75, 36–58. [Google Scholar] [CrossRef]
- Kapagiannidou, D.; Koutris, M.; Wetselaar, P.; Visscher, C.M.; van der Zaag, J.; Lobbezoo, F. Association between polysomnographic parameters of sleep bruxism and attrition-type tooth wear. J. Oral Rehabil. 2021, 48, 687–691. [Google Scholar] [CrossRef] [PubMed]
- Mandelbrot, B. Fractals: Form, Chance, and Dimension; W.H.Freeman & Company: New York, NY, USA, 1983. [Google Scholar]
- Huhtela, O.S.; Näpänkangas, R.; Joensuu, T.; Raustia, A.; Kunttu, K.; Sipilä, K. Self-Reported Bruxism and Symptoms of Temporomandibular Disorders in Finnish University Students. J. Oral Facial Pain Headache 2016, 30, 311–317. [Google Scholar] [CrossRef]
- Bulanda, S.; Ilczuk-Rypuła, D.; Nitecka-Buchta, A.; Nowak, Z.; Baron, S.; Postek-Stefańska, L. Sleep Bruxism in Children: Etiology, Diagnosis, and Treatment—A Literature Review. Int. J. Environ. Res. Public Health 2021, 18, 9544. [Google Scholar] [CrossRef] [PubMed]
- Stuginski-Barbosa, J.; Porporatti, A.L.; Costa, Y.M.; Svensson, P.; Conti, P.C.R. Agreement of the International Classification of Sleep Disorders Criteria with polysomnography for sleep bruxism diagnosis: A preliminary study. J. Prosthet. Dent. 2017, 117, 61–66. [Google Scholar] [CrossRef] [PubMed]
- Corbet, E.F.; Ho, D.K.; Lai, S.M. Radiographs in periodontal disease diagnosis and management. Aust. Dent. J. 2009, 54 (Suppl. S1), S27–S43. [Google Scholar] [CrossRef] [PubMed]
- Sener, E.; Cinarcik, S.; Baksi, B.G. Use of Fractal Analysis for the Discrimination of Trabecular Changes Between Individuals with Healthy Gingiva or Moderate Periodontitis. J. Periodontol. 2015, 86, 1364–1369. [Google Scholar] [CrossRef]
- Shrout, M.K.; Farley, B.A.; Patt, S.M.; Potter, B.J.; Hildebolt, C.F.; Pilgram, T.K.; Yokoyama-Crothers, N.; Dotson, M.; Hauser, J.; Cohen, S.; et al. The effect of region of interest variations on morphologic operations data and gray-level values extracted from digitized dental radiographs. Oral Surg. Oral Med. Oral Pathol. Oral Radiol. Endod. 1999, 88, 636–639. [Google Scholar] [CrossRef]
- Bollen, A.; Taguchi, A.; Hujoel, P.; Hollender, L. Fractal dimension on dental radiographs. Dentomaxillofac. Radiol. 2001, 30, 270–275. [Google Scholar] [CrossRef]
- Kolcakoglu, K.; Amuk, M.; Sirin Sarıbal, G. Evaluation of mandibular trabecular bone by fractal analysis on panoramic radiograph in paediatric patients with sleep bruxism. Int. J. Paediatr. Dent. 2022, 32, 776–784. [Google Scholar] [CrossRef]
- Kurt, M.H.; Yilmaz, S.; Evli, C.; Karahan, S. Comparative Evaluation of Trabecular Bone Structures of Bruxist and Non-Bruxist Individuals with Bone Apposition in The Mandible Angle Region by Fractal Analysis. J. Oral Rehabil. 2023. [Google Scholar] [CrossRef]
- Yasar, F.; Akgünlü, F. Fractal dimension and lacunarity analysis of dental radiographs. Dentomaxillofac. Radiol. 2005, 34, 261–267. [Google Scholar] [CrossRef]
- Sener, E.B.B. Evaluation of fractal dimension and mandibular cortical index in healthy and osteoporosis patients. Ege Dent. J. 2016, 37, 159–167. [Google Scholar]
- Wilding, R.J.; Slabbert, J.C.; Kathree, H.; Owen, C.P.; Crombie, K.; Delport, P. The use of fractal analysis to reveal remodelling in human alveolar bone following the placement of dental implants. Arch. Oral Biol. 1995, 40, 61–72. [Google Scholar] [CrossRef] [PubMed]
- Alman, A.C.; Johnson, L.R.; Calverley, D.C.; Grunwald, G.K.; Lezotte, D.C.; Hokanson, J.E. Diagnostic capabilities of fractal dimension and mandibular cortical width to identify men and women with decreased bone mineral density. Osteoporos. Int. 2012, 23, 1631–1636. [Google Scholar] [CrossRef]
- Kayipmaz, S.; Sezgin, Ö.S.; Saricaoğlu, S.T.; Çan, G. An in vitro comparison of diagnostic abilities of conventional radiography, storage phosphor, and cone beam computed tomography to determine occlusal and approximal caries. Eur. J. Radiol. 2011, 80, 478–482. [Google Scholar] [CrossRef]
- Gumussoy, I.; Miloglu, O.; Cankaya, E.; Bayrakdar, I.S. Fractal properties of the trabecular pattern of the mandible in chronic renal failure. Dentomaxillofac. Radiol. 2016, 45, 20150389. [Google Scholar] [CrossRef] [PubMed]
- Amer, M.E.; Heo, M.S.; Brooks, S.L.; Benavides, E. Anatomical variations of trabecular bone structure in intraoral radiographs using fractal and particles count analyses. Imaging Sci. Dent. 2012, 42, 5–12. [Google Scholar] [CrossRef]
- Bryant, S.R. The effects of age, jaw site, and bone condition on oral implant outcomes. Int. J. Prosthodont. 1998, 11, 470–490. [Google Scholar] [PubMed]
- Ruttimann, U.E.; Webber, R.L.; Hazelrig, J.B. Fractal dimension from radiographs of peridental alveolar bone. A possible diagnostic indicator of osteoporosis. Oral Surg. Oral Med. Oral Pathol. 1992, 74, 98–110. [Google Scholar] [CrossRef] [PubMed]


Disclaimer/Publisher’s Note: The statements, opinions and data contained in all publications are solely those of the individual author(s) and contributor(s) and not of MDPI and/or the editor(s). MDPI and/or the editor(s) disclaim responsibility for any injury to people or property resulting from any ideas, methods, instructions or products referred to in the content. |
© 2023 by the authors. Licensee MDPI, Basel, Switzerland. This article is an open access article distributed under the terms and conditions of the Creative Commons Attribution (CC BY) license (https://creativecommons.org/licenses/by/4.0/).