Abstract
The rapid growth of tourism on Jeju Island has led to an increase in traffic volume, causing accelerated ground subsidence at the intersections between natural caves and roads. Natural phenomena are not caused by a single specific factor, but rather occur through interactions among multiple factors. Therefore, to analyze natural phenomena, it is necessary to consider not only the main effects, but also the interactions among various factors. In this study, the design of experiments was utilized to analyze the vibration-generating mechanism according to the geometrical characteristics of lava tubes, a kind of natural cave. Analysis of variance was used as the main analysis method, and multiple linear regression analysis and decision trees were additionally used. To detect all the interaction effects, multi-way factorial design, which can estimate the effect of any combination of levels, was utilized. The joint orientation, aspect ratio, and cover depth were selected as factors representing the geometrical characteristic of the lava tubes, and vehicle speed was selected as an external influence factor. As a result of the analysis, all the main effects were found to be significant, and the results of the additional two analysis methods were consistent. The two-factor interactions that showed significant results were aspect ratio cover depth, joint orientation vehicle speed, and joint orientation shape ratio. However, it was difficult to analyze the interaction effect using multiple regression analysis and decision tree analysis. Among the two-factor interactions, aspect ratio cover depth was found to be the most significant, while the main effect of the two interacting factors was the least significant. The most significant effect at a specific level of aspect ratio and cover depth could be analyzed through an interaction plot. These findings will be useful for evaluating the stability of lava tubes using only geometrical characteristics.
1. Introduction
Ground subsidence, potholes, and falling rocks occur in natural caves due to vehicle vibration loads where the road and the natural caves intersect. There are 142 points of intersection between natural caves and roads on Jeju Island [1]. In the past, geological studies have mainly been performed on lava tubes, a kind of natural cave, because they are usually not subjected to special external forces [2,3,4]. To explore the mechanism of lava tube formation, a large number of experimental studies have been carried out by investigators [5,6,7,8].
Lava tubes form as lava flows downward. The surface is hardened by cold air, and the lava flows inside, reducing heat loss at the flow surface and extending the flow up to several kilometers from the vent. These lava tubes have a low cover depth, and there is a high risk of ground subsidence when external force occurs. While most lava tubes collapse within a relatively short period due to their easily weakened geological characteristics immediately after their initial formation, the lava tubes distributed throughout Jeju Island have preserved the surface flow characteristics of the initial lava flows very well for a long period of time [9]. However, the possibility that the geometric value of these lava tubes might also be easily affected by continuous development is being raised.
The complex action of multiple factors has resulted in the formation of complex structures and structural features in lava tubes. Theoretical and numerical simulations are mainly used to describe these structures [10]. However, it is not easy to explore the interaction effects of the geometrical characteristics of lava tubes only with the results of numerical simulations.
To resolve these problems, in this study, a dataset was formed using a numerical analysis of the geological and geometrical characteristics of the lava tubes on Jeju Island. The design of experiments (DoE) was used throughout the research process. In addition, the factors (main effects, interaction effects) that affect the occurrence of vibration in the lava tubes were analyzed using multi-way analysis of variance (ANOVA). The design of experiments involves designing ways in which to perform an experiment for a problem in order for it to be solved and how to handle the data, in addition to determining what statistical method should be used to analyze the data obtained through the experiment to obtain the maximum information with minimal effort and cost. The main kinds of data analysis used include ANOVA, regression analysis, etc. In this study, experiments were performed for all combinations of each level of factor, and the full factorial arrangement method, which can estimate all factor effects, was used. For the data analysis, ANOVA was used for interpretation, focusing on the interaction effect. In addition, multiple regression analysis and decision tree analysis were performed to compare the results according to each interpretation method.
This study is expected to provide a scientific basis for revealing the mechanism of vibration triggered by vehicles passing directly over a lava tube according to its geometric characteristics.
2. Vibration Mechanism Generated in Lava Tube under Vehicle Load
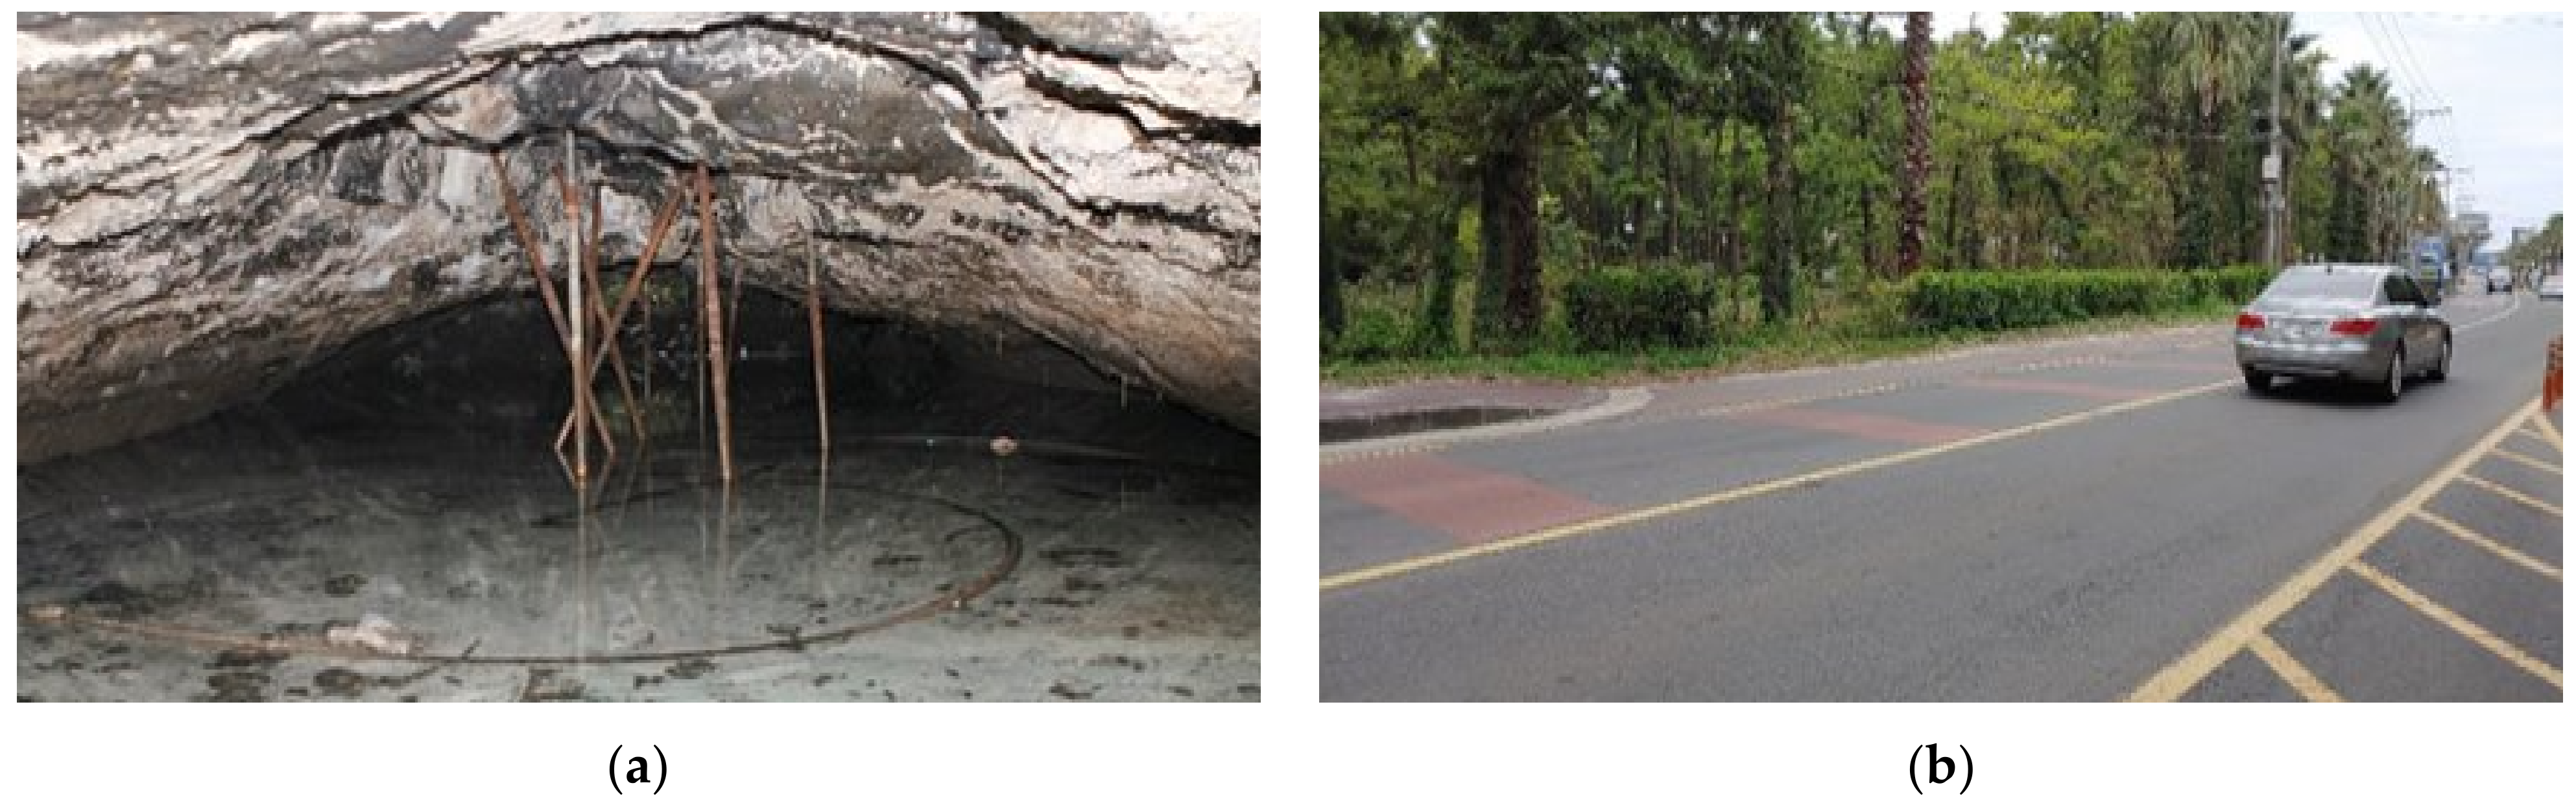
Figure 1a shows the Jeamcheon lava tube, one of the lava tubes located on Jeju Island. Since the lava tube exists under the road, reinforcements have been installed to suppress the deformation of the ceiling due to the continuous vehicle vibration load. Figure 1b shows the road intersection at the top of the Jeamcheon lava tube. Vehicles such as dump trucks, buses, and cars pass on the upper road.

Figure 1.
Jeamcheon lava tube on Jeju Island. (a) Inside of Jeamcheon lava tube; (b) upper road of Jeamcheon lava tube.
When a construction site or road is located adjacent to a lava tube, vibrations generated during vehicle movement and equipment operation may cause damage to the cave or incur serious damage, such as collapse. In addition, as a cause of rockfall in lava tubes on Jeju Island, vibrations caused by vehicle traffic on the upper part of the cave have a large effect [11].
Lava tubes are a part of natural heritage, and the natural heritage is managed based on vibrations. The standard for the continuous vibration of natural heritage is 0.07 cm/sec in terms of noise [12,13].
With reference to this, vibration was selected as the characteristic value of a natural cave under continuous dynamic load from a vehicle.
A phenomenon in which an object tremble or shakes from its equilibrium position when subjected to an external force is called vibration. In general, the vibration system is divided into four elements: mass, spring, damper, and external force, as shown in Equation (1) [14].
Here, : mass, : damping coefficient, : stiffness coefficient, : acceleration, : velocity, : displacement, and : external force.
Mass, damping, and stiffness are the unique characteristics of the object to be analyzed, and can be obtained using empirical formulas based on drilling survey results in order to reflect the geological characteristics of lava tubes distributed on Jeju Island. Since lava tubes are created by hardening lava, their material properties may be similar, but their shape is not constant. Therefore, the shape of any specific point cannot represent the shape of the entire lava tube. It is necessary to select factors that represent the geometrical shape of the lava tube in order to analyze it according to the geometrical shape change.
The magnitude of the damping effect will vary depending on the cover height and soil characteristics, but since they have the same ground characteristics, the cover depth was selected to analyze the difference in the vibrations generated by the size of the damping effect in the geometry of the lava tube.
The distribution pattern and strength of the discontinuous surface of the rock are important factors in the analysis of rock failure behavior and they are the most representative of the geometrical characteristics of lava tubes. The physical characteristics of the lava tube in terms of discontinuity include the joint orientation, width, and thickness. The discontinuous surface of the lava tube is cut in a certain direction, and physical properties, such as strength and the deformability of the rock mass, are greatly affected by this direction. The width and thickness of the joints vary, which can change the strength, modulus of elasticity, and durability of the rock mass. Lava tubes are generally made of rocks, and thus develop no joints. Therefore, it is unlikely that the vibration load of the vehicle will cause a joint in the lava tube. If the joint orientation coincides with the orientation of vibration, the discontinuity will respond much more sensitively.
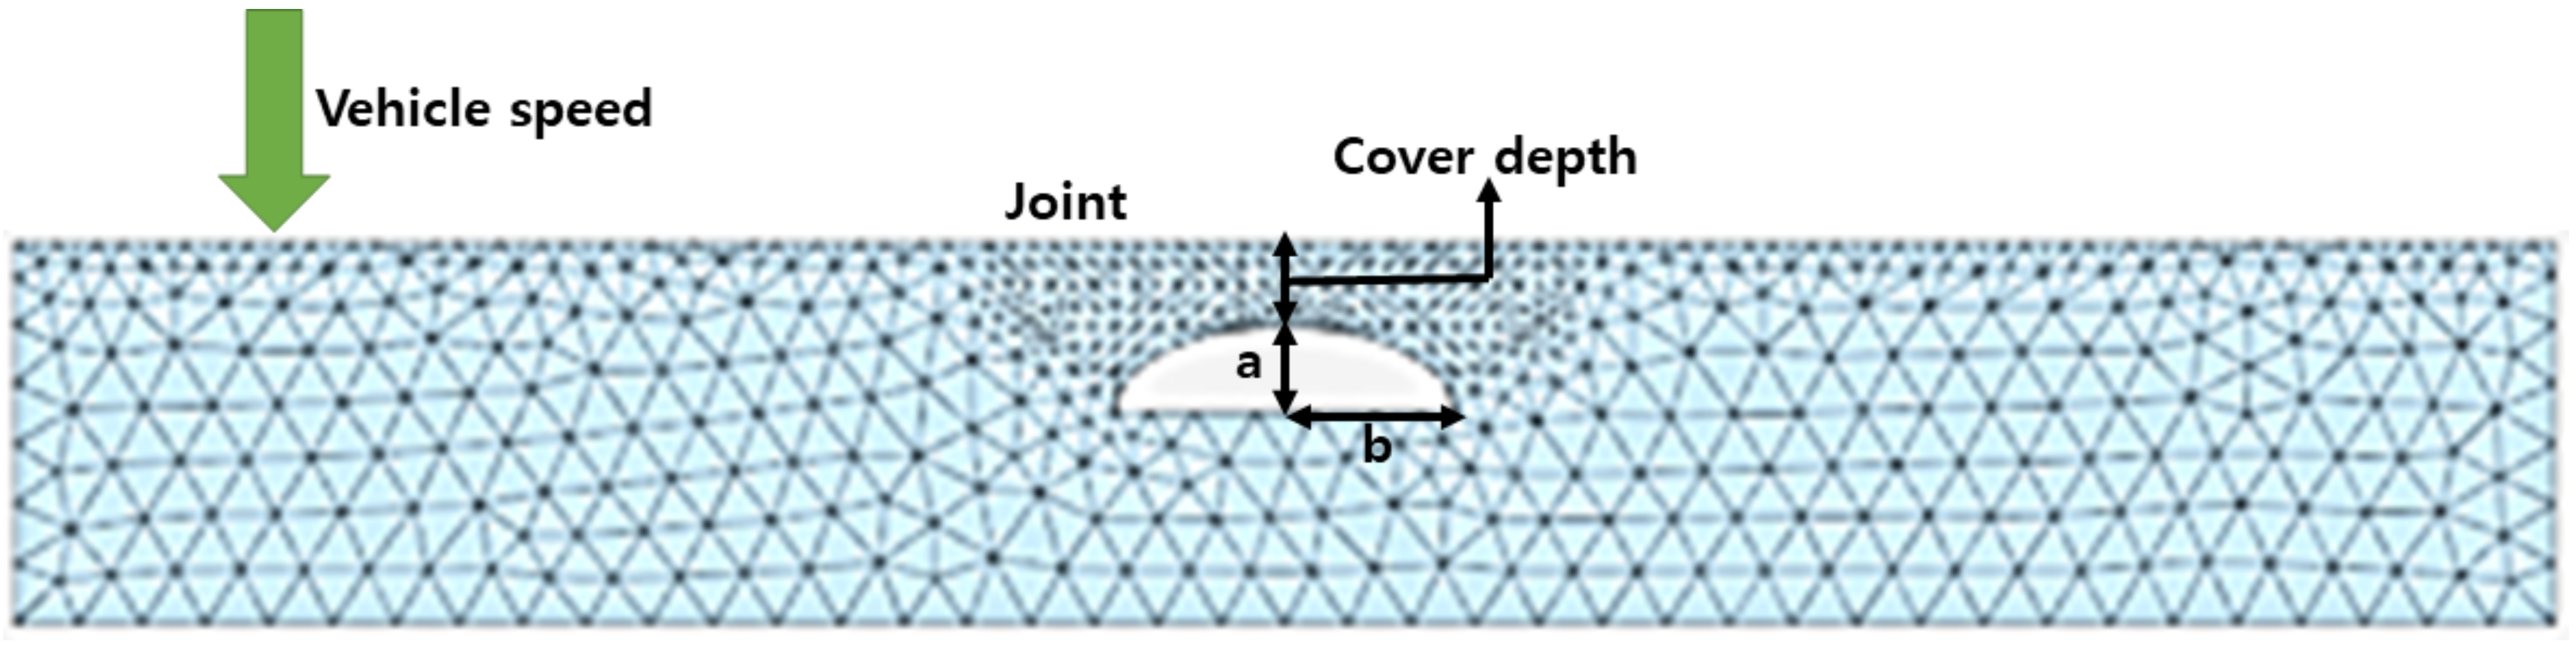
The floors of the lava tubes distributed on Jeju Island are uniformly inclined in the downstream direction, but the heights of the ceilings of the tubes are inconsistent and irregular [15]. To generalize the shape of these lava tubes, the ratio of the length of the horizontal axis to the vertical axis was defined as the aspect ratio, and this was selected as one of the characteristics of the geometric shape. The aspect ratio is shown in Figure 2 as the vertical/horizontal(a/b) radius of the ellipse. If the aspect ratio is 0.5, it has a semi-oval shape in which the horizontal axis is the long axis, if it is 1.0, it is in the semi-circular shape, and if it is 1.5, it is in the semi-elliptic shape with the vertical axis being the long axis.
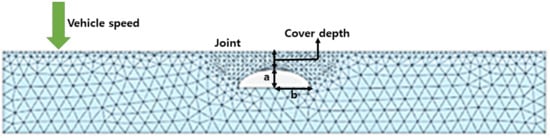
Figure 2.
Lava tube geometry of finite element method.
In this study, the external force corresponds to the vehicle vibration load passing on the road located at the top of the lava tube. The vehicle vibration load varies according to the type (weight) and speed of the vehicle. The vehicle speed was selected as an external influence factor affecting the lava tube. Since it is difficult to control the type of vehicle in traffic, the conditions of the experiment were fixed to the type of vehicle that generates the largest external force.
The geological and geometrical characteristics of the lava tubes distributed on Jeju Island, and all four factors of mass, spring, damper, and external force required for vibration system analysis, were considered.
Joint orientation, aspect ratio, and cover depth were selected as factors that represent the geometric characteristics of the lava tube and that affect vibration, and vehicle speed was selected as an external influence factor.
The level of cover depth was considered when the lava tube had a relatively shallow cover depth (2 m) and a relatively deep cover depth (4 m). The level of the aspect ratio considered the case of a semi-oval shape with a long axis in the horizontal axis, a semi-circular shape with the same horizontal axis and a vertical axis, and a semi-elliptic shape with a long axis in the vertical axis. In the case of the joint orientation, not only the horizontal and vertical orientations, but also the case in which there is no joint and the case in which it exists in combination, were considered. In the case of the vehicle speed, which is an external influence factor, it was set at 40 km/h and 80 km/h, considering the vehicle speed of general national roads; the selected factors and levels are shown in Table 1.

Table 1.
Influence factors and levels.
3. Numerical Analysis
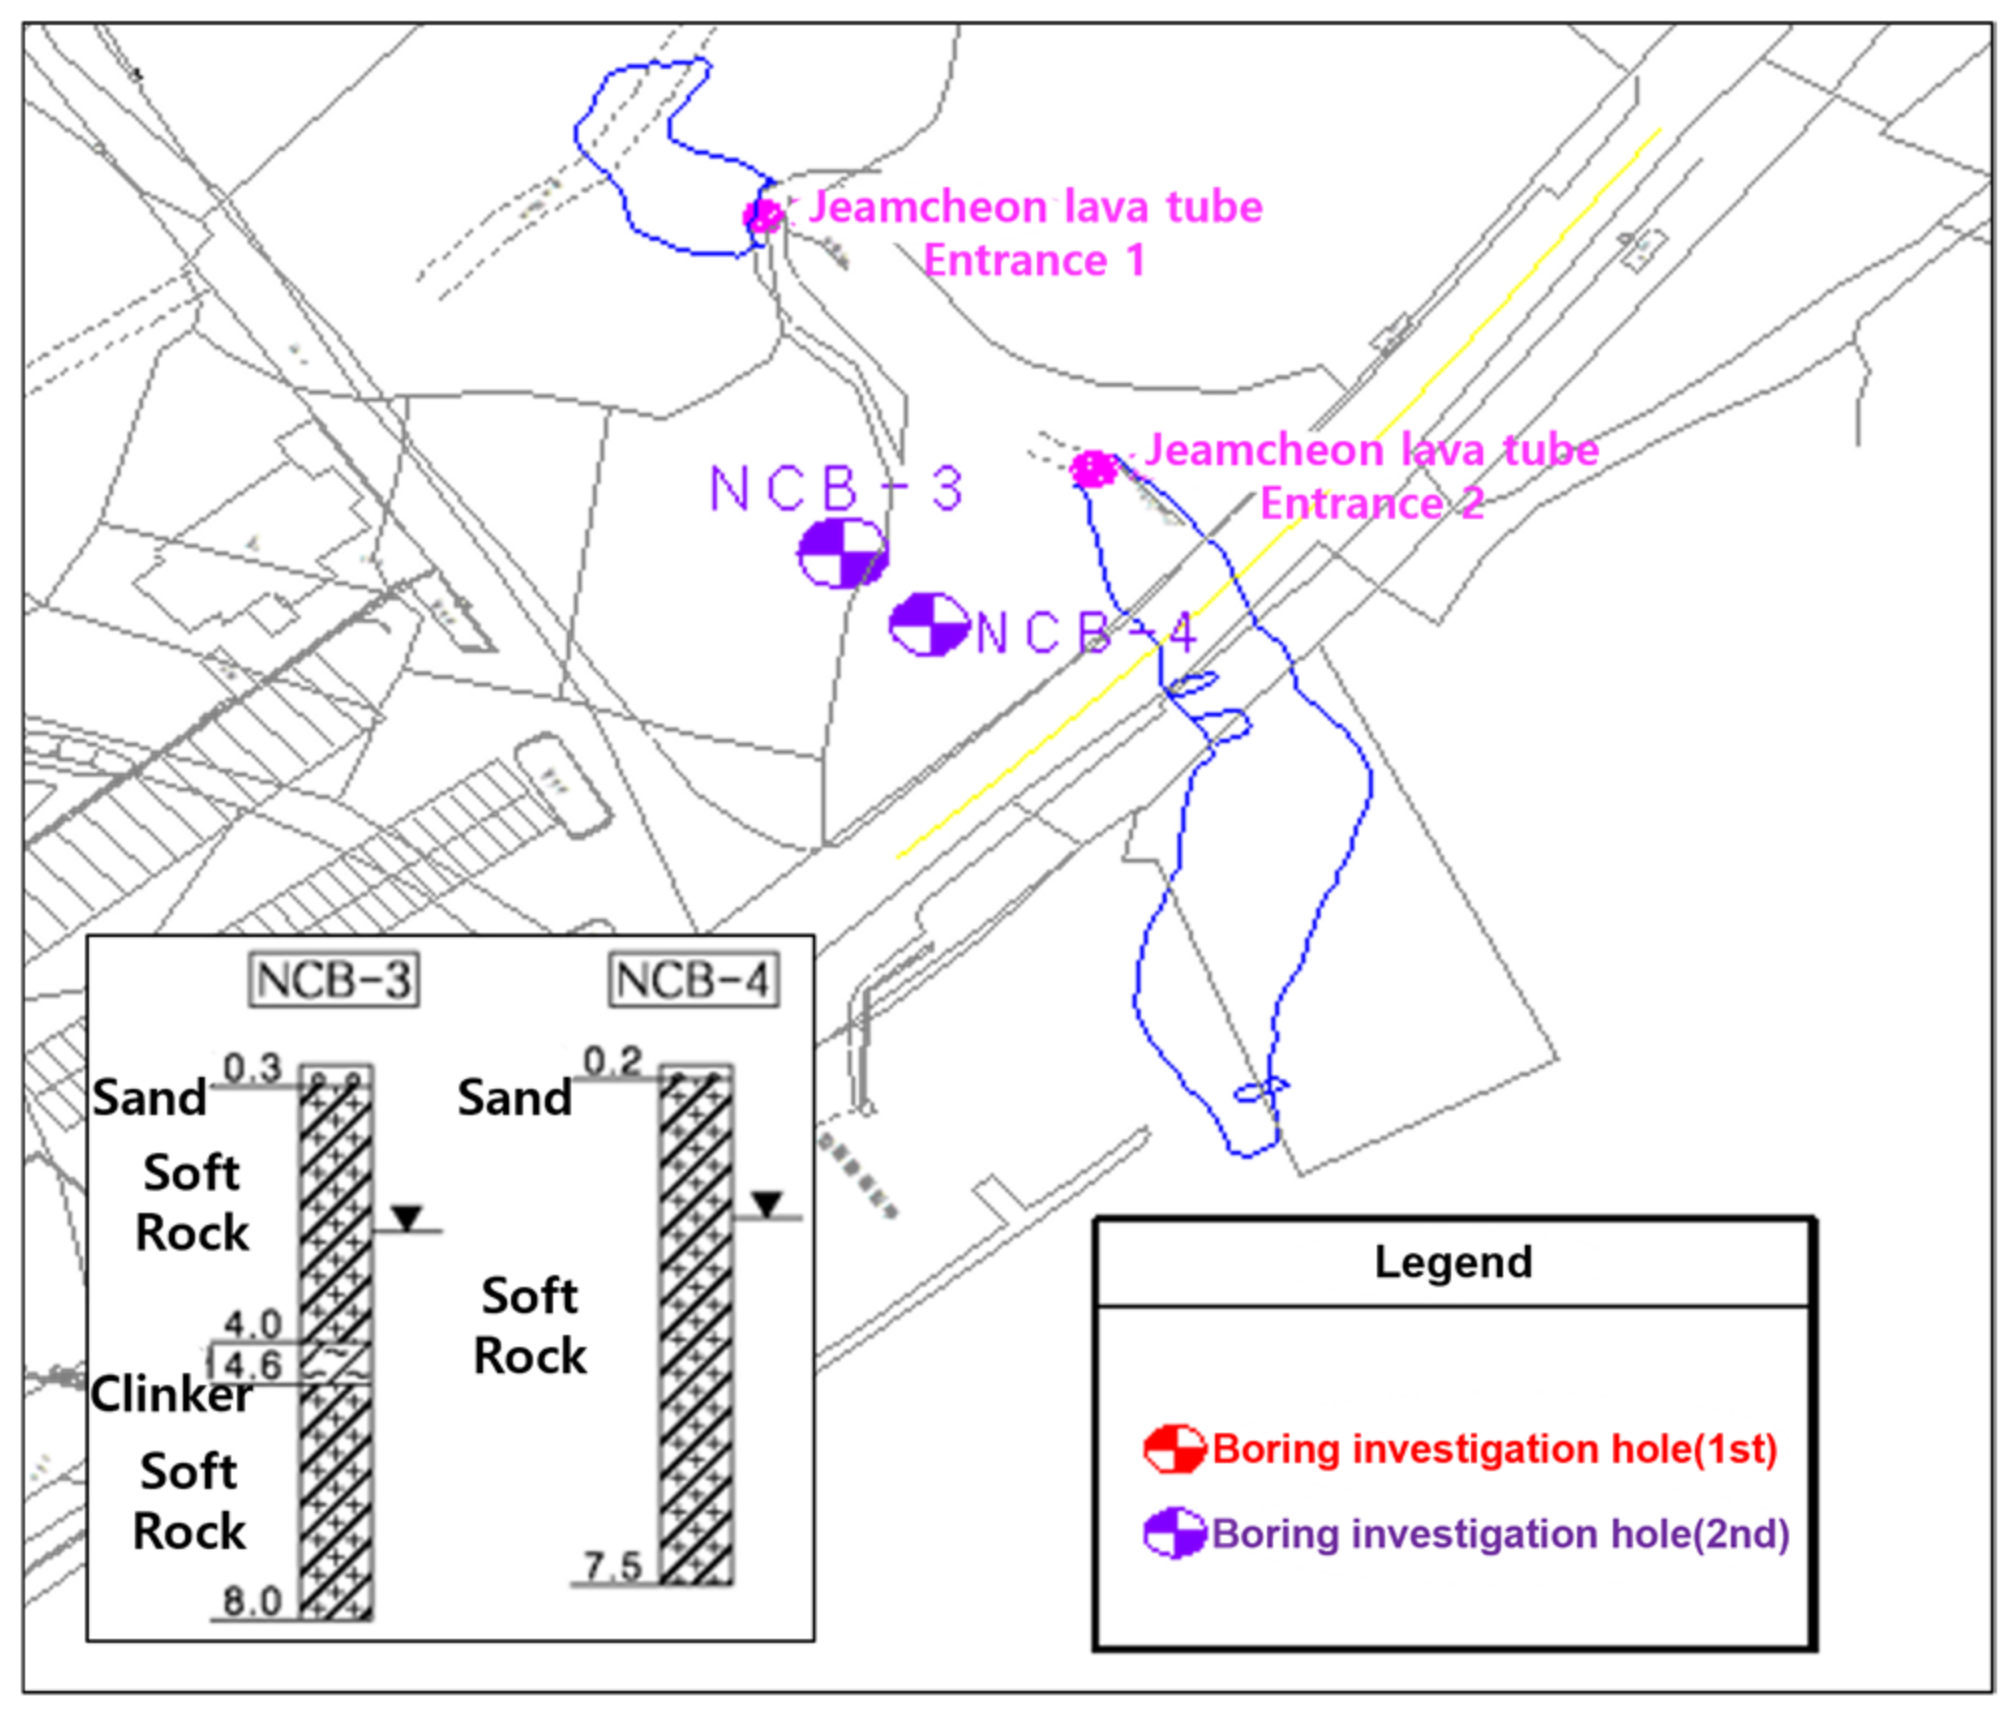
To design a discontinuity, both the shear strength of the discontinuity and the joint orientation of the discontinuity are required. However, since the research subject is a cultural heritage management area, shear strength tests cannot be performed. Therefore, the ground properties used in the numerical analysis were the results of the boring investigation of the Jeju Island Natural Cave Conservation and Management Plan [16]. The investigation results of the NCB-4 borehole closest to Jaeamcheon lava tube were used. The stratum was 0.2 m of sand, and the bottom was composed of soft rock (basalt). The sand layer was not considered in the numerical analysis. Table 2 shows the numerical analysis parameters of the continuum of the sand and soft rock. The orientations of the main discontinuities were 66/70, 238/72, and 80/72, and most of them consisted of elevation angles greater than 70 degrees.
Table 2.
Continuum material properties of soft rock.
To model a discontinuity, the shear strength of the discontinuity is required. However, since the Jaeamcheon lava tube is a cultural property management area and cannot be tested for shear strength, the joint shear strength of the Manjang lava tube calculated in the ‘Research and Investigation Report on the Preservation and Management of Natural Caves in Jeju Island’ was used (Table 3).
Table 3.
Discontinuity material properties of soft rock.
A numerical analysis was carried out by setting the characteristic value of the Jaeamcheon lava tube, which is continuously subjected to the dynamic load of a vehicle, as vibration. PLAXIS 3D, a finite element method numerical analysis program, was used for vehicle vibration load modeling.
Figure 3 shows the cross-sectional view of the boring investigation in Jaeamcheon lava tube. PLAXIS3D, a finite element method numerical analysis program, was used for vehicle vibration load modeling considering vehicle speed.
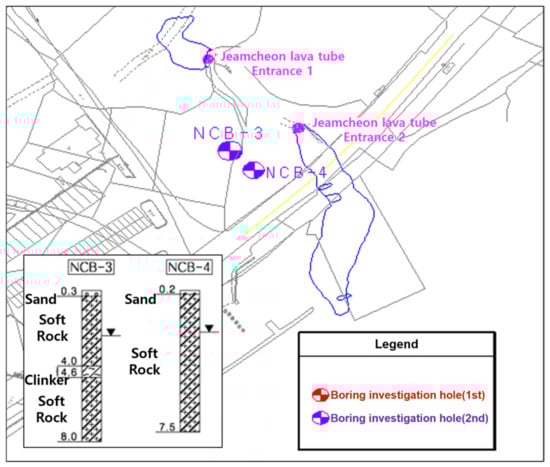
Figure 3.
Cross sectional of boring investigation.
Table 4 shows the dynamic parameters of the soft rocks used in numerical analysis. The calculation process for the dynamic parameters can be confirmed through Table 5.
Table 4.
Dynamic parameters of soft rock.
Table 5.
Calculation process of dynamic properties.
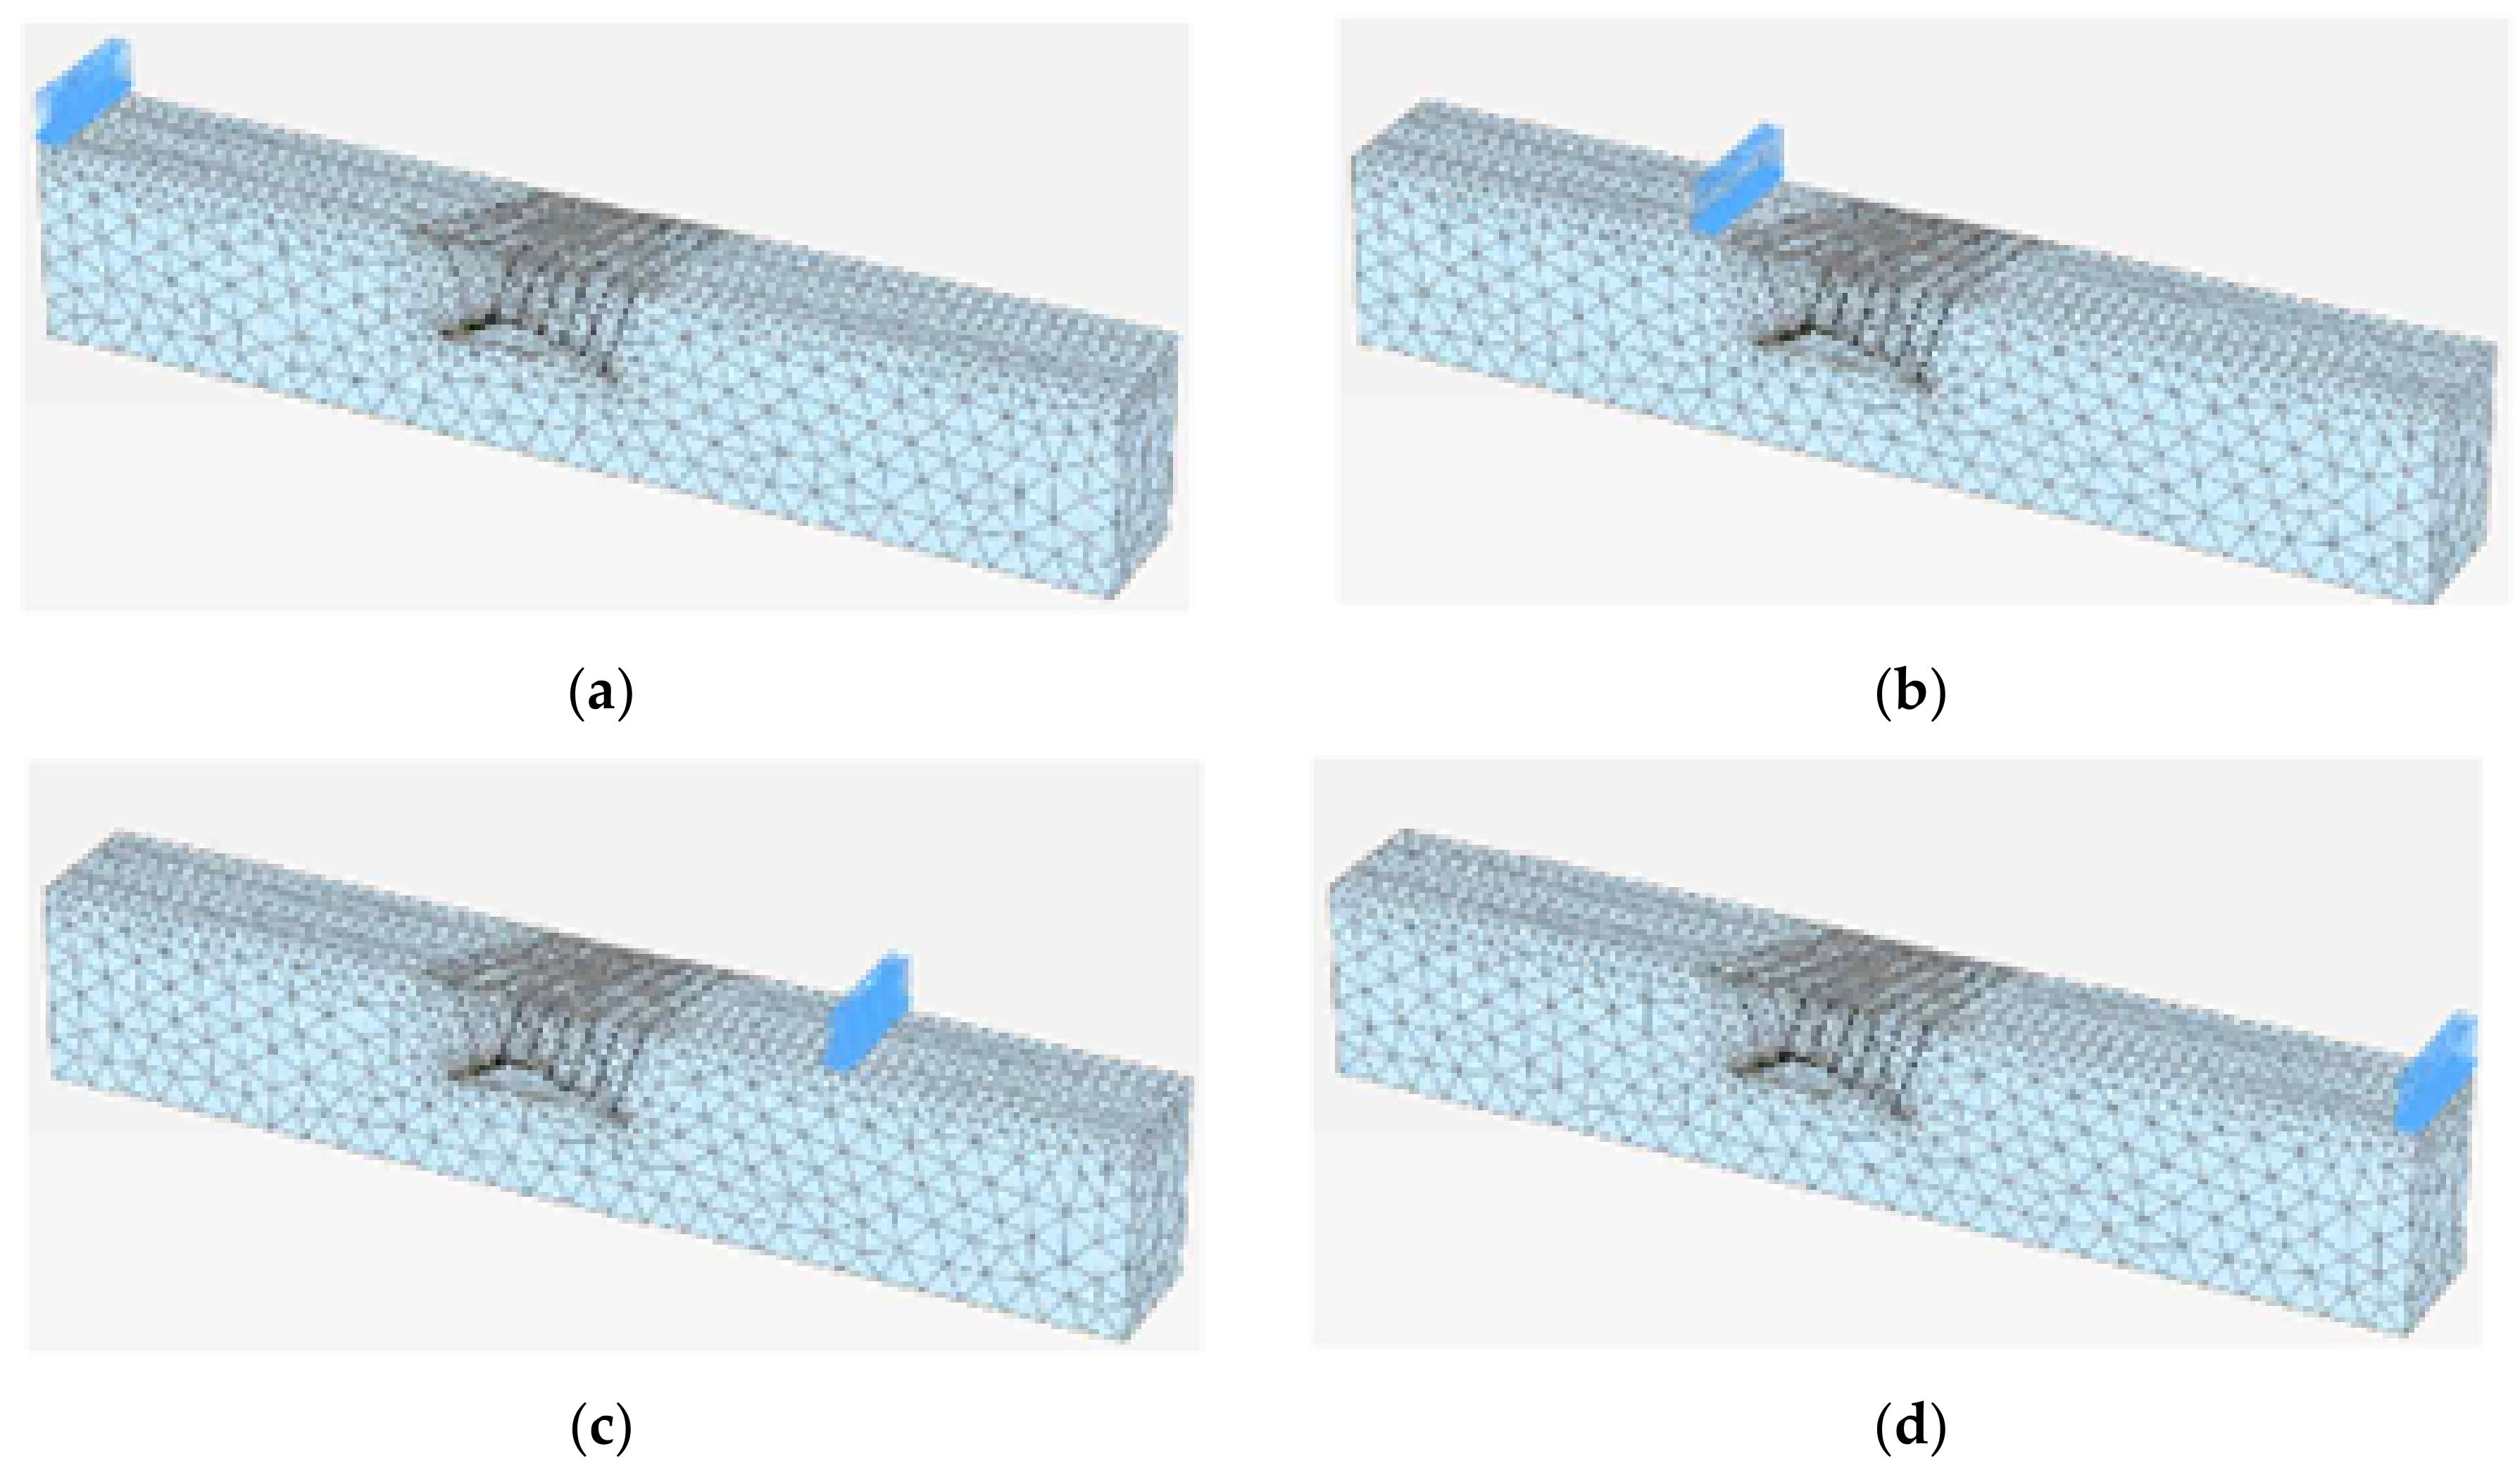
Vehicles passing through the upper road of Jaeamcheon lava tube were identified as cars, buses, freight cars and dump trucks. Since the vehicle with the largest load is a dump truck, the dump truck (DB-24) was selected as the vehicle scale to be used for numerical analysis (Table 6). DB-24 had a uniformly distributed load of 13.0 kN/m, and it applied to the vehicle speed of 40 km/h and 80 km/h as a live load. To consider the time history, it was modeled so that the load was activated only at certain times and deactivated at other times. This process is shown in Figure 4.
Table 6.
Vehicle load input data.
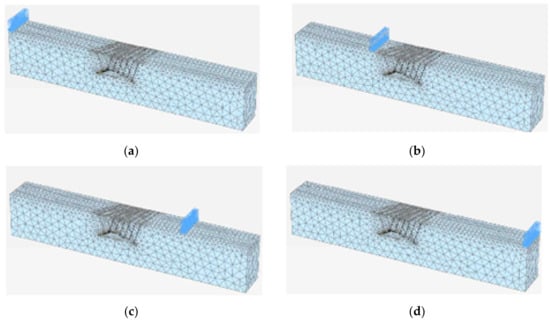
Figure 4.
Vehicle loading diagram considering time history. (a) First vehicle load; (b) Twentieth vehicle load; (c) Forty-fifth vehicle load; (d) Sixtieth vehicle load.
4. Numerical Analysis Results and Data Analysis
4.1. Numerical Analysis Results
The multi-way factorial design possesses the characteristic that the effect of all factors can be estimated by performing experiments at all combinations of each level [17]. Therefore, in this paper, the multi-way factorial design was used to detect all interaction effects.
As a result of numerical analysis, the maximum vibration of the lava tube under vehicle load is shown in Table 7.
Table 7.
Four-way table.
Table 7 is a multi-way table for joint orientation (A), aspect ratio (B), cover depth (C), and vehicle speed (D). Since the number of factors is four, it can also be called a four-way table.
If the characteristic values do not satisfy the statistical assumptions, such as normality and homoscedasticity, the average of the characteristic values cannot be the representative value. Therefore, before performing the ANOVA, it was checked whether the statistical assumptions were satisfied. The characteristic values obtained through numerical analysis did not satisfy either normality or equal variance. Accordingly, a log transformation was performed, considering that the characteristics of the data had a positive value less than 1. After transformation, normality and homoscedasticity assumptions were satisfied. Table 8 is a four-way table after natural log transformation.
Table 8.
Four-way table after log transformation.
4.2. Analysis of Variance (ANOVA)
To find out how significant each factor is compared to the error, an ANOVA table was prepared and the significance of 15 factors (4 main effect factors, 6 interaction factors of 2 factors, 4 interaction factors of 3 factors) was determined. Significance is determined according to the acceptance and rejection of the null hypothesis. An F-test was performed in order to determine whether the null hypothesis should be rejected. The F-value follows the F-distribution, and the F-distribution is according to the ratio of chi squares and shape of F-distribution depends on the degrees of freedom.
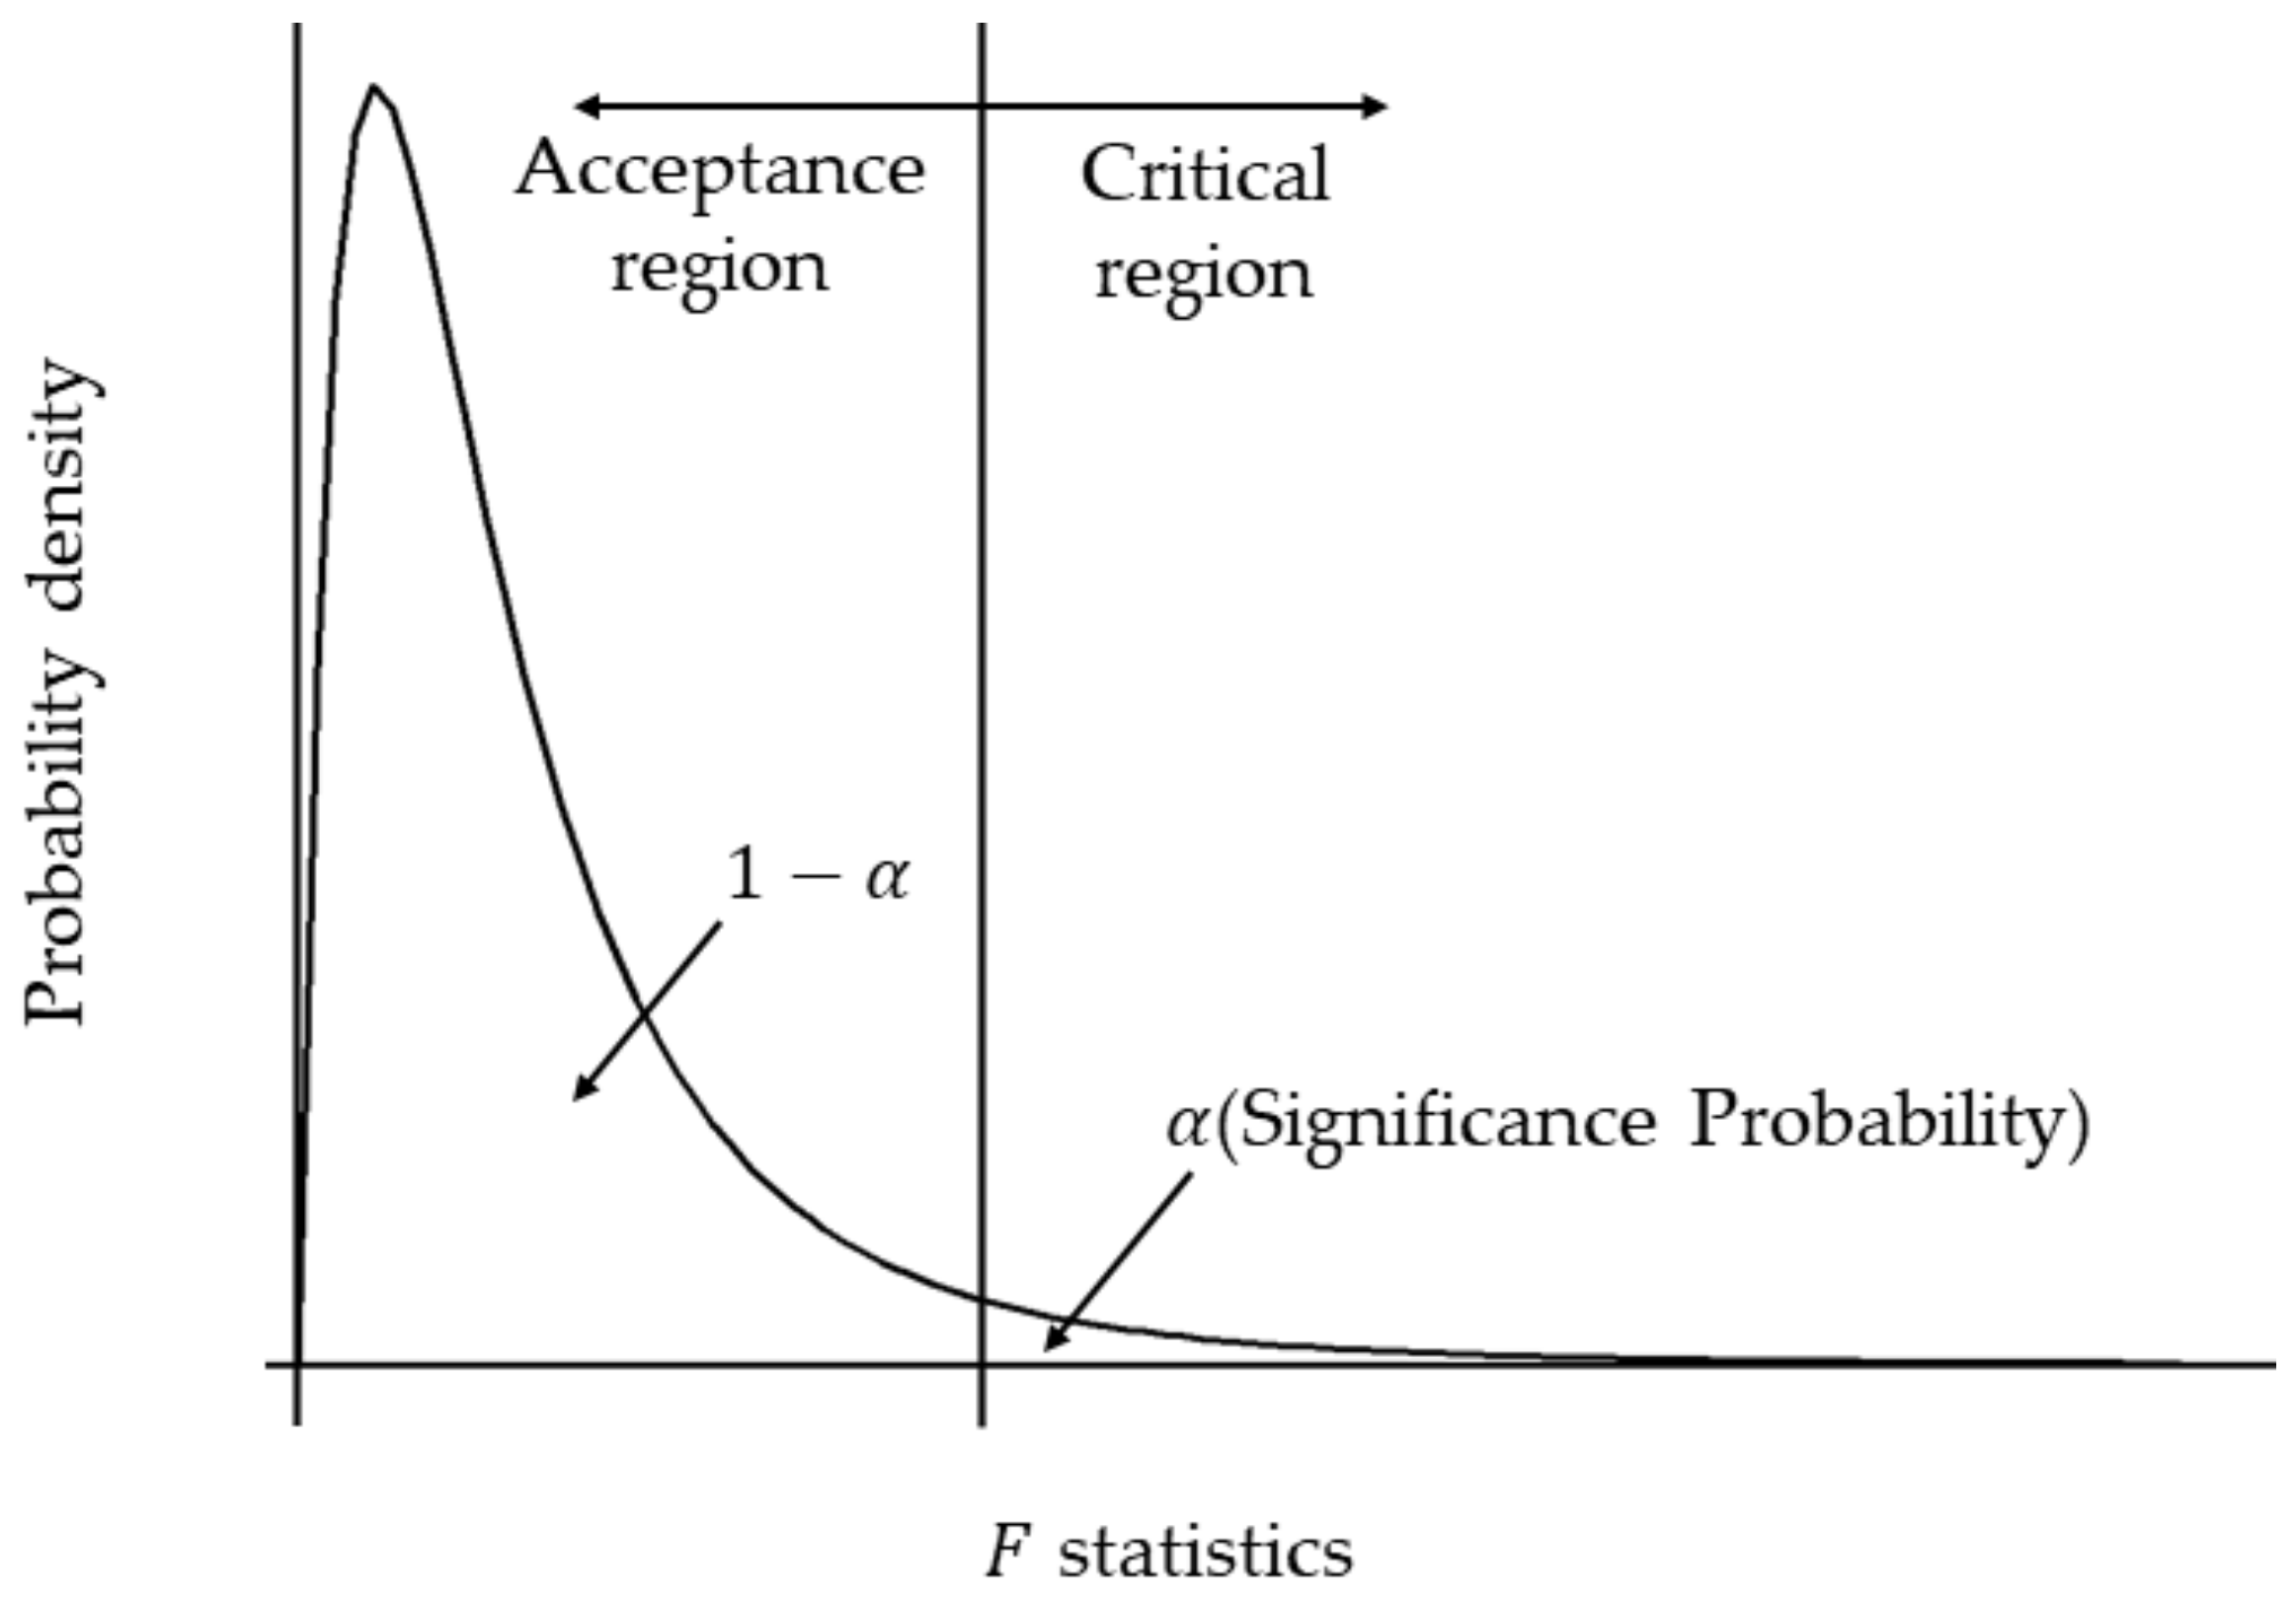
The F-test is used to test for differences in variance. To determine the significance of factor variance during the F-test, a right-sided test was used in this paper. Equation (2) shows the conditions for rejecting the null hypothesis during the F-test, and Figure 5 shows the conditions for rejecting the null hypothesis from the F distribution during the right-sided test. ANOVA was performed by setting the significance level to 5%. The significance level of 5% value is also the position value of the tail probability (5%) following the F-distribution, and is an index for judging significance. It is the rejection value that determines whether the null hypothesis should be rejected.
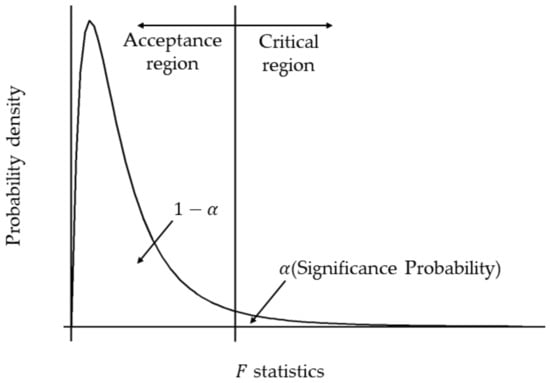
Figure 5.
Right sided test of F-distribution.
The main effect and the interaction effect were detected through the ANOVA of the data obtained from the experiment. The results of the ANOVA are shown in Table 9. The interaction factors of joint orientation cover depth, aspect ratio vehicle speed, and cover depth vehicle speed showed insignificant results.
Table 9.
ANOVA table after three-factor interaction pooling.
The interaction factors of joint orientation cover depth, aspect ratio vehicle speed, and cover depth vehicle speed showed insignificant results, so the ANOVA was re-performed by pooling them as error terms.
Table 10 shows the results of the ANOVA after pooling non-significant two-factor interaction factors.
Table 10.
ANOVA table after pooling non-significant factors.
As a result of ANOVA, joint orientation ( = 395.416, p < 0.05), aspect ratio ( = 126.706, p < 0.05), cover depth ( = 290.73, p < 0.05) and vehicle speed (= 1383.32, p < 0.05) were all significant. However, there was no significant interaction effect for joint orientation cover depth, aspect ratio vehicle speed, and cover depth vehicle speed.
Among the interactions of the internal feature factors, the joint orientation aspect ratio and the aspect ratio cover depth showed statistically significant results, while the interaction between the joint orientation and cover depth showed insignificant results. The aspect ratio showed statistically significant results with both the other two internal characteristic factors, joint orientation, and cover depth. Therefore, the shape of the lava tube is an important factor in the interaction of the geometrical characteristics of the lava tube under the vehicle vibration load.
4.3. Interaction Analysis
4.3.1. Interaction Plot
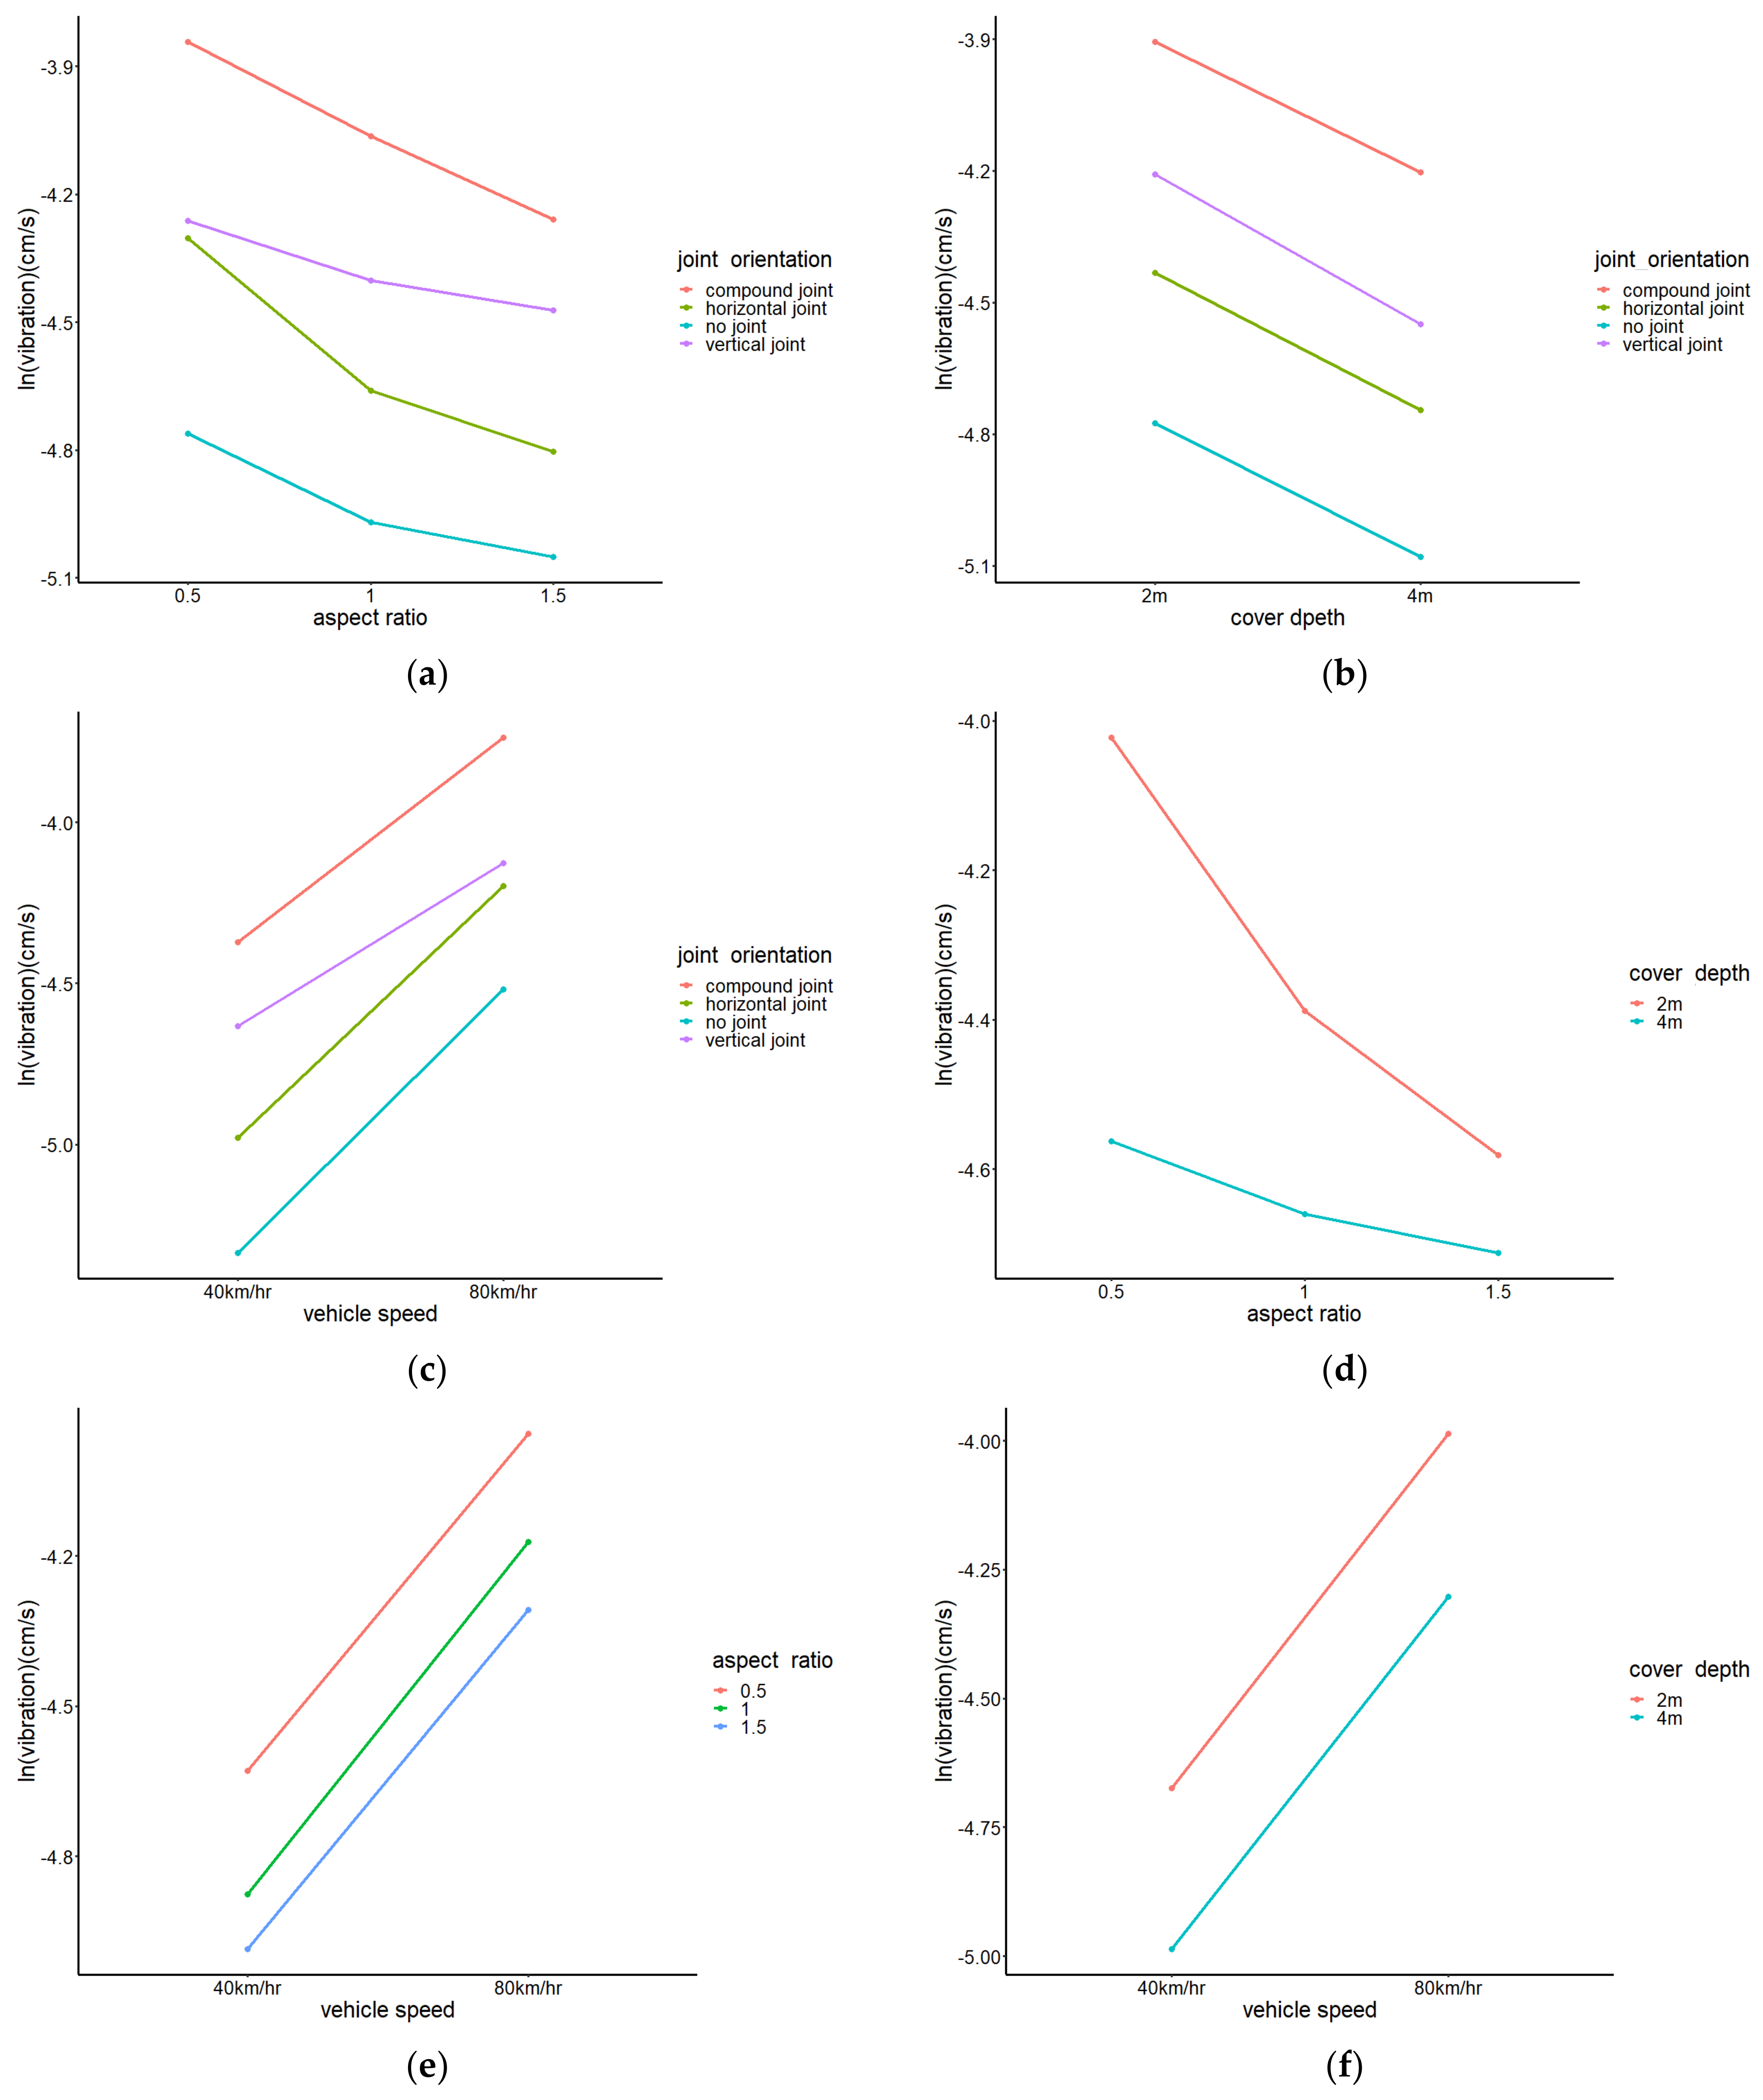
Interaction is an effect that occurs at a specific level combination of two or more design parameters. That is, the design parameters do not independently affect the response, but affect each other dependently. Previously, whether all two-factor interactions were statistically significant was determined through multi-way ANOVA. By plotting these multi-way ANOVA results, it is convenient to intuitively understand the interaction effect. The interaction plot according to the combinations of levels between the two factors is shown in Figure 6.
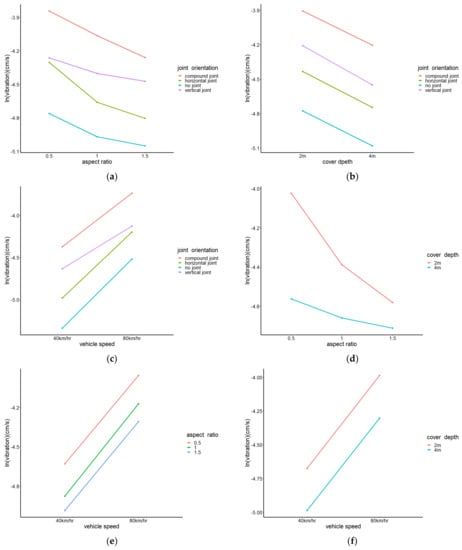
Figure 6.
Interaction plots between two factors. (a) Joint orientation and aspect ratio; (b) Joint orientation and cover depth; (c) Joint orientation and vehicle speed; (d) Aspect ratio and cover depth; (e) Aspect ratio and vehicle speed; (f) Cover depth and vehicle speed.
In Figure 6a,c,d, it can be seen that there is a significant interaction effect because the slope changes according to the change in the factor level. On the other hand, in Figure 6b,e,f, the slope does not change even when the level of the factor changes. Therefore, the significant interaction factors are joint orientation aspect ratio, joint orientation vehicle speed and aspect ratio cover depth, which is consistent with the results of ANOVA.
Figure 6a is a two-factor interaction plot of joint orientation aspect ratio. When the joint orientation was horizontal, the vibration increased rapidly as the aspect ratio level changed from 1.0 (semicircular shape) to 0.5 (half elliptical shape with the long axis being the vertical axis). When the lava tube had a complex joint, the vibration value showed linearity according to the aspect ratio level, and in the case of no joint, horizontal joint, and vertical joint, the slope increased when the aspect ratio level was 0.5.
Figure 6c shows the interaction between the vehicle speed, which is an external influence factor, and the joint direction, which is an internal characteristic factor. The no joint, horizontal joint and compound joint had similar slopes according to the vehicle speed level change. However, in the case of the vertical joint, the value of the vibration was relatively large, but the slope of the graph according to the change in the vehicle speed was relatively small.
Figure 6d is an interaction plot between aspect ratio and cover depth. When the aspect ratio was 0.5, the slope increased rapidly at a cover height of 2 m. Through this, it is clear that when a lava tube has a shallow cover depth, it is greatly affected by vibration depending on its shape ratio.
4.3.2. Multiple Regression Analysis—Relative Importance of Explanatory Variables
To explore the relative importance of explanatory variables, multiple regression analysis was performed, and the results are shown in Table 11. Interactions can be included in the regression model, but the variance inflation factor exceeds ten when the interaction is included. Therefore, it was not included as evidence that multicollinearity exists.
Table 11.
Multiple regression analysis result.
The regression model satisfied all residual assumptions (normality, independently, homoskedasticity, linearity), and no outliers were found. The regression coefficient of the aspect ratio and cover depth was calculated as a negative number, which has the effect of suppressing vibration.
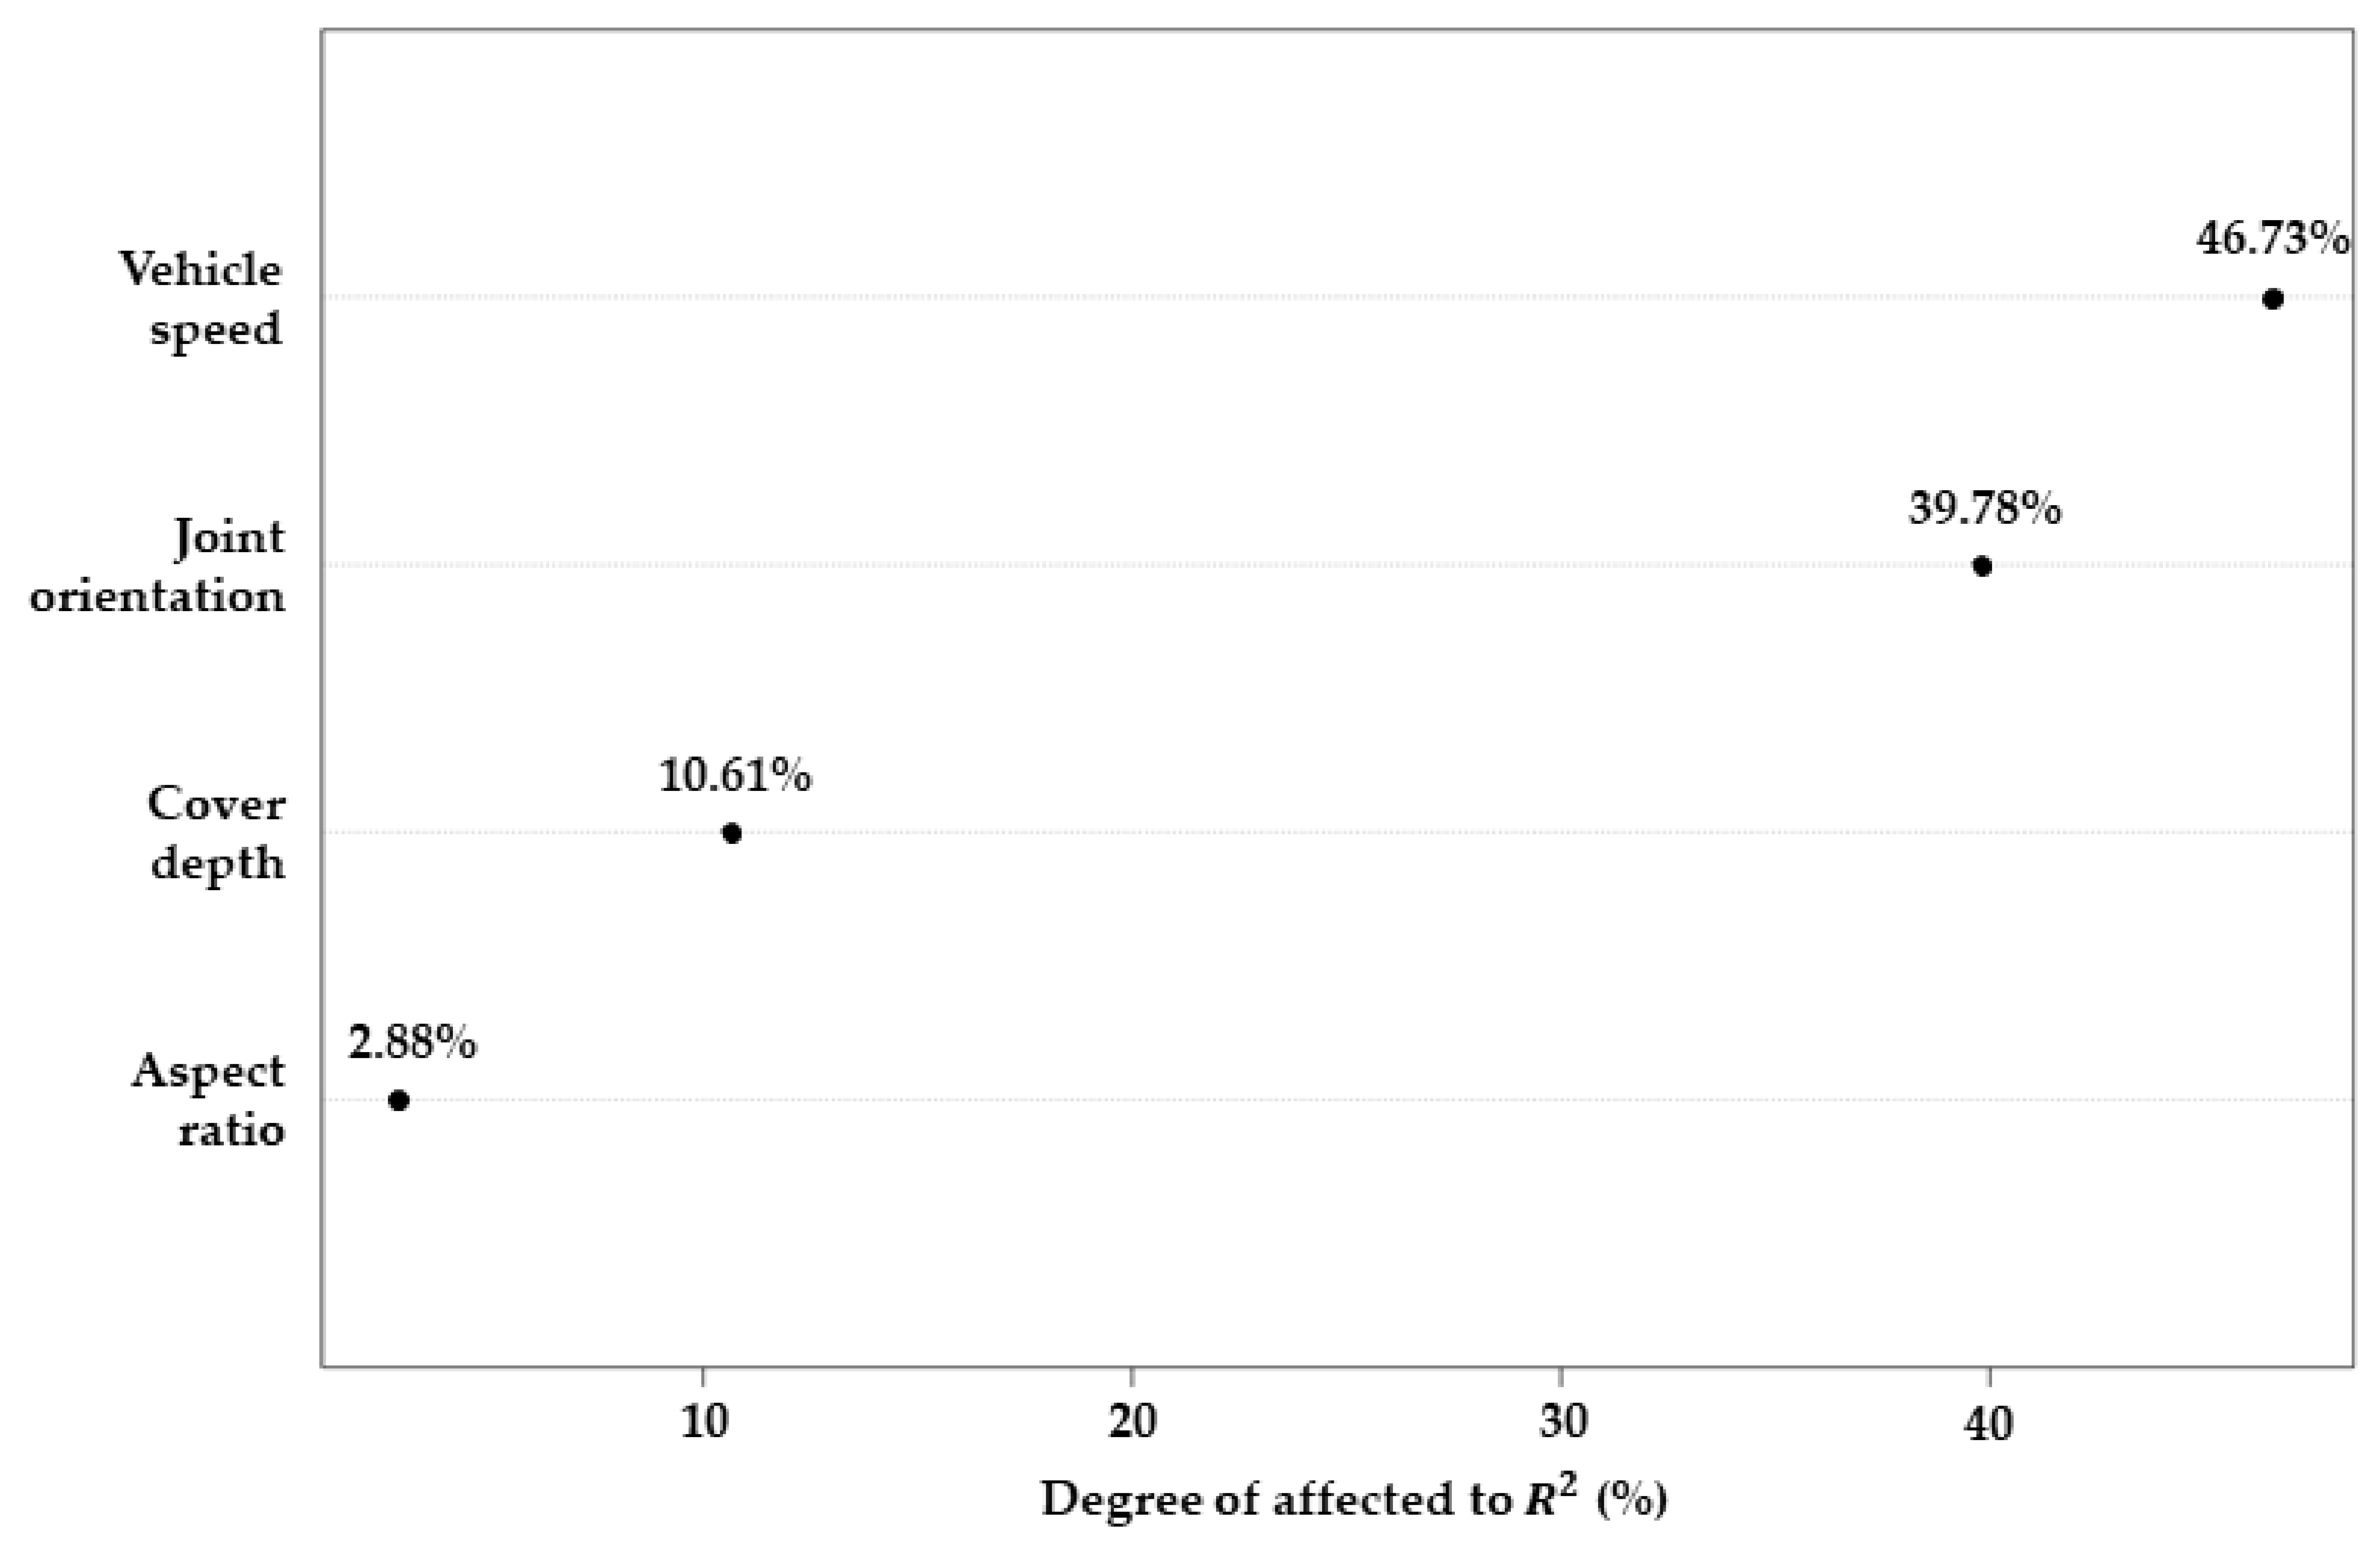
When there are multiple explanatory variables in a regression model, the method for evaluating the relative importance of each variable can be found by creating all possible submodels and finding how much the R-square value increases on average when one explanatory variable is added. This shows the relative importance of the explanatory variables in the regression model.
Based on the selected multiple linear regression model, the relative importance of the explanatory variables was confirmed using the degree of influence on the coefficient of determination (Figure 7). Among the explanatory variables, the vehicle speed had the greatest effect on the coefficient of determination (46.73%). Among the geometrical characteristics of the lava tube, the joint orientation (39.78%), cover depth (10.61%) and the shape ratio (2.88%) affected the coefficient of determination in that order. This is the same as the multi-way ANOVA result.
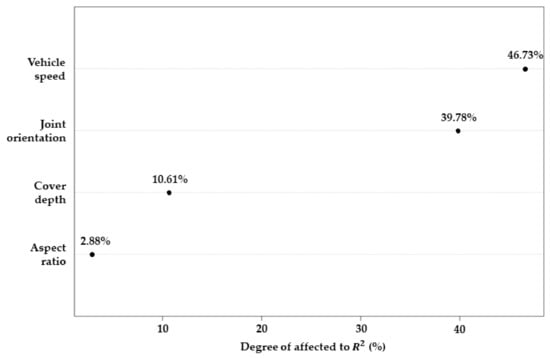
Figure 7.
Relative importance of explanatory variables.
4.3.3. Decision Tree
Decision tree is an analysis method that charts decision-making rules to classify a subject group into several subgroups or to make predictions. A preprocessing step was performed prior to analysis. According to the amplitude of vibration, as shown in Table 12, the dataset was divided into three parts, high, middle, and low, and the decision tree was analyzed by converting the dataset into categorical data. Before analysis, it was divided into training data (70%) and verification data (30%).
Table 12.
Vibration dataset classification criteria.
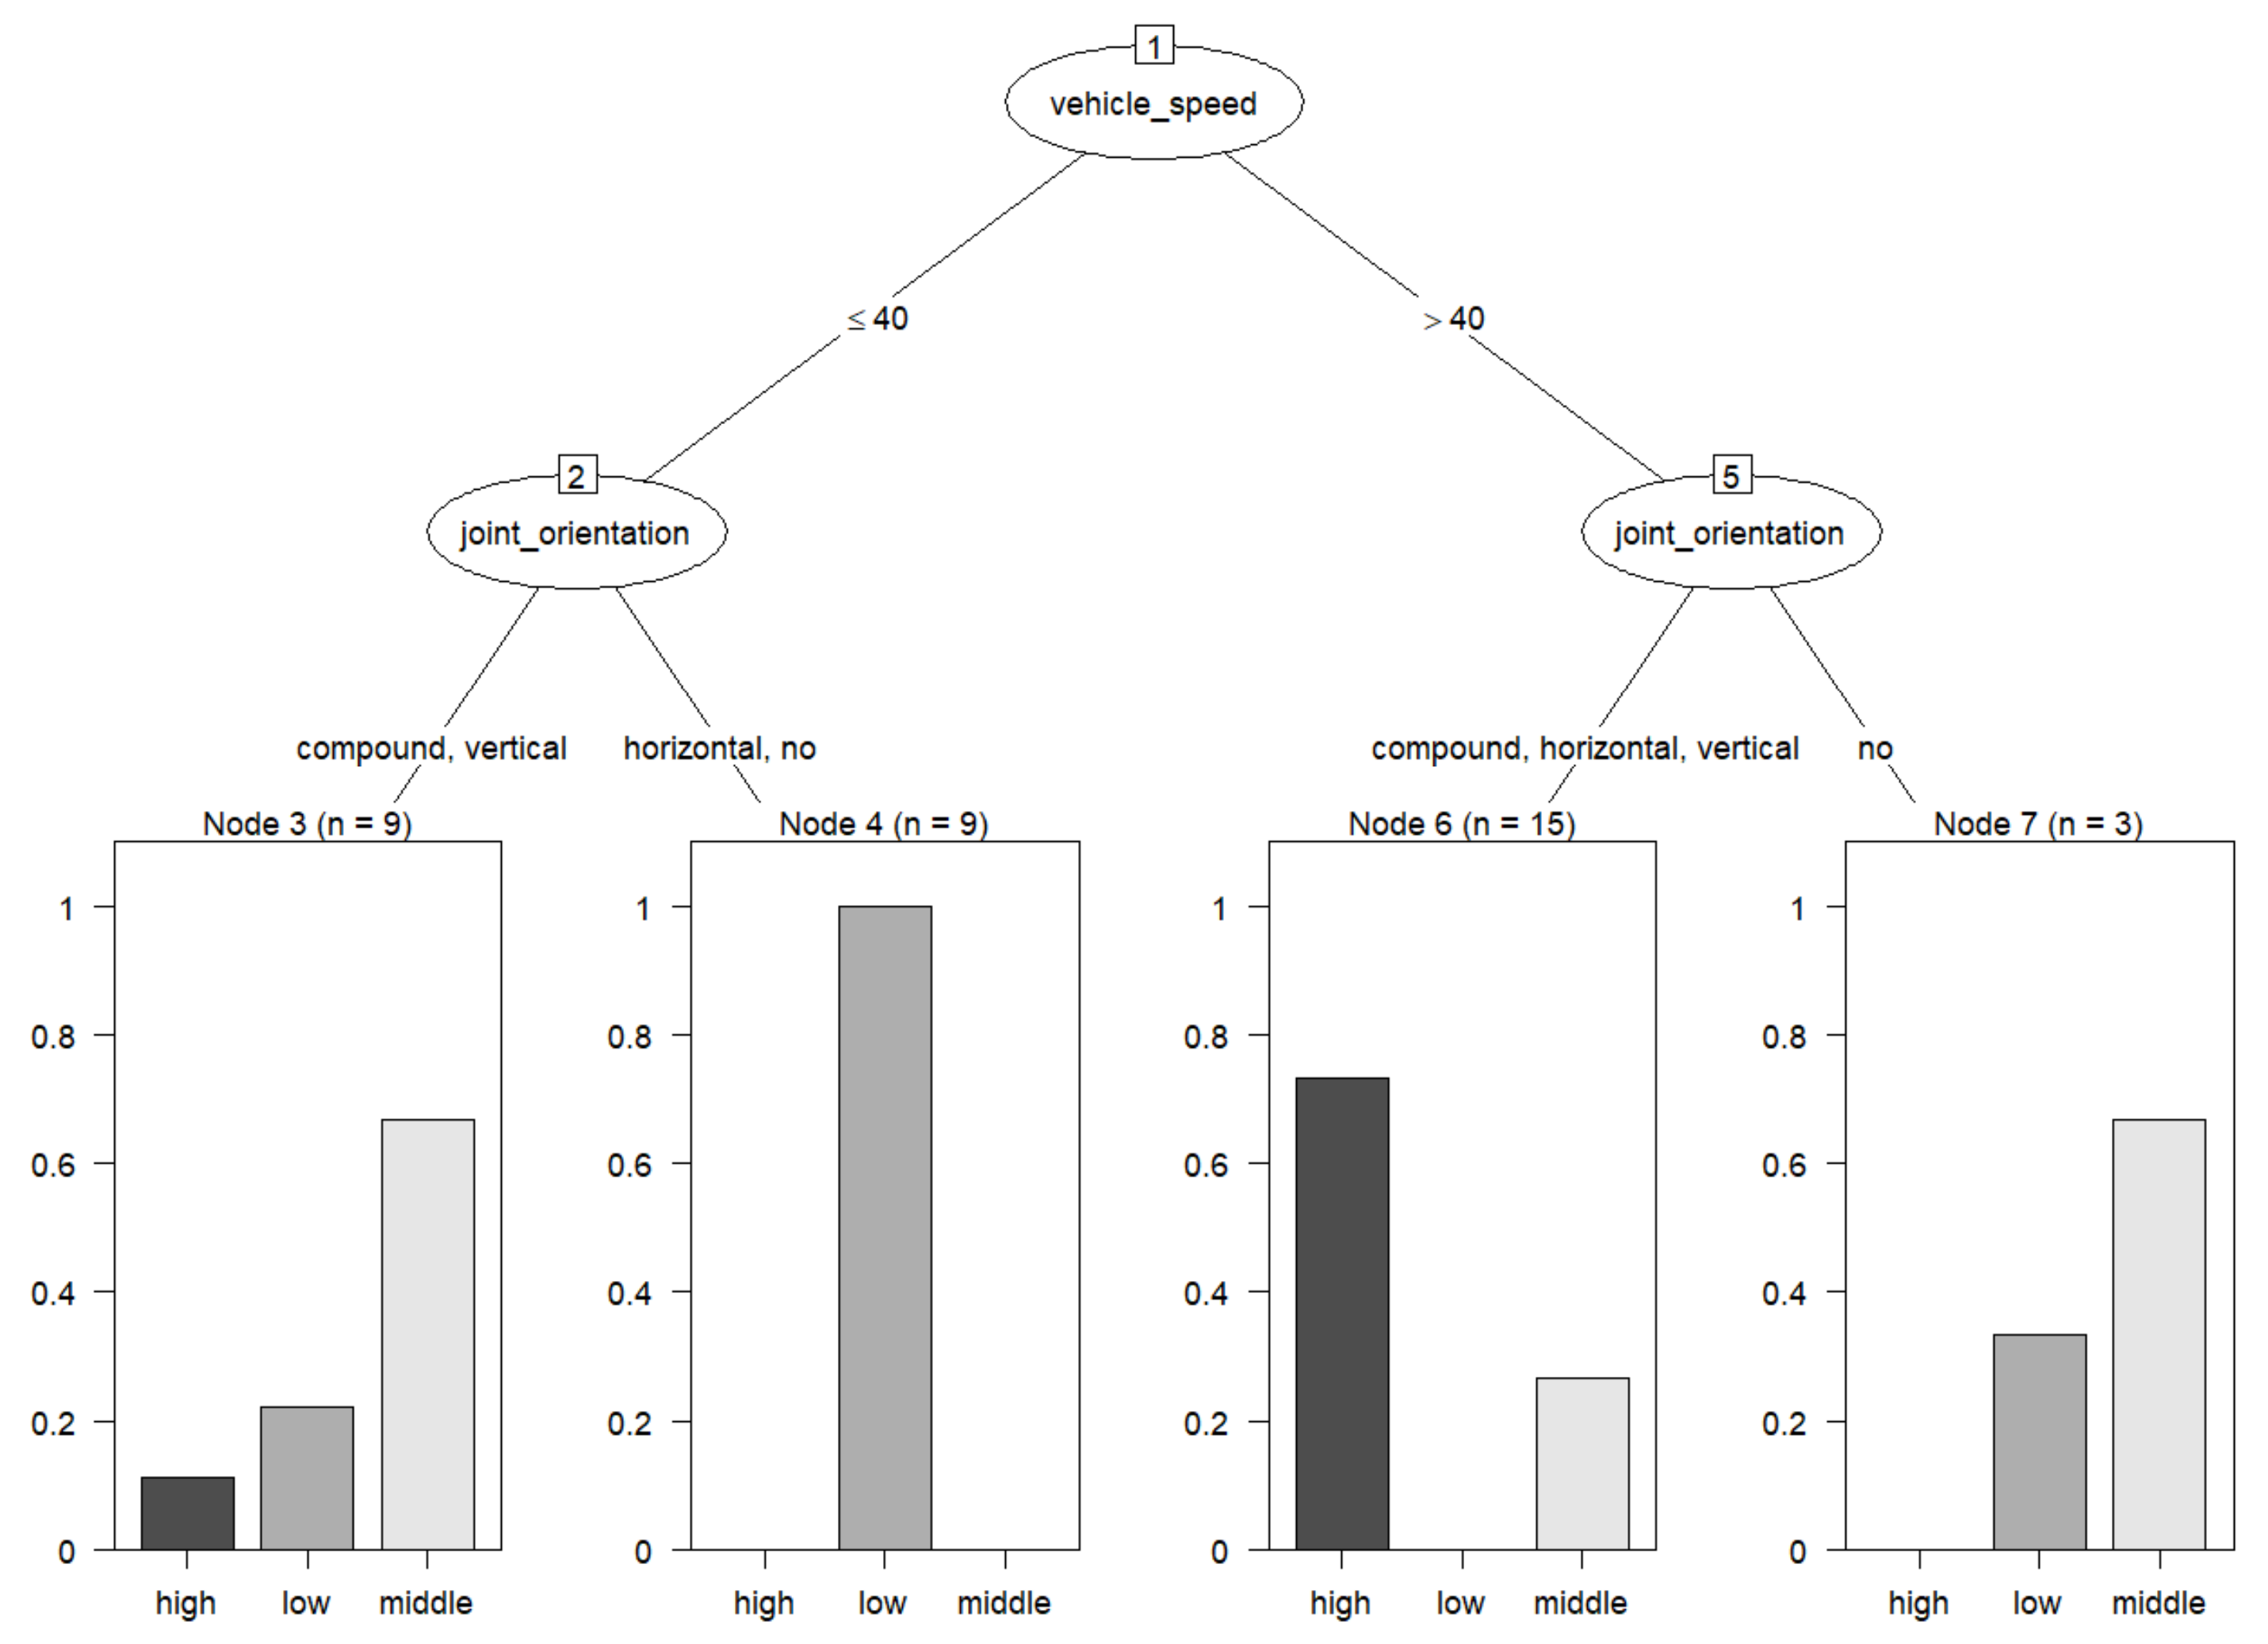
The results of the decision tree analysis using the C5.0 algorithm are diagrammed and shown in Figure 8. Among the four independent variables, joint orientation, aspect ratio, cover depth and vehicle speed, the root node was classified as vehicle speed, and the intermediate node was classified according to the joint orientation level. At the terminal node (Node 9), high and low vibrations were confused and classified. As a result of cross-validation using test data, the accuracy was relatively low, at 50%.
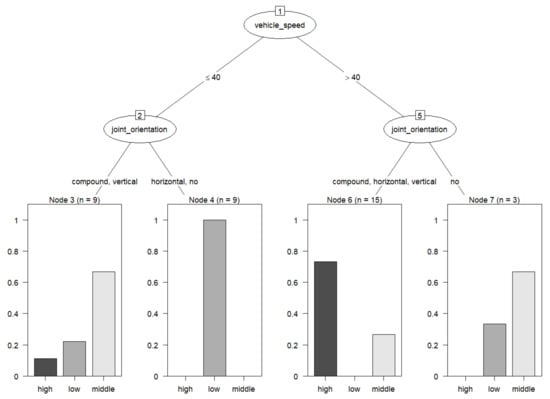
Figure 8.
Decision tree using train data.
Multiple regression analysis aims to perform prediction well by increasing the explanatory power of the model, and decision tree is an analysis method aimed at classifying data with low impurity. Therefore, it is judged that the best way to analyze the interaction is to use the interaction plot because it can be sufficiently explained with only the main effect factors.
5. Discussion
Vibrations caused by vehicles passing from the upper part of the lava tube are affected by a large number of factors. The faster the vehicle speed, the heavier the weight of the vehicle, and the lower the vibration resistance, the greater the vibration. However, the lava tube shape is not constant. Therefore, this paper analyzed the various geometric characteristics of lava tubes and the interaction effect on vibration. The design of experiments was used to analyze the mechanism by which vibration occurs according to the geometrical characteristics of lava tubes. When analyzing natural phenomena, both the main effect and the interaction effects should be analyzed. Accordingly, the multi-way factorial design was used to detect the main effect and all two-factor interaction effects. The lava tube is a natural heritage site, and the natural heritage is managed based on vibration. Therefore, vibration was selected as the characteristic value of the lava tube. Joint orientation, aspect ratio, and cover depth were selected as factors representing the geometrical characteristics of the lava tube, and vehicle speed was selected as an external influence factor. The conclusions of this study can be summarized as follows.
- Although the size of the main effect of the aspect ratio was the smallest among the internal feature factors of the lava tube, all the interaction effects with the other two factors (joint orientation, cover depth) showed significant effects. In particular, when the cover depth was 2 m, the vibration according to the level change in the aspect ratio increased significantly. It is believed that this result was obtained because the arcing effect is not easily expressed if the lava tube with a low cover depth has an elliptical shape with a long axis in the vertical axis.
- Vibration reduced with an increasing aspect ratio and cover level. Through this, it is evident that the aspect ratio and the cover height are factors that suppress vibration.
- Lava tubes with poor geometries, that is, lava tubes with a low cover depth and well-developed joints, in the shape of a semi-ellipse with a long vertical axis, are the most vulnerable to vibration, so the vehicle speed should be limited even if this inconveniences the traffic.
- The relative effect plot and decision tree analysis on the coefficient of determination of the multiple regression model were able to explain and classify the main effect alone. It is not easy to explore interaction effects with these analysis methods.
6. Conclusions
In this study, significant and non-significant interactions were found via statistical methods using numerical analysis data. Therefore, a verification process that uses actual measurements is necessary. In the future, by confounding insignificant interactions with error terms in the verification process by using actual measurements, it will be possible to minimize the time and cost of these studies by reducing the number of unnecessary experiments.
Author Contributions
Conceptualization, Y.B. and J.-H.L.; methodology, J.-H.S. and J.-W.S.; software, J.-H.L.; validation, Y.B.; formal analysis, J.-H.S. and J.-W.S.; data curation, J.-H.S.; writing-original draft preparation, J.-H.S. and J.-W.S.; writing, review and editing, Y.B., J.-H.L.; visualization, J.-H.S.; supervision, Y.B. and J.-H.L.; project administration, Y.B. and J.-H.L.; funding acquisition, Y.B. and J.-H.L. All authors have read and agreed to the published version of the manuscript.
Funding
Research for this paper was carried out under the KICT Research Program (project no. 20230096-001, Geotechnical research for disaster management and new growth in the future geotechnical industry) funded by the Ministry of Science and ICT.
Institutional Review Board Statement
Not applicable.
Informed Consent Statement
Not applicable.
Data Availability Statement
The basic data used to support the findings of this study are included within the article and are available from the corresponding author upon request.
Conflicts of Interest
The authors declare no conflict of interest.
References
- Lee, J.H.; Jin, H.S.; Ahn, J.S.; Baek, Y. Numerical Analysis Study for Behavioral Characteristics Analysis of Jeju Natural Caves (Jaeamcheon Lava tube) That Intersect with Roads. J. Eng. Geol. 2021, 31, 367–380. [Google Scholar]
- Swanson, D.A. Pahoehoe Flows from the 1969–1971 Mauna Ulu Eruption, Kilauea Volcano, Hawaii. GSA Bull. 1973, 84, 615–626. [Google Scholar] [CrossRef]
- Greeley, R. The role of lava tubes in Hawaiian volcanoes. US Geol. Surv. Prof. Pap. 1987, 1350, 1589–1602. [Google Scholar]
- Calvari, S.; Pinkerton, H. Lava tube morphology on Etna and ecidence for lava flow emplacement mechanisms. J. Volcanol. Geotherm. Res. 1999, 90, 263–280. [Google Scholar] [CrossRef]
- Dragoni, M.; Piombo, A.; Tallarico, A. A model for the formation of lava tubes by roofing over a channel. J. Geophys. Res. Solid Earth 1995, 100, 8435–8447. [Google Scholar] [CrossRef]
- Griffiths, R.W.; Kerr, R.C.; Cashman, K.V. Surface solidification in open channel flow. In Proceedings of the 14th Australasian Fluid Mechanics Conference, Adelaide, Australia, 9–14 December 2001; pp. 461–464. [Google Scholar]
- Griffiths, R.W.; Kerr, R.C.; Cashman, K.V. Patterns of solidification in channel flows with surface cooling. J. Fluid Mech. 2003, 496, 33–62. [Google Scholar] [CrossRef]
- Valerio, A.; Tallarico, A.; Dragoni, M. Mechanisms of formation of lava tubes. J. Geophys. Res. Solid Earth 2008, 113, B8. [Google Scholar] [CrossRef]
- Li, Z.; Li, J.; Fan, P.; Wang, D.; Gao, L.; Xiong, Z.; Wang, M. Experimental Investigation on Engineering Disaster Simulation of Deep Buried Cavern Under Impact Load. Rock Mech. Rock Eng. 2022, 56, 1451–1465. [Google Scholar] [CrossRef]
- Lee, G.C.; Song, J.Y.; Ahn, W.S.; Park, Y.C.; Jo, K.N. A study on the vehicles and construction equipments vibration characteristics of Geomunoreum lava tube system. J. Geol. Soc. Korea 2021, 57, 209–225. [Google Scholar] [CrossRef]
- Hong, J.C.; Jo, K.N. The interpretation of the causes on the rockfall based on breakdown characteristics of Yongcheon lava tube cave, Jeju Island. J. Geol. Soc. Korea 2022, 11, 336. [Google Scholar]
- Cultural Heritage Administration. Noise and Vibration Standards That May Affect the Preservation of Cultural Heritage; Cultural Heritage Administration: Seoul, Republic of Korea, 2007. [Google Scholar]
- Central Environmental Dispute Mediation Committee. Guidelines for Determining Causality; Central Environmental Dispute Mediation Committee: Seoul, Republic of Korea, 2002. [Google Scholar]
- Kim, D.K. Dynamics of Structures, 4th ed.; Lim, H.J., Ed.; Goomibook: Seoul, Republic of Korea, 2017; pp. 62–67. [Google Scholar]
- An, U.S.; Hwang, S.K. A Study on the Internal Structure of Manjanggul Lava Tube. In Proceedings of Petrological Society of Korea Conference; The Petrological Society of Korea: Seoul, Republic of Korea, 2009; pp. 53–55. [Google Scholar]
- Taekyung Construction. Service Report for Detailed Inspection of Jaeamcheon Lava Tube and Establishment of Maintenance and Reinforcement Measures; Taekyung Construction: Jeju-si, Republic of Korea, 2015. [Google Scholar]
- Woo, T.H.; Jo, Y.W.; Yang, G.M. Design of Experiments, 5th ed.; Jang, J.H., Ed.; Hyungseul: Paju-si, Republic of Korea, 2019; pp. 115–151. [Google Scholar]
Disclaimer/Publisher’s Note: The statements, opinions and data contained in all publications are solely those of the individual author(s) and contributor(s) and not of MDPI and/or the editor(s). MDPI and/or the editor(s) disclaim responsibility for any injury to people or property resulting from any ideas, methods, instructions or products referred to in the content. |
© 2023 by the authors. Licensee MDPI, Basel, Switzerland. This article is an open access article distributed under the terms and conditions of the Creative Commons Attribution (CC BY) license (https://creativecommons.org/licenses/by/4.0/).