Abstract
In order to accurately calculate the sunshine-induced temperature effect of an ultra-high bridge pylon, a refined numerical simulation model for the 3D bridge temperature field was established based on the proposed automatic sunshine shadow recognition method and pylon-height-related convection modification method. A suspension bridge H-shaped pylon with a height of 280 m was taken as an example, and the temperature field and corresponding thermal stress and deformation were calculated under typical meteorological conditions in spring, summer, autumn, and winter. The results show that the maximum temperature differences between the outer surfaces of the pylon can reach 19 °C and 16 °C for north–south walls and east–west walls, respectively, and exceed the recommended value of ±5 °C in the Chinese Specification. The maximum displacements can reach 370 mm and 110 mm at the top of the bridge pylon in the longitudinal and transverse directions of the bridge, respectively. After the modification of the convective coefficient of the outer surfaces with different wind speeds at different pylon heights, the temperature gradually decreased from the top to the bottom of the pylon, with a temperature difference of 8 °C. The significant influence of the sunshine shadow was shown on the temperature field and temperature effect of the bridge pylon. By considering the shadow effect, the maximum temperature difference can reach 12 °C between adjacent sunlit and shaded areas and can reach 14 °C between two pylon columns. A significant mutation of thermal stress existed in the shaded area, and the maximum stress could be reduced by 13 MPa compared with the adjacent sunlit area. Obvious asynchronous deformation was shown between two pylon columns, and the maximum asynchronous displacement at the top of the pylon can reach 18 mm and 45 mm in the longitudinal and transverse directions, respectively.
1. Introduction
Bridges exposed to the open environment have an uneven temperature field due to the influence of solar radiation, ambient temperature, and wind [1,2,3]. The considerable temperature-related structural deformation and additional thermal stress greatly increase the difficulty of controlling the alignment shape and internal force during construction [4,5,6], especially for large steel bridge structures.
In order to reduce the influence of temperature effects on steel segment splicing, the morning period before sunlight is usually chosen as the construction time due to the stable air temperature. However, because of the large size of the steel bridge segment and the protracted installation stage, the precision of assembly and shape control is inevitably affected by the rapid change in temperature caused by solar radiation. Because the steel surface temperature is constantly rising in the sunlit areas and is relatively low in the shaded areas, an obvious difference in temperature deformation exists on the steel surface under different solar conditions. If the solar radiation-related deformation error cannot be eliminated during the splicing process, the subsequent segment assembly will be more difficult, causing the actual internal force of the bridge to deviate significantly from that of the original design [7,8,9,10]. In Xining, Qinghai Province, China, during the main girder construction process of a single-pylon cable-stayed bridge, many wedge welds were used in the steel box girder splicing position, causing serious bearing disengagement due to the solar temperature effect [11]. A steel pylon is similar to a vertical cantilever beam but has a lower structural stiffness before transversal beam construction. Under this structural state, the temperature effect is more obvious and greatly increases the construction difficulty [12]. For H-shaped and A-shaped bridge pylons, at some moment, the temperature effect of one side of the pylon column significantly decreases because of the shelter provided by the other side of the pylon column, which leads to different deformations on both sides of the pylon column, further increasing the difficulty of construction control. Thus, accurately assessing the bridge pylon’s shadow and calculating the temperature effect are the basis of controlling the alignment shape of a bridge pylon.
The temperature field of a bridge structure Is mainly affected by solar radiation and convection, and these two kinds of heat exchange are generally mutually influential. Thus, the accurate simulation of solar radiation and the convective coefficient have a significant impact on the calculation of the bridge temperature effect. At present, most temperature field studies are based on the calculation assumption that the longitudinal temperature difference of a bridge pylon can be neglected. Based on this assumption, the 3D temperature field can be simplified into a 2D temperature field, which is regarded as the input temperature action with which to calculate the thermal effect of the bridge pylon. Zhang et al. calculated the thermal stress and deformation of an H-shaped concrete bridge pylon from Haihuang Bridge under the 2D temperature field and found that the inner side of the bridge pylon may crack under the action of the solar temperature field [13]. Ren et al. analyzed the spatial stress distribution under the most unfavorable temperature difference in the thickness direction of the suspension bridge pylon walls using measured data and a finite element simulation. The inner and outer walls of the bridge pylon experienced high tensile stress under the positive and negative temperature difference, respectively [14]. Dai and Qian used the thermal–mechanical indirect coupling method and analyzed the temperature effect of an H-section concrete bridge pylon. They concluded that cracks may occur on the pylon surface [15]. Based on the measurement and simulation of the temperature effect of Xiantao Hanjiang highway bridge, Zhang et al. found that the bridge pylon rotates periodically with the sun movement, and the maximum displacement difference of the bridge pylon lags behind the moment when the bridge pylon achieves the maximum temperature difference [16]. The above calculations cannot reflect the more complex thermal effects, such as the asynchronous deformation of the columns of a pylon, because the sunshine shadow effect between the bridge pylons is not properly considered. In order to accurately simulate the temperature field and the effect of the bridge pylon, a refined 3D temperature field numerical simulation method was established by considering real-time shadow recognition based on a ray tracing algorithm [17]. However, for ultra-high bridge pylons, convection variations for different wind speeds at varying pylon heights is a critical factor affecting the calculation accuracy of the temperature effect. The effects of height on the convective coefficient are not considered in the aforementioned simulating methods. A comprehensive simulation method needs to be developed for the accurate calculation of the temperature effect in ultra-high bridge pylons by both taking the shadow effects and the convection difference into consideration.
In this paper, an automatic sunshine shadow recognition method and the modifying method of the convective coefficient with different wind speeds at different pylon heights are firstly proposed. Then, a refined numerical simulation model is established for the calculation of the solar temperature field and the effect of the ultra-high structure. A 280 m high steel bridge pylon is taken as an example, and the 3D temperature field and the corresponding thermal stress and deformation are calculated. Finally, based on the modelling, the mechanism of asynchronous deformation of pylon columns are revealed, and the influence of structural shadow on the 3D temperature field of bridge pylon is quantified.
2. 3D Solar Temperature Field Analysis of Bridge Pylon
2.1. Differential Equation of Heat Conduction
Based on the law that heat conduction rate of the object is proportional to the temperature gradient, Fourier [18] puts forward the partial differential equation of heat conduction:
where and c are density (kg/m3) and specific heat capacity (J/kg·°C); , , and are the thermal conductivity (W/m·°C) of the material in three coordinate axes x, y, and z.
2.2. Boundary Conditions under the Sunshine Effect
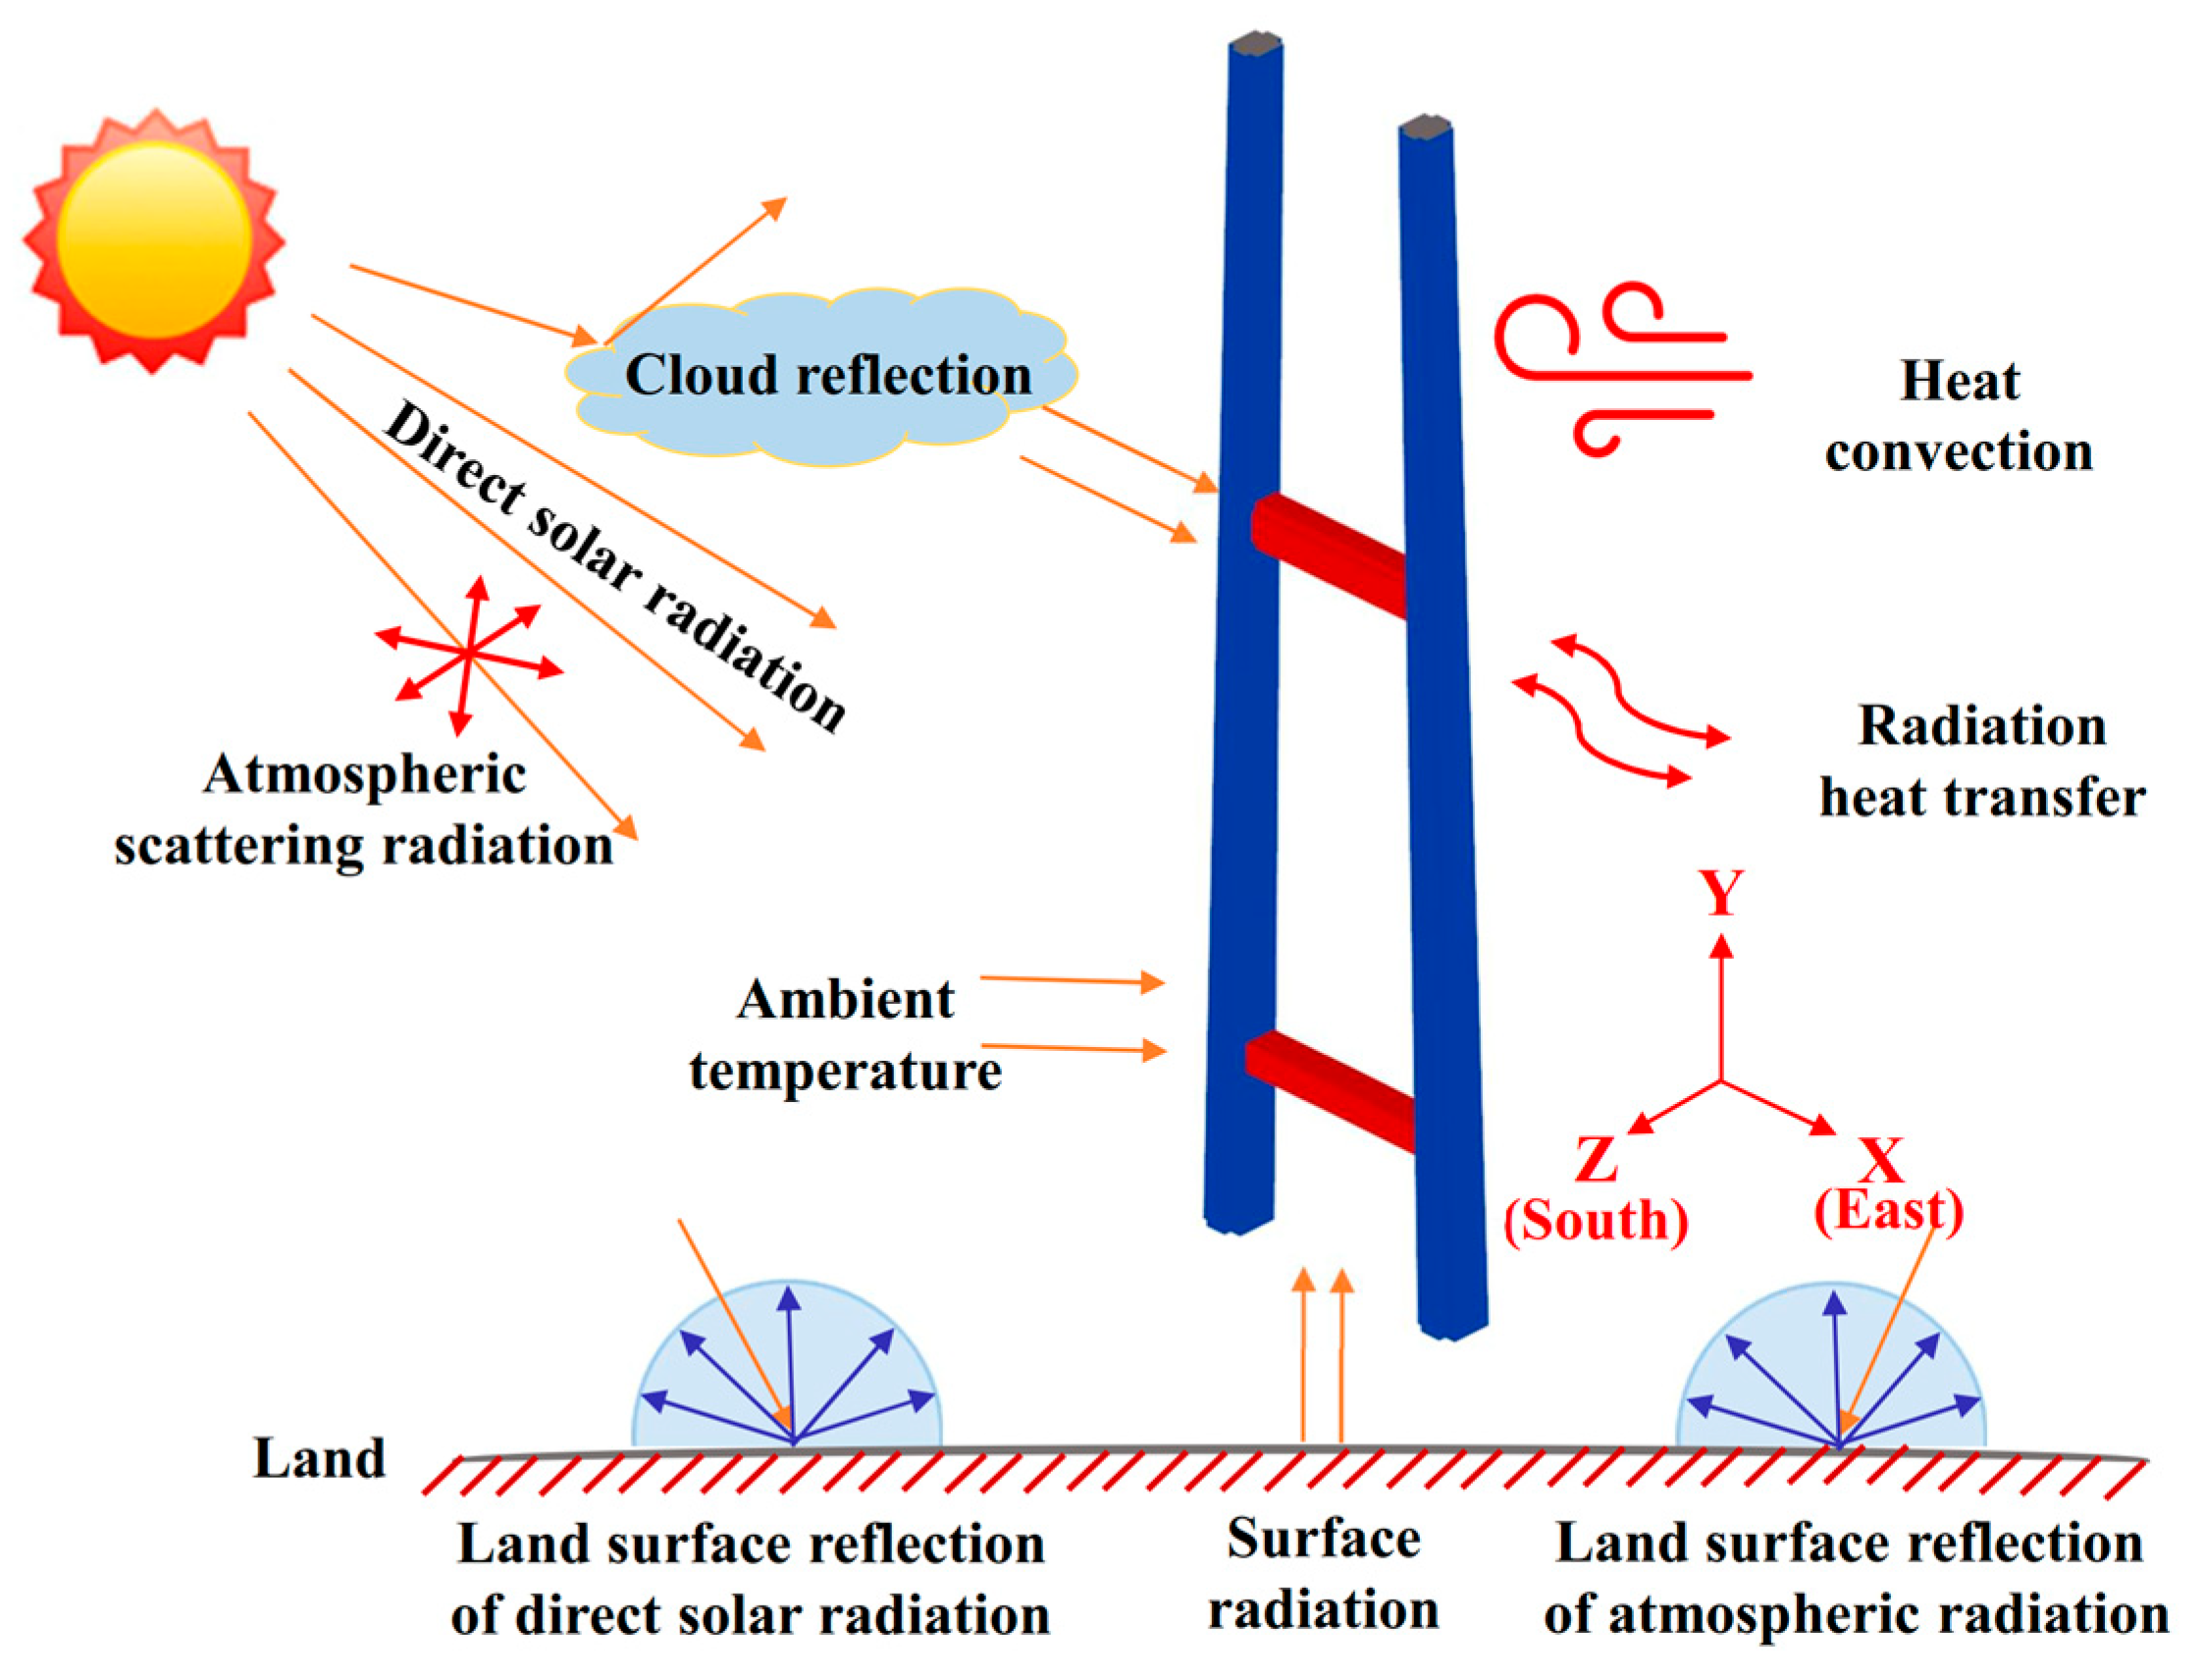
In actual engineering, the heat exchange between the bridge and the surrounding environment mainly includes three types: solar radiation, radiation heat transfer, and convection, as presented in Figure 1, and the total heat flux absorbed by structural surfaces is expressed as:
where is the solar radiation heat flux absorbed by the structure surface; and are the heat fluxes of convection and radiation heat transfer between structure surface and outside, respectively.
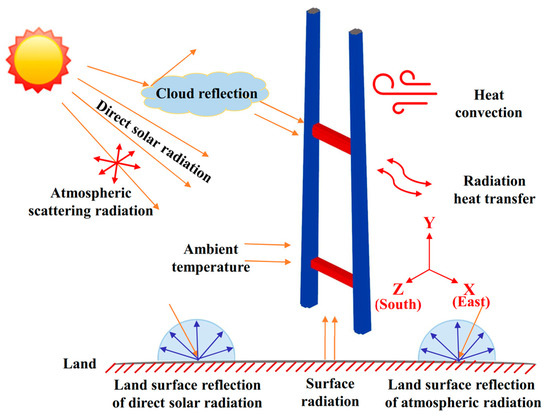
Figure 1.
Thermal boundary condition of bridge pylon under sunshine effect.
2.2.1. Solar Radiation
Solar radiation includes direct solar radiation that passes directly through the atmosphere parallel to the direction of sunlight, diffuse radiation that has been scattered by atmospheric constituents and cloud, and reflected radiation from the ground or water [19]. Its calculation is related to the factors such as solar incidence angle I, surface , solar elevation angle h, solar azimuth , and surface azimuth , as shown in Figure 2.
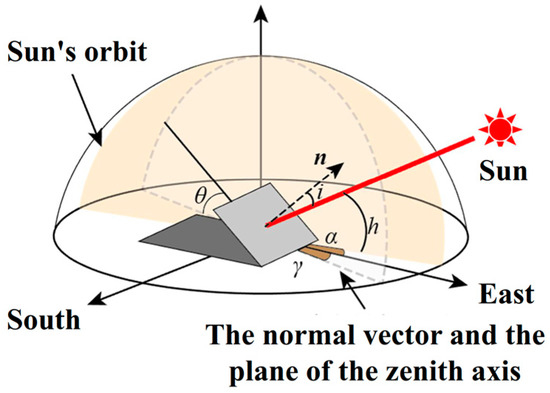
Figure 2.
Schematic Diagram of Solar Incidence Angle.
In a HOTTEL clear-sky model [20,21], the actual solar radiation heat flux absorbed by any surface is calculated by:
where is the absorptivity of the structural surface to solar radiation; , , and are the intensity of direct solar radiation, diffuse radiation, and ground reflected radiation intensity in horizontal plane; , , and are correction factors of direct radiation, diffuse radiation, and ground reflected radiation.
2.2.2. Radiation Heat Transfer
The heat flux of radiation heat transfer between structure surface and surrounding environment can be calculated by [22]:
where is the surface emissivity (emissivity) of the structure, generally 0.85~0.95; is the Stefan–Boltzmann constant of 5.67 10−8 W/(m2·K2); and are the temperature of surrounding environment and bridge structure, respectively.
2.2.3. Convection
Convection refers to heat transfer between two bodies by currents of moving gas or fluid, and the calculation method is as:
where and are the temperature of surrounding environment and bridge structure, respectively; is convective coefficient, and its value is related to the roughness of the surface, wind speed, ambient temperature, and surface temperature [23]. It can be calculated by:
where is the ambient temperature °C, and is the surface temperature of the bridge structure °C; is the wind speed m/s.
2.3. Calculation Method of 3D Solar Temperature Field
2.3.1. Sunshine Shadow Recognition by Ray Tracing Algorithm
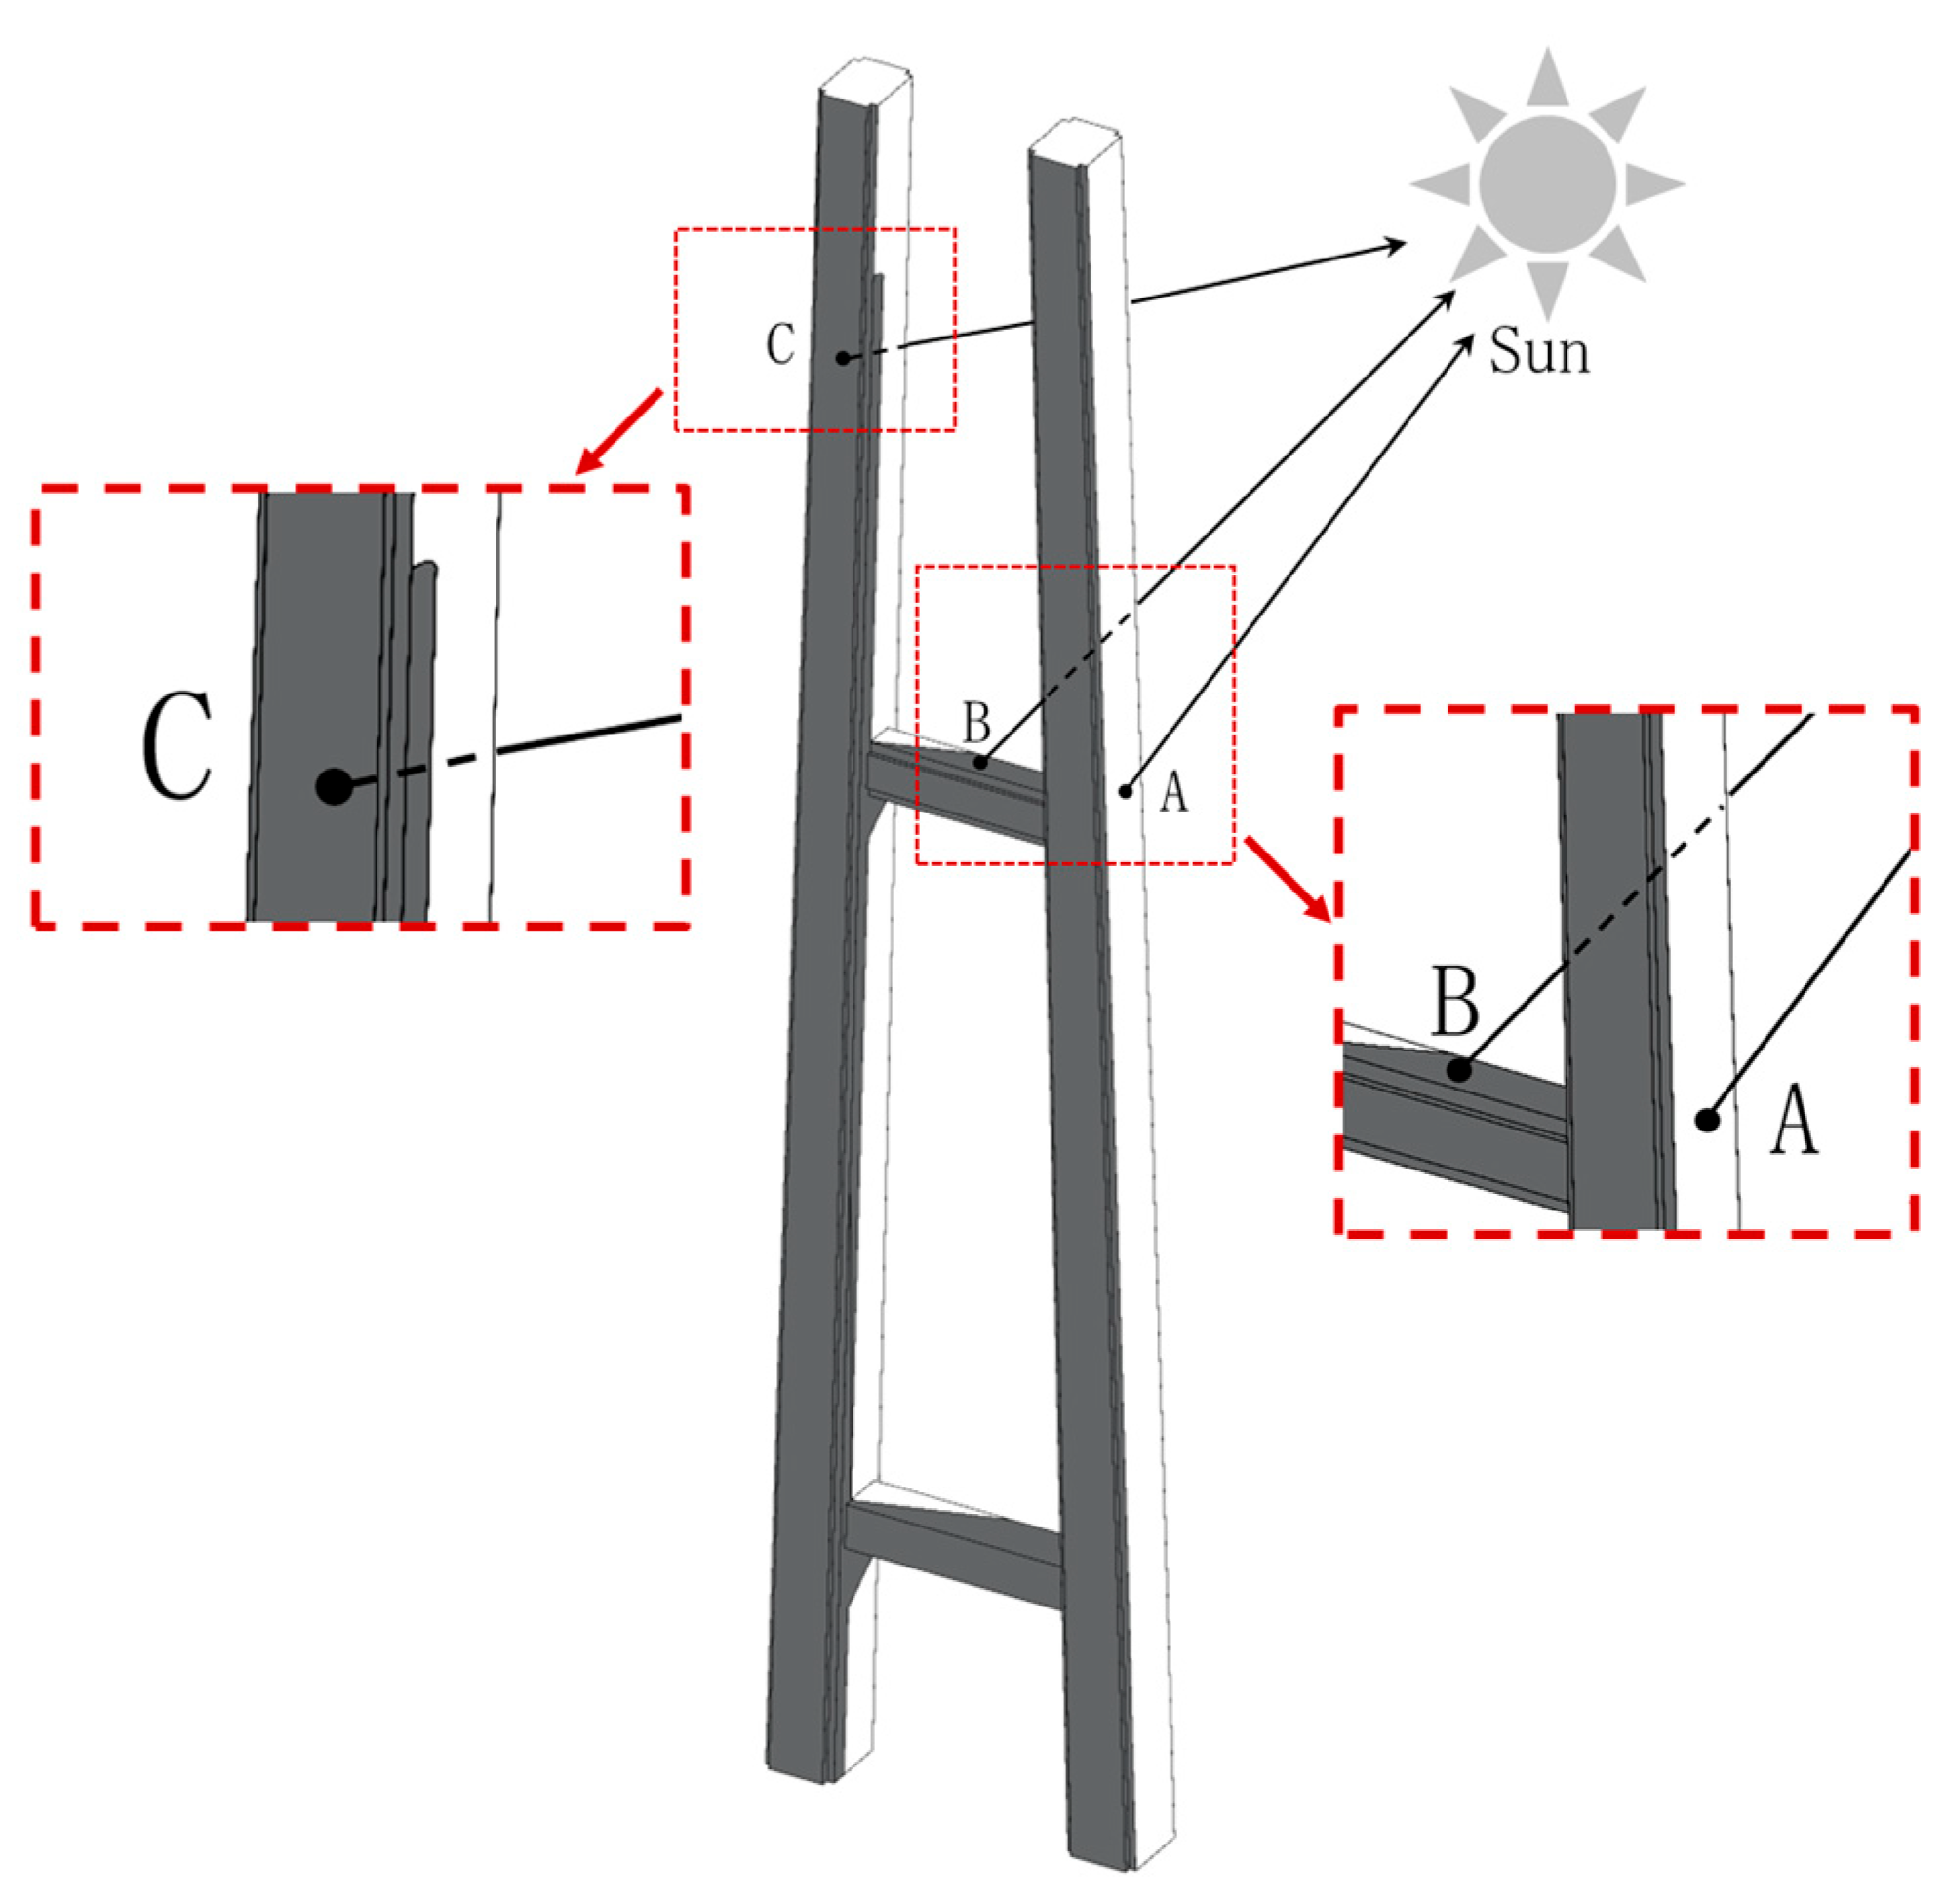
Since the amounts of solar radiation received are closely related to the duration of sunshine and the distribution of shadows, therefore, the sunshine shadows need to be accurately calculated. The shadows can be determined by using ray tracing algorithm, as shown in Figure 3. Firstly, a ray parallel to the sun’s rays is emitted from the point to be judged. Secondly, determine whether there is an intersection point between the ray and the structure. If the intersection point exists, the point is in the shadow areas; otherwise, the point is in the sunshiny areas. For example, point A is in the sunshiny area; point B is in the shadow area; and point C is the self-occlusion area.
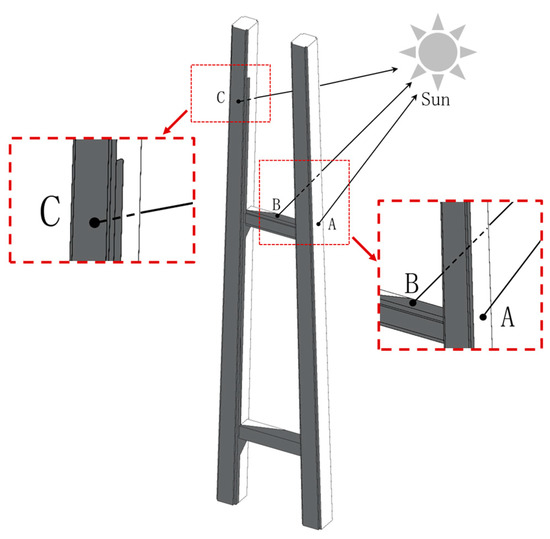
Figure 3.
Sunshine shadow recognition.
2.3.2. Modification Method of Convective Coefficient
The convective coefficient of structure surface is closely related to the temperature difference between fluids and the air velocity and increases with wind speed. Especially on flat ground, the average wind speed varies exponentially from 4 to 15 m/s in the height of 0 to 500 m [24]. Thus, the convection coefficient on the surface of the ultra-high bridge pylon cannot be ignored. When the wind speed is known, the convective coefficient can be calculated by Equation (6).
2.3.3. ABAQUS Calculation Process
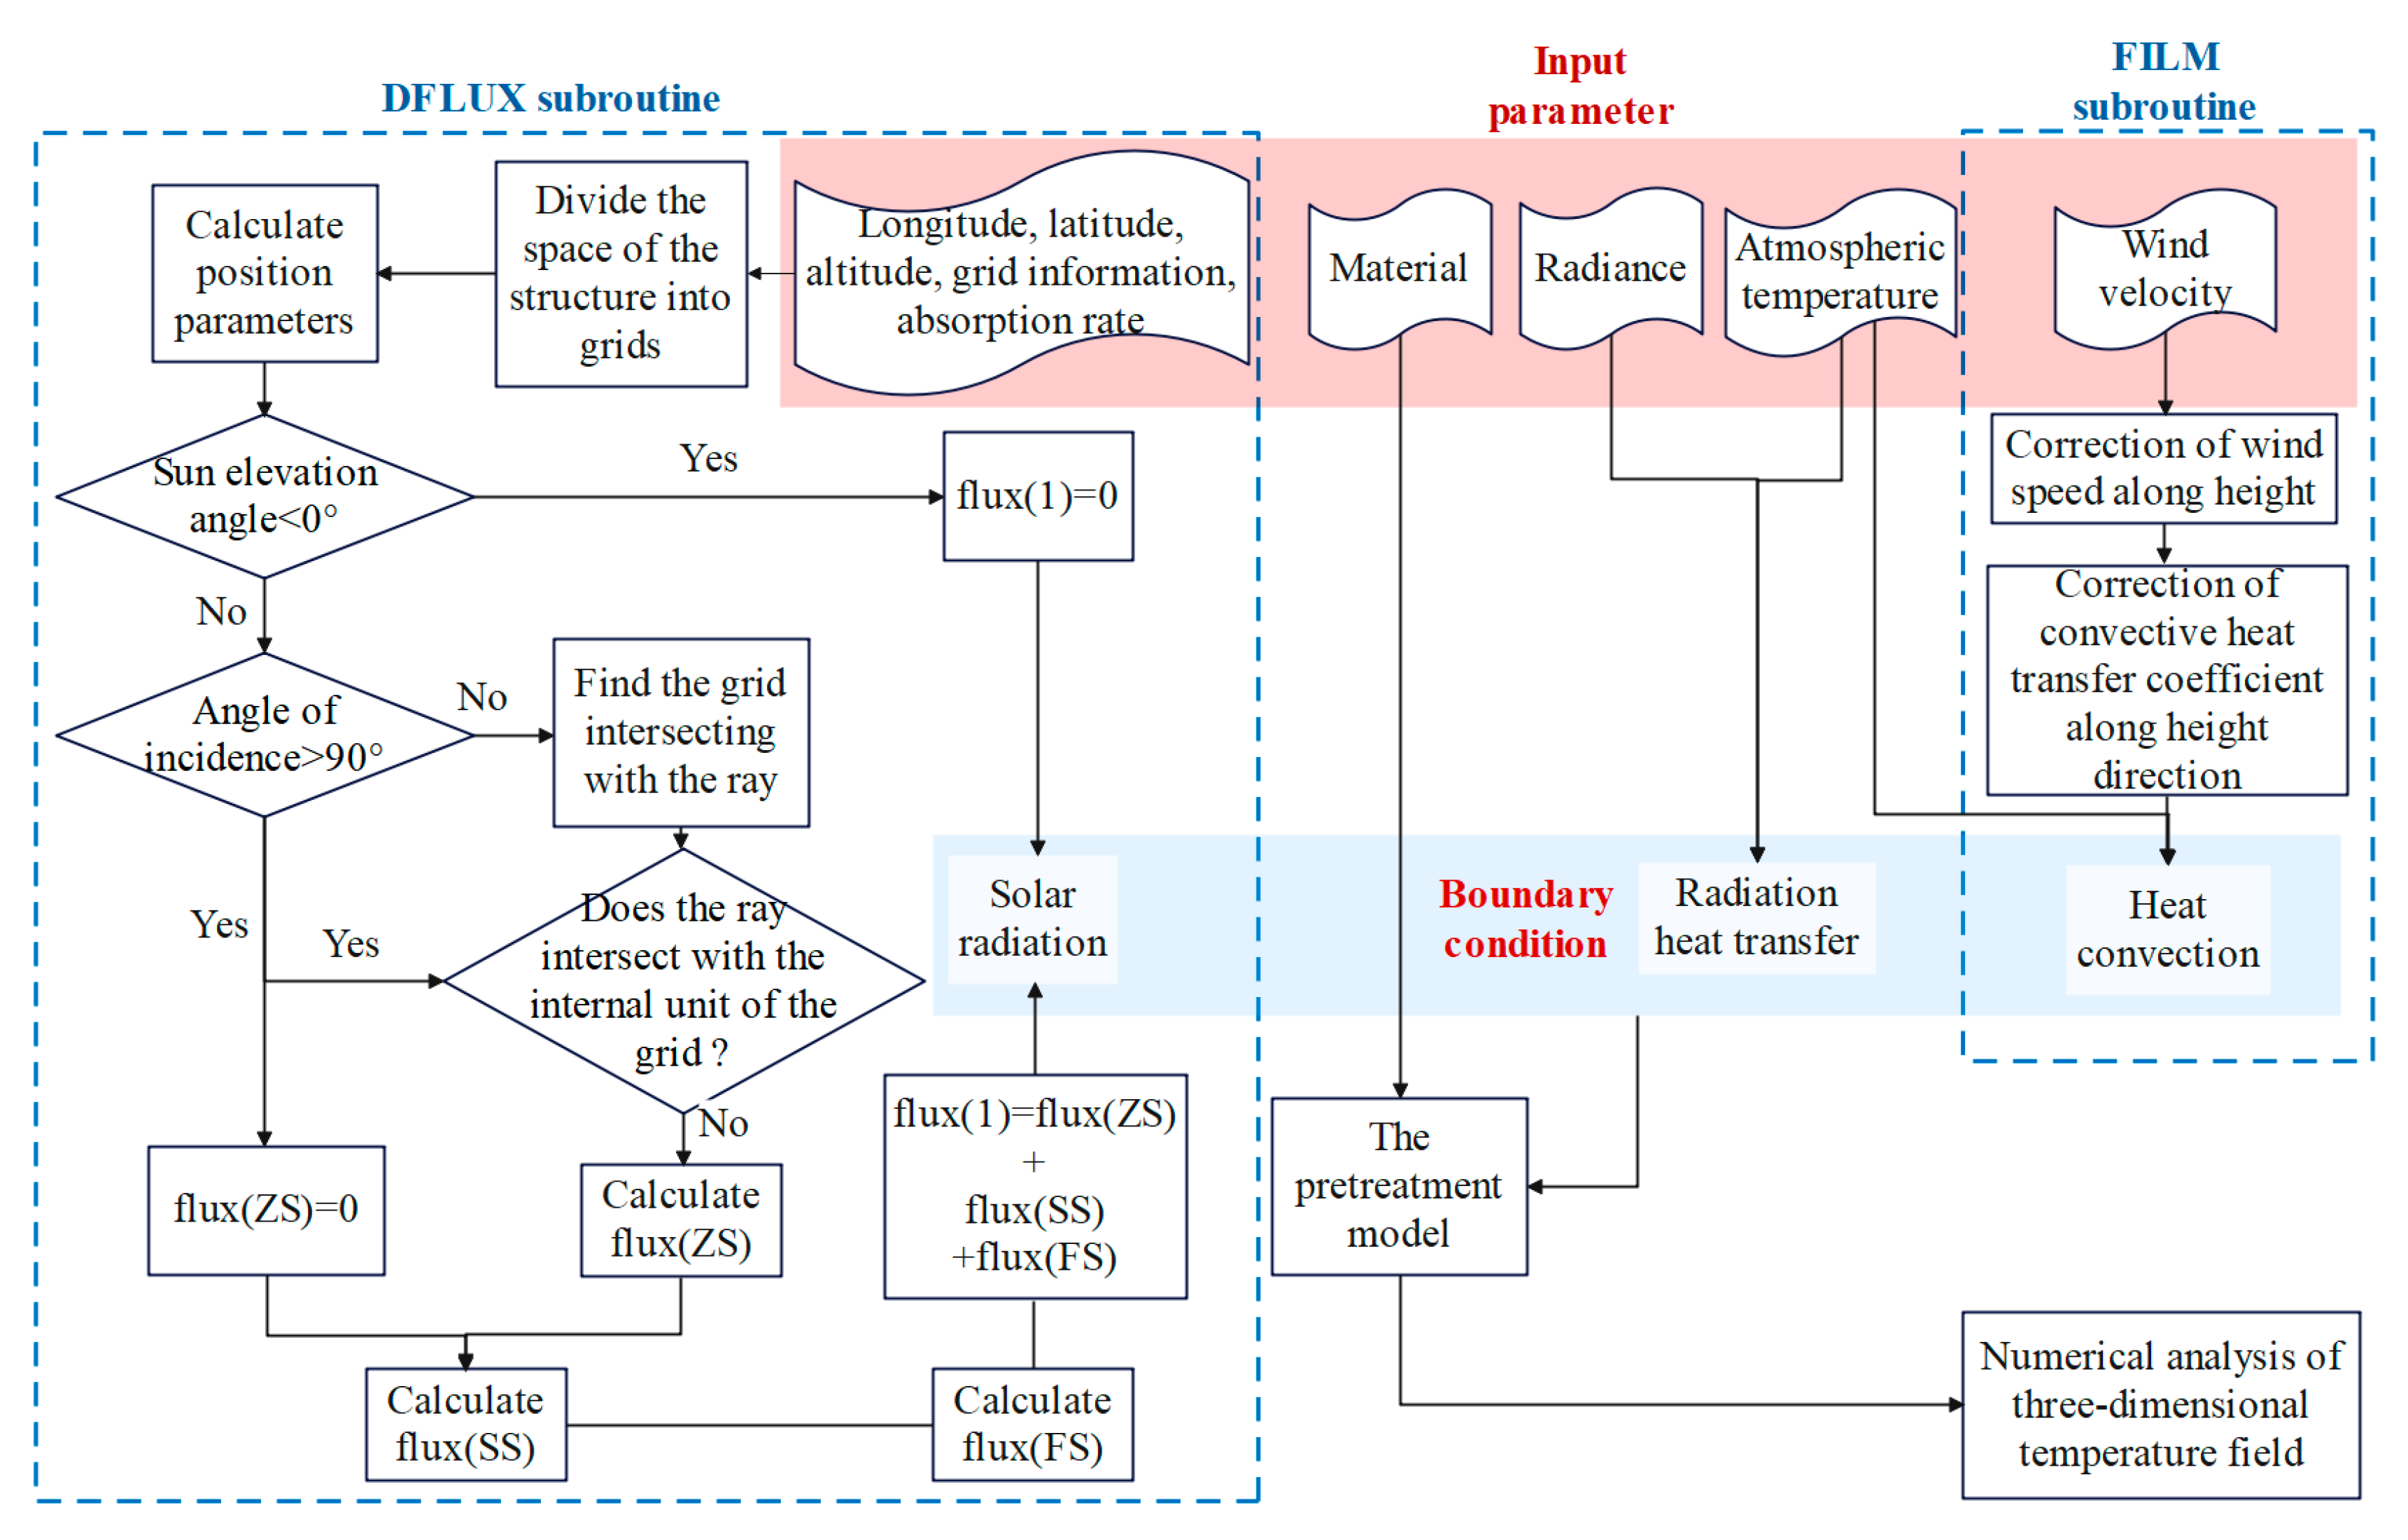
In this paper, in order to realize the numerical simulation of the 3D solar temperature field, a fine numerical simulation model for identifying bridge shadows with complex structures and accurately calculating 3D temperature fields is established based on the shadow recognition algorithm and grid acceleration algorithm [17]. After, the convective heat transfer (FILM) subroutine is embedded into the interaction analysis module in ABAQUS to correct the convective coefficient of super high bridge pylon along the height. The calculation process as shown in Figure 4, where flux (ZS), flux (SS), and flux (FS) are the intensity of solar radiation and diffuse radiation and ground reflected radiation; flux (1) is the intensity of total solar radiation.
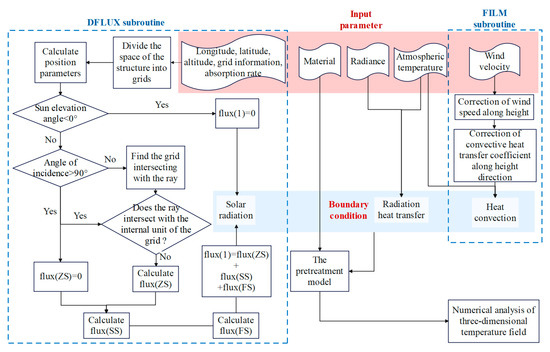
Figure 4.
Flow chart of numerical simulation of 3D temperature field caused by solar radiation.
There are three main parts in the technology. Part 1 is to determine whether the structure is shaded by DFLUX subroutine and consider diffuse reflection and bottom reflection to determine the radiation intensity of the structure, and Part 2 is to calculate the influence of wind speed on convective heat transfer coefficient by FILM subroutine, and Part 3 is to determine the influence of radiation heat transfer by considering the radiance of the structure itself and the ambient temperature. These three parts jointly determine the solar radiation boundary conditions and then combine the material properties to obtain the final temperature field of the bridge structure.
3. Thermal-Mechanical Coupling Model
3.1. Engineering Background
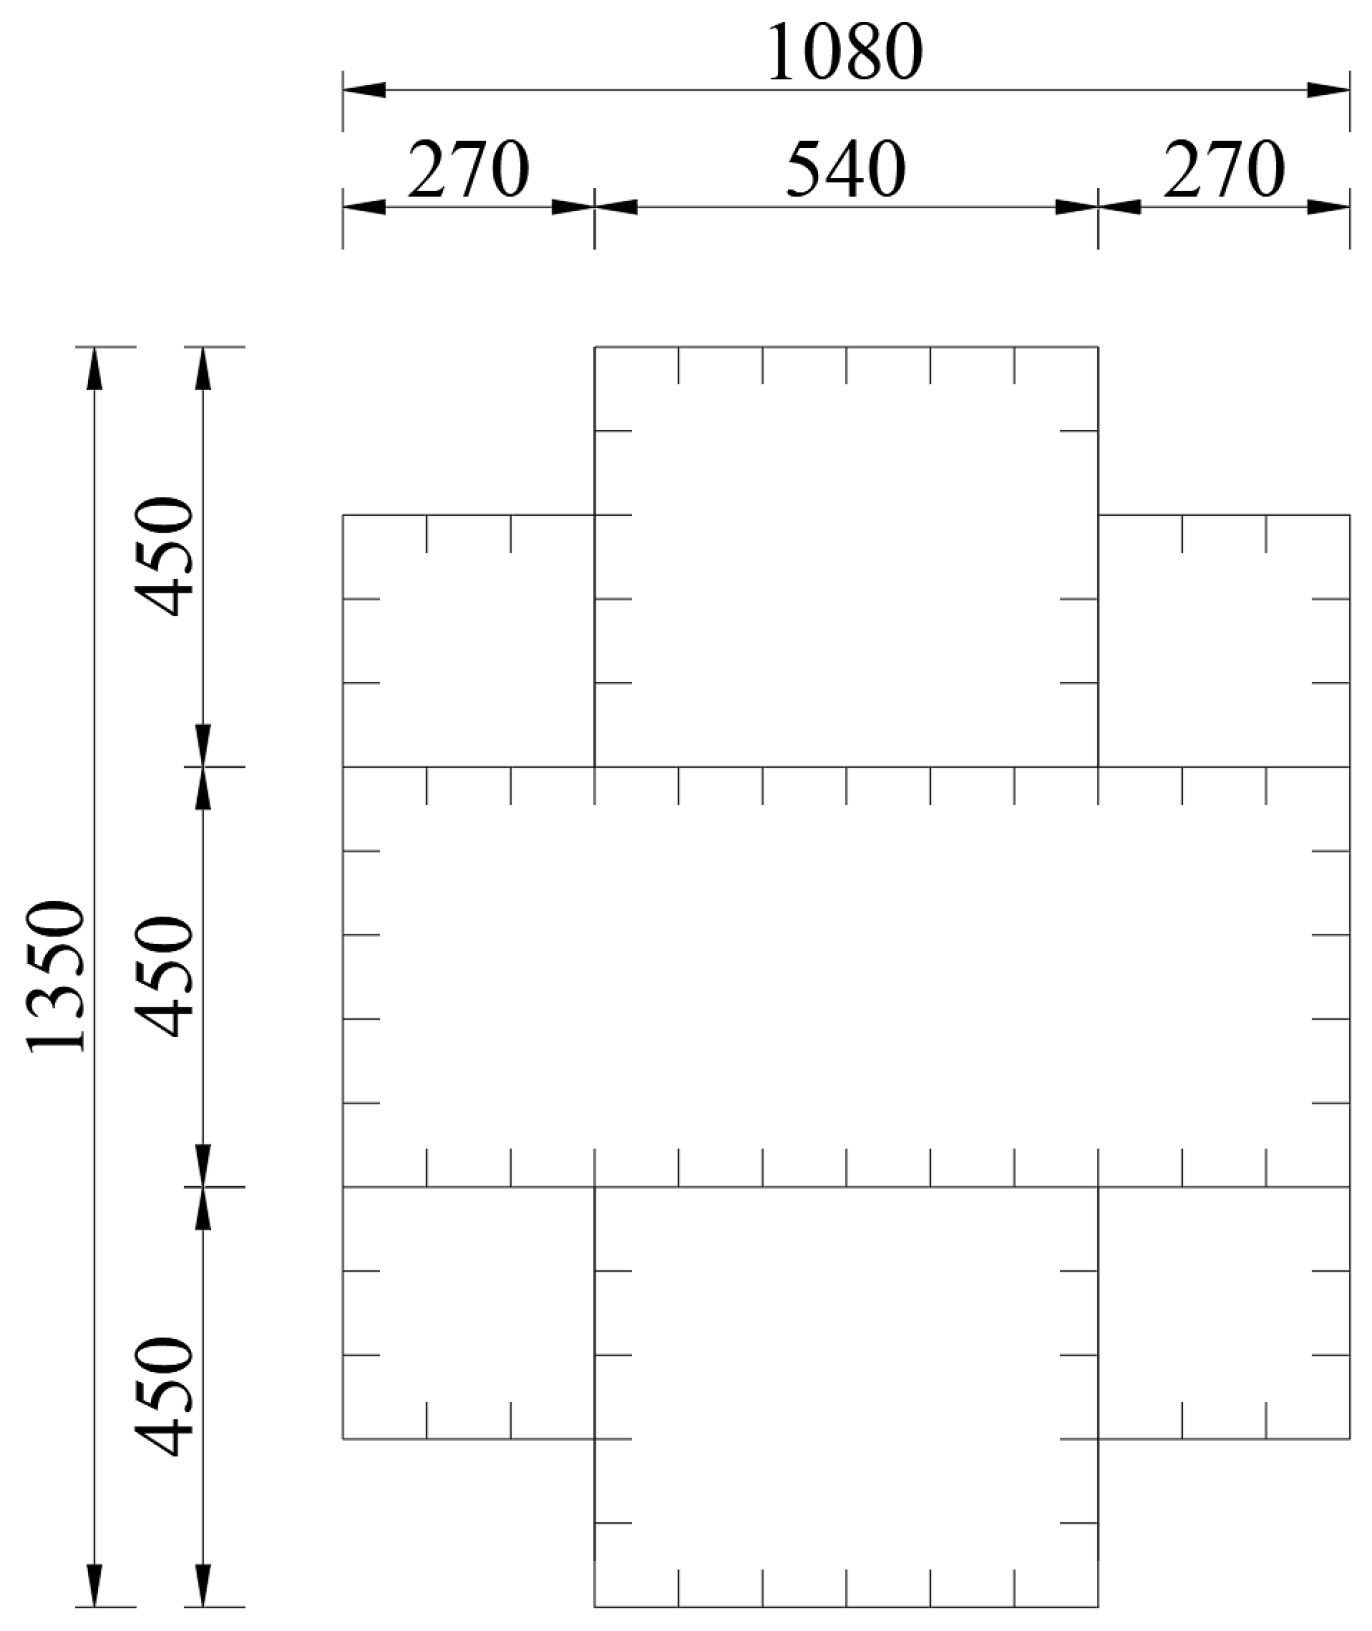
A double-tower suspension bridge with a main span of 1500 m is set up from north to south to cross the main river channel of the Yangtze River. The bridge pylon was designed as an H-type steel bridge pylon with a height of 280 m; the cross-section of the bridge pylon gradually changes from 13.5 m 10.8 m at the bottom to 10.5 m 8.4 m at the top; and the wall thickness of the steel box is 35~50 mm. The cross-section structure of bridge pylon as show in Figure 5.

Figure 5.
Structure of bridge pylon cross-section.
3.2. Model Establishment
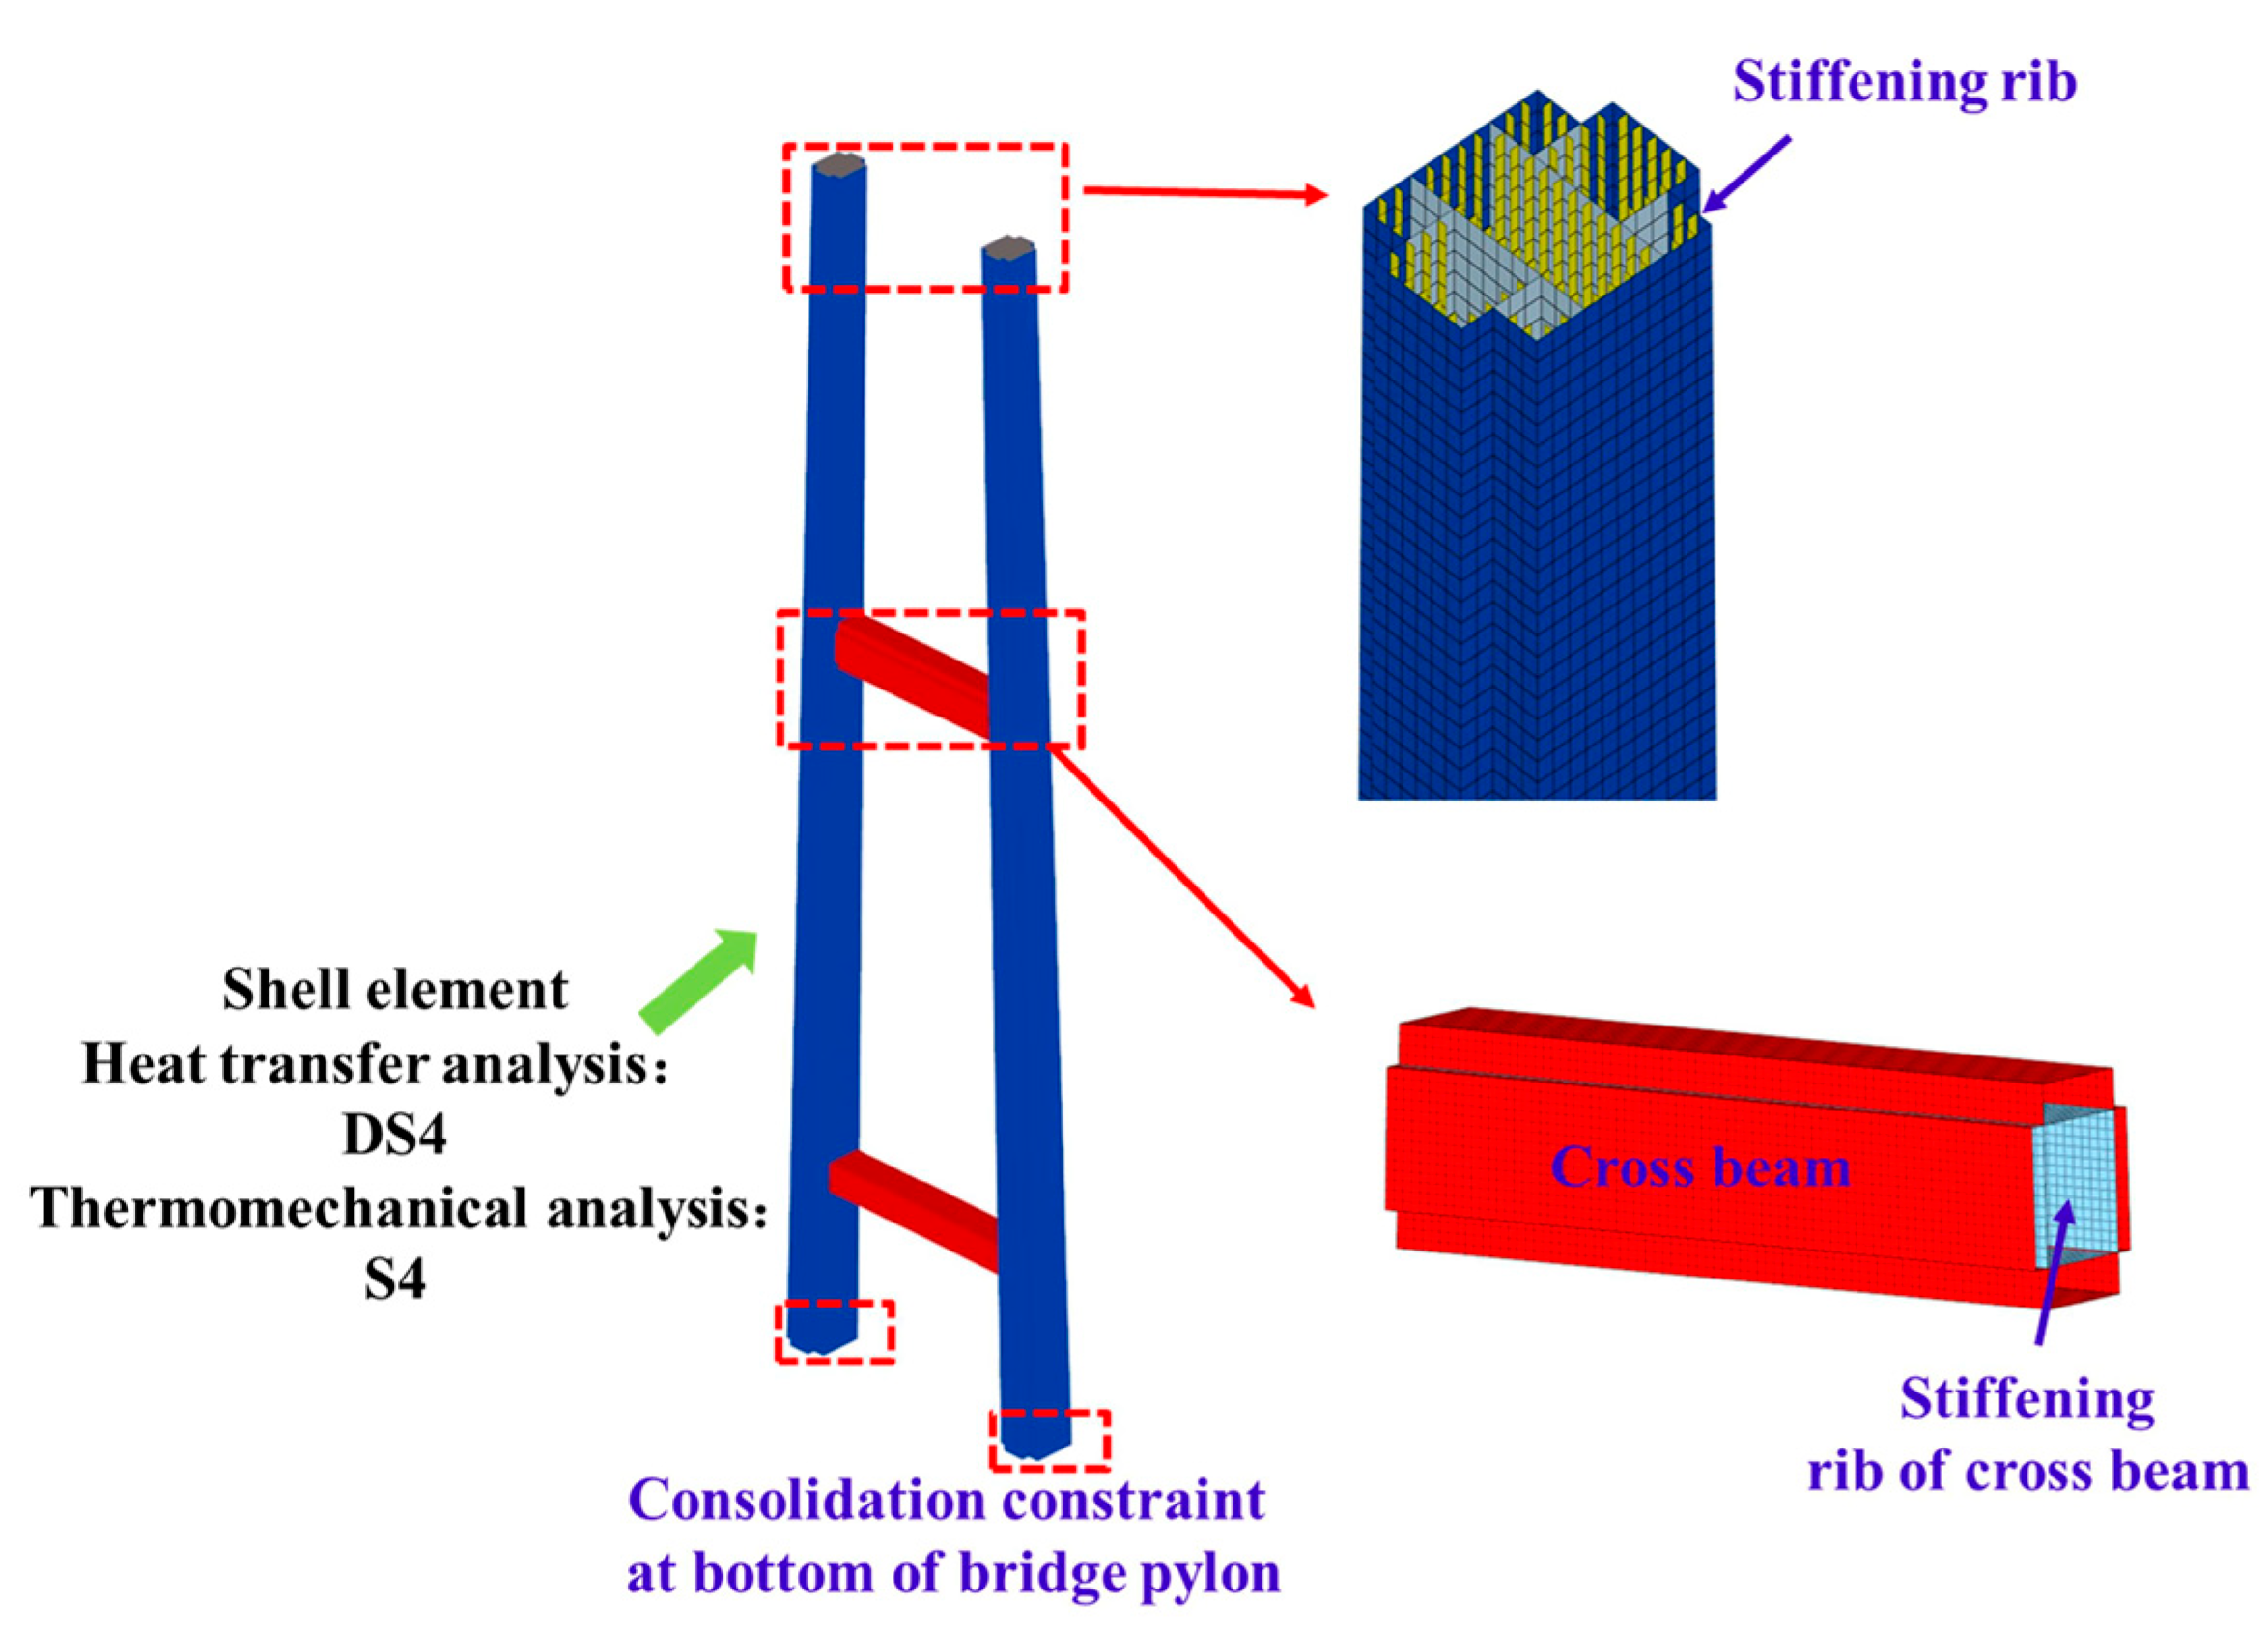
The analysis model is established by ABAQUS software, DS3/DS4 heat transfer element are used to simulate steel structure. The divide of the bridge pylon mesh is presented in Figure 6, and the material thermal parameters are provided in Table 1.

Figure 6.
H-type ultra-high steel bridge pylon model.

Table 1.
Thermal Parameter.
3.3. Modification of Convection with Pylon Height
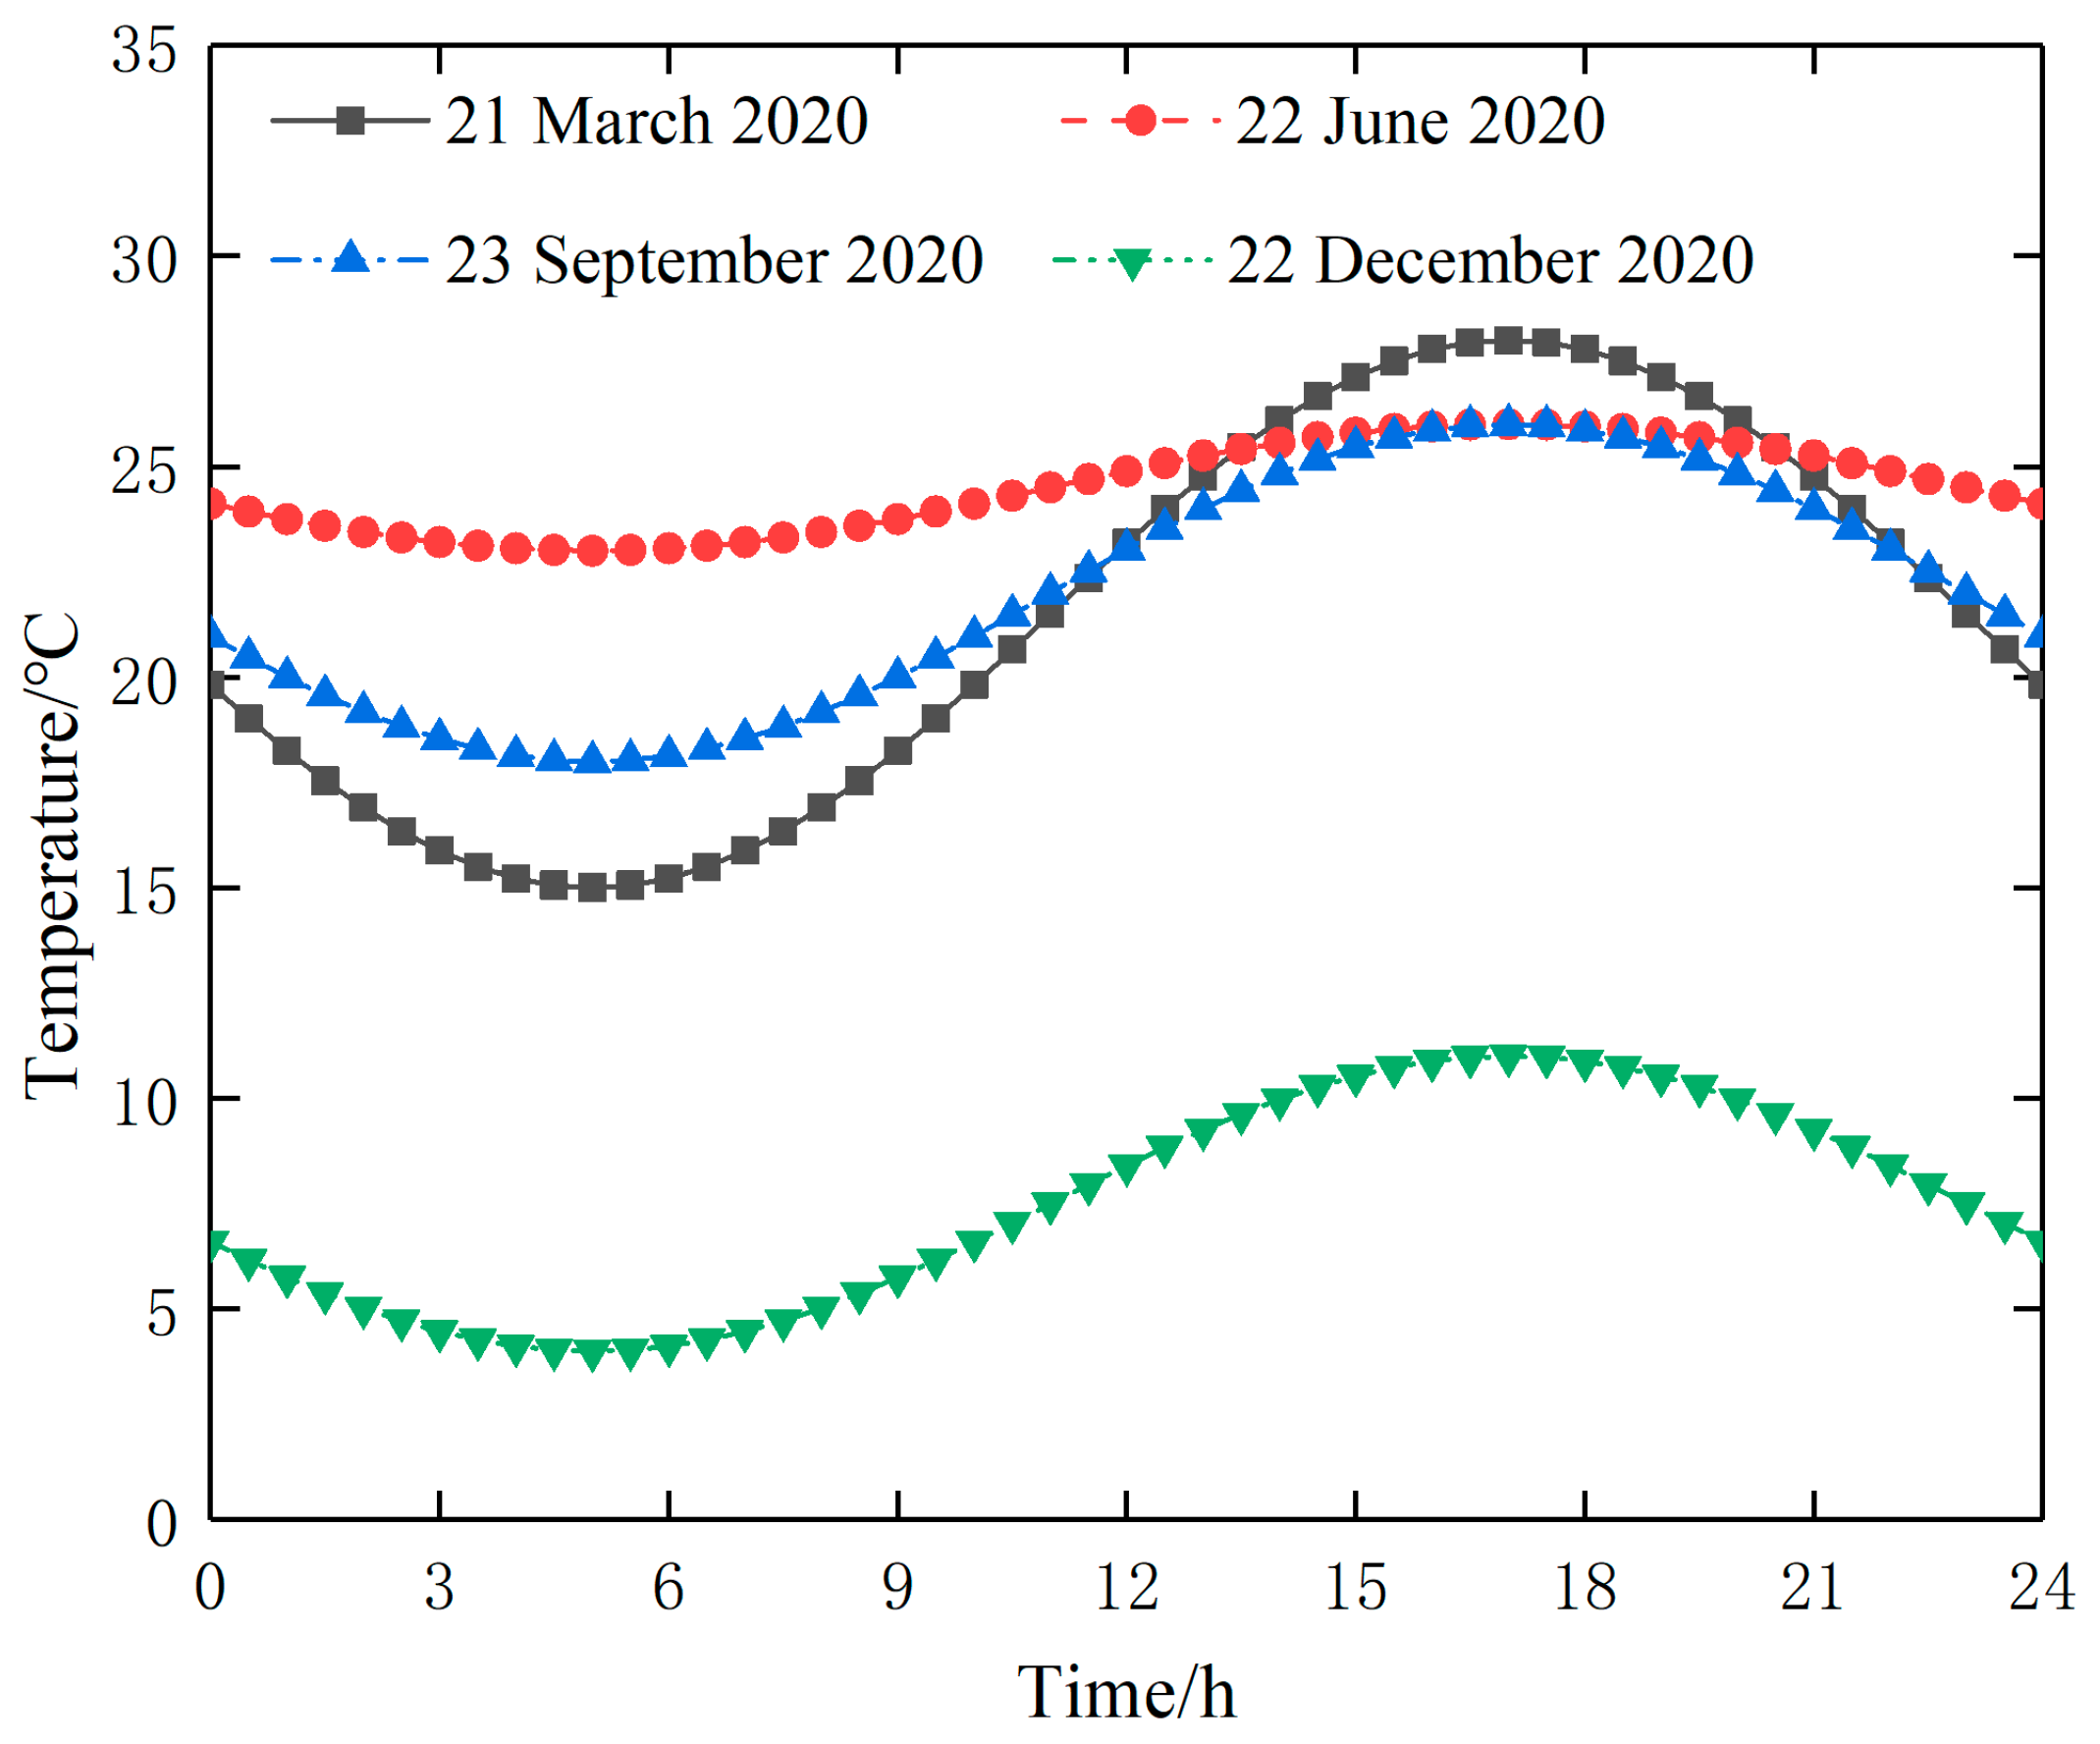
In this paper, a sunny day in four seasons of 2020 is selected as the calculation time, and two days are calculated in advance to prevent the influence of the initial temperature field. According to the historical meteorological data of the bridge site, the sine curve can be used to accurately simulate the temperature cycle in a day [25,26]. The typical meteorological parameters in four seasons as show in Table 2, and the temperature variation as show in Figure 7.
Table 2.
Meteorological Parameters for Four Seasons.
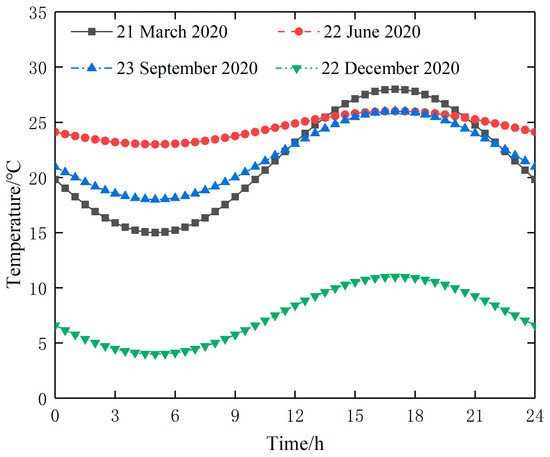
Figure 7.
Typical Temperature in four seasons.
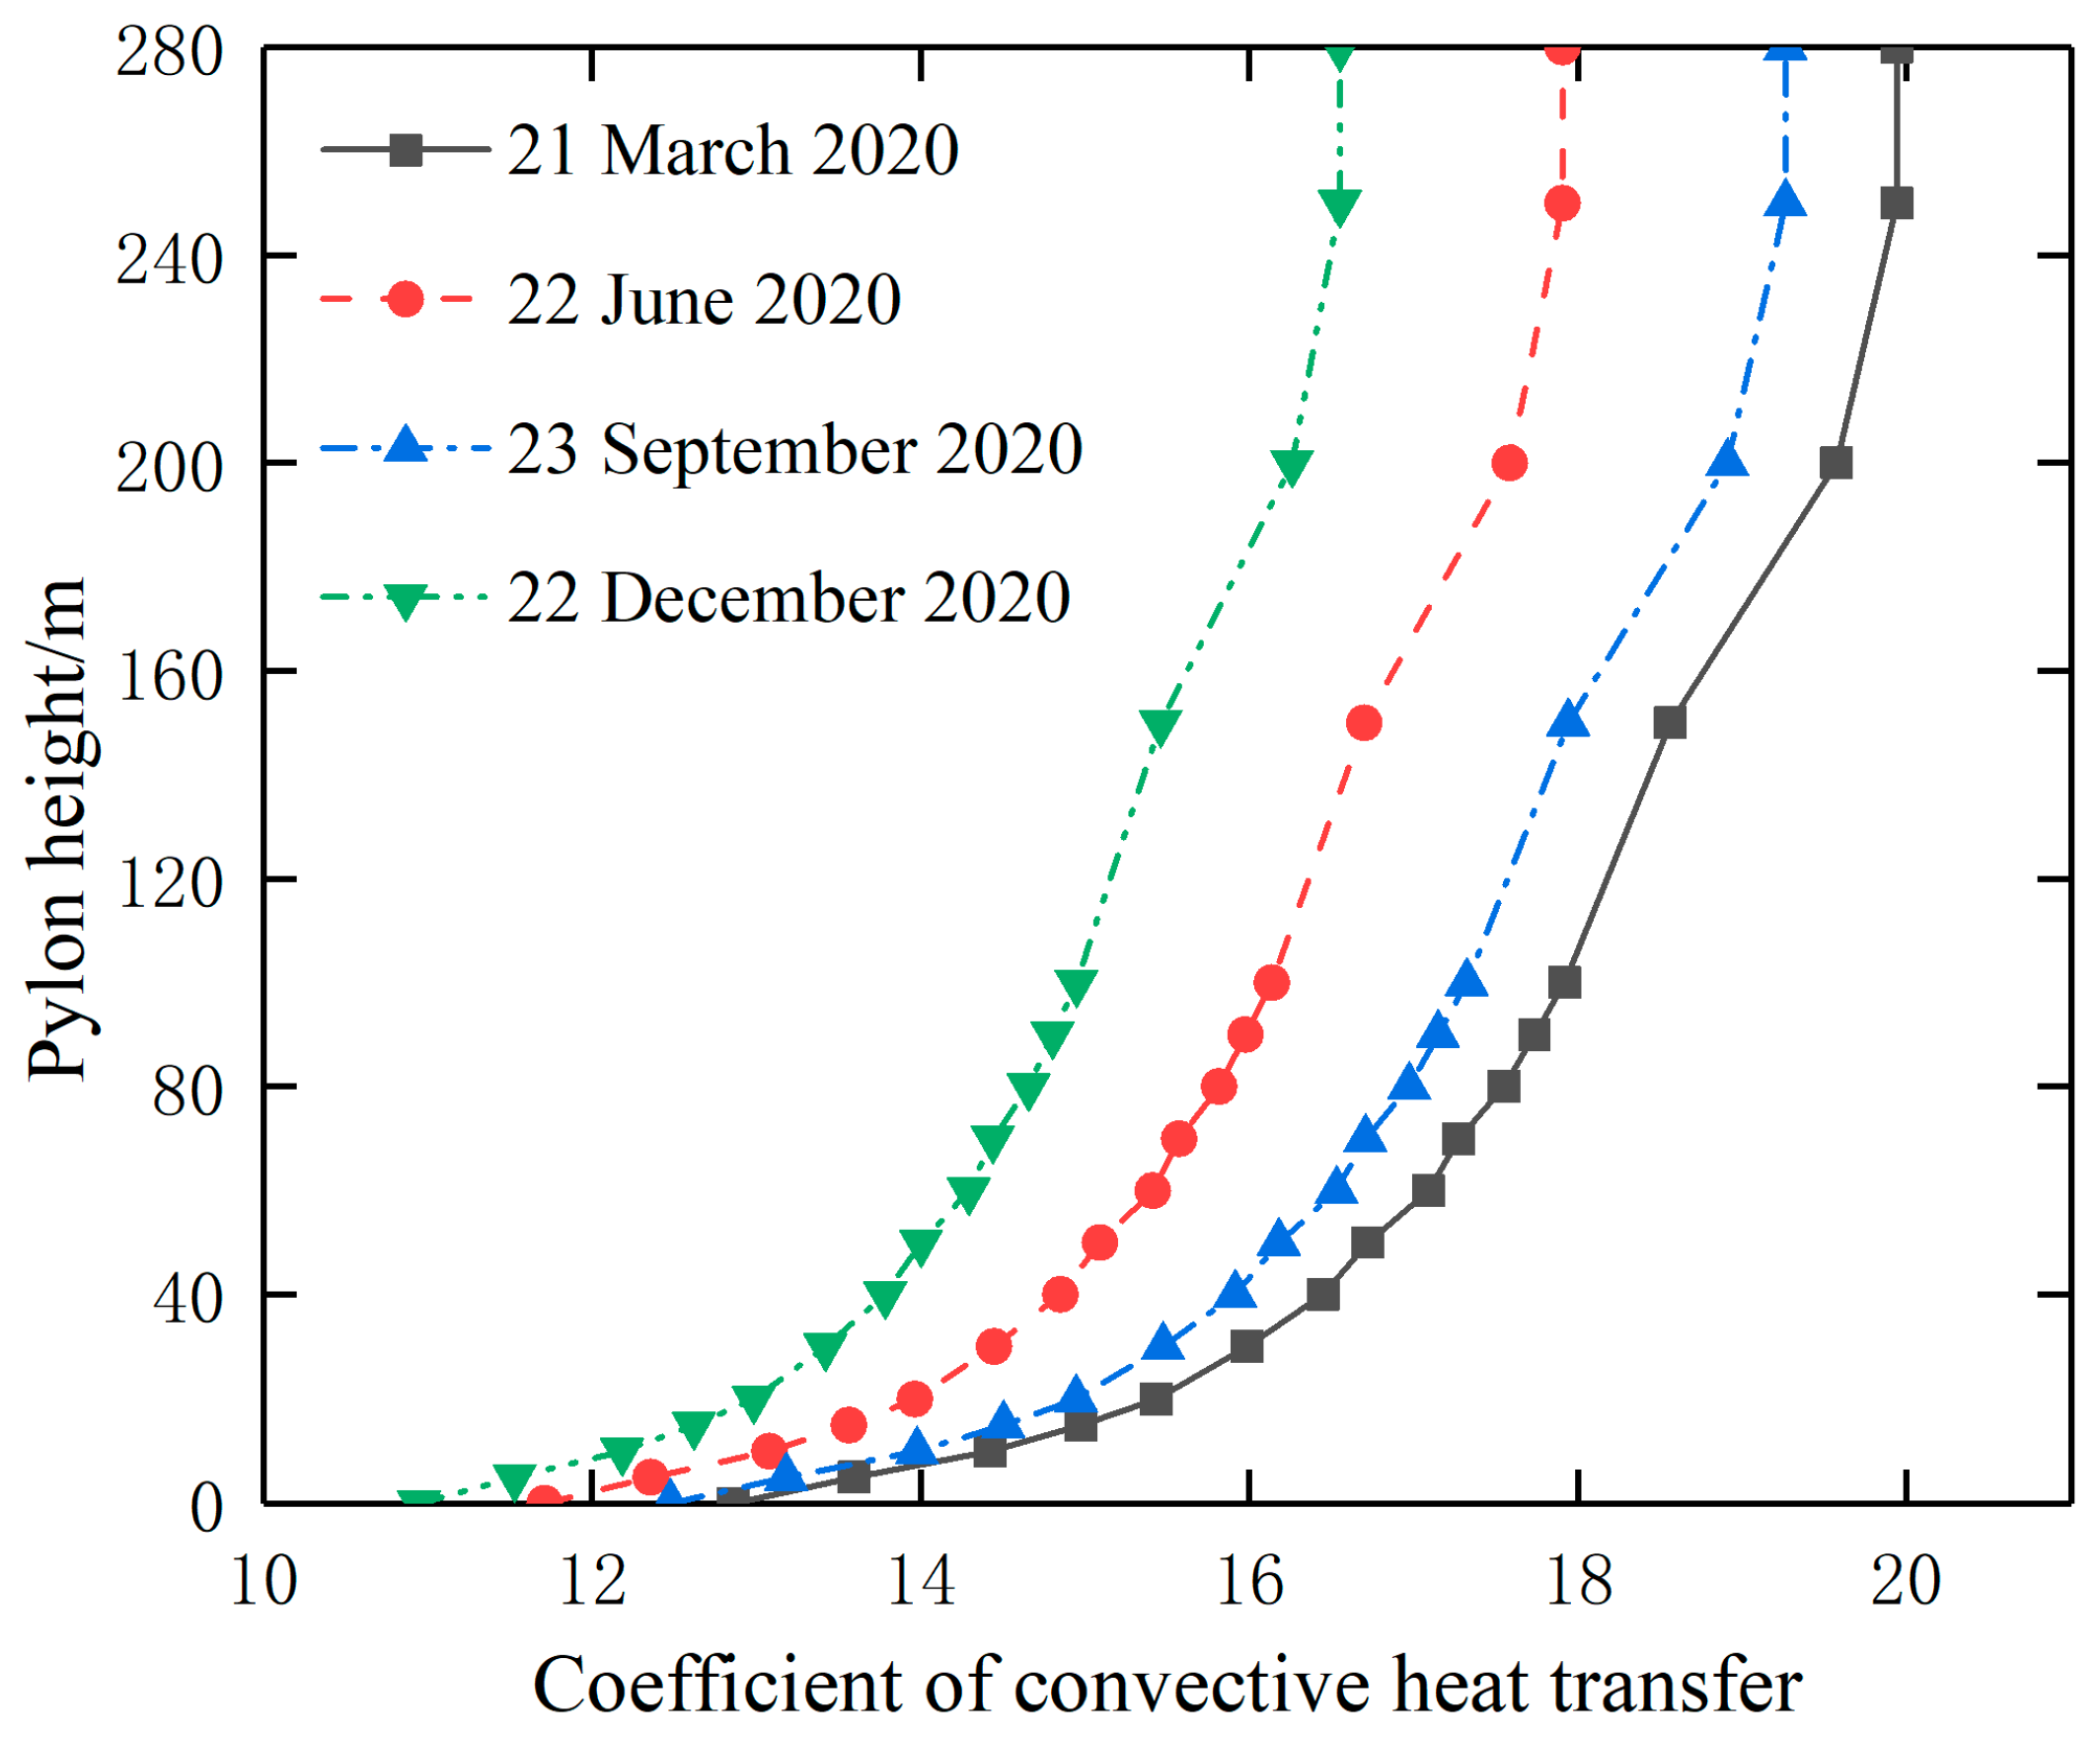
With the increasing height of ultra-high steel bridge pylon, the wind speed gradually increases. In this paper, the convective coefficient of the outer surfaces with different wind speed at different pylon height is corrected based on the procedure proposed by the Chinese Specification JTG/T 3360-01-2018 “Code for Wind Resistance Design of Highway Bridges” [27]. The convective heat transfer coefficient in each season as shown in Figure 8.
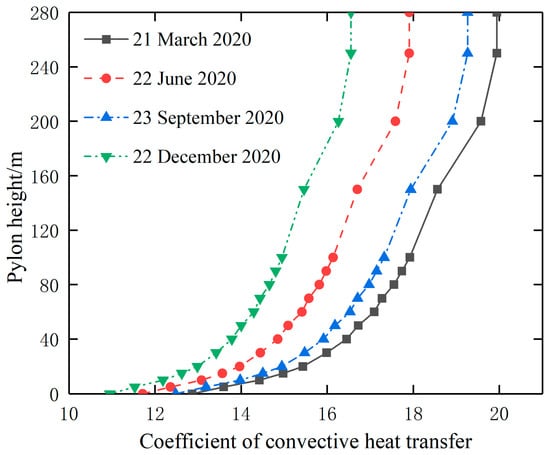
Figure 8.
Convection coefficient corrected at different pylon height in four seasons.
3.4. Validation
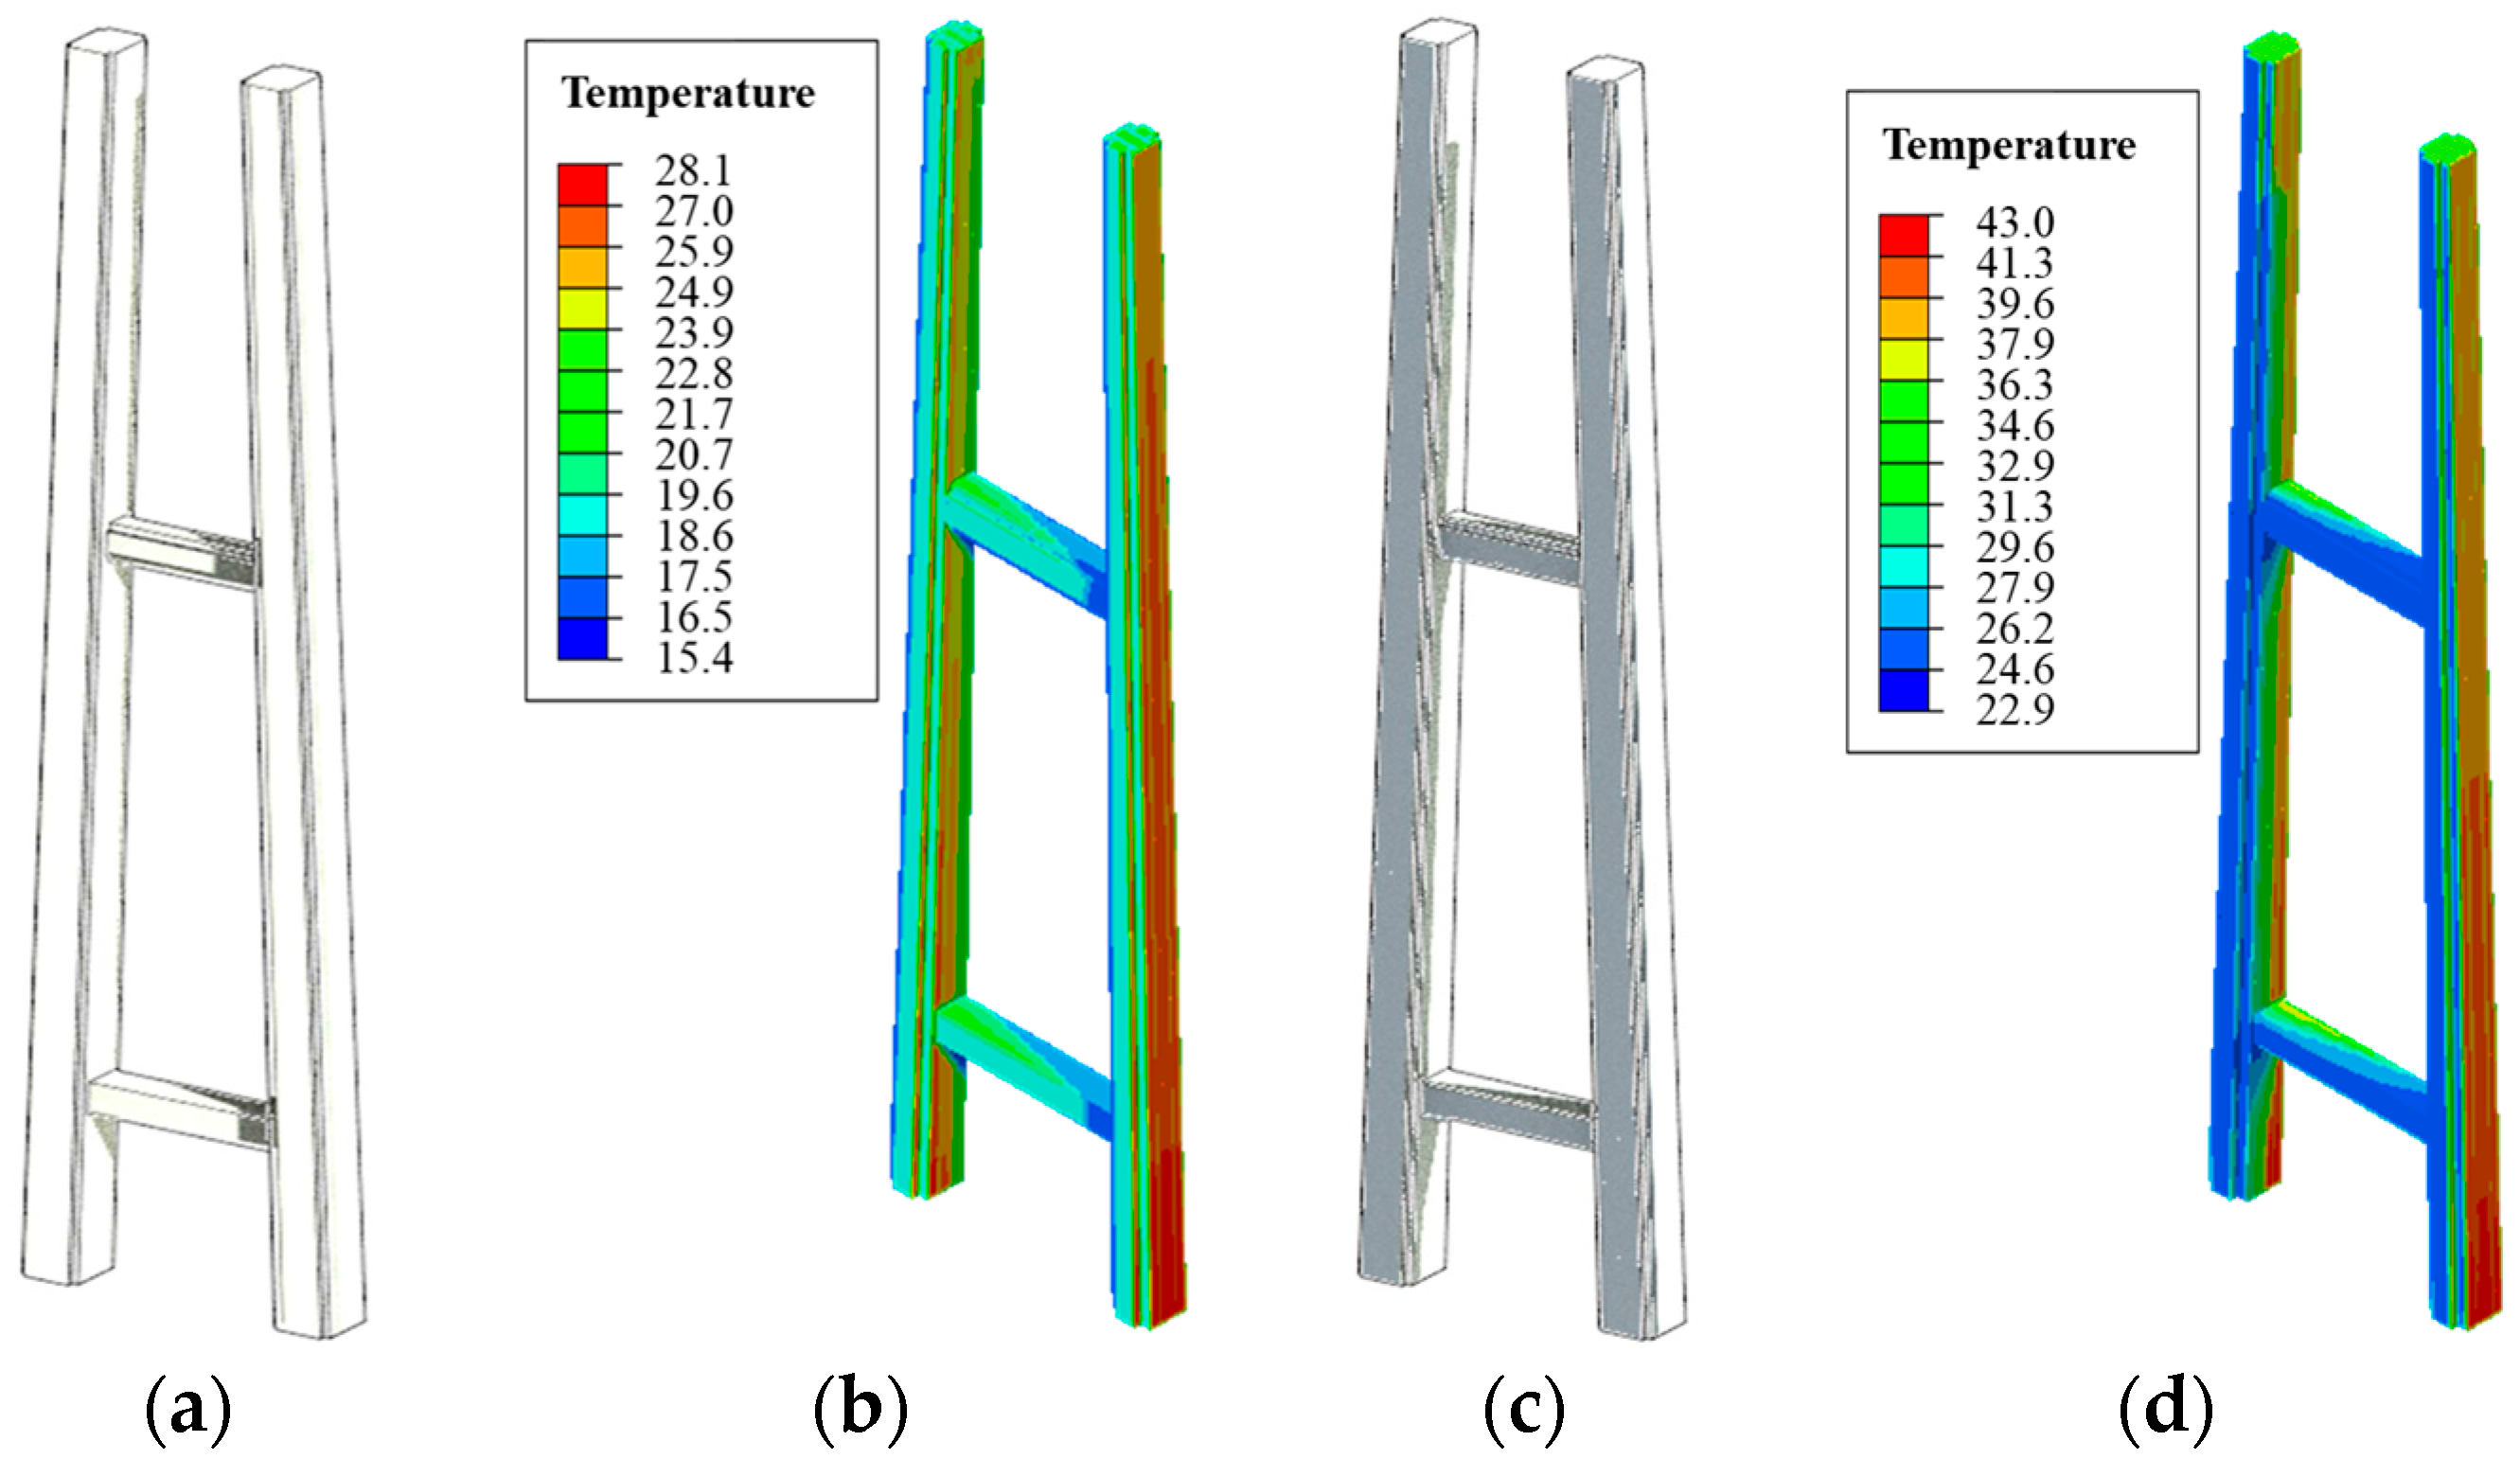
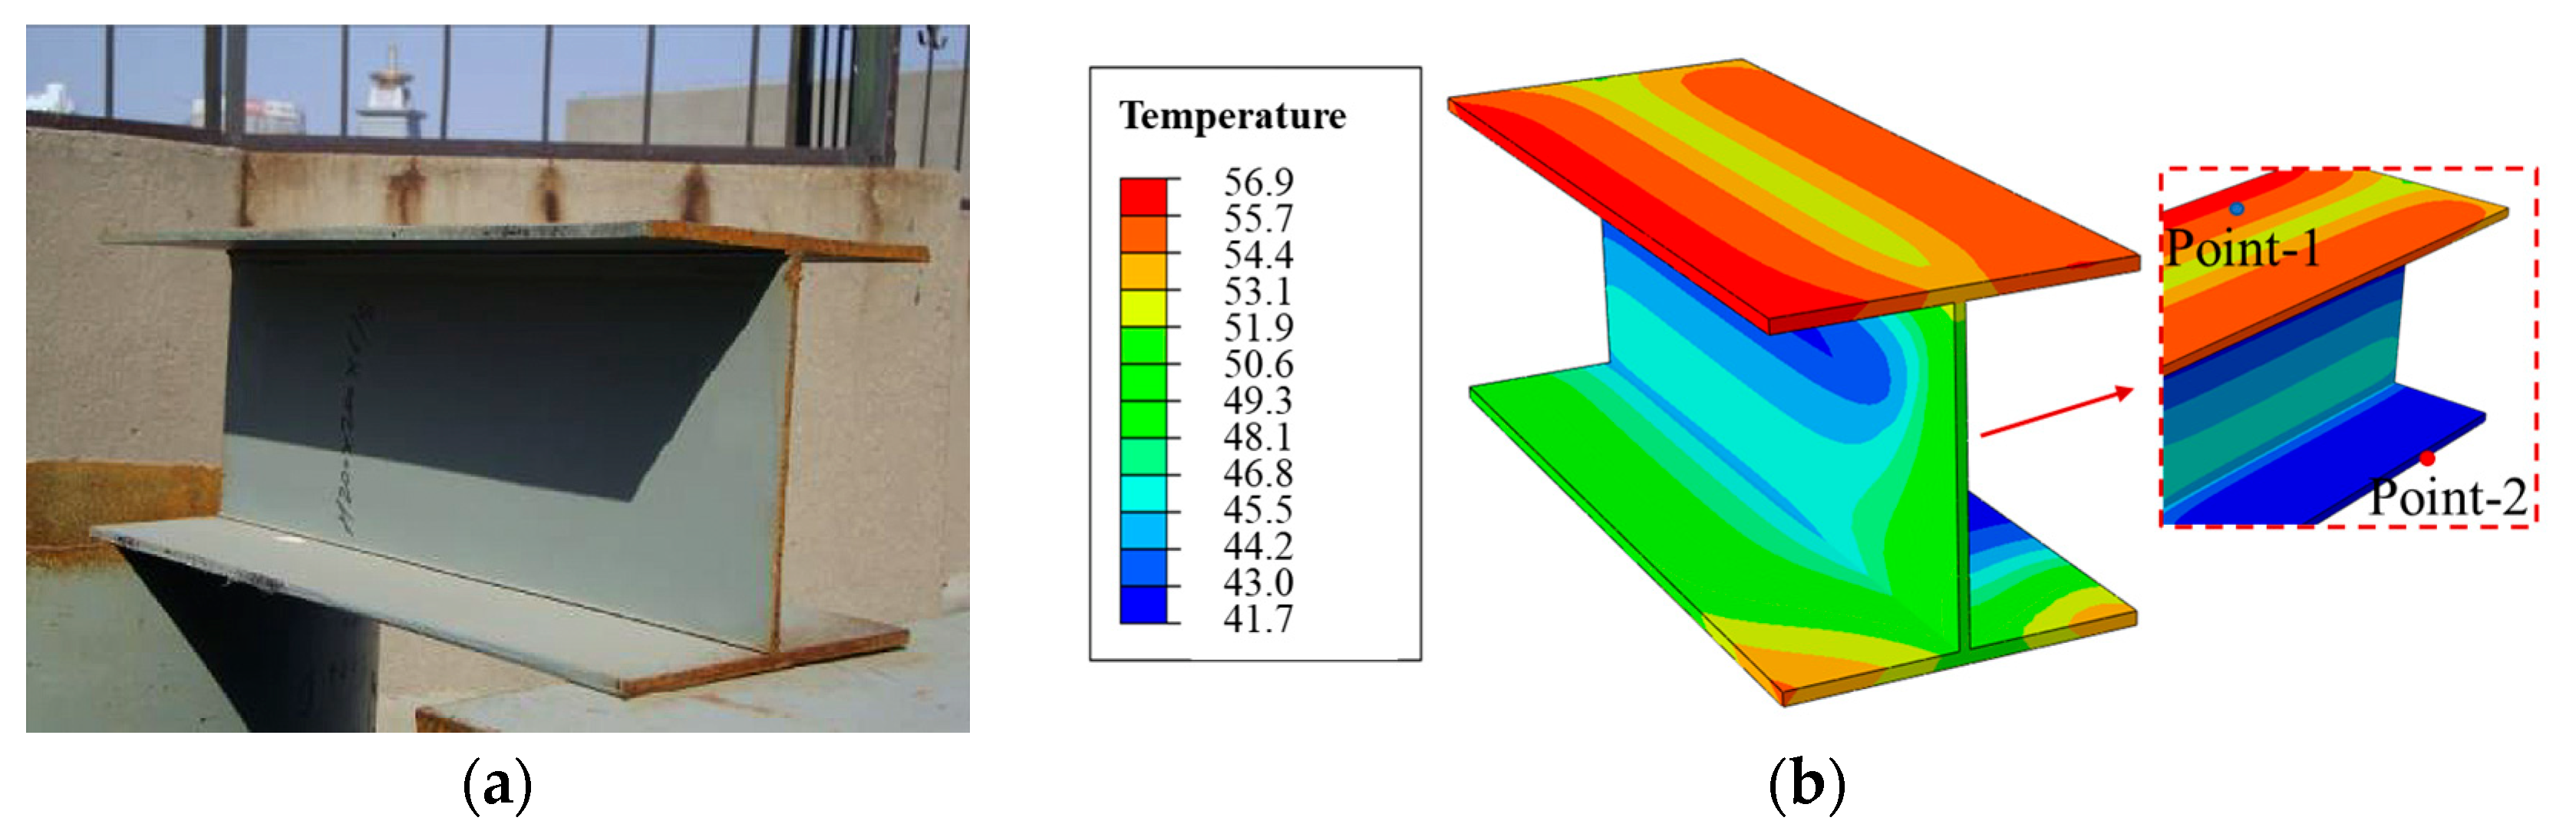
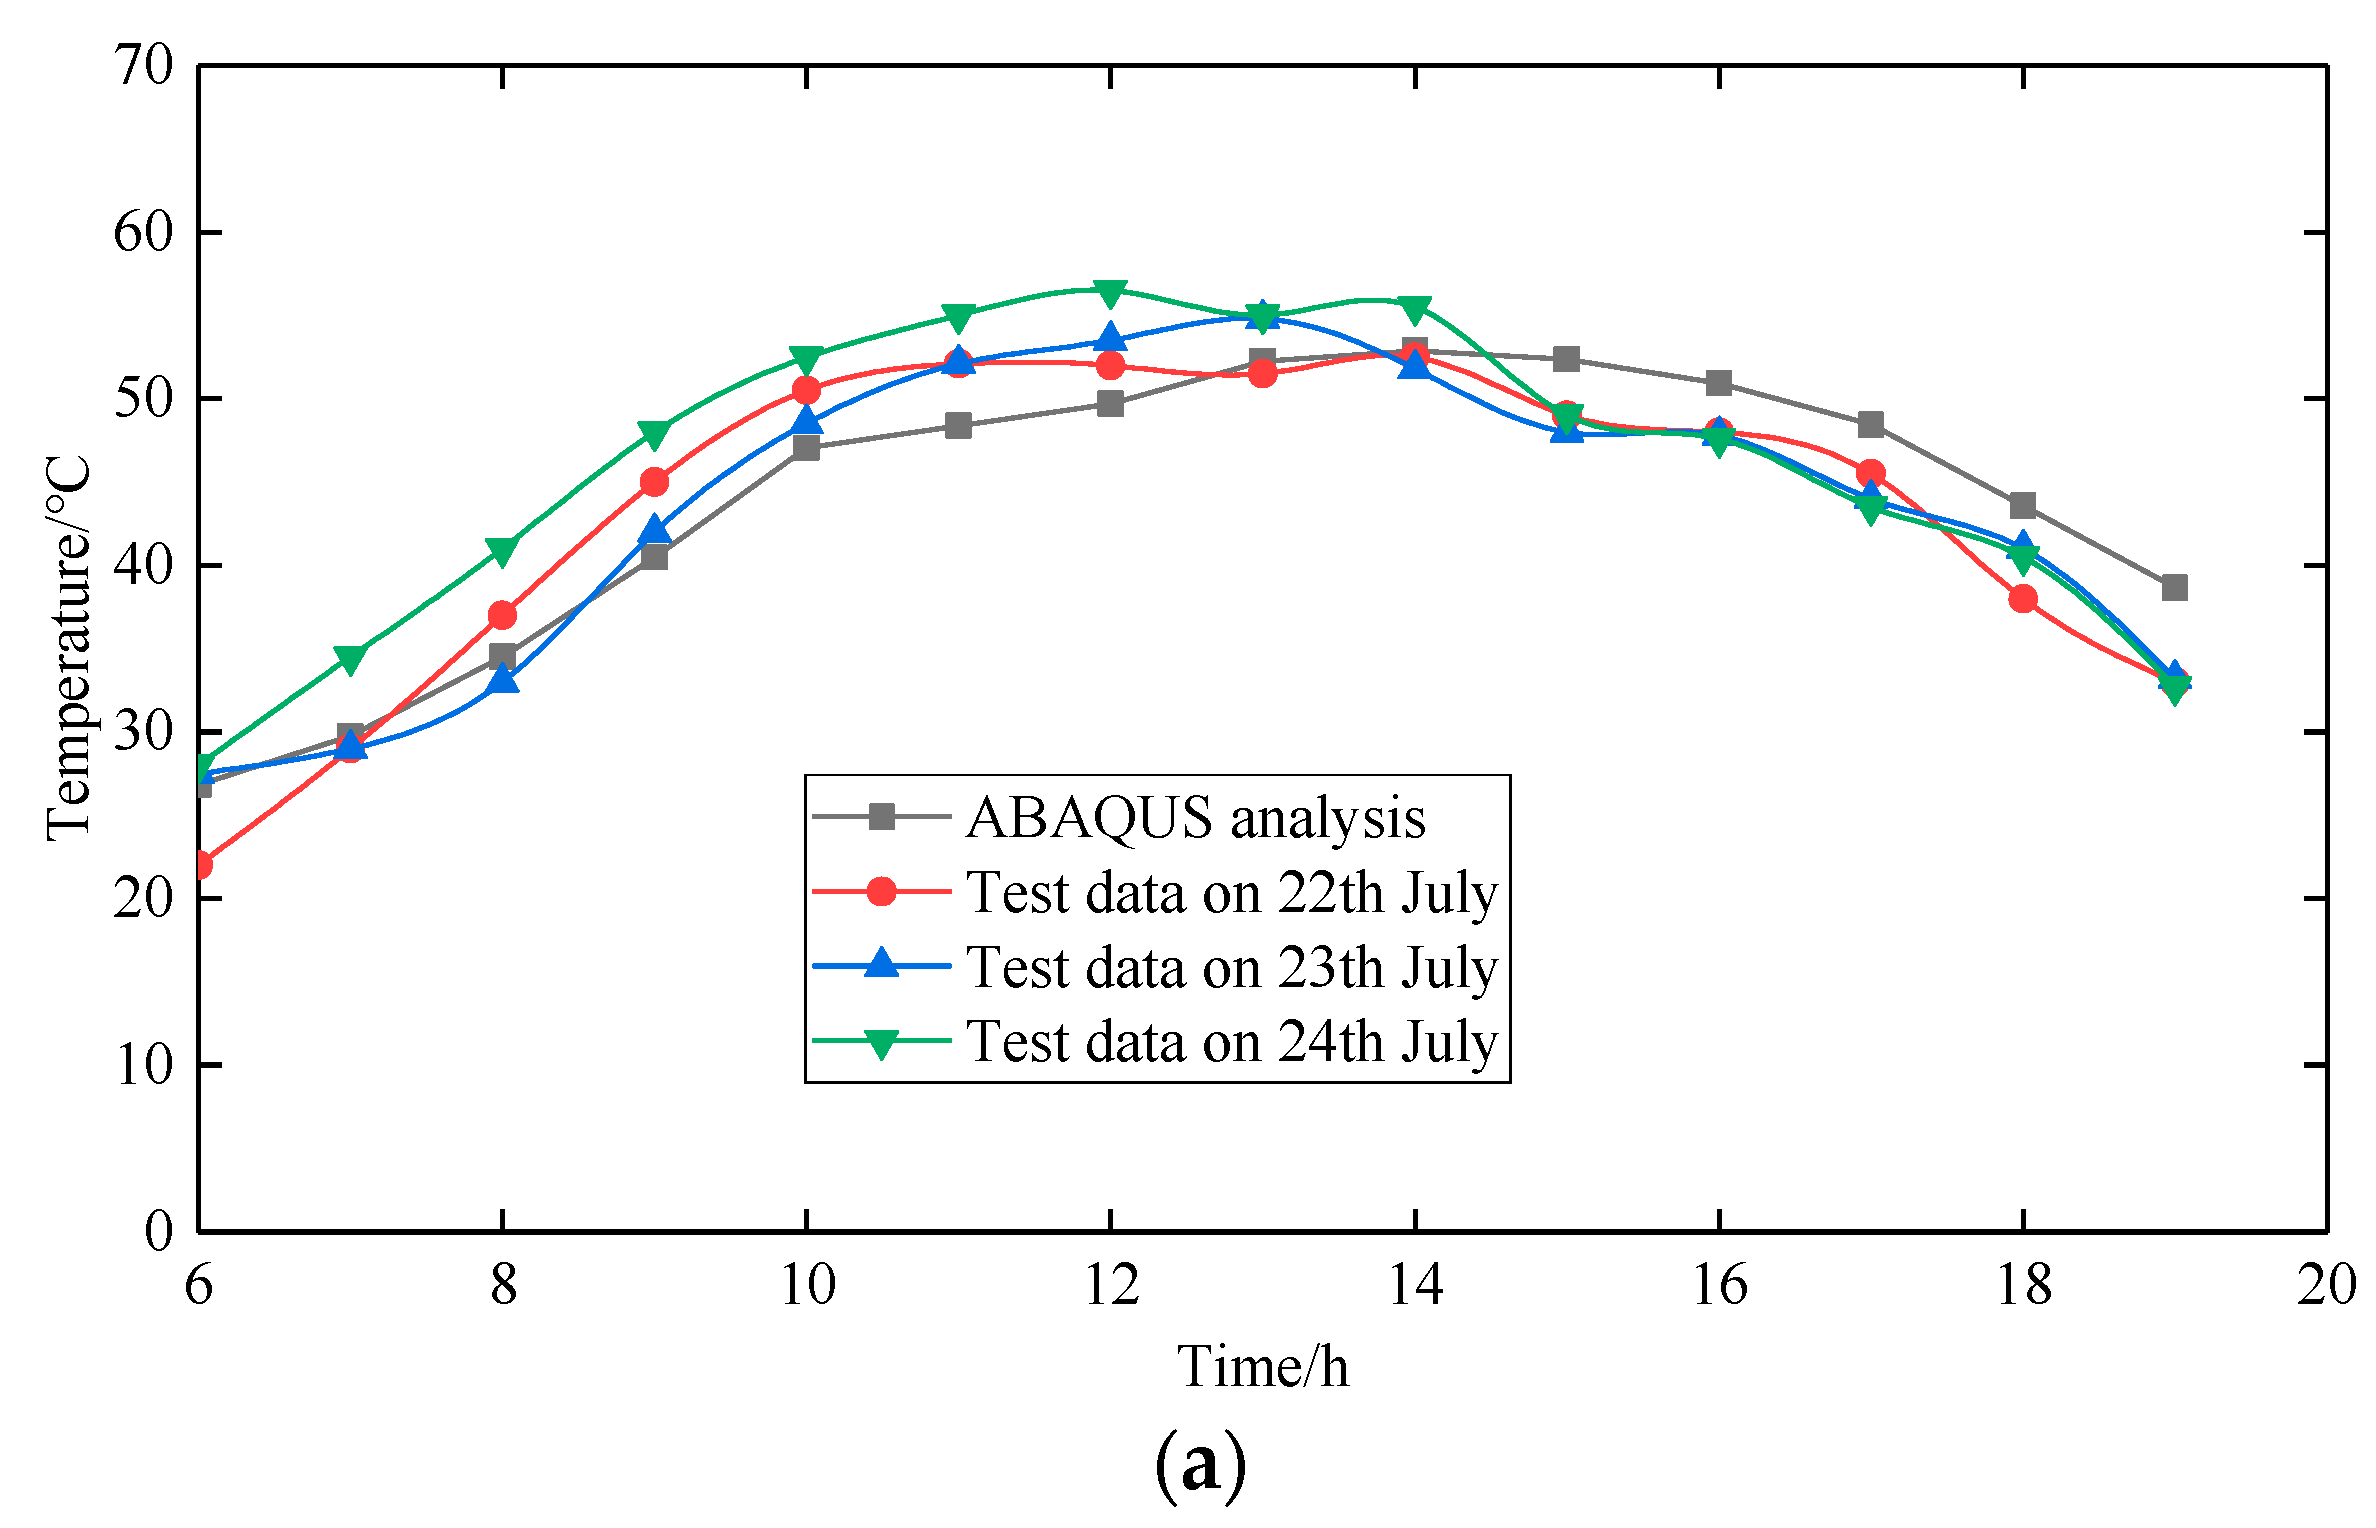
The solar temperature field of the bridge pylon will be affected by the shadow occlusion between components; it is necessary to accurately identify the sunshine shadow of the bridge structure before calculating the temperature field of the bridge pylon. The accuracy of the sunshine shadow distribution range is verified by comparison with actual sunshine shadow and the computational simulation of temperature field in 8:00 on 21 March and 22 June 2020, and then, the accuracy of the temperature of the simulation method in this paper is verified by the measured temperature field of H-shaped steel specimen on 22 July 2010 [28]; the verification results are shown in Figure 9, Figure 10 and Figure 11. It can be seen that the temperature cloud diagram of the bridge pylon is basically consistent with the actual sunshine shadow distribution, and the simulated values of the sunshine temperature field and the shadow side temperature field of the structure are consistent with the measured values. which indicates that the method adopted in this paper can realize the accurate simulation of the 3D solar temperature field of the complex structure.
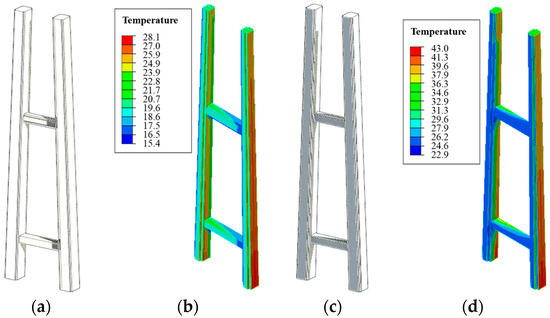
Figure 9.
Validation of 3D temperature field simulation: (a) Natural sunlight rendering in spring. (b) Calculated temperature field of pylon temperature in spring. (c) Natural sunlight rendering in summer. (d) Calculated temperature field of pylon temperature in summer.
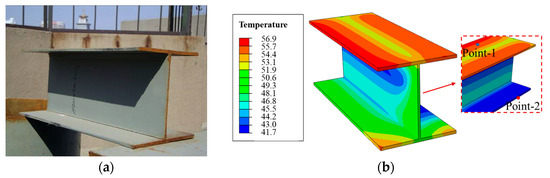
Figure 10.
Sunshine temperature field distribution verification: (a) H-shaped steel specimen [28]. (b) Results of temperature field numerical simulation results.
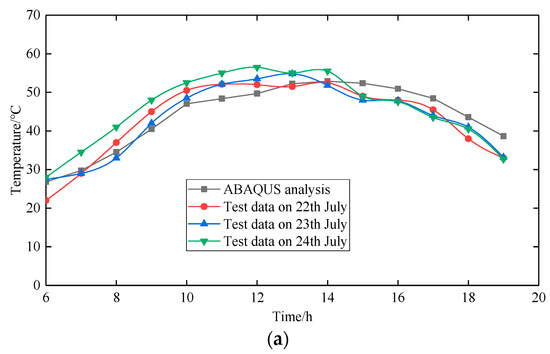
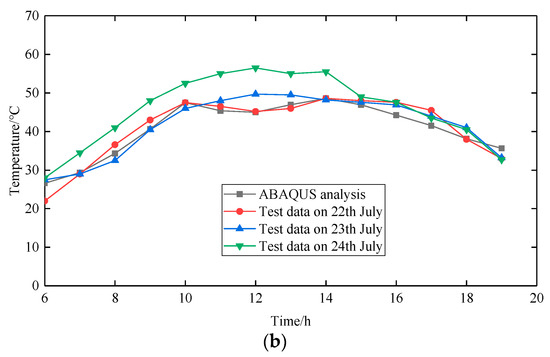
Figure 11.
Measured temperature curve [28] and calculated temperature curve of H-shaped steel sample. (a) Temperature curve of point-1. (b) Temperature curve of point-2.
4. Temperature Field of Bridge Pylon
4.1. Cross-Section Temperature Difference
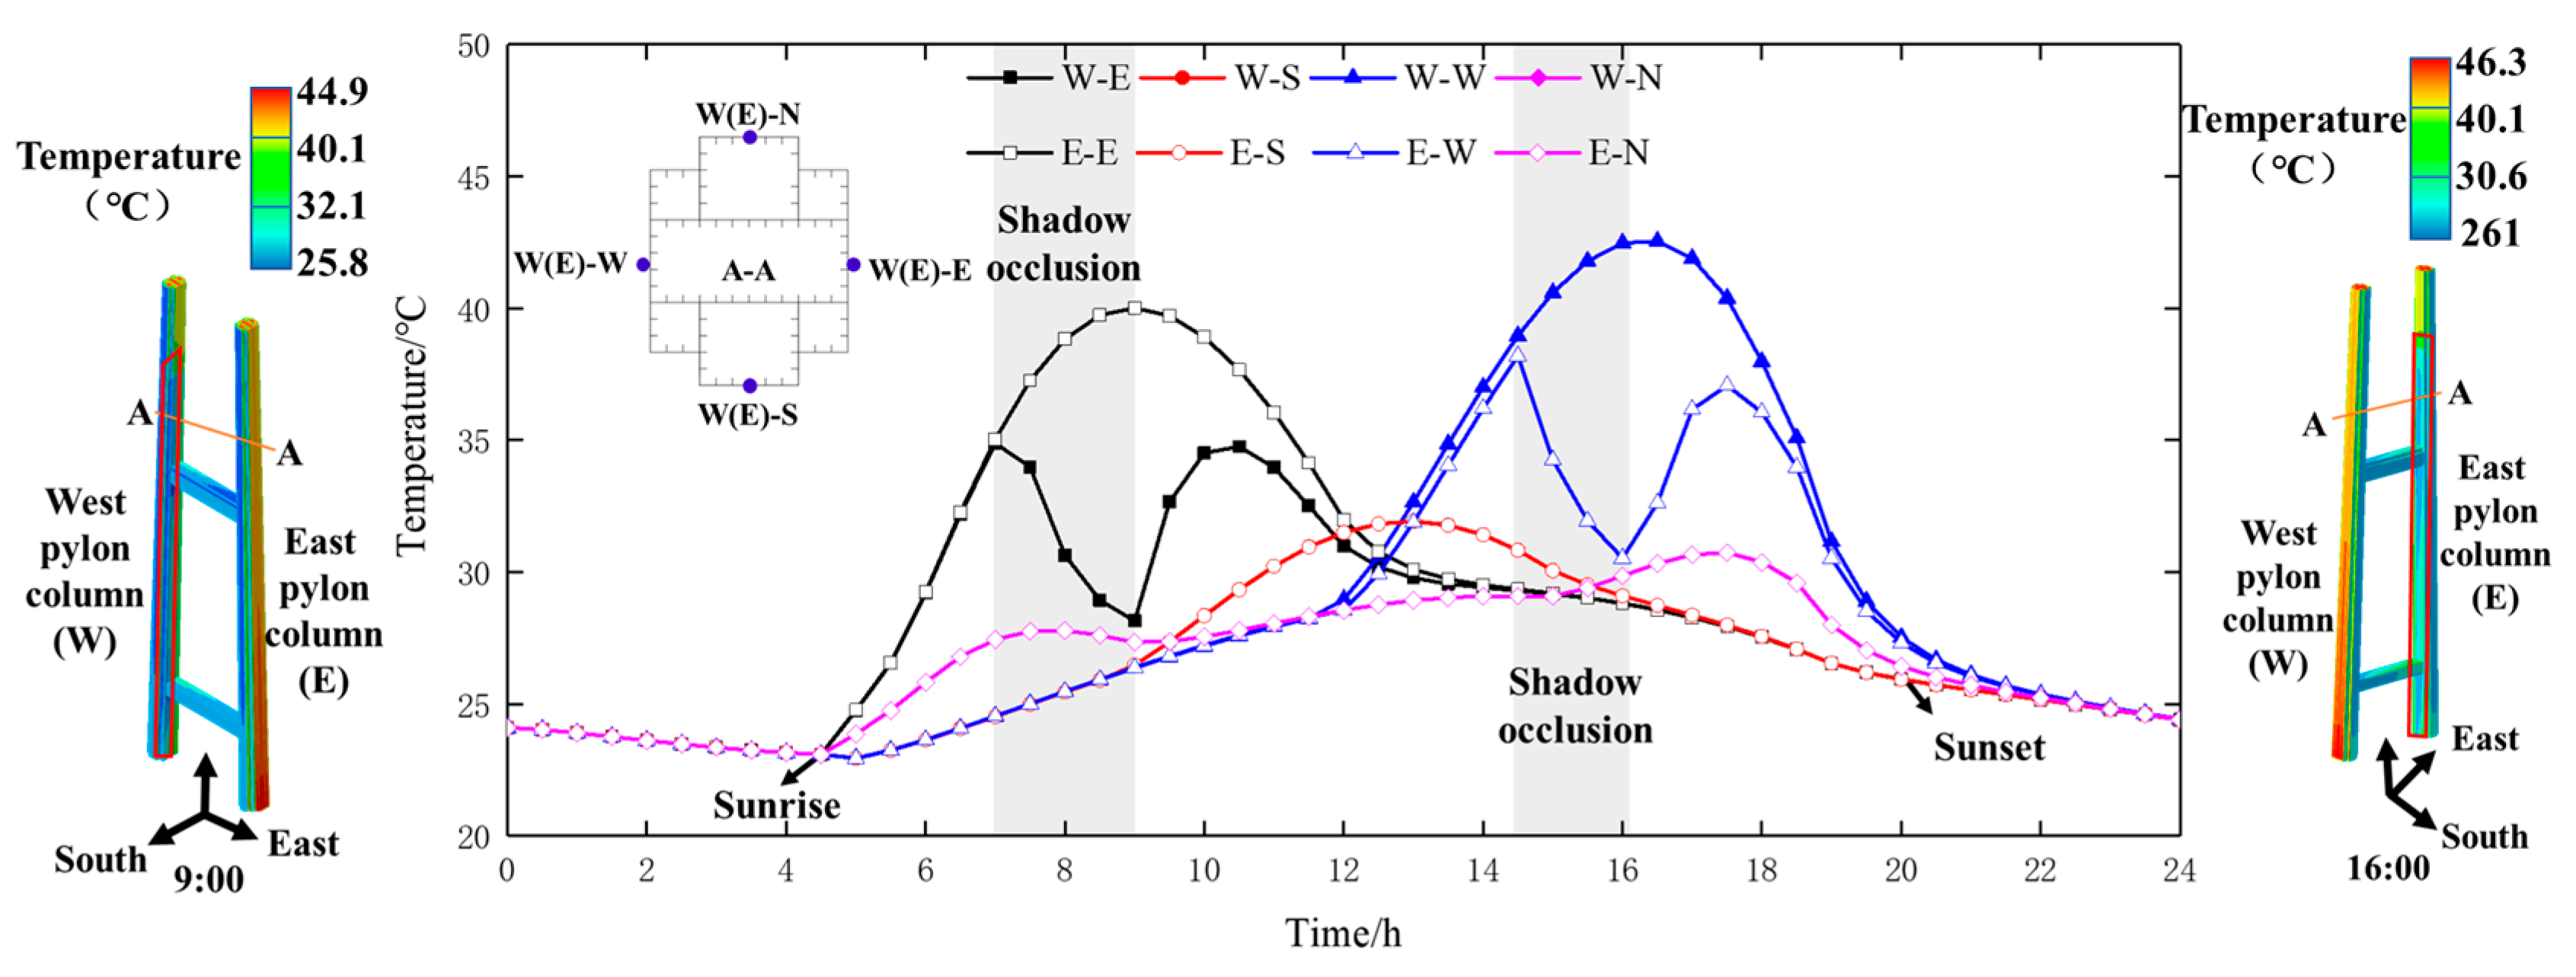
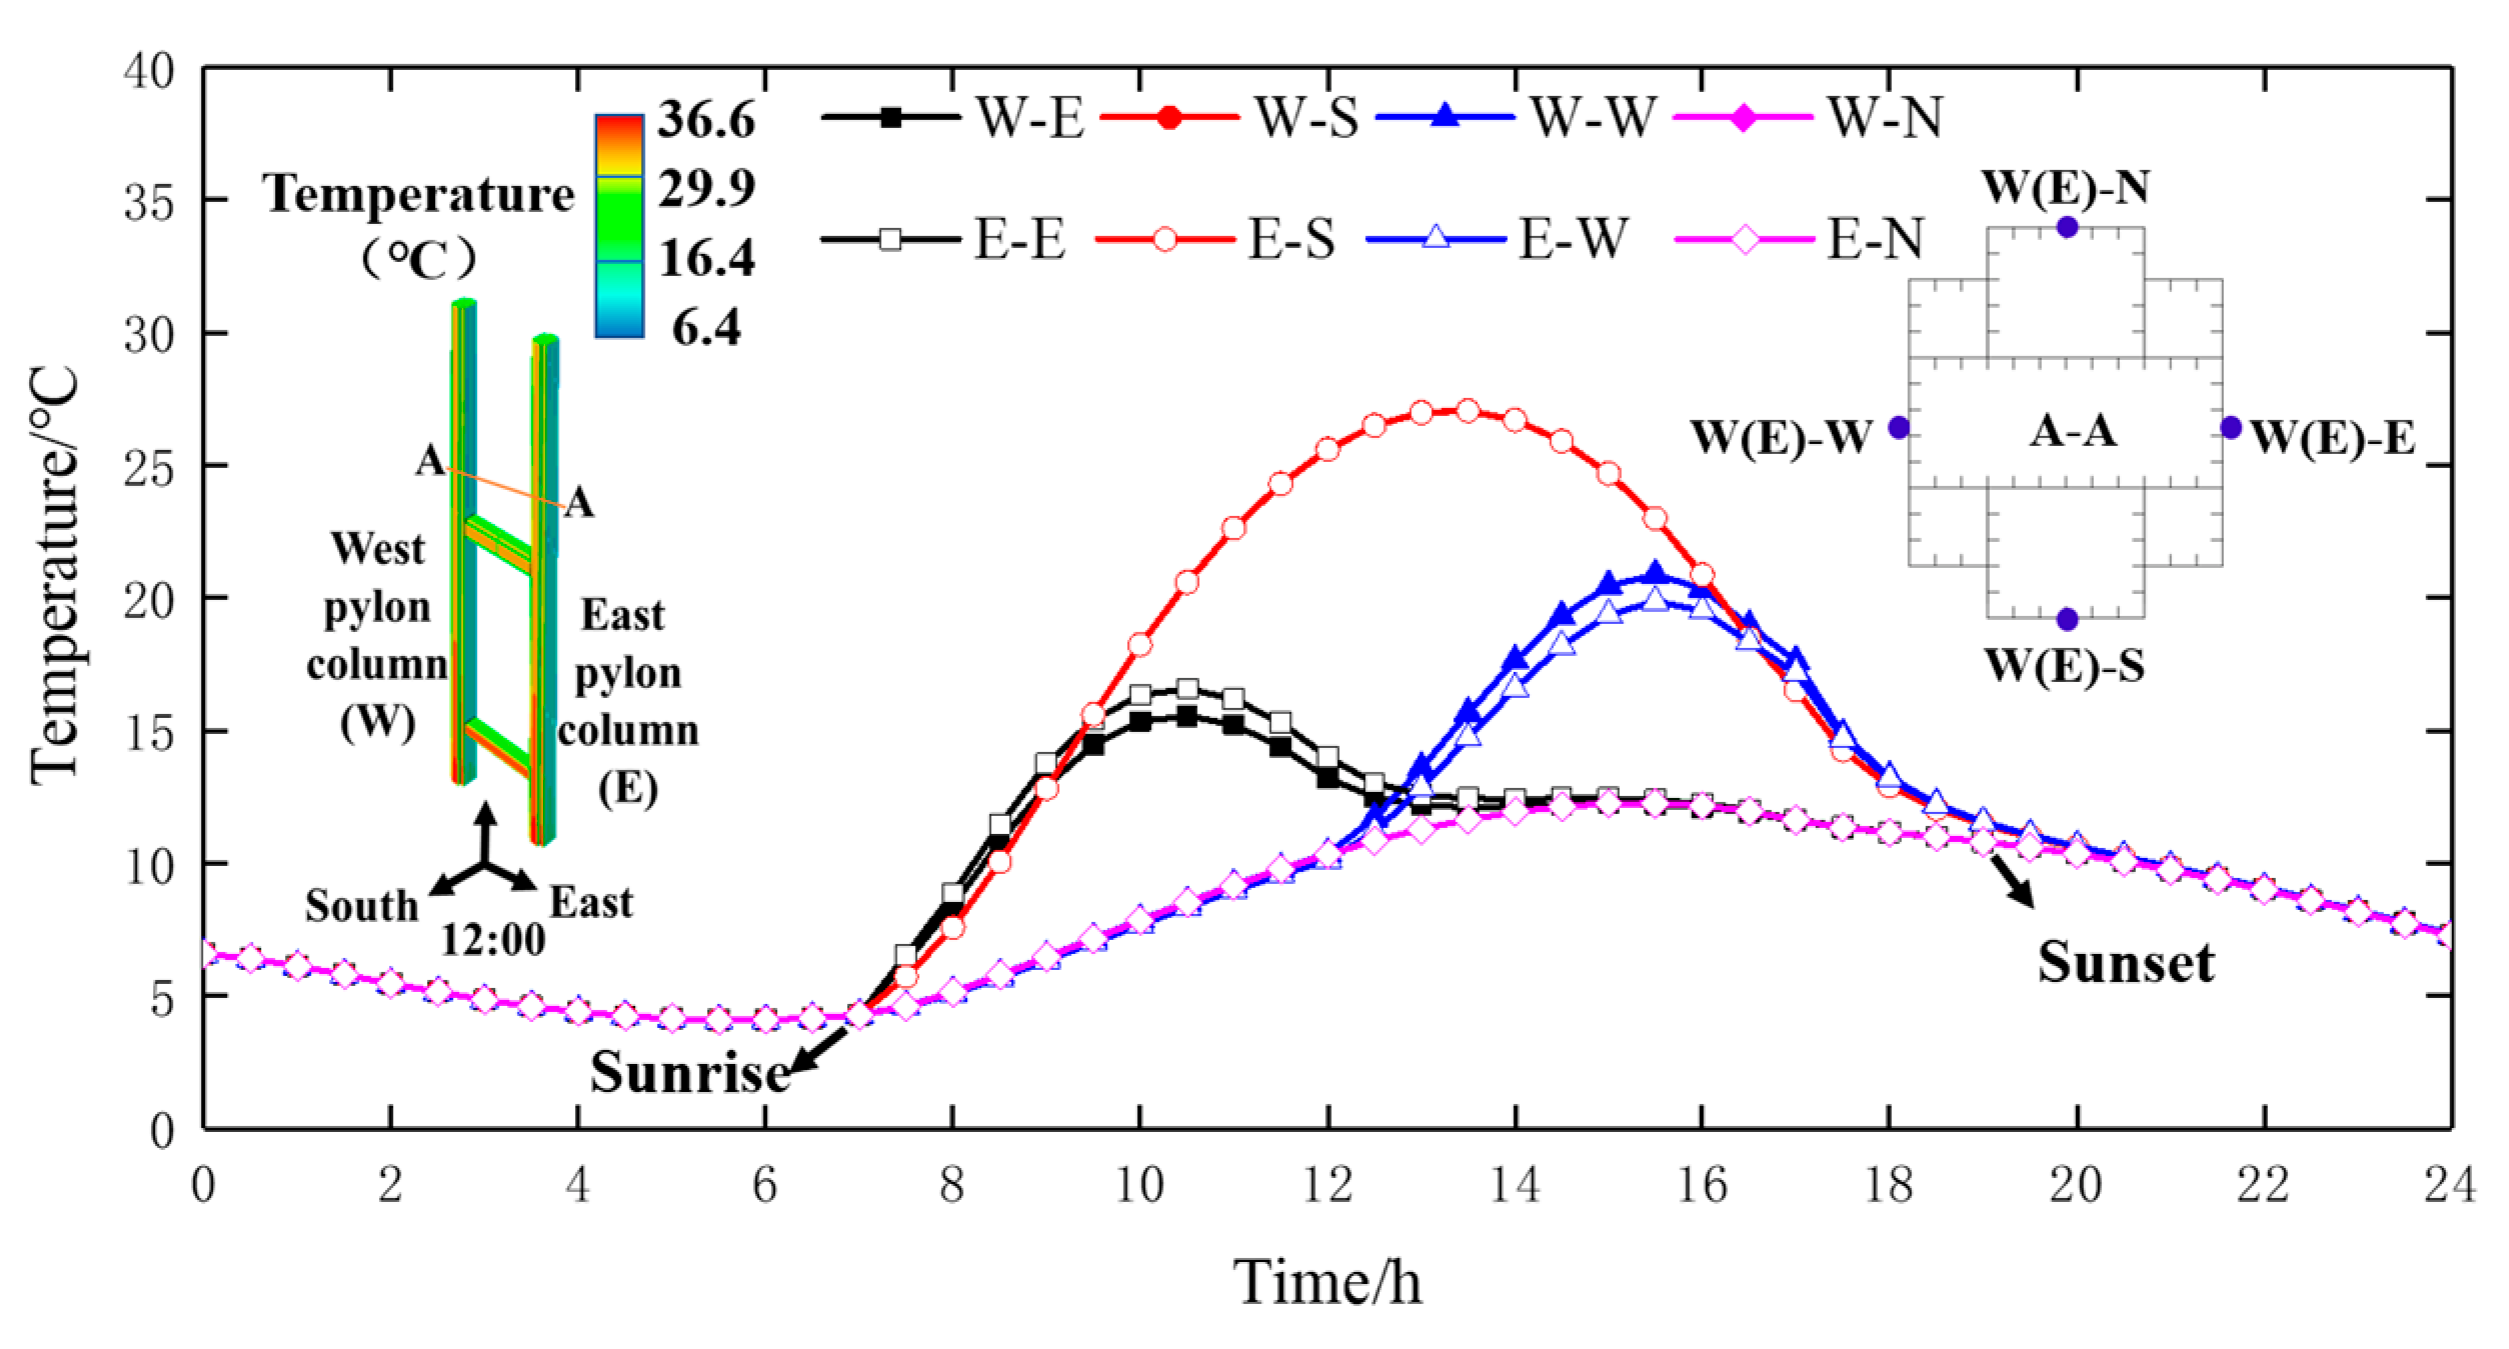
Figure 12, Figure 13 and Figure 14 show the temperature variations of the walls for different pylon columns at the cross-section A-A in four seasons, which shows that the meteorological conditions and calculation results are similar in spring and autumn; thus, only the calculation results in spring, summer, and winter are listed. In each season, the temperature changes are same for outer surfaces of pylon in the east, south, and west. After sunrise, the outer surfaces can reach the maximum temperature around 9:00, 13:00, and 16:00 for east, south, and west walls gradually, while the inner surfaces of the east and west walls are mainly affected by shading.
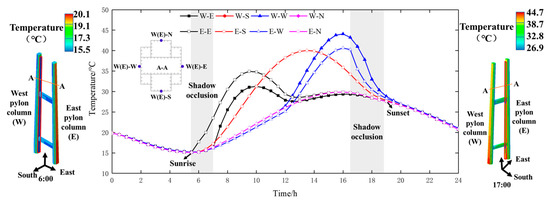
Figure 12.
Temperature Variation curve of cross-section A-A on bridge pylon in spring (autumn).
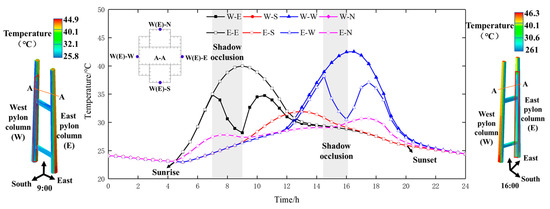
Figure 13.
Temperature variation curve of cross-section A-A on bridge pylon in summer.
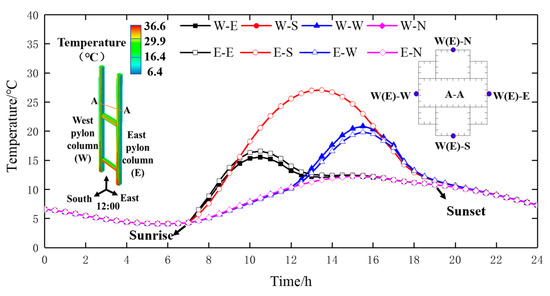
Figure 14.
Temperature variation curve of cross-section A-A on bridge pylon in winter.
From 5:30 to 7:00 in spring and autumn, the temperature rising time for the east wall of west pylon column lags behind the east wall of east pylon column because of the east pylon column shielding effect. At 9:00, the temperature differences between outer surfaces of pylon can reach 16 °C for east–west walls of the east pylon. After 16:00, the temperature for the west wall of east pylon column decreased sharply under the shelter of west pylon column. At 17:00, the maximum temperature difference reached 5.5 °C between the west wall of the east and west pylon column.
A large, significant influence of the sunshine shadow is shown on the temperature field of the east and west pylon column in summer. After considering the shadow effect, the pylon column shadow lasts longer, and the temperature of the occluded position decreases obviously. The temperature for the east wall of west pylon column showed a trend of increasing first and then decreasing under the shelter by the east pylon column from 7:00 to 9:00, and the temperature gradually increased from 9:00 to 10:30 with the shadow disappearing, and the temperature reductes after 10:30 because the direct solar radiation disappears; thus, two obvious peaks are formed in the figure. At 9:00, the temperature differences between outer surfaces of pylon can reach 14 °C for the east wall of east and west pylon column, while the temperature difference is only 1.5 °C for the east and west walls of the west pylon column under the influence of shade. From 14:30 to 16:00, the west wall of the east pylon column is sheltered by the west pylon column, and the temperature of the wallboard gradually decreased. After 16:00, the occlusion disappeared, and the temperature gradually increased; the temperature difference between outer surfaces of the east and west pylon column can reach 12 °C for the west walls.
In winter, there is no obvious occlusion between the east and west pylon column. Because the south walls of the bridge pylon are exposed to direct sunlight for a long time during the day, the maximum temperature achieves 31 °C at 13:00 noon, while the north walls are always in a self-shielding shadow, and the maximum temperature difference between outer surfaces of same pylon can reach 19 °C for north–south walls.
When there is no actual measurement data, the gradient temperature difference between the both sides of the pylon column can be taken as ±5 °C based on the procedure proposed by the Chinese Specification “JTG/T D65-05-2015 Specifications for Design of Highway Suspension Bridge” [29], but the gradient temperature difference on both sides of the steel tower is not specified. The surface temperature curve of bridge pylon under typical meteorological conditions shows that the maximum temperature differences between outer surfaces of the same pylon can reach 16 °C for east–west walls in spring and autumn and can reach 19 °C for north–south walls in winter, both of which exceed the recommended value of Chinese Specification.
4.2. Vertical Temperature Distribution
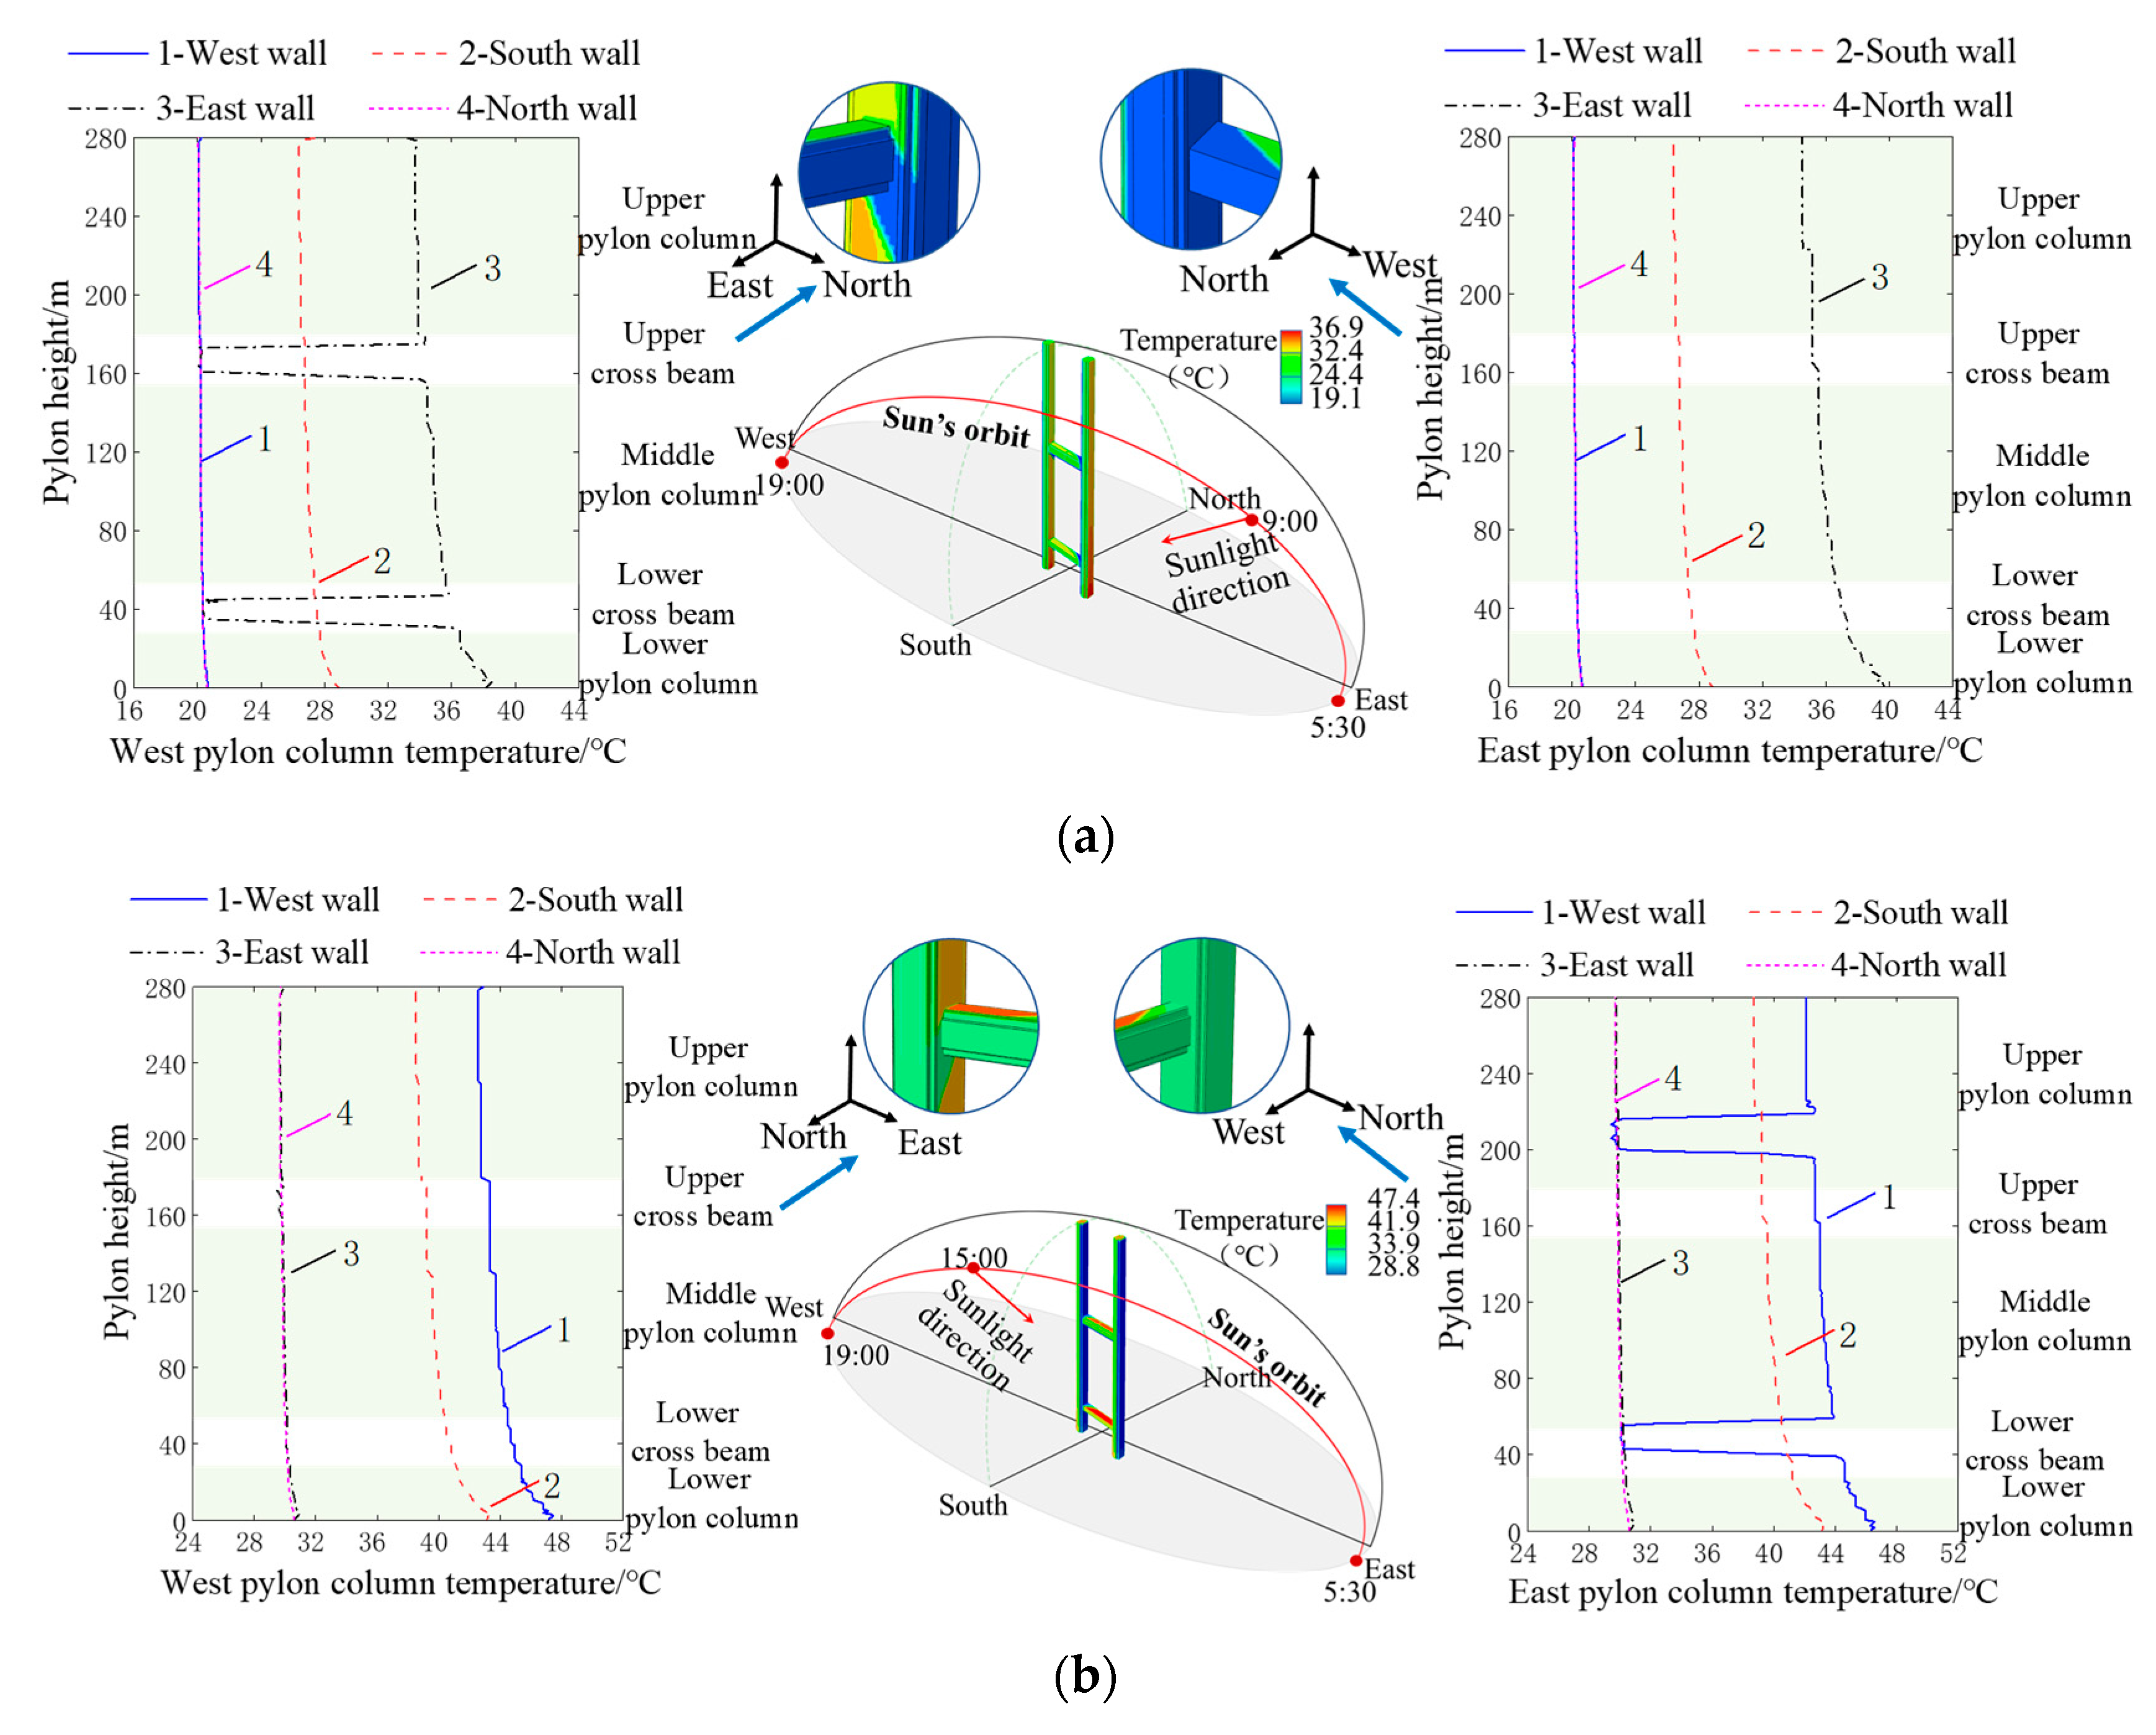
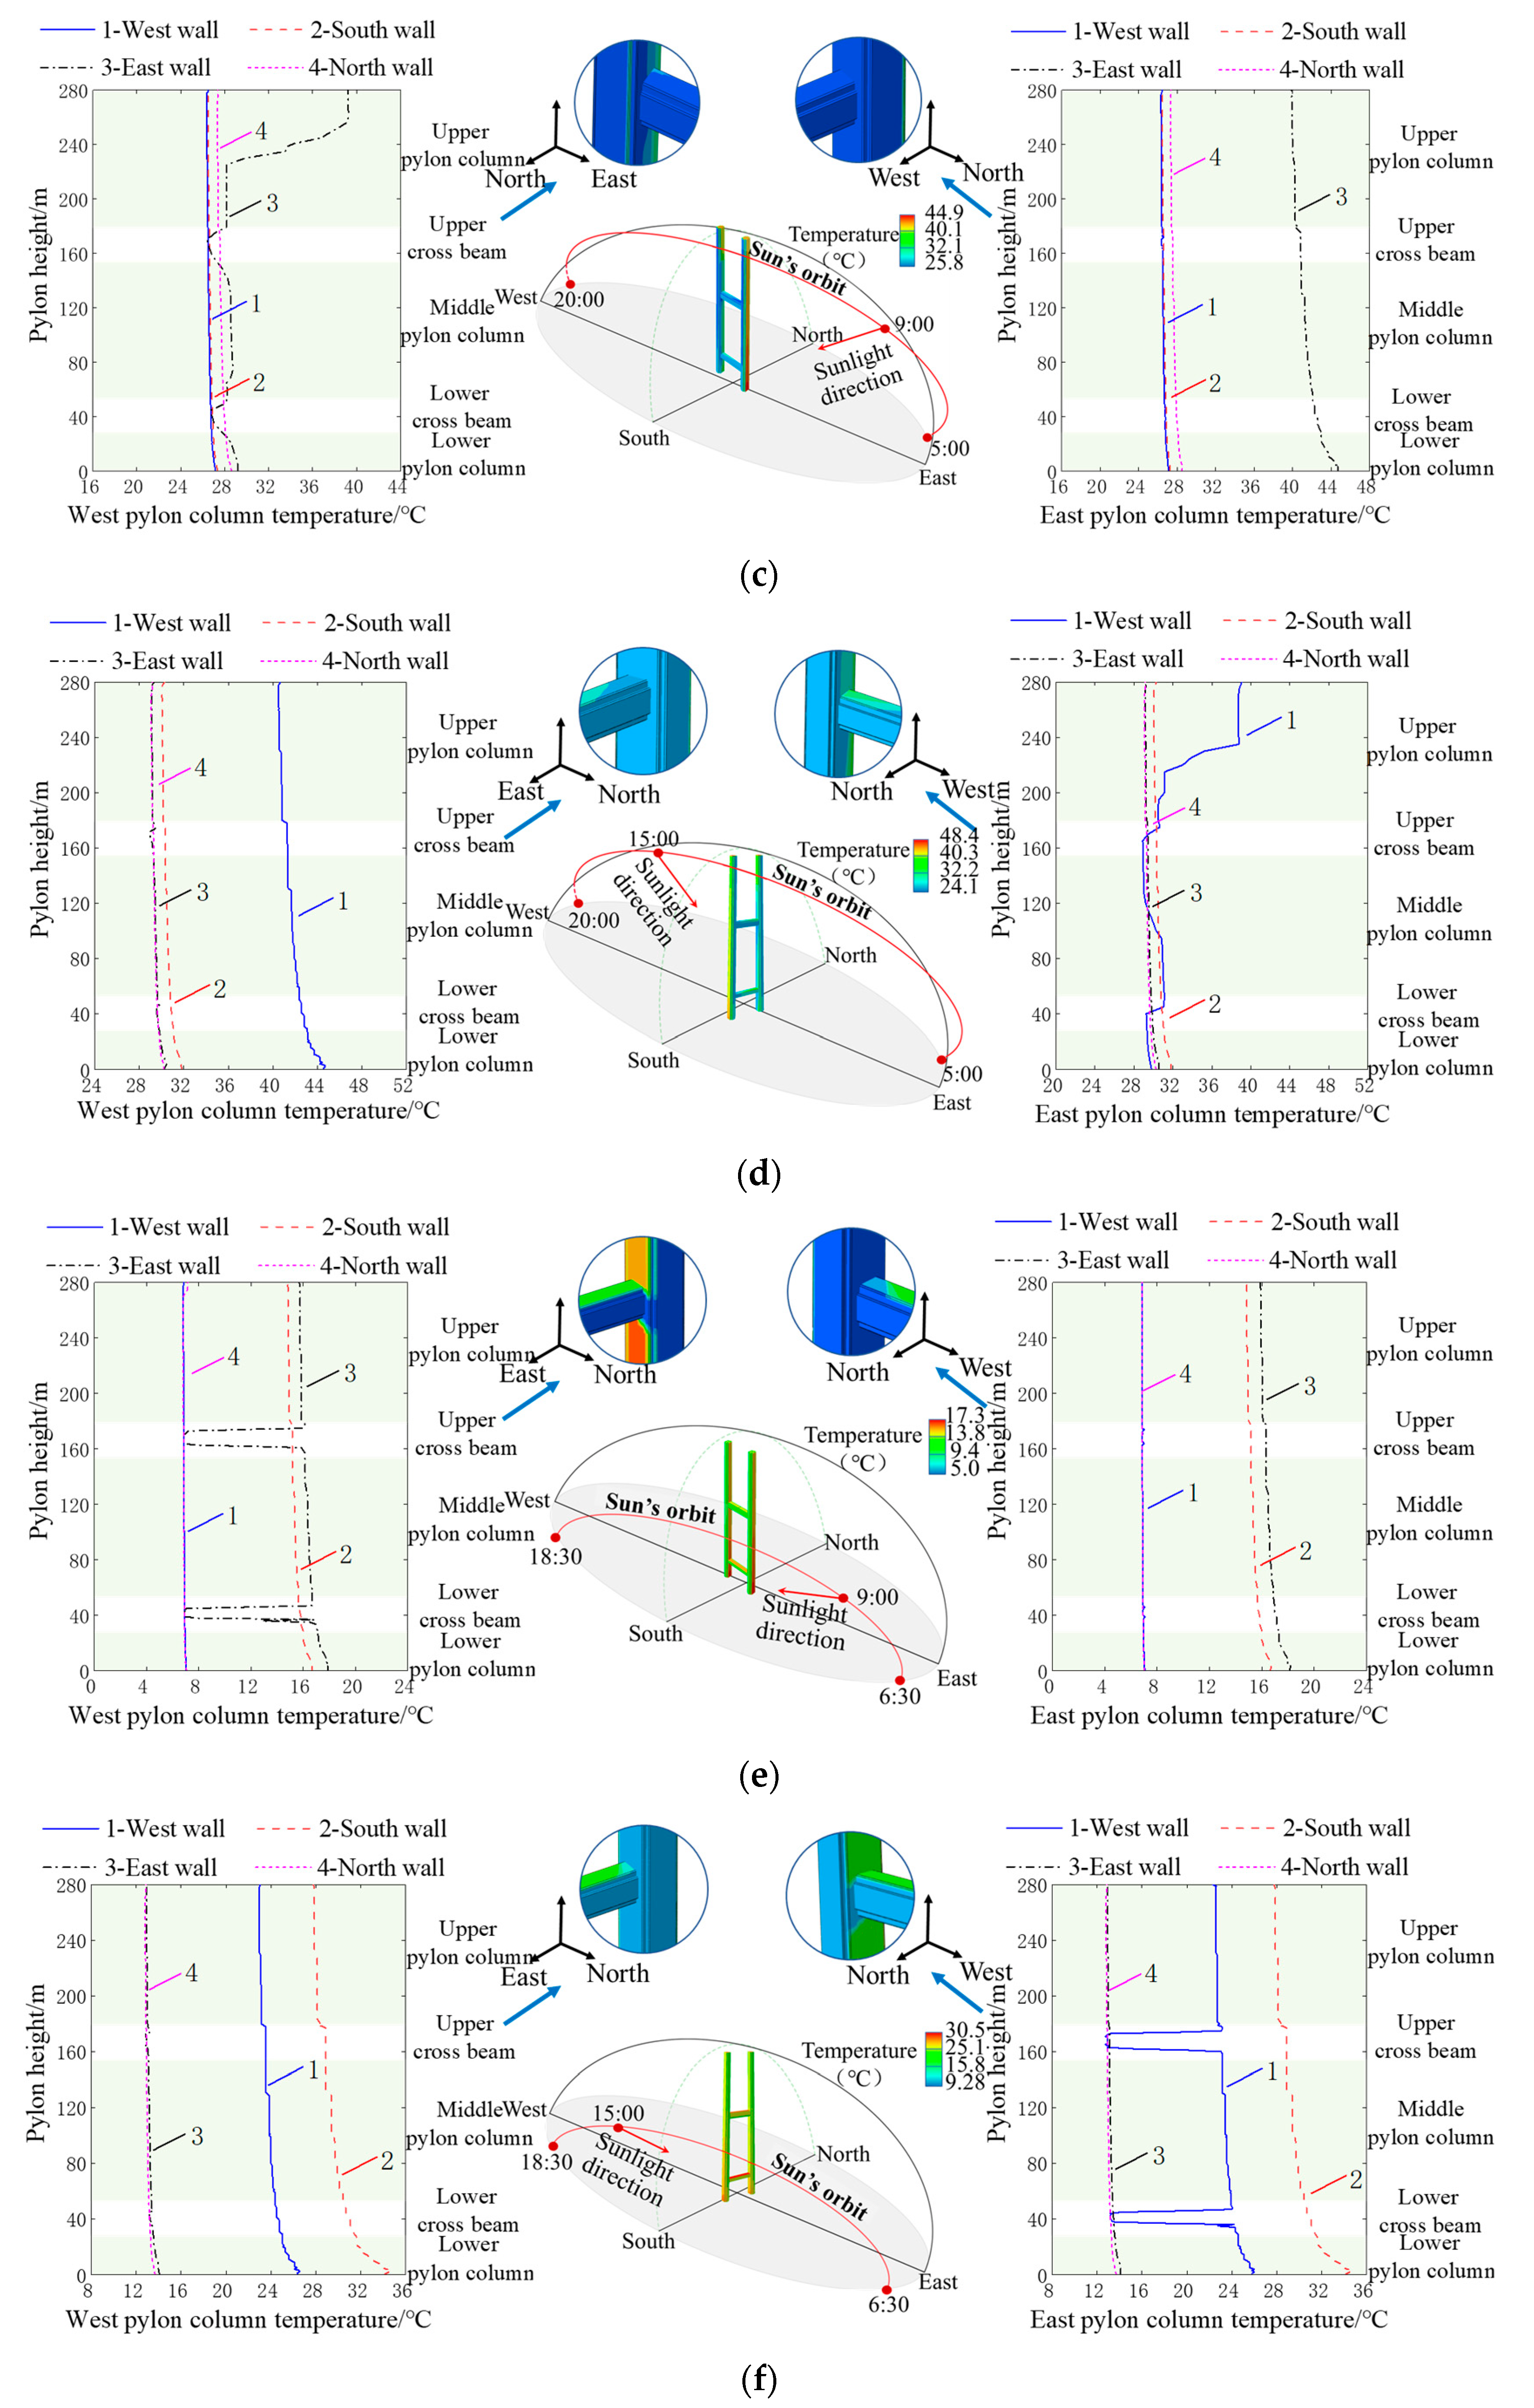
Figure 15 shows the vertical temperature distribution of east, west, south, and north walls for the two pylon columns at 9:00 and 15:00 when the temperature effect is most significant. After the modification of convective coefficient of the outer surfaces with different wind speed at different pylon height, the temperature gradually decreases from the top to bottom of the pylon. The vertical temperature changes in spring, autumn, and winter are similar, and the convective coefficient has significant effect on outer surfaces temperature for east, north, and west walls with high temperature under direct sunlight; in spring and autumn, the temperature gradually decreases from the top to bottom of the pylon for east–west walls with a temperature difference of 4 °C, while the temperature difference can reach 8 °C for south wall in winter. The temperature change is not obvious for north walls at different pylon height because the temperature of the outer surfaces only affected by ambient temperature under the influence of self-shadow shielding. Large significant influence of sunshine shadow is shown on the temperature field of east and west pylon columns in summer; the east wall of the west pylon column and the west wall of the east pylon column are sheltered by another pylon column, respectively, at 9:00 and 15:00. Influenced by this, in the height of 0~210 m, the walls are in a shadow occlusion state, and after considering the convective coefficient of the outer surfaces at different pylon height, the temperature gradually decreases from the top to bottom of the pylon; in the height of 210~280 m, the temperature of the walls heat up rapidly under the influence of direct solar radiation, and the maximum temperature difference can reach 12 °C between adjacent sunshiny and shaded areas.
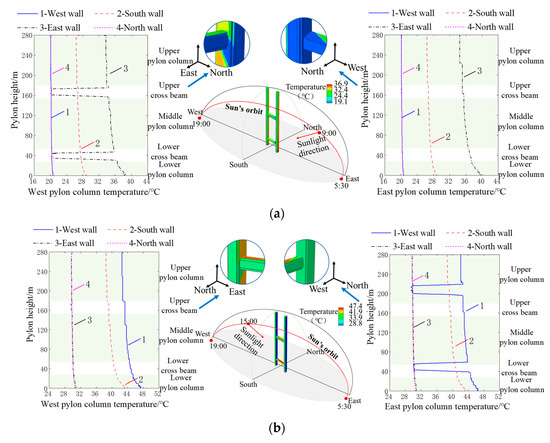
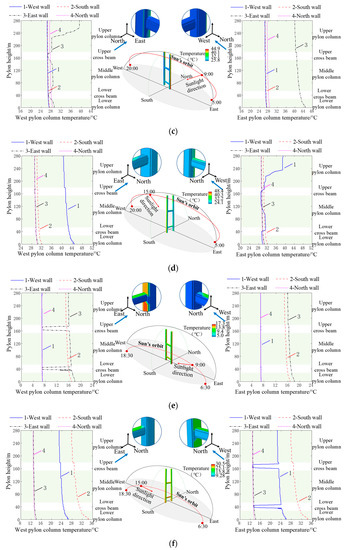
Figure 15.
Vertical temperature distribution of bridge pylon: (a) Spring (Autumn)-9:00. (b) Spring (Autumn)-15:00. (c) Summer-9:00. (d) Summer-15:00. (e) Winter-9:00. (f) Winter-15:00.
5. Temperature Effect of Bridge Pylon
5.1. Thermal Stress
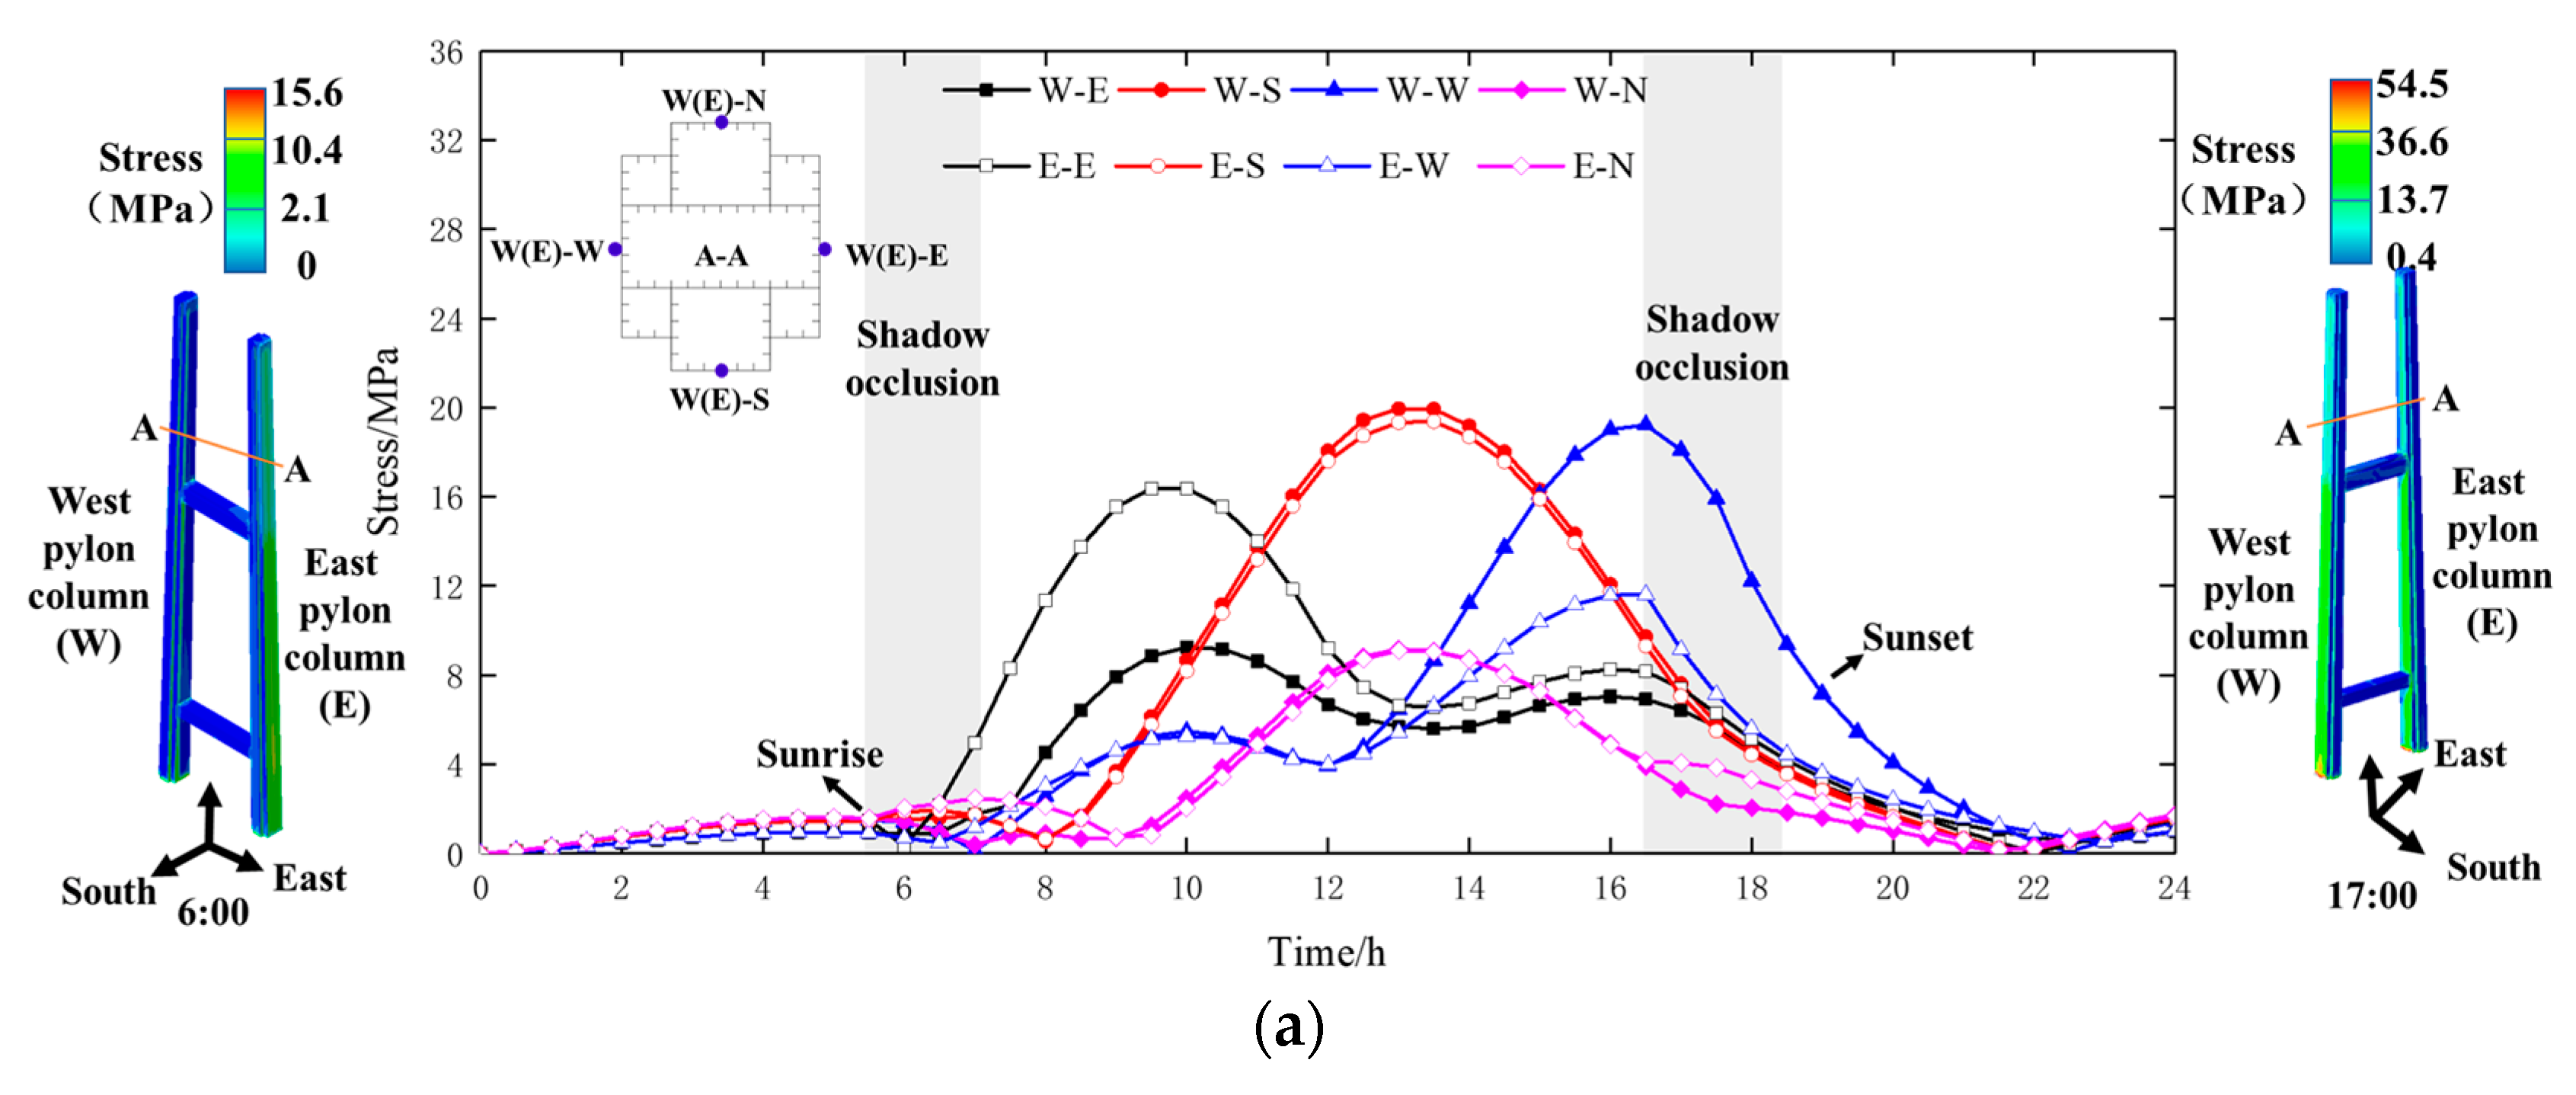
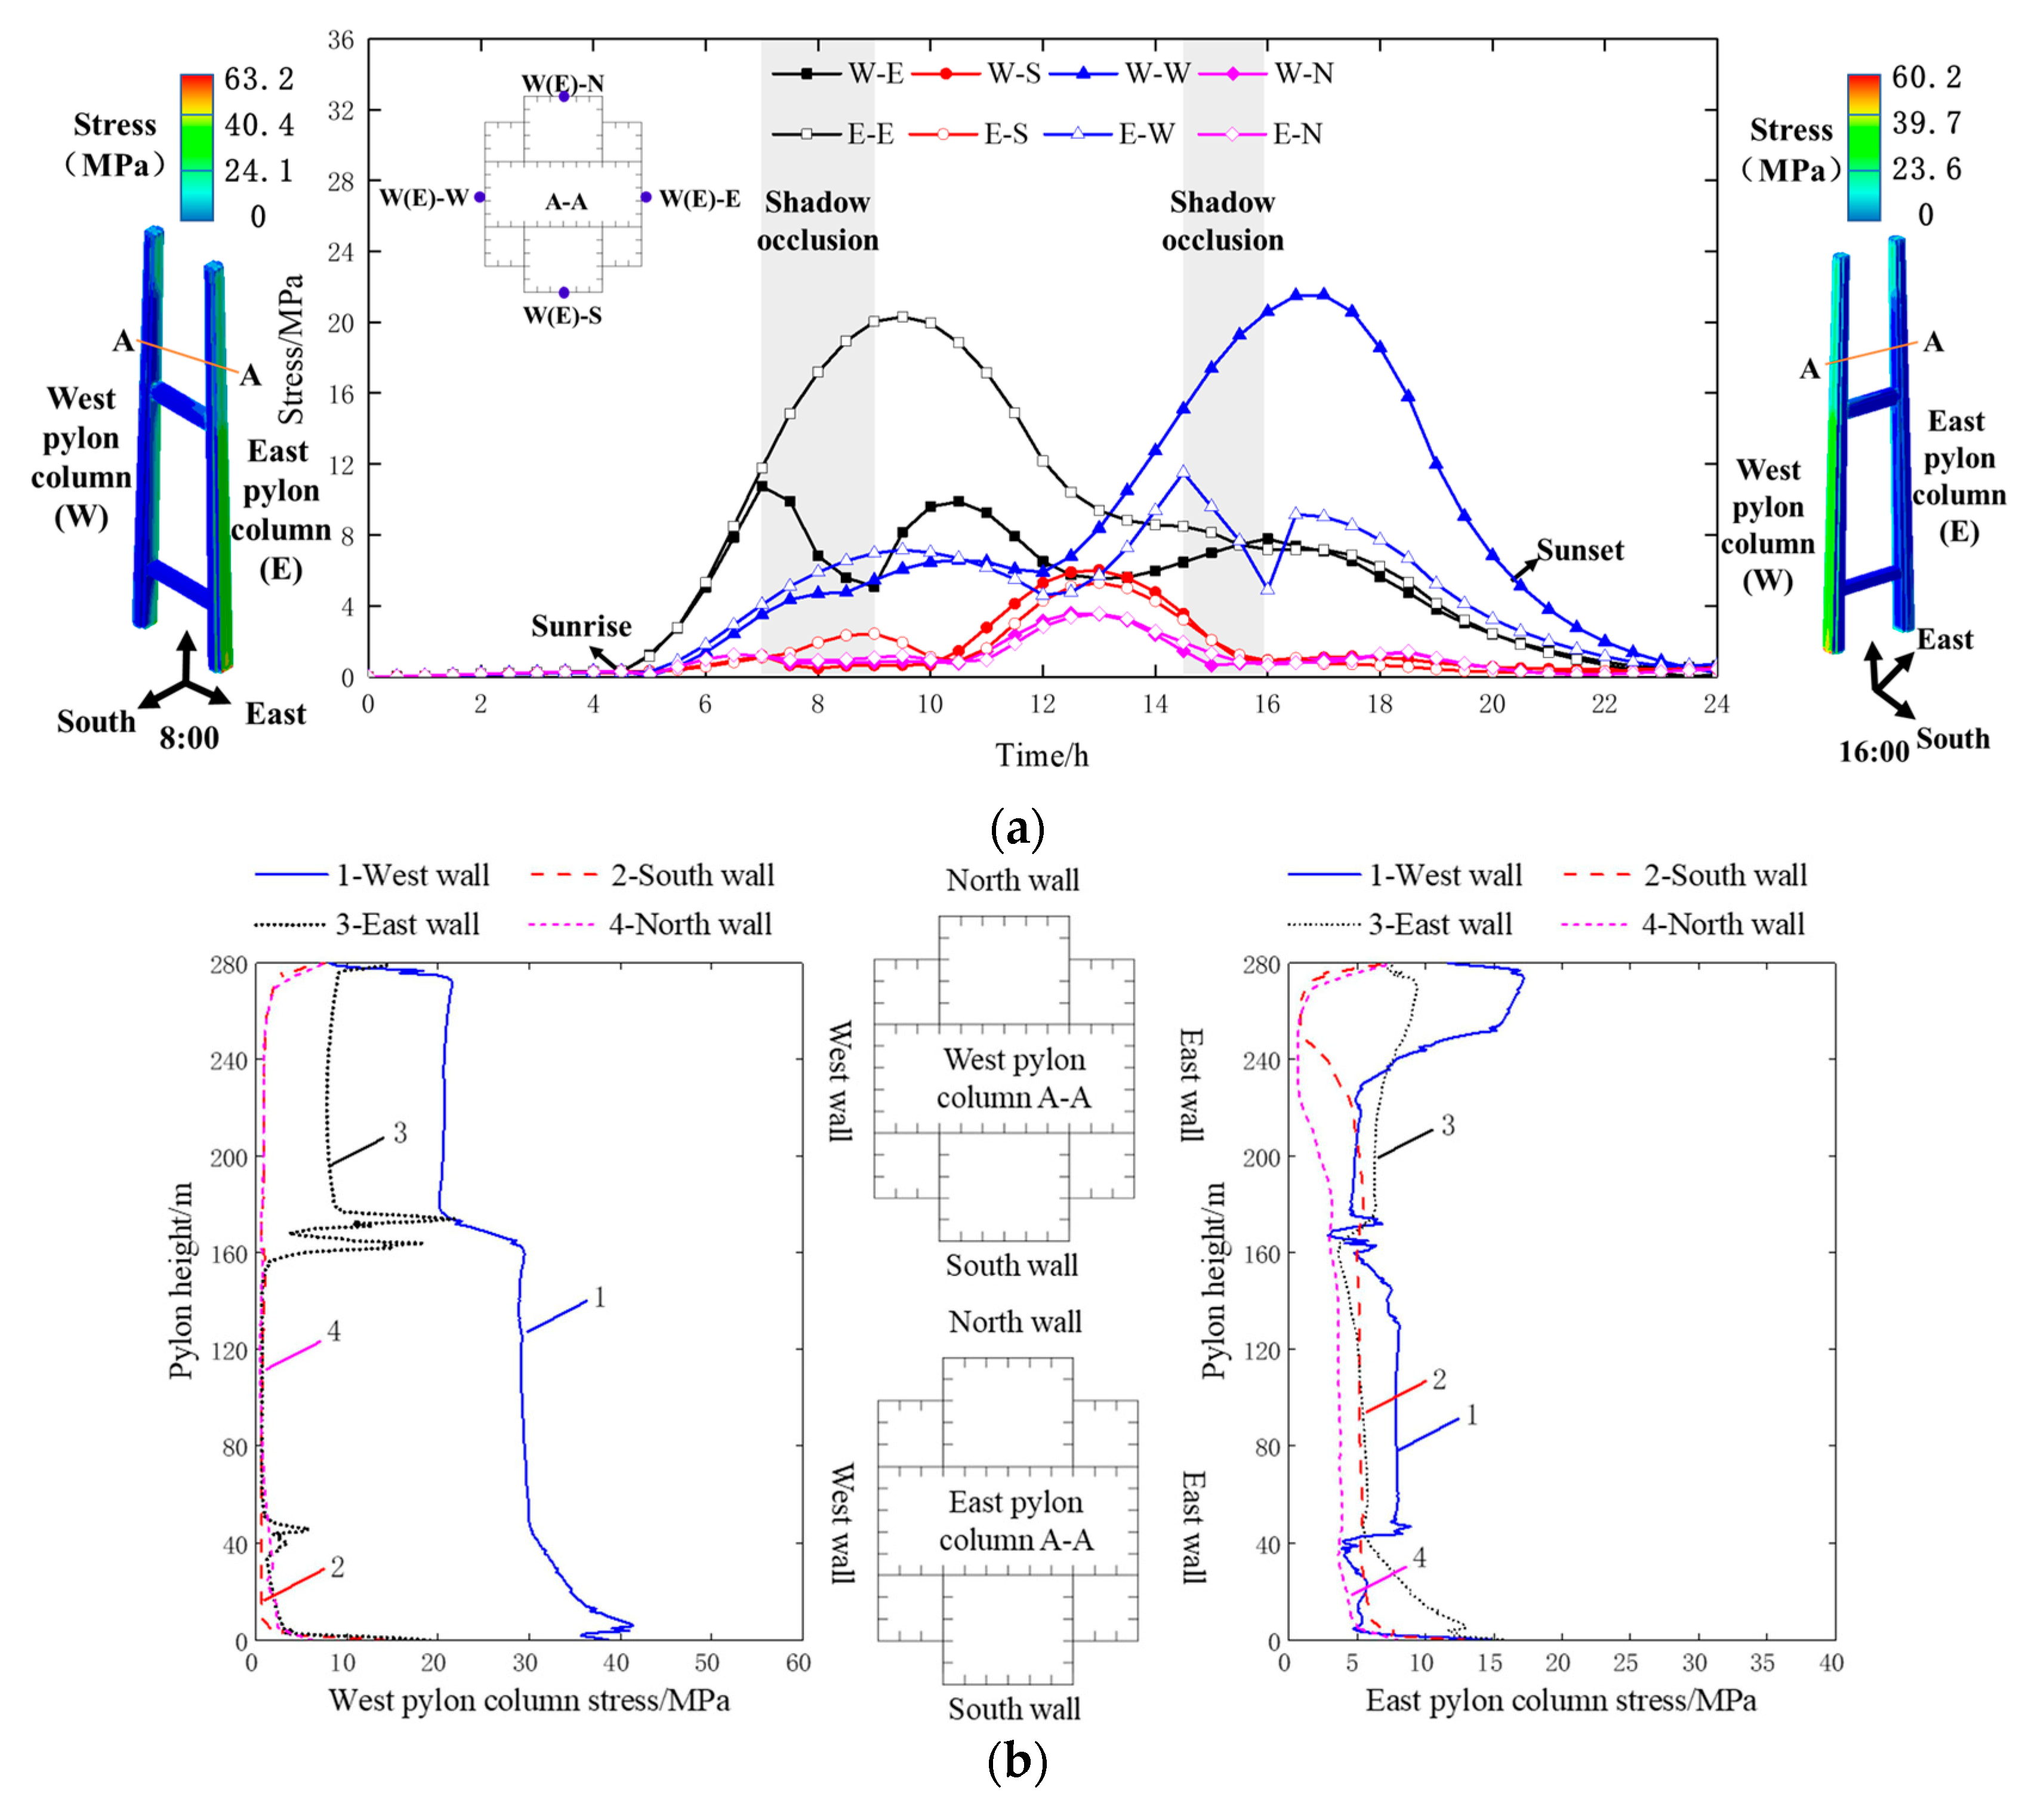
The thermal stress variations of the bridge pylon are shown in Figure 16, Figure 17 and Figure 18. The thermal stresses of each pylon walls are mainly related to the total amount of solar radiation received. The thermal stress distribution of different pylon walls on cross-section A-A is show in Figure 16a. In spring and autumn, the maximum thermal stress are south walls, and the stress can reach 20 MPa at 13:00. There is a certain stress difference between the east and west pylon columns under the influence of mutual shielding effect, and the maximum thermal stress difference can reach 8 MPa for east walls at 10:00 and for west walls at 16:00. Figure 16b shows the vertical stress distribution of the bridge pylon at 16:00 in spring and autumn. The mutual shielding effect between the pylon columns has little effect on the thermal stress. The stress drops sharply at the beam because the back of the cross beam is completely in the self-shadowing areas. Significant mutation of thermal stress exists in the shaded area of the cross beam, and the maximum thermal stress for the west wall of east pylon column can be reduced by 18 MPa compared with the adjacent sunshiny area.
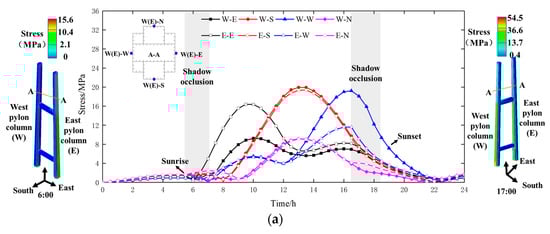
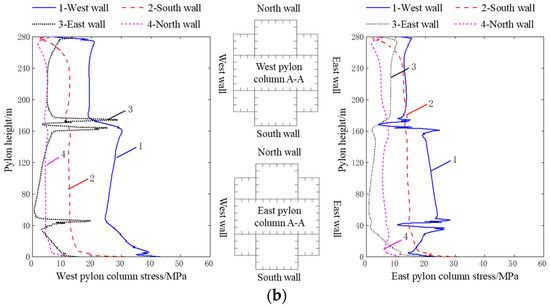
Figure 16.
Stress curve of pylon in spring (autumn): (a) Thermal stress curve of cross-section A-A. (b) Vertical stress distribution of bridge pylon at 16:00.
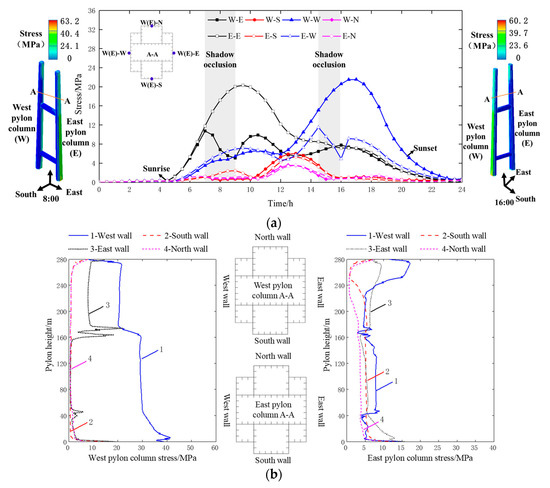
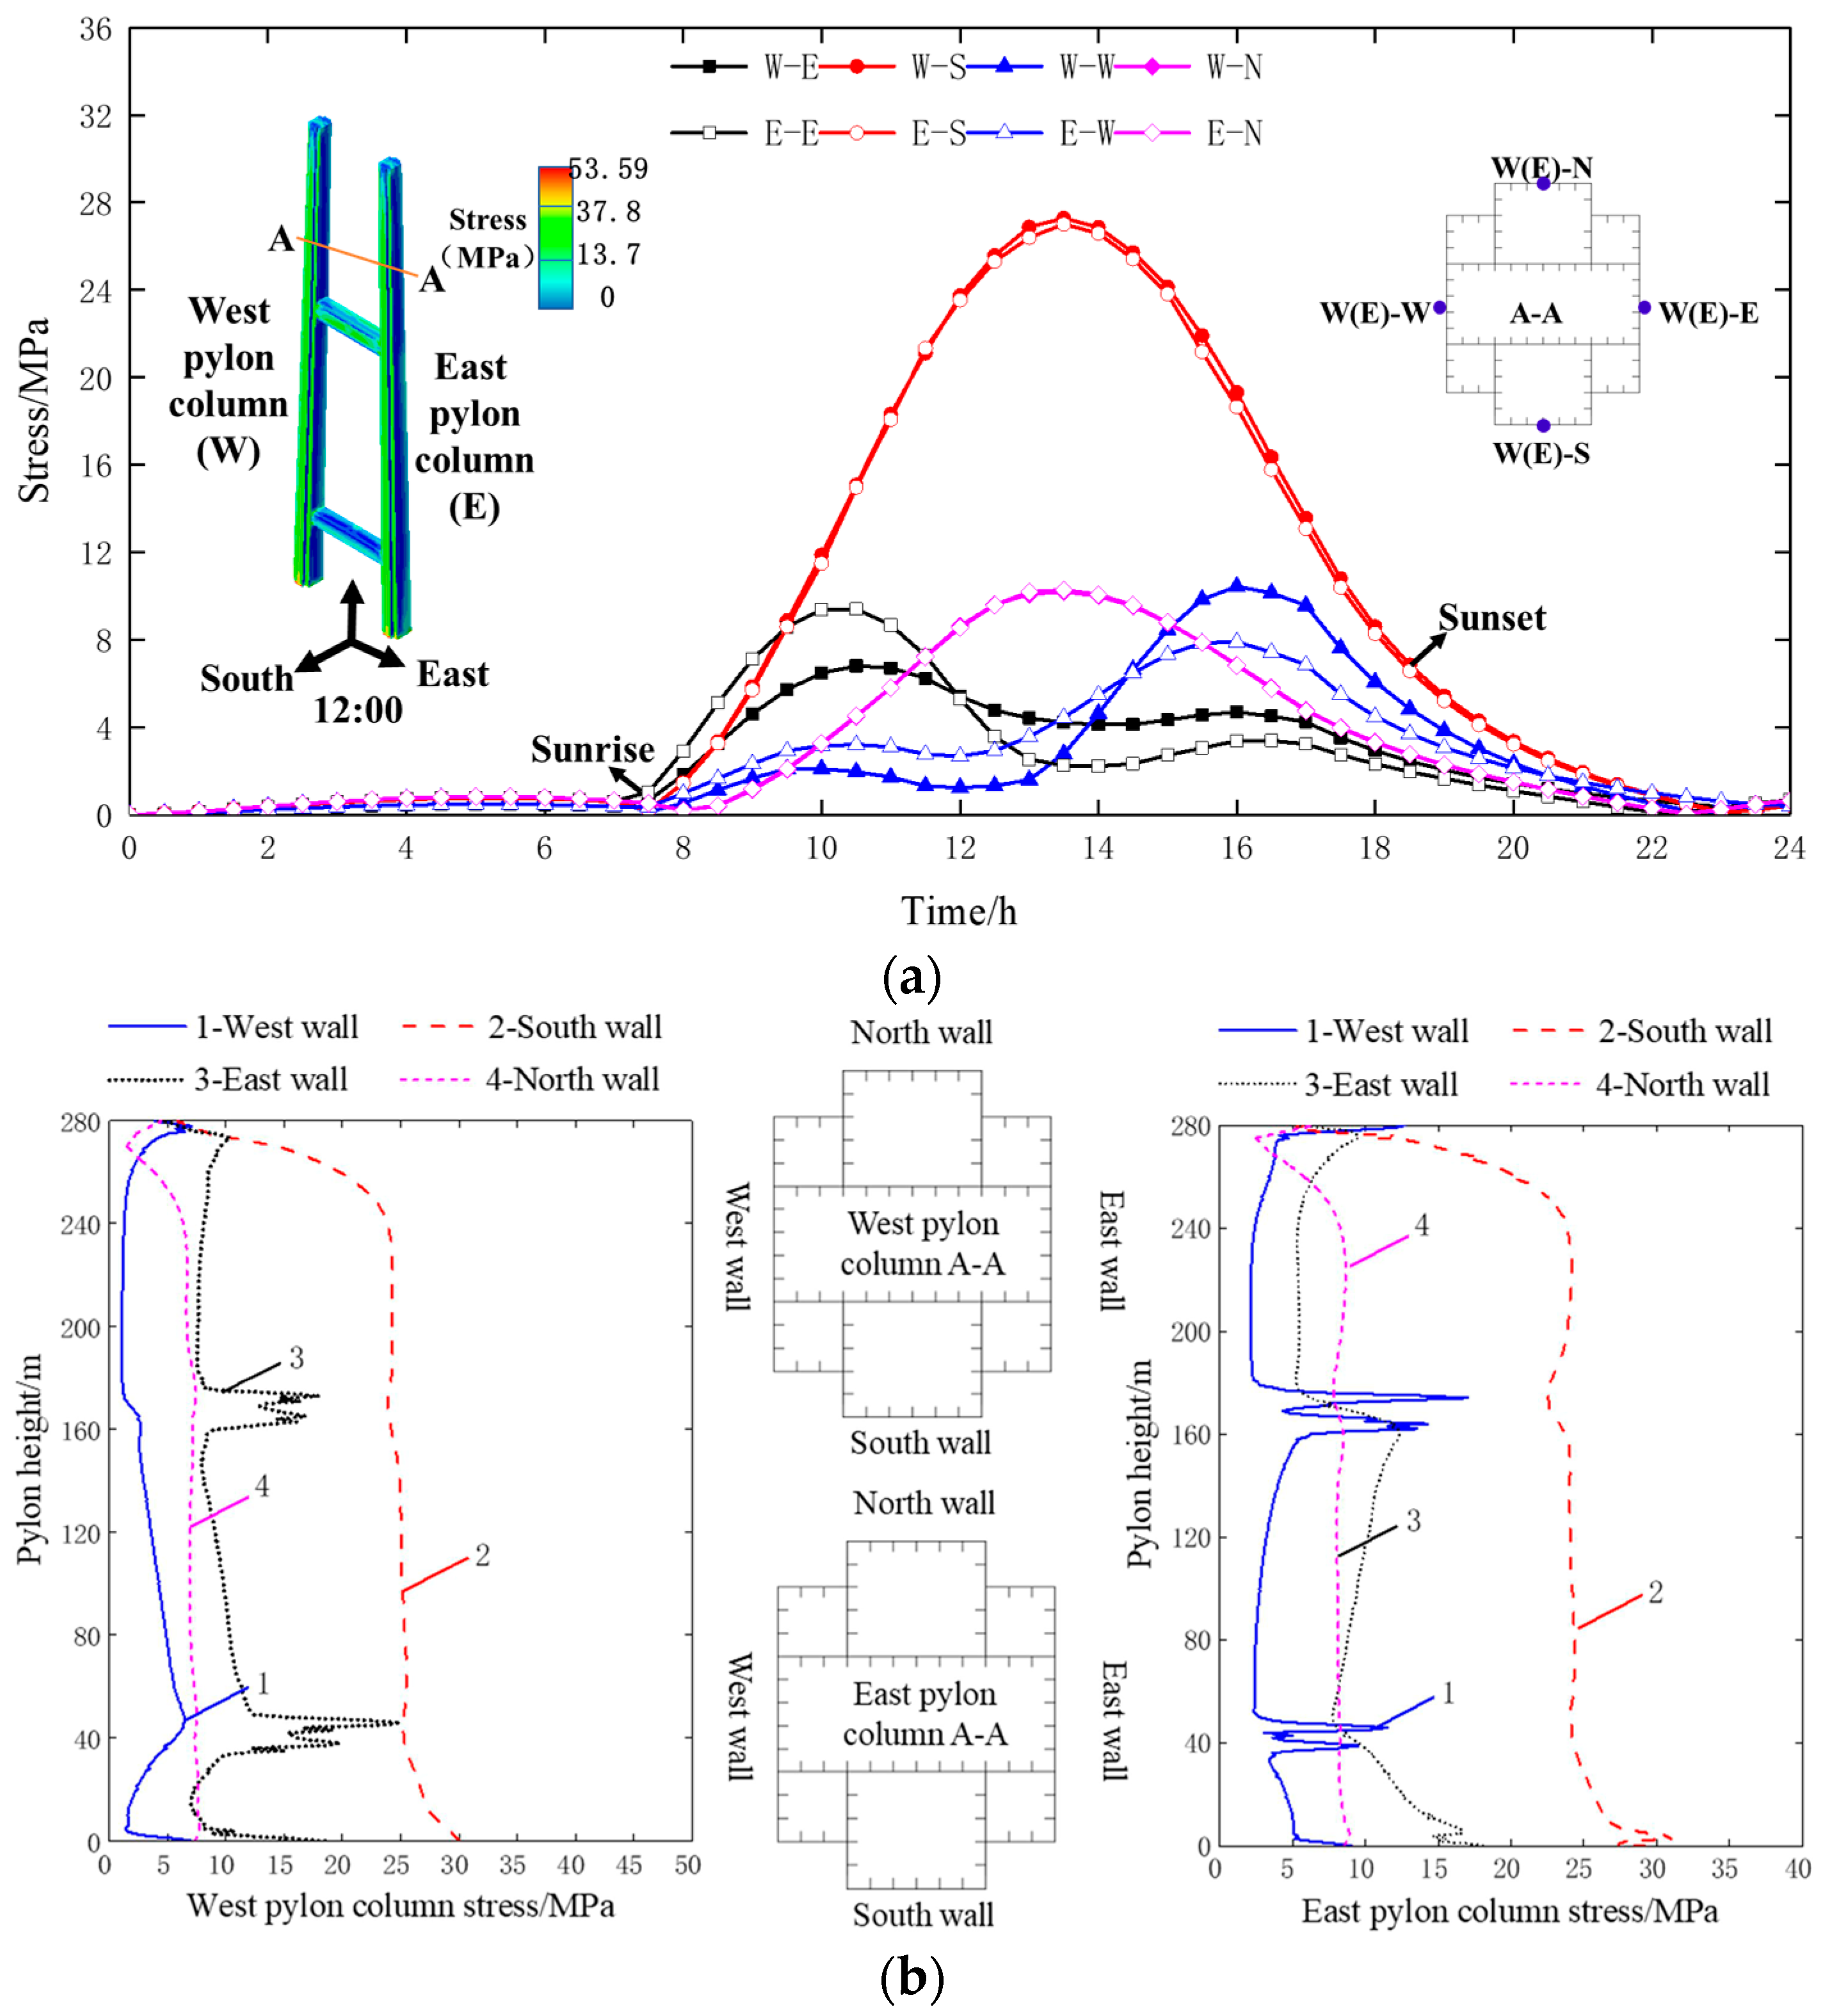
Figure 17.
Stress curve of pylon in summer: (a) Thermal stress curve of cross-section A-A; (b) Vertical stress distribution of bridge pylon at 16:00.
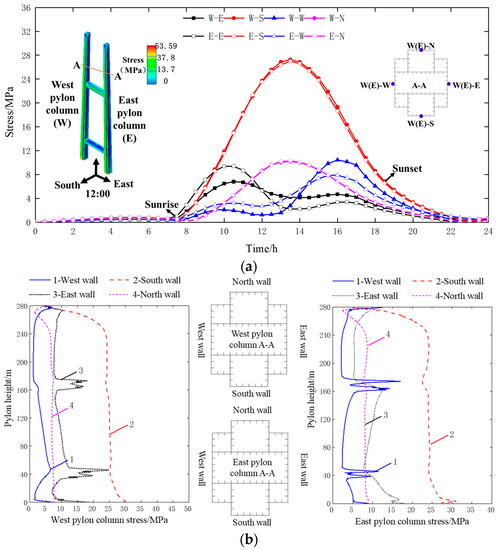
Figure 18.
Stress curve of pylon in winter: (a) Thermal Stress curve of cross-section A-A; (b) Vertical stress distribution of bridge pylon at 12:00.
In summer, the mutual shielding effect between the east and west pylon columns is most obvious. The thermal stress distribution of different pylon walls on cross-section A-A is show in Figure 17a. There is an obvious thermal stress difference between different pylon columns at 9:00 and 16:00 under the influence of mutual shielding effect between the pylon columns; the maximum thermal stress can reach 21 MPa for the west wall of the west pylon column at 16:00; at the same time, the maximum thermal stress difference between the outer surfaces of the east and west pylon columns can reach 15 MPa for the west walls. Figure 15b shows the vertical stress distribution of the bridge pylon at 16:00. The maximum thermal stress in the shaded area can be reduced by 13 MPa compared with the adjacent sunshiny area because the west wall of east pylon column is sheltered by the west pylon column.
In winter, there is no mutual shelter between the pylon columns. Figure 18a shows the thermal stress distribution of different pylon walls on cross-section A-A. The thermal stress on the south walls is the largest in the whole day, and the maximum tensile stress can reach 27 MPa at 12:00, and the thermal stress difference between the south and north walls reach a maximum of 17 MPa for the whole year. The thermal stress difference between different pylon columns is small, and there is no thermal stress difference on the south walls. The maximum thermal stress differences between the outer surfaces of the two pylon columns can reach 3 MPa for the east walls at 10:00 and the west walls at 16:00, respectively. Figure 18b shows the vertical stress variation diagram of the bridge pylon at 12:00. Because there is no shading relationship between the two pylons, the thermal stress variation trend of different pylon walls is consistent, and the thermal stress at the beam on the west wall of east pylon column is slightly abrupt due to the shadow occlusion of the cross beam.
5.2. Pylon Displacement
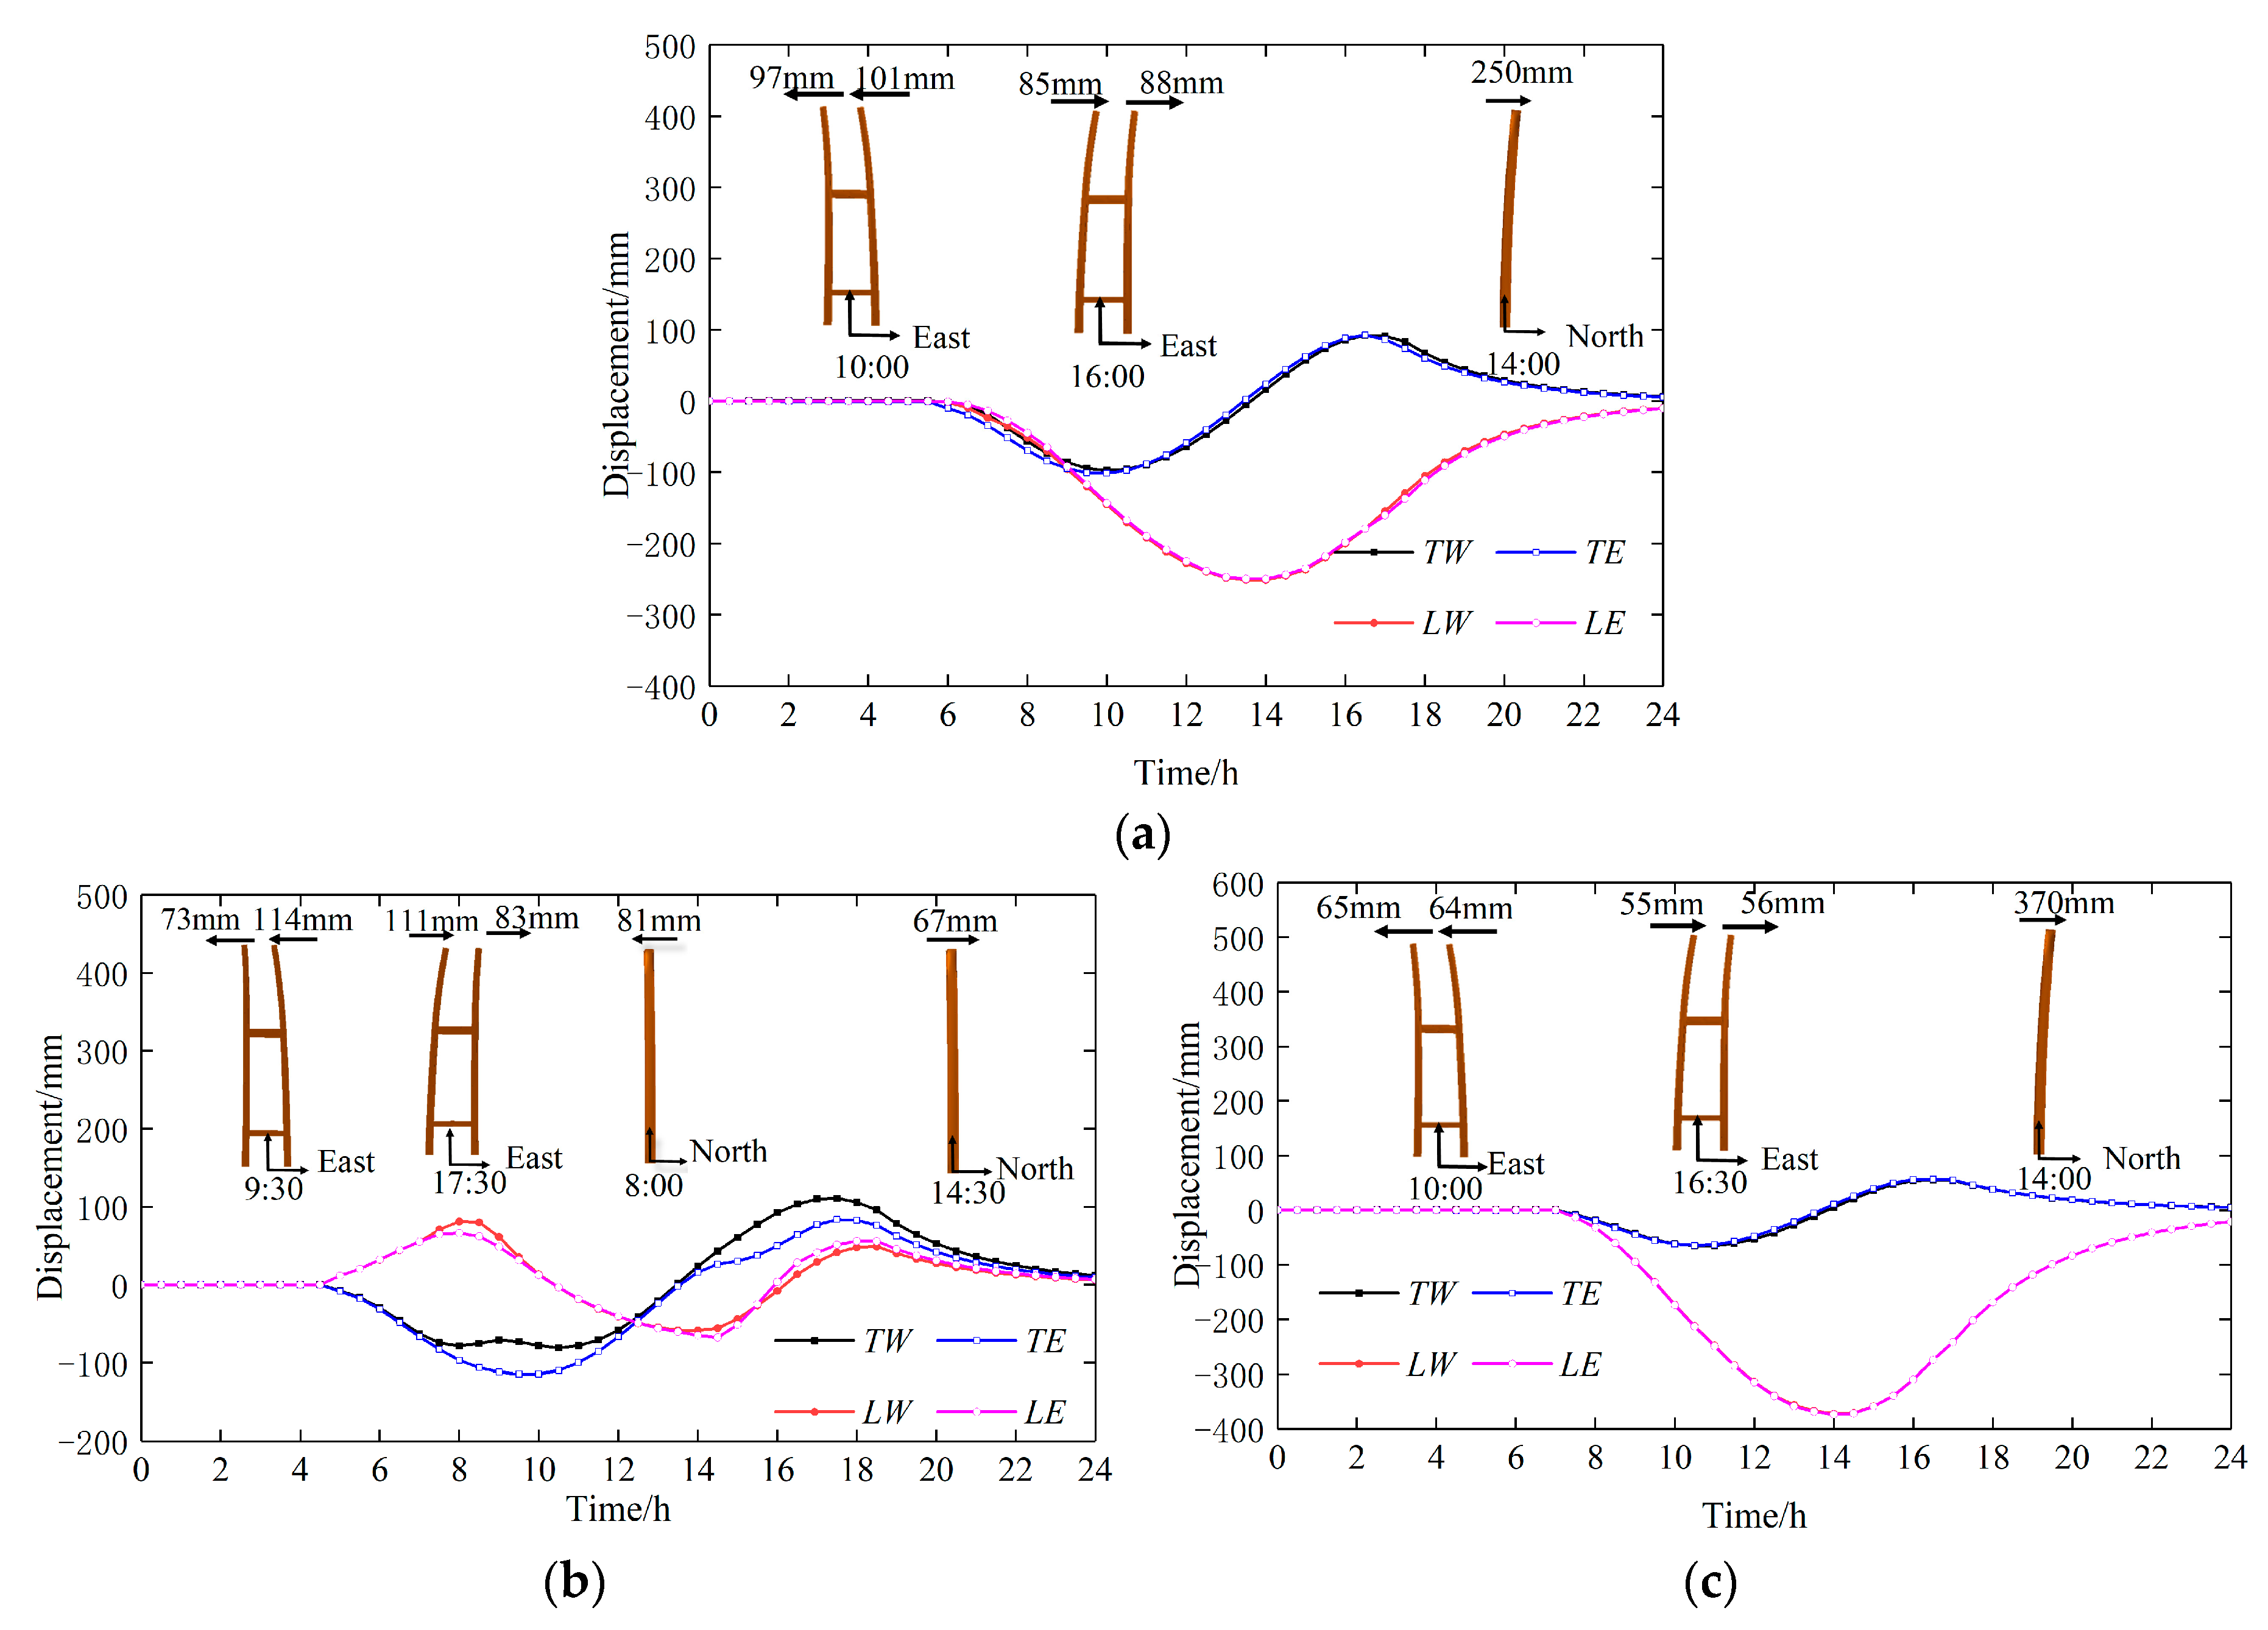
The displacement for the top of the pylon changes in four seasons as shown in Figure 19. The transverse direction of the pylon is east–west, and the longitudinal direction is north–south. East displacement means the displacement is greater than 0 mm in the transverse direction, and south displacement means the displacement is greater than 0 mm in the longitudinal direction and vice versa. TE and TW represent the transverse displacement of the east and west pylon columns, respectively. LE and LW represent the longitudinal bridge displacement of the east and west pylon columns, respectively.
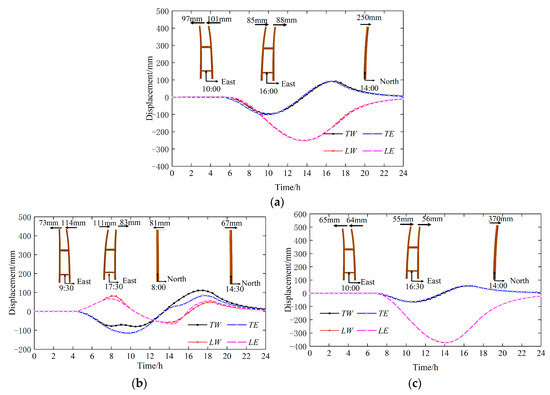
Figure 19.
Displacement of pylon: (a) Spring (Autumn) displacement. (b) Summer displacement. (c) Winter displacement.
The displacements of different pylon columns are similar in spring, autumn, and winter for both transverse and longitudinal directions. The displacement of the longitudinal bridge (north–south) on the top of the pylon reaches the maximum at 14:00 to the south, and the maximum displacement in the whole year is 370 mm in winter. The displacements on the top of the bridge pylon in transverse directions (east–west) of the bridge can reach maximum at 10:00 to the west and at 16:00 to the east, respectively, and the daily fluctuation amplitude can reach 190 mm in spring and 120 mm in winter.
There is an obvious occlusion relationship between the east and west pylon columns in summer. The displacement at the top of the west pylon column reach its maximum to the south at 8:00 in the longitudinal direction (north–south), and the displacement of the east pylon column reach its maximum to the south at 14:00, both of which are 80 mm. The asynchronous deformation between two pylons is obvious at 9:00 and 17:00 under the effect of shadow occlusion. At 9:00, the transverse displacement (east–west) of the east pylon column reaches a maximum of 110 mm to west in a year, while the west pylon column is only 70 mm at this time; at 17:00, the transverse displacement (east–west) of the west pylon column reaches a maximum of 109 mm to east, while the east pylon column is only 77 mm at this time. In summer, the maximum displacement between the two pylons can reach 220 mm in the transverse direction (east–west).
Because the Chinese specification of JTG/T D65-05-2015 “Specifications for Design of Highway Suspension Bridge” [29] does not specify the requirements of the plane error of pylon, learning from the article 8.3.1 of JTG/T 3365-01-2020 “Code for Design of Highway Cable-stayed Bridges” [30] requirements, the plane error of the pylon axis should be controlled within H/3000 and not greater than 30 mm. The displacement diagram for the top of the pylon in four seasons shows that maximum transverse displacement at the top of pylon can reach 110 mm under the solar temperature in spring, summer, and autumn, and the longitudinal direction reaches 370 mm in winter. At the same time, the alignment shape of the steel bridge pylon fluctuates greatly in a day; the alignment shape for the pylon should be accurately considered under the influence of sunshine-induced temperature during the construction.
6. Influence of Shadow Occlusion on the Temperature Effect
6.1. Influence of Shadow Occlusion on Displacement of Bridge Shape
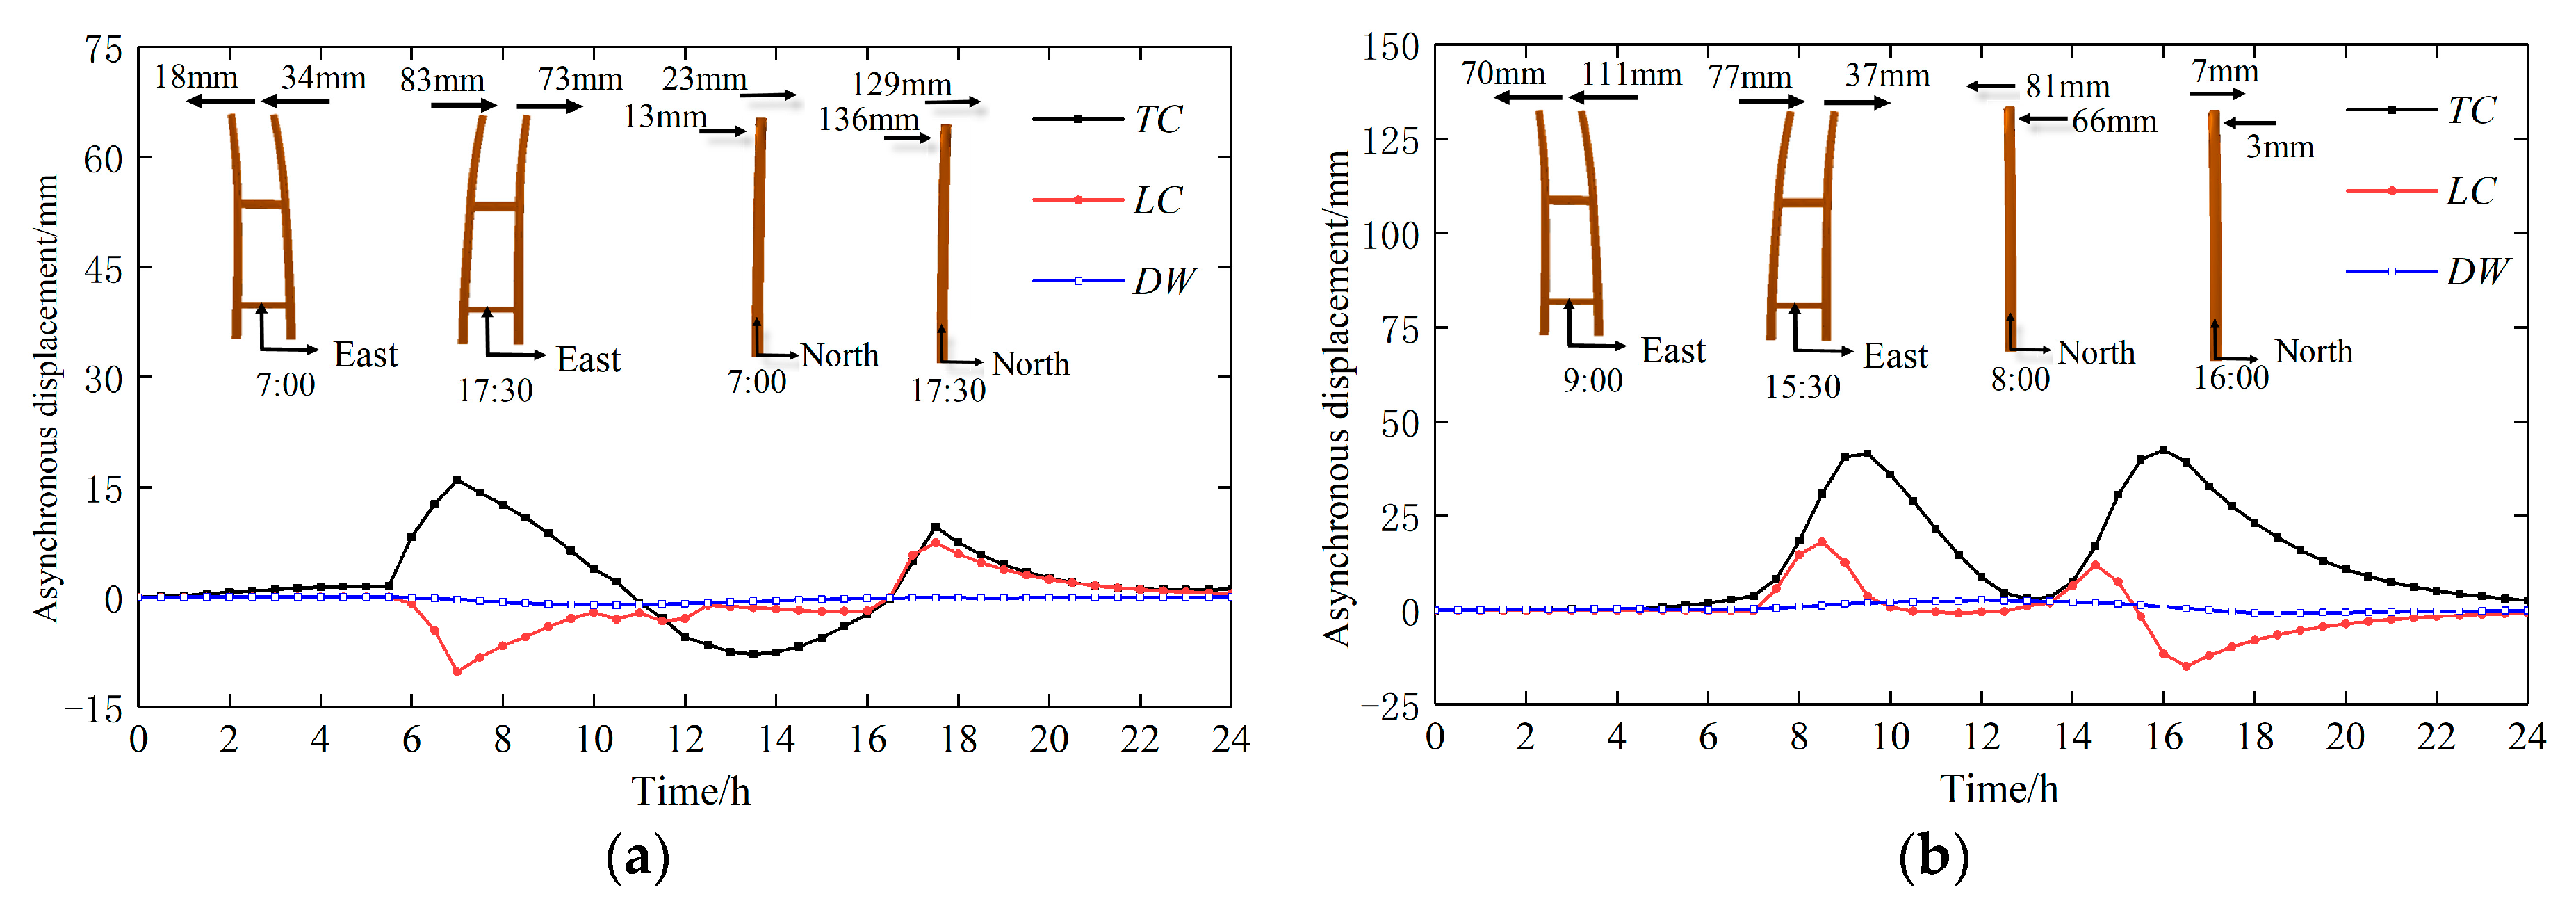
In order to analyze the influence of shadow shading on the solar temperature effect of super-high steel bridge pylons, the displacement for the top of the pylon is calculated separately under the two conditions of considering and not considering the shadow. The asynchronous displacement diagram of the bridge pylon in winter is not listed because there is no shielding relationship between the pylons, and the two pylons deform simultaneously. The displacement difference between the two pylons is defined as the difference between the displacements of the west and east pylon columns. TC and LC represent the unsynchronized displacement in the transverse and longitudinal directions between the east and west pylon columns after considering shadow, and DW represent the displacement difference between the pylon columns neglecting shadow effects.
Figure 20a shows the unsynchronized displacement of the bridge pylon in spring and autumn. When the shadow is not considered, the deformation of the pylon columns on both sides is basically consistent with that of the east pylon column in the morning and the west pylon column in the afternoon. When considering the shadow, the transverse bridge displacement of the west pylon column is smaller than the east pylon column under the influence of the shading for the east pylon column to the west pylon column from 6:00 to 7:30. At 7:30, the maximum unsynchronized displacement difference of the east and west pylon columns can reach 16 mm in the transverse direction and can reach −10 mm in the longitudinal direction. From 15:00 to 18:00, the pylon wall on the west of the east pylon column is also partially sheltered by the west pylon column; at 17:30, the asynchronous deformation of the east and west pylon columns in the transverse bridge can reach 10 mm, and the asynchronous deformation of the longitudinal direction can reach 7 mm.

Figure 20.
Asynchronous displacement of bridge pylon deformation: (a) Asynchronous displacement in spring (autumn). (b) Asynchronous displacement in summer.
Figure 20b shows the unsynchronized displacement of the bridge pylon in summer. When the shadow is not considered, the longitudinal and transverse bridge displacement difference of the east and west pylon columns can be neglected, and the two pylon columns will be synchronously deformed. When the shadow is considered, there is obvious shadow shielding between the east and west pylon columns, and the unsynchronized deformation between the east and west pylon columns of transverse bridge is obviously, while the unsynchronized deformation of longitudinal bridge is relatively small. From 7:00 to 9:00, the west pylon column is sheltered by the east pylon column, and from 13:30 to 15:00, the east pylon column is sheltered by the west pylon column; the unsynchronized maximum deformation between east and west pylon columns in transverse direction reached 40 mm at 9:00 and 42 mm at 16:00, respectively. The unsynchronized deformations in longitudinal direction can reach 18 mm at 8:30 and −15 mm at 16:30.
According to the above analysis, after considering the influence of shadow on the deformation of steel bridge pylon, the unsynchronized deformation can be accurately reflected.
6.2. Influence of Shadow Occlusion on Alignment Shape of Bridge Pylon
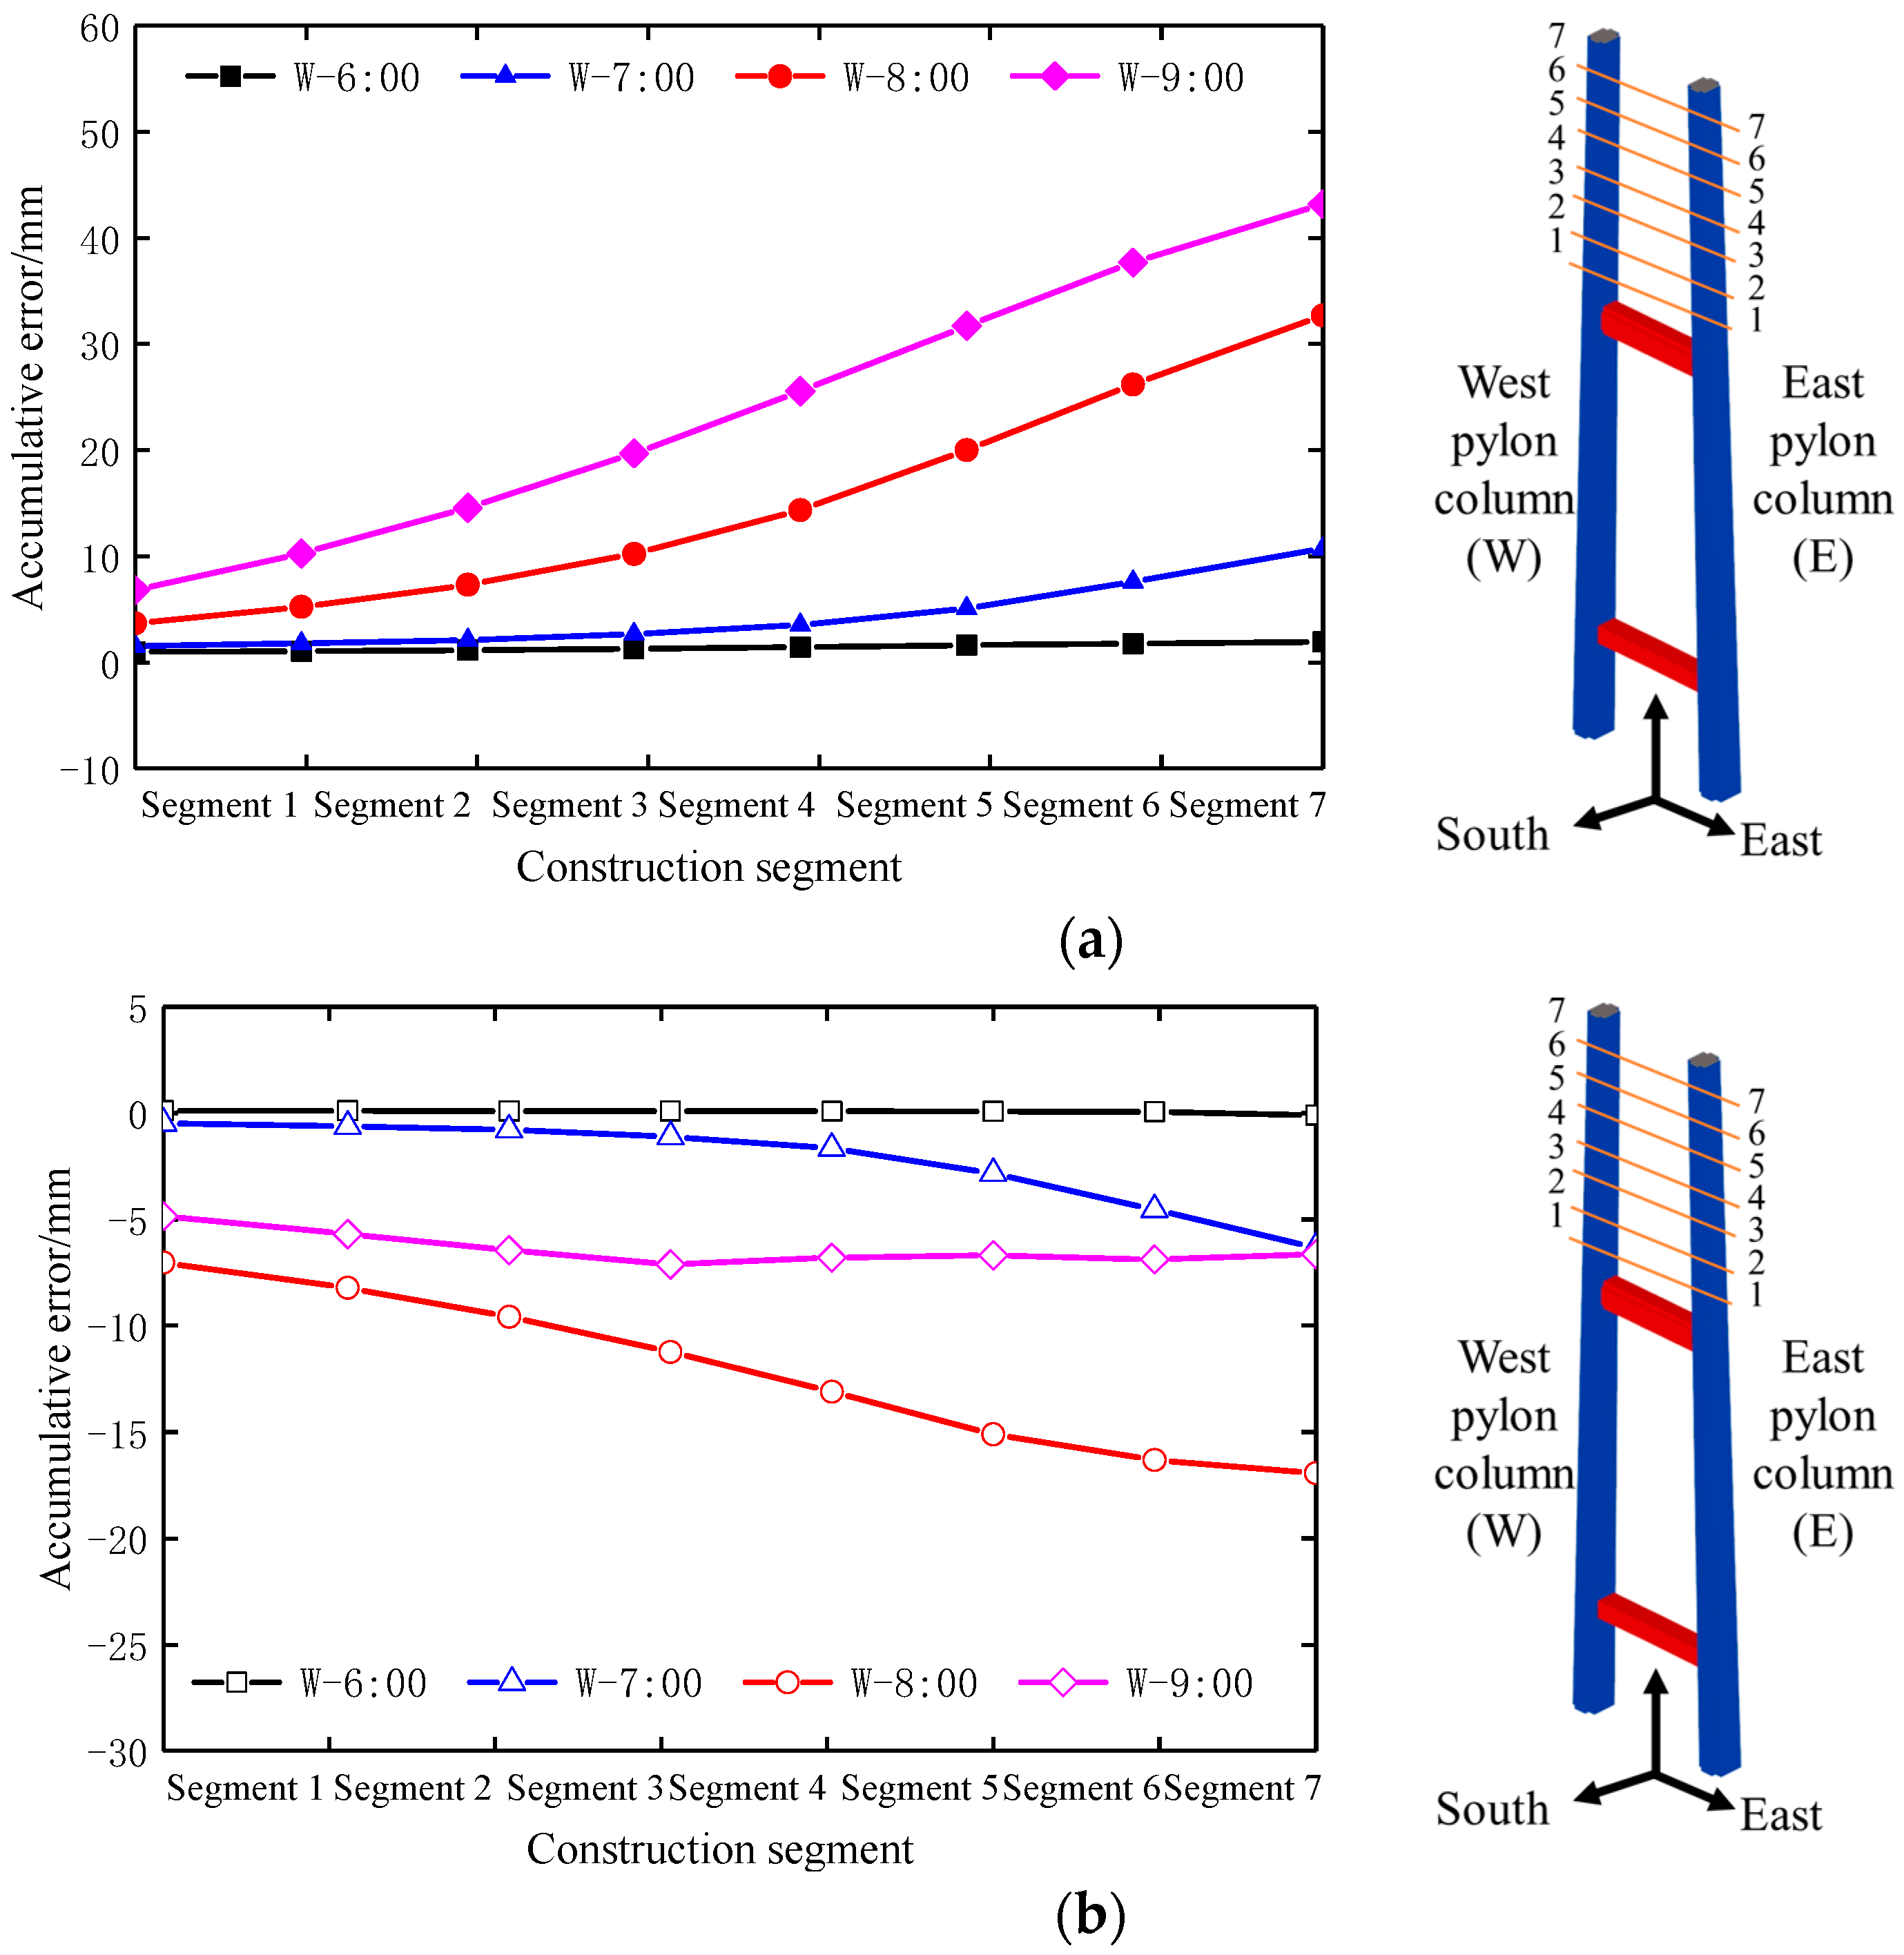
For ensuring the accuracy of the construction and measurement results, the morning period after sunlight is usually chosen as the construction time due to the stable air temperature; thus, this paper selects four time periods of 6:00, 7:00, 8:00, and 9:00 for analysis because the sunrise time at the bridge site is from 5:00 to 6:00. At this time, the west pylon column is sheltered by the east tower column, so the upper bridge pylon for the west pylon column in summer is selected to analyze the influence of shadow effect on the alignment shape, and the displacement change of the longitudinal and transverse directions is positive to the south and east respectively. According to the actual construction situation, the upper tower column is divided into seven segments. Each segment is 10.8 m long, and every 7 days is a construction period. The analysis time is from 22 June 2020 to 9 August 2020, and the calculation takes the cumulative deformation error caused by tangent assembly into account.
According to Figure 21, at 6:00, the shielding effect has little influence on the alignment shape, because the small shadow area of the east pylon column to the west pylon column. From 7:00 to 8:00, the influence of sunshine shadow on the alignment shape of the bridge pylon increases continuously. At 9:00, the alignment shape error of transverse bridge direction further increases, while the influence on the alignment shape error of longitudinal bridge direction decreases. During this period, the east wall of west pylon column has been in partial shading due to the occlusion of the east pylon column, and the alignment shape of the west pylon column will constantly deviate from the design linear. Finally, the maximum alignment shape error can reach 45 mm in the transverse direction to east and can reach 17 mm in the longitudinal direction to north.
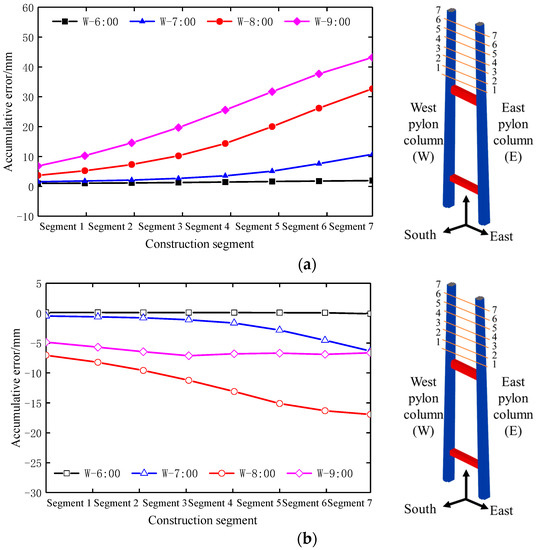
Figure 21.
Influence of shadow occlusion on alignment shape of bridge pylon during summer construction: (a) Transverse alignment shape. (b) Longitudinal alignment shape.
From the above analysis, the influence of shadow on the deflection of steel bridge pylon cannot be ignored, especially on the transverse bridge of bridge pylon. Thus, after considering the shadow, it can accurately reflect the construction alignment shape of super-high steel bridge pylon.
7. Conclusions
A refined simulation method of solar temperature field for an ultra-high structure has been presented in this paper. The temperature field and corresponding thermal stress and deformation have been calculated under typical meteorological conditions. Results show that:
- (1)
- A fine numerical simulation model for the 3D bridge temperature field was established based on the proposed automatic sunshine shadow recognition method and the pylon-height related convection modification method, which can accurately calculate the solar temperature field and temperature effect of super-high structures.
- (2)
- After the modification of convective coefficient of the outer surfaces with different wind speeds at different pylon heights, the temperature gradually decreases from the top to the bottom of the pylon with temperature difference of 4 °C and 8 °C in spring (autumn) and winter. After correcting the convection coefficient, the real temperature field and temperature effect can be more accurately mastered.
- (3)
- The maximum temperature differences between outer surfaces of pylon can reach 19 °C and 16 °C and exceed the recommended value of ±5 °C in Chinese Specification. The maximum displacements can reach 370 mm and 110 mm in longitudinal and transverse directions of the bridge, respectively. The maximum stress of the east and south walls can reach 20 MPa and 27 MPa, and the west and north walls can reach 21 MPa and 10 MPa.
- (4)
- By considering the shadow effect, the maximum temperature difference can reach 12 °C between the adjacent sunshiny and shaded areas and can reach 14 °C between two pylon columns, and the maximum stress can be reduced by 13 MPa. The asynchronous deformation for pylon columns is obvious, and the maximum asynchronous displacement can reach 18 mm and 42 mm in the longitudinal and transverse directions respectively. After superimposing the construction error caused by segment splicing, the maximum construction error in longitudinal and transverse directions can reach 17 mm and 45 mm.
- (5)
- On the basis of the research on the temperature field of the super high bridge tower, further carrying out the real bridge test and grasping the relationship between the deformation of the bridge tower and the temperature will effectively guide the construction and ensure the alignment of the bridge tower.
Author Contributions
Conceptualization, Y.L. and S.H.; methodology, Z.W., Y.L., S.H. and J.L.; software, B.G.; validation, B.G. and Z.W.; formal analysis, B.G. and Z.S.; investigation, S.H. and J.L.; supervision, Y.L.; project administration, J.L.; writing—original draft preparation, B.G. and S.H.; writing—review and editing, B.G., Z.W., Y.L., J.L., S.H. and Z.S. All authors have read and agreed to the published version of the manuscript.
Funding
This research was funded by the Key Research and Development Project of Qinghai Provincial Science and Technology Department (Grant No. 2023-SF-110), National Natural Science Foundation of China (51978061, 52108111) and the Special Fund for Basic Scientific Research of Central College of Chang’an University (Grant No. 300102219310, 300102212102).
Institutional Review Board Statement
Not applicable.
Informed Consent Statement
Not applicable.
Data Availability Statement
All datasets are publicly available.
Conflicts of Interest
The authors declare no conflict of interest.
References
- Liu, J.; Liu, Y.J.; Zhang, C.Y.; Zhao, Q.H.; Lyu, Y. Temperature Action and Effect of Concrete-filled Steel Tubular Bridges: A Review. J. Traffic Transp. Eng. (Engl. Ed.) 2020, 7, 174–191. [Google Scholar] [CrossRef]
- Meng, Q.L.; Zhu, J.S. Fine Temperature Effect Analysis Based Time-varying Dynamic Properties Evaluation of Long-span Suspension Bridges in Natural Environments. J. Bridge Eng. 2018, 23, 04018075. [Google Scholar] [CrossRef]
- Liu, J.; Liu, Y.J.; Jiang, L.; Zhang, N. Long-term Field Test of Temperature Gradients on the Composite Girder of a Long-span Cable-stayed Bridge. Adv. Struct. Eng. 2019, 22, 2785–2798. [Google Scholar] [CrossRef]
- Liu, X.F. Thermal Stress Analysis of Concrete Structures; China Communications Press: Beijing, China, 1991. [Google Scholar]
- Sang-Hyo, K.; Se-Jun, P.; Jiaxu, W.; Jeong-Hun, W. Temperature variation in steel box girders of cable-stayed bridges during construction. J. Constr. Steel Res. 2015, 112, 80–92. [Google Scholar]
- Tong, M.; Tham, L.G.; Au, F.T.K.; Lee, P.K.K. Numerical Modelling for Temperature Distribution in Steel Bridges. Comput. Struct. 2001, 79, 583–593. [Google Scholar] [CrossRef]
- Ding, Y.; Zhou, G.; Li, A.; Wang, G. Thermal Field Characteristic Analysis of Steel Box Girder Based on Long-term Measurement Data. Int. J. Steel Struct. 2012, 12, 219–232. [Google Scholar] [CrossRef]
- Yang, D.H.; Yi, T.H.; Li, H.N.; Zhang, Y.F. Monitoring and Analysis of Thermal Effect on Tower Displacement in Cable-stayed Bridge. Measurement 2018, 115, 249–257. [Google Scholar] [CrossRef]
- Chen, Z.R.; Wang, R.H. Whole Process Control of Construction of Large Block Steel Box Girder of Non-navigable Span Bridge of HongKongzhuhai-Macao Bridge over Deep Water Area. Bridge Constr. 2015, 45, 112–116. [Google Scholar]
- Wang, Y.B.; Zhan, Y.L.; Zhao, R.D. Analysis of thermal behavior on concrete box-girder arch bridges under convection and solar radiation. Adv. Struct. Eng. 2016, 19, 1043–1059. [Google Scholar] [CrossRef]
- Long, G.; Yang, Y.H.; Zhu, W.Q.; Liu, Y.J. Analysis and Handling of Upwarping Accident of Main Girder of a Steel Box Girder Cable-stayed Bridge. Bridge Constr. 2018, 48, 113–117. [Google Scholar]
- Li, Y.; He, S.H.; Liu, P. Effect of Solar Temperature Field on a Sea-crossing Cable-stayed Bridge Tower. Adv. Struct. Eng. 2019, 22, 1867–1877. [Google Scholar] [CrossRef]
- Zhang, N.; Liu, Y.J.; Liu, J. Temperature Effects of H-shaped Concrete Pylon in Arctic-alpine Plateau Region. J. Traffic Transp. Eng. 2017, 17, 66–77. [Google Scholar]
- Ren, X.; He, Q.; Tong, Y.; Huang, P.M. Temperature and Stress Fields Analysis of Concrete Bridge Tower. J. Zhengzhou Univ. (Eng. Sci.). 2011, 32, 62–65. [Google Scholar]
- Dai, P.; Qian, Y.J. Short-term Temperature Characteristics of H-shaped Section Concrete Pylon of Cable-stayed Bridge. J. Southwest Jiaotong Uni. 2014, 49, 59–65. [Google Scholar]
- Zhang, H.L.; Li, J.; Liu, C.G.; Jiang, T.H.; Wei, J. Thermal Effect of the Cable-Stayed Bridge Tower. Wuhan Univ. J. Nat. Sci. 2003, 4, 1121–1125. [Google Scholar]
- Wang, Z.; Liu, Y.J.; Tang, Z.W.; Zhang, G.J.; Liu, J. Three-dimensional Temperature Field Simulation Method of Truss Arch Rib Based on Sunshine Shadow Recognition. China J. Highw. Transp. 2022, 35, 91–105. [Google Scholar]
- Elbadry, M.M.; Ghali, A. Temperature Variations in Concrete Bridges. J. Struct. Eng. 1983, 109, 2355–2374. [Google Scholar] [CrossRef]
- Chen, D.S.; Wang, H.J.; Qian, H.L.; Li, X.Y.; Fan, F.; Shen, S.Z. Experimental and Numerical Investigation of Temperature Effects on Steel Members Due to Solar Radiation. Appl. Therm. Eng. 2017, 127, 696–704. [Google Scholar] [CrossRef]
- Liu, B.Y.; Jordan, R.C. The Interrelationship and Characteristic Distribution of Direct, Diffuse and Total Solar Radiation. Sol. Energy 1960, 4, 1–19. [Google Scholar] [CrossRef]
- Hottel, H.C. A Simple Model for Estimating the Transmittance of Direct Solar Radiation Through Clear Atmospheres. Sol. Energy 1976, 18, 129–134. [Google Scholar] [CrossRef]
- Gu, B.; Chen, Z.J.; Chen, X.D. Temperature Gradients in Concrete Box Girder Bridge Under Effect of Cold Wave. J. Cent. South Univ. 2014, 21, 1227–1241. [Google Scholar] [CrossRef]
- Kehlbeck, F. Effect of Solar Radiation on Bridge Structure; China Railway Publishing House: Beijing, China, 1981. [Google Scholar]
- Kent, C.W.; Grimmond, C.S.B.; Gatey, D.; Barlow, J.F. Assessing Methods to Extrapolate the Vertical Wind-speed Profile from Surface Observations in a City Centre During Strong Winds. J. Wind Eng. Ind. Aerodyn. 2008, 173, 100–111. [Google Scholar] [CrossRef]
- Jiang, H.F.; Wen, D.Y.; Li, N.; Ding, Y.; Xiao, J. A New Simulation Method for the Diurnal Variation of Temperature–Sub-sine Simulation. Metro. Disaster Red. Res. 2010, 33, 61–65. [Google Scholar]
- Thapar, V.; Agnihotri, G.; Sethi, V.K. Estimation of Hourly Temperature at a Site and its Impact on Energy Yield of a PV Module. Int. J. Green Energy 2012, 9, 553–572. [Google Scholar] [CrossRef]
- Ministry of Transport of the People’s Republic of China on Printing and Issuance of Code for Wind-Resistant Design Specification for Highway Bridges (JTG/T 3360-01-2018). 29 November 2018. Available online: https://xxgk.mot.gov.cn/2020/jigou/glj/202006/t20200623_3313096.html (accessed on 18 February 2023).
- Liu, H.B.; Chen, Z.H.; Zhou, T. Theoretical and experimental study on the temperature distribution of H-shaped steel members under solar radiation. Appl. Therm. Eng. 2012, 37, 329–335. [Google Scholar] [CrossRef]
- Ministry of Transport of the People’s Republic of China on Printing and Issuance of Code for Specifications for Design of Highway Suspension Bridge (JTG/T D65-05-2015). 17 December 2015. Available online: https://xxgk.mot.gov.cn/2020/jigou/glj/202006/t20200623_3312432.html (accessed on 18 February 2023).
- Ministry of Transport of the People’s Republic of China on Printing and Issuance of Code for Design of Highway Cable-Stayed Bridges (JTG/T 3365-01-2020). 21 May 2020. Available online: https://xxgk.mot.gov.cn/2020/jigou/glj/202006/t20200623_3313239.html (accessed on 18 February 2023).


Disclaimer/Publisher’s Note: The statements, opinions and data contained in all publications are solely those of the individual author(s) and contributor(s) and not of MDPI and/or the editor(s). MDPI and/or the editor(s) disclaim responsibility for any injury to people or property resulting from any ideas, methods, instructions or products referred to in the content. |
© 2023 by the authors. Licensee MDPI, Basel, Switzerland. This article is an open access article distributed under the terms and conditions of the Creative Commons Attribution (CC BY) license (https://creativecommons.org/licenses/by/4.0/).