Abstract
Underground goaves were left in many mining areas due to the continuous exploitation of coal resources. These mining areas seriously affect the production safety of the mines and the safety of life and property of the surrounding residents. Enormous safety hazards will be generated if the goaf range is not accurately controlled. In this study, we proposed a method for the detection of goaves in coal mines with a complex terrain by combining controlled source audio-frequency magnetotellurics (CSAMT) and an activated-carbon method for radon measurement. The disadvantage of failing to interpret goaf depth for the activated-carbon method for radon measurement was compensated by the advantage of the capability of goaf-depth sounding for CSAMT. Subsequently, the reference for CSAMT data was provided by the immunity of the activated-carbon method for radon measurement to the influences of terrain, earth electricity, and EMF. On this basis, the proposed method was employed to detect the goaf of Houjiagou Coal Mine in Liulin County, China, and obtained reliable detection results. The feasibility of the comprehensive geophysical prospecting method in the complex terrain was verified and it provides a new reference for the detection method of goaves with other conditions.
1. Introduction
Coal, the most extensively distributed fossil fuel globally with the richest reserves, is hailed as the industrial grain. China is the largest producer of coal in the world. However, the continuous exploitation of coal resources has caused the formation of enormous underground goaves in many coal production areas. During the high-speed economic development in China, the goaf distribution in coal mines remained unclear owing to the disorderly exploitation in many regions and the illegal exploitation in some coal mines due to inefficient management [1,2]. Given the data deficiency, the mining conditions cannot be mastered by coal mines in normal production. Consequently, if they encounter such goaves, the mines will be susceptible to disastrous accidents. Therefore, prospecting goaves has become a key safety work in the mining process. Goaves are prospected by many methods such as the seismic method and electromagnetic and radon measurements [3,4,5,6,7,8,9], but they have advantages and disadvantages that restrict their applicability to some extent. Therefore, appropriate prospecting methods should be adopted under different geological conditions, topographies, and landforms considering various factors such as cost.
In the 1950s, Cagniard introduced the magnetotelluric (MT) method for exploring electromagnetism (EM) [10]. To acquire strong signals, Goldstein and Strangway put forward controlled source audio-frequency magnetotellurics (CSAMT) [11]. CSAMT is extensively applied to the prospection of groundwater, geotherm, electrical resistivity, and minerals, manifesting that CSAMT is an effective geophysical prospecting method with a great detection depth and high resolution [12,13,14,15,16,17,18,19]. It can also identify water accumulation in goaves. However, this method is susceptible to the static effect and near-field effect. Moreover, the emission source may encounter interference from conductors near the transmitting terminal, which easily affects the measurement accuracy in regions with complicated topography and landform, as well as complicated working environments.
Radon (222Rn) is a daughter nuclide of radium (226Ra), which in turn comes from the long-lived antecedent uranium (238U). Radon is present in the soil and is transported via groundwater or carrier gases. Many researchers have developed theoretical models for the transport of radon in soils. Based on these theoretical models, the detection of areas can be achieved by measuring the concentration of radon in the soil [20,21,22,23]. Radon gas measurement, an effective geophysical prospecting method [24], was widely applied to determine faults, collapse columns, seal fire areas formed by the spontaneous combustion of coal, coal mine goaves, geotherm, and gold ores with satisfactory effects achieved. Currently, the commonly used radon measurement methods include the α-spectrometric method, 210Po method, activated-carbon method, α-card method, etc. All these methods have advantages and shortcomings. For example, although α-spectrometric method can measure radon concentration quickly, it is sensitive to humidity and requires some purification time after measuring high abnormal values. Furthermore, although the 210Po method can eliminate the interference of other nuclides, the sample processing and measurement process is more complicated and the error caused by a human is large. As for the α-card method, although it is easy to operate and can be tested on-site, the dispersion of low concentration measurement is large. Therefore, comparing the advantages and disadvantages of various methods, the activated carbon method is more suitable for this experiment [25,26,27]. As early as 1957, Miranda Jr. measured the radon concentration in the atmosphere by using activated carbon as the adsorber. Afterward, the activated-carbon method for radon measurement swas theoretically and experimentally explored by many scholars. In 1986, Lin et al. from China investigated activated carbon for radon measurement [28]. This method is featured by simplicity, convenience, fast operation, low cost, and immunity to the influences of terrain, earth electricity, and electromagnetic field (EMF) [29]. However, it fails to interpret the goaf depth.
The disadvantage (i.e., failure to interpret goaf depth) of the activated-carbon method for radon measurement was compensated by the advantage of CSAMT (i.e., the capability of goaf-depth sounding). Subsequently, the reference for CSAMT data was provided by the immunity of the activated-carbon method for radon measurement to the influences of terrain, earth electricity, and EMF. In the present study, the advantages of both methods were integrated at a theoretical level to accurately monitor the goaf situation.
2. Topography and Landform of the Study Area
The study area is located in the Luliang mountainous area in Shanxi Province, China (Figure 1). As cracks occurred in some of the houses in the nearby residential area, the location of the former mining near the residential area was designated as the study area in order to investigate whether the house cracks in the houses were caused by the goaf. The study area is about 320 m in length from north to south and 340 m in width from east to west, covering an area of about 0.11 km2. In total, 17 measurement lines with 286 measurement points are laid out in the study area, and the study points laid out by the CSAMT method and the activated-carbon method for radon measurement method overlap completely.
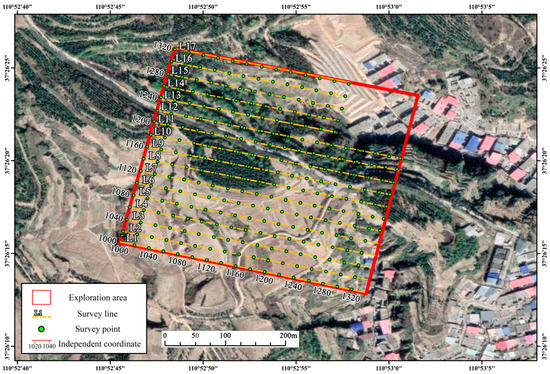
Figure 1.
Geographical Location of the Study Area (image from BigMap).
It is a typical erosional landform of the Loess Plateau. The ground surface is intensely cut, with rolling loess ridges and densely distributed narrow gullies, most of which present a “V” shape. The gullies are alternatively distributed with loess ridges, hills, and walls. Moreover, micro-geomorphologic landscapes such as cliffs, residual loess columns, and sinkholes are commonly observed (Figure 2).
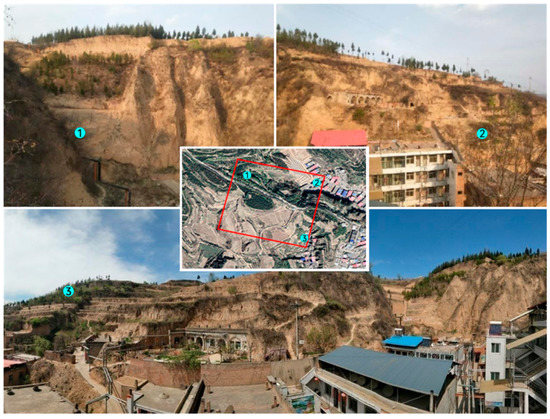
Figure 2.
The complex terrain of the study area. ① Landforms on the northwest side of the study area. ② Landforms on the northeast side of the study area. ③ Landforms on the southeastern side of the study area.
A large gully exists in the west of this area, the exposed rock stratum is the upper Permian Shangshihezi Formation (P2s), and the lithology is a greyish white–yellow green sandstone intermingled with grey, grey–green, and red violet mudstone; sandy mudstone; and siltstone. The lithology of the Neogene Pliocene series (N2) comprises brownish red clay and mild clay [thickness = 0–65.00 m (average thickness = 25.00 m)] containing calcareous concretions and presenting angular unconformity contact with the underlying bedrock. The Quaternary middle Pleistocene series (Q2) comprises yellow sand loam, which is soft and fine, with the development of vertical joints. The Quaternary upper Pleistocene series (Q3) is made of light red and reddish yellow loam, in which vertical joints are also developed.
3. Methodology
3.1. Controlled Source Audio-Frequency Magnetotellurics for Goaf Detection
3.1.1. Principle of Controlled Source Audio-Frequency Magnetotellurics
Based on the different skin depths of electromagnetic waves with different frequencies in the underground propagation, the controlled source audio-frequency magnetotellurics (CSAMT) method can obtain geoelectric parameters at a depth corresponding to the frequency of each EMF by measuring the EMF intensity, thereby reaching the goal of depth sounding [30].
CSAMT is a frequency–domain electromagnetic depth-sounding method. By taking the finite length ground electric dipole as the field source, the electric- and magnetic-field parameters can be simultaneously observed at a certain distance from the dipole center, the Cagniard resistivity and impedance phase can be calculated, and the geological objects can be detected at different burial depths. The EMF components measured by CSAMT and the coordinate system are displayed in Figure 3. The CSAMT-based scalar measurement was realized using the power from an electric dipole source, and the observation point was located in the sector area formed by 30° angles at two sides of the middle perpendicular to the electric dipole source (Figure 4) [31].
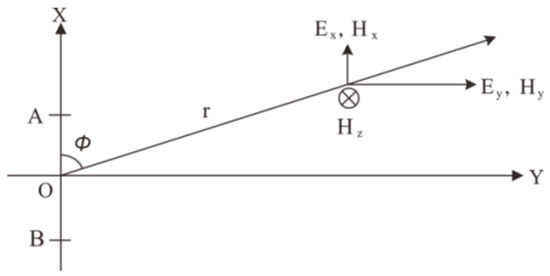
Figure 3.
EMF Components Measured by the CSAMT and Coordinate System.
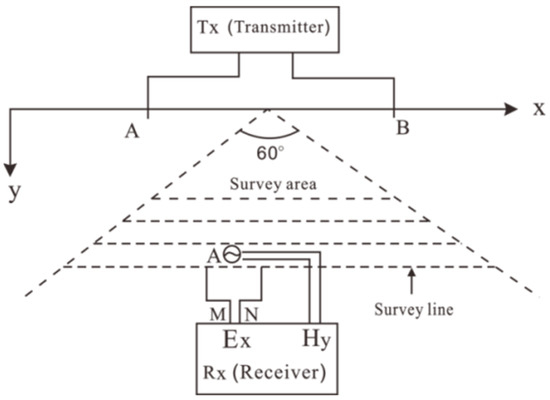
Figure 4.
Sketch Plan of the CSAMT-based Measuring Device.
3.1.2. Data Collection and Processing
The surveying work was implemented using a V8 multi-function receiver system produced by Canadian Phoenix Corporation. The transmitter used was a TXU-30 high-power transmitter also produced by this corporation. The schematic of the measuring device is shown in Figure 5. The supply voltage and supply current were selected as 600 V and 14 A, respectively. The transmitting–receiving distance was the key to achieving high-quality data. The presently developed CSAMT 2D inversion software such as SCS2D used in this study took the receiving far-field data of EMF as the precondition. If the transmitting-receiving distance was too small, near-field data were received, which cannot reflect the characteristics of frequency sounding. Conversely, if the transmitting–receiving distance was too large, the signal was too weak to suppress local noise and was accompanied by a degradation in data quality. The transmitting–receiving distance was taken as R = 7.8 km according to the range of exploration area and actual objective conditions, and this distance satisfied the estimated far-field conditions. To improve data quality, multiple-stacking technology was used in the surveying process, and repeated observation was conducted in the seriously interfered zone.
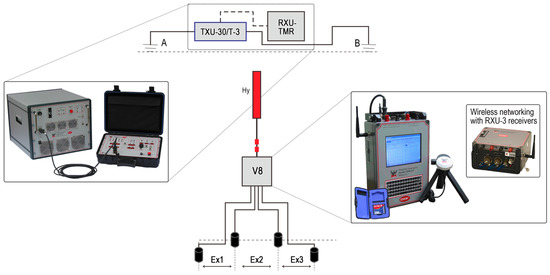
Figure 5.
Schematic of the Measuring Device. (A B is the grounding electrode).
Through data preprocessing, the various noises in the CSAMT data such as instrument noise, natural electromagnetic noise, human noise, geological noise, and non-plane-wave triggered curvilinear distortion were eliminated, suppressed, or calibrated as the study area is in the vicinity of residential areas, where human noise has the strongest potential influence on measurement errors. The processing methods include data editing, filtering, static-displacement calibration, and transition-zone calibration. In formal processing, data with large deviations and evident distortion at the measuring point were firstly smoothened by multipoint smooth filtering. Subsequently, the near-field influence was analyzed, followed by the near-field calibration of the curves with near-field additional effects. Afterward, static–displacement calibration, modeling, and inversion were performed. In the end, the 2D inversion results were interpreted and inferred by combining the geological data.
3.1.3. 2D Inversion
- (1)
- Profile interpretation of apparent resistivity obtained through inversion
After processing the acquired data, 2D inversion was conducted, and the following three representative survey lines were taken, for example, and interpreted.
- a
- Survey line L2
As observed from the transverse direction of the apparent resistivity contour line on the cross-sectional diagram (Figure 6), the apparent resistivity along the survey line at the morphological position of the coal seam was relatively stable, without obvious cascade changes. We inferred that it was stable along the survey line of the coal seam, and no apparent anomaly existed in electrical properties. The goaf and water accumulation in it were not interpreted.
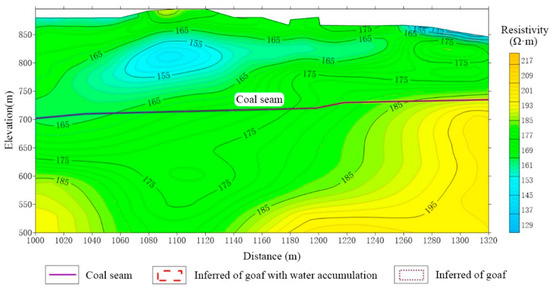
Figure 6.
Apparent Resistivity Cross-Sectional Diagram of Survey Line L2 Obtained Through CSAMT-based 2D Profile Inversion.
- b
- Survey line L4
From the transverse direction of the apparent resistivity contour line on the cross-sectional diagram (Figure 7), an obvious high-resistivity anomaly appeared within points 1000–1040 and points 1094–1193 on the line distributed along the coal seam. The apparent resistivity was higher than 200 Ω·m, which was inferred as the reflection of the anomaly in the coal goaf. Moreover, an obvious low-resistivity anomaly was presented within points 1041–1093, and the apparent resistivity was lower than 150 Ω·m, which was deemed as the reflection of the low-resistivity anomaly caused by the water accumulation in the goaf at the low-lying part of the formation.
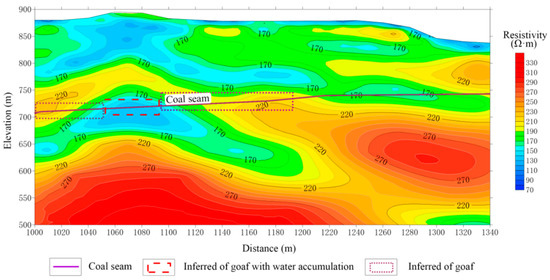
Figure 7.
Apparent Resistivity Cross-Sectional Diagram of Survey Line L4 Obtained Through CSAMT-based 2D Profile Inversion.
- c
- Survey line L10
As observed from the transverse direction of the apparent resistivity contour line on the cross-sectional diagram (Figure 8), an evident low-resistivity anomaly appeared within points 1052–1225 on the line distributed along the coal seam, and the apparent resistivity was lower than 150 Ω·m. This finding was considered as the reflection of the low-resistivity anomaly triggered by the water accumulation in the goaf at the low-lying part of the formation. An obvious high-resistivity anomaly was presented within points 1253–1326, and the apparent resistivity was higher than 200 Ω·m, which was inferred as the reflection of the anomaly in the coal goaf without water accumulation. Points 1225–1253 were located between the water accumulation area and the goaf, which was inferred as the transition zone from the water accumulation area to the non-water-accumulation area in the goaf.
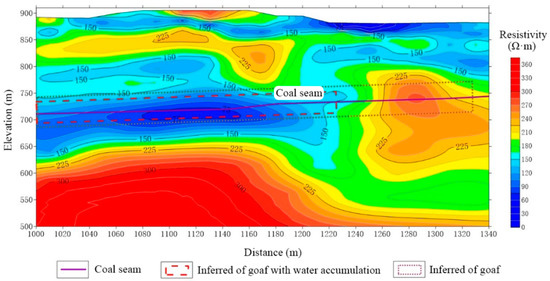
Figure 8.
Apparent Resistivity Cross-Sectional Diagram of Survey Line L10 Obtained Through CSAMT-based 2D Profile Inversion.
The above profile analysis of the three survey lines covered the reflection characteristics of the resistivity of all the survey lines in the exploration area for the electrical properties at the corresponding horizon, so the survey lines were representative. No unnecessary details were given to other survey lines.
- (2)
- Bedding-section interpretation of the apparent resistivity obtained through inversion
The blue–green–yellow–red transition displayed on the section map denoted the change in apparent resistivity from low to high, as shown in Figure 9. According to the overall change laws of apparent resistivity, the range encircled by the blue dotted line in the bedding section map of apparent resistivity represented the water accumulation in the goaf and that encircled by the red dotted line was the goaf. The non-encircled area was the unexploited range.
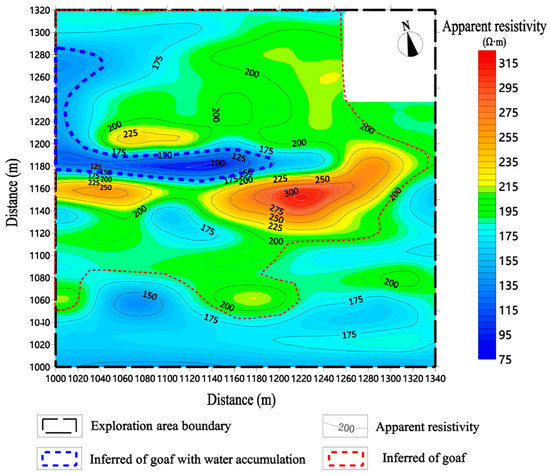
Figure 9.
Bedding-Section Map of Pseudo-Apparent Resistivity of Prospected Coal Seam.
By combining the known data, one low-resistivity anomaly zone and one high-resistivity anomaly zone were inferred from the coal seam through the CSAMT method. Analysis revealed that the low-resistivity anomaly zone was caused by the water accumulation in the goaf or the water enrichment at rock strata, so we inferred that it was the water accumulation anomaly zone in the goaf. Due to the restriction of known data, the high-resistivity anomaly zone was inferred as the goaf anomaly zone.
3.2. Activated-Carbon Method for Radon Measurement
3.2.1. Principle of Activated-Carbon Method for Radon Measurement
Radon is the progeny of the uranium series and is the only inert gas and the progeny of interest because it can be migrated from the deep underground part to the ground surface, and it can display information on all kinds of changes in the deep formation. Radon is the intermediate product of radium decay, and its progenies 214Pb and 210Bi were the irradiators of γ rays.
The activated-carbon radon detector identified the existence of radon by detecting the intensity of γ rays of radon progenies in soil. To be specific, the γ rays irradiated the Na1 (T1) scintillator in the detector, thereby generating photoelectric signals, which turned into weak electrical signals by using a photomultiplier. The pulses deemed acceptable by a single-chip computer formed through a preamplifier, main amplifier, and pulse-shaping circuit. The number of pulses within the unit of time reflected the intensity of the γ rays. The radon anomaly data were obtained by measuring the γ rays at different places, thereby laying a foundation for analyzing the underground geological conditions in work areas [32].
The activated-carbon method for radon measurement is a static and accumulative radon-measurement method. To specify its principle, the activated-carbon adsorber was buried underground for a period of time, and then the adsorber was taken out and placed in an instrument (activated-carbon radon detector) to measure the intensity of γ rays radiated by the decay progenies of radon. Thus, the radon-gas concentration can be determined. The radon emanation elements migrated into the goaf and gathered in it, and then a radon anomaly area corresponding with the goaf morphology formed on the ground surface. Therefore, the position and range of the goaf in a coal mine can be inferred by measuring the radon-element concentration on the ground surface (i.e., measuring the intensity of rays released by radon and its decay progenies).
3.2.2. Data Acquisition and Processing
The instrument used was an HD-2003 activated-carbon radon detector. In the field survey, the used activated carbon was baked and dried. After cooling, the activated carbon was placed in a sampler according to an appropriate standard, a silicon stopper was used to evade the influence of underground moisture, and then the sample was sealed for later use. Next, the filled sampler was placed in a test pit with its mouth down, as shown in Figure 10. The sampler and gas-collection cup were stabilized and fixed, the plastic cloth was covered on them, and the pit mouth was sealed. When the cup was buried until the preset time (at least 5 days) was reached, the sampler was taken out, and the sampling time and the climate were carefully filled. Afterwards, the sampler was placed in the tested and calibrated activated-carbon radon detector, and then the line number and point number of each sampler were recorded.
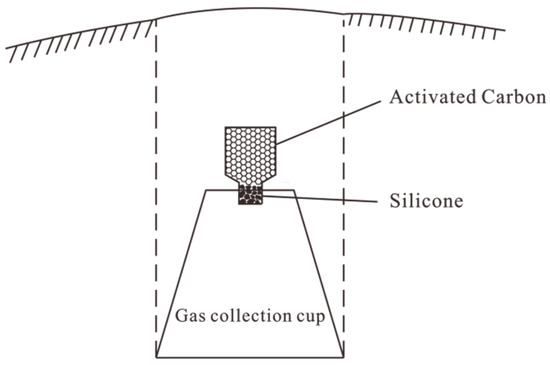
Figure 10.
Diagram of the Activated-Carbon Adsorber.
In the radon measurement with activated carbon, the amount of radon adsorbed by activated carbon was influenced by the temperature, humidity, activated carbon adsorber, radon detector, burial depth, and burying time. The radon data measured by activated carbon were preprocessed from the following six aspects: standardization, normalization, instrument calibration, correction of measured intensity of γ rays, calibration of shallow factors, and uniform smoothing.
3.2.3. Data Interpretation
- (1)
- Profile interpretation of radon values
Through data correction and uniform smoothing, the radon value profile map and radon anomaly plane graph of each survey line were formed. Apparently, the radon value was aggregated in the goaf, and a radon anomaly zone corresponding with the goaf morphology formed on the ground surface. Taking three survey lines, for example, the CSAMT profiles were combined in the analytical investigation based on geological data and field investigation as follows:
- a
- Survey line L2
The profile map (Figure 11) of radon measurement by activated carbon shows that the radon anomaly was obvious. The maximum radon anomaly was 2495.08 Bq/L, and most radon values within points 1160–1320 were smaller than 2000 Bq/L, whereas those at points 1000–1140 were greater than 2000 Bq/L, manifesting the evident radon anomaly. By comprehensive analysis, point 1140 was delimited as the goaf boundary.
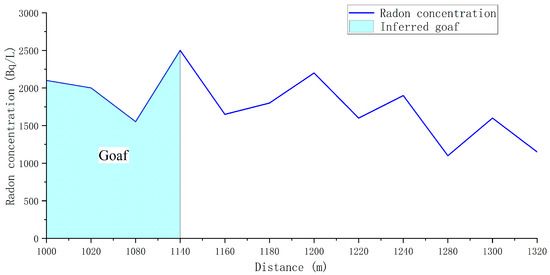
Figure 11.
Profile Map of Radon Measurement by Activated Carbon for Survey Line L2.
- b
- Survey line L6
From the profile map of radon measurement by activated carbon (Figure 12), the radon anomaly was apparent, the maximum radon anomaly was 3105.37 Bq/L, and most radon values within points 1000–1100 and 1160–1200 were greater than 2000 Bq/L. Meanwhile, those within points 1200–1340 were smaller than 2000 Bq/L, so the radon values were relatively concentrated and stable. Through comprehensive analysis that combined CSAMT profiles, geological data, and field investigation, points 1100, 1160, and 1200 were delimited as the goaf boundaries.
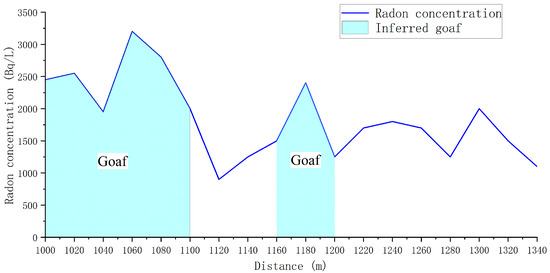
Figure 12.
Profile Map of Radon Measurement by Activated Carbon for Survey Line L6.
- c
- Survey line L10
As observed from the profile map of radon measurement by activated carbon (Figure 13), the radon anomaly was evident, the maximum radon anomaly was 3246.89 Bq/L, and most radon values within points 1000–1300 were greater than 2000 Bq/L. The radon values significantly fluctuated, indicating an obvious radon anomaly. Through a comprehensive analysis based on the CSAMT profiles, geological data, and field investigation, point 1300 was delimited as the goaf boundary.
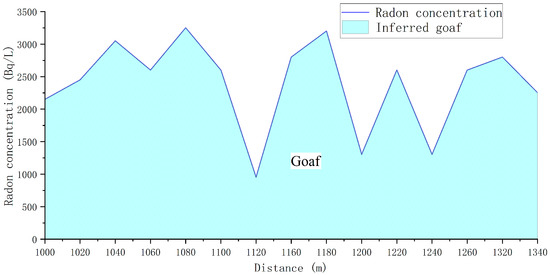
Figure 13.
Profile Map of Radon Measurement by Activated Carbon for Survey Line L10.
- (2)
- Plane interpretation of radon anomaly
By combining the contour lines of radon values measured by the activated-carbon method and the following interpretation result map, the radon anomaly was found to have a blocky shape with favorable continuity, as shown in Figure 14. The radon values greatly changed in the middle and northwest parts of the exploration area, and the maximum radon concentration was 3962.3 Bq/L which was interpreted as a radon anomaly zone. Moreover, the ground-surface fissures may have already been connected to the underground goaf to some extent without a gas storage function, so low values appeared in a small block in this section. Comprehensive speculation and analysis revealed that the anomaly zone was largely identical to the goaf range inferred by CSAMT, and the goaf was inferred as the radon anomaly zone.
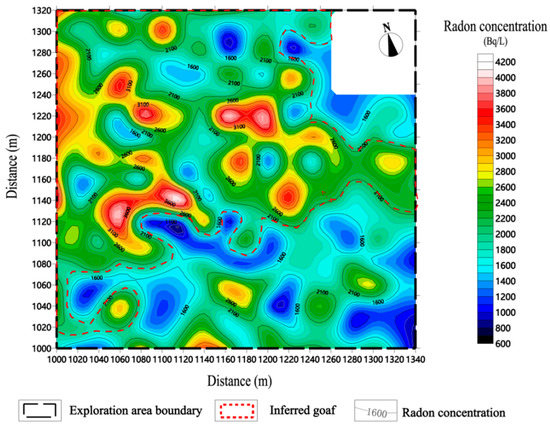
Figure 14.
Contour Line Plane of Radon Values Measured by Activated Carbon and Goaf Anomaly Interpretation (Red Wireframe) Map.
4. Discussion and Conclusions
The study area is located in the Luliang mountainous area in Shanxi Province. Although the complex topography and geomorphology bring certain difficulties to the exploration of the goaf, the results of this study show that the application of combining CSAMT and the activated-carbon method for radon measurement for the detection of the goaf was successful.
CSAMT integrates the merits of great detection depth, high resolution, and capability to identify the water accumulation status in the goaf. However, it is easily affected by the static effect and near-field effect. The conductors near the transmitting terminal may interfere with the emission source, which can very easily affect the measurement accuracy in regions with complicated topography, landform, and working environments. However, the activated-carbon method for radon measurement is not influenced by the terrain, earth electricity, or EMF. Nevertheless, this method fails to interpret the goaf depth. Accordingly, the two methods can exploit each other for reference to compensate for their disadvantages.
In this field survey work, the CSAMT and activated-carbon method for radon measurement were combined into a comprehensive geophysical prospecting method to study the underground goaf situation in a mining area. First, CSAMT was used to probe the depth sounding in the goaf. One low-resistivity anomaly zone and one high-resistivity anomaly zone were discovered, where the latter was inferred as the goaf anomaly zone and the former formed through the water accumulation in the goaf or the water enrichment at roc strata, thereby being inferred as the water accumulation anomaly zone in the goaf. The activated-carbon method for radon measurement was then used to infer the position and range of the underground goaf. With the CSAMT prospecting results combined, the goaf was inferred to be the radon-value anomaly zone. The prospecting results obtained by the two methods were combined to complete the geophysical prospecting of the underground goaf in this mining area.
In the end, the known data, field geological investigation, CSAMT, and activated-carbon method for radon measurement were integrated for a comprehensive interpretation, thereby completing the goaf interpretation in the exploration area, which was then verified through drill holes, as shown in Figure 15. The results show that the boundaries of the goaf range detected by the two exploration methods do not coincide exactly. This means that if one exploration method is used for exploration, the results do not mean that the goaf area has been fully discovered. This also confirms that each geophysical exploration method has its own advantages and disadvantages. Synthesizing the advantages of each method to avoid its disadvantages will make its detection results more referenced.
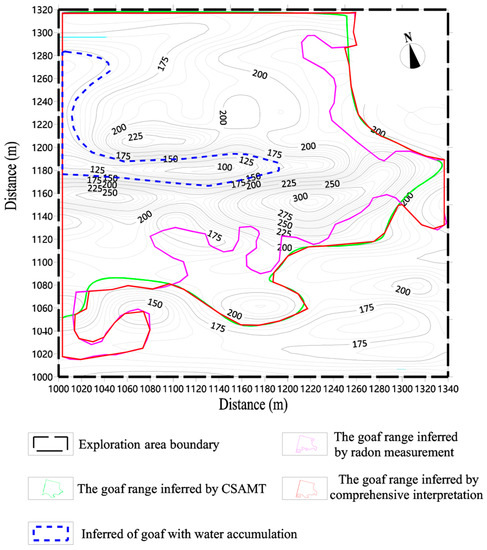
Figure 15.
Comprehensive Interpretation of Goaf Result Map.
Since the goaf area detected by the two methods does not completely coincide, it cannot be proved that the goaf area range is 100% identified. In theory, the more detection methods used, the more accurate the results obtained are. However, it is necessary to take into account the burden of time, economy, labor, and other expenses as well as the fact that the comprehensive detection scheme of multiple methods is difficult to implement, and the detection accuracy of these two methods is enough to meet the needs of most engineering projects.
The actual results manifested that the comprehensive geophysical prospecting method integrating CSAMT and the activated-carbon method for radon measurement can indeed complete the prospecting work economically, rapidly, and accurately. This comprehensive prospecting method also experienced a minor influence from various factors such as topography, landform, and geological conditions. Therefore, it has great reference significance in practical engineering explorations.
Author Contributions
Conceptualization, J.L. (Jianhui Long) and J.L. (Jin Liu); methodology, J.L. (Jianhui Long) software, M.L.; validation, J.L. (Jianhui Long), J.L. (Jin Liu) and S.Z.; formal analysis, J.L. (Jin Liu); investigation, J.L. (Jin Liu); resources, J.L. (Jianhui Long); data curation, J.L. (Jin Liu); writing—original draft preparation, J.L. (Jin Liu); writing—review and editing, S.Z.; visualization, M.L.; supervision, J.L. (Jianhui Long); project administration, J.L. (Jianhui Long); funding acquisition, J.L. (Jianhui Long). All authors have read and agreed to the published version of the manuscript.
Funding
This research was funded by the Science and Technology Department of Shanxi Province, grant number 202103021224112.
Institutional Review Board Statement
Not applicable.
Informed Consent Statement
Not applicable.
Data Availability Statement
Data generated or analyzed during the study are available from the corresponding author by request.
Acknowledgments
Thanks are due to Yuqi Jin for their assistance with the experiments.
Conflicts of Interest
The authors declare no conflict of interest.
References
- Liu, X. Problems and Countermeasures in China’s mineral resources management. World Nonferrous Met. 2022, 607, 205–207. (In Chinese) [Google Scholar]
- Wang, Q.X. A Study on Problems and Strategies Existing in the Mineral Resource Management of Our Country. Master’s Thesis, Central China Normal University, Wuhan, China, 2006. (In Chinese). [Google Scholar]
- Chen, Q.; Zhang, S.; Chang, S.L.; Liu, B.; Liu, J.; Long, J.H. Geophysical Interpretation of a Subsurface Landslide in the Southern Qinshui Basin. J. Environ. Eng. Geophys. 2019, 24, 433–449. [Google Scholar] [CrossRef]
- Su, Z.J.; Wang, J.; Wang, L. Application of geophysical technology in prevention of mining geological disasters. Appl. Mech. Mater. 2012, 256, 2669–2672. [Google Scholar]
- Wang, X.B.; Chen, J.C.; Guo, Q.S.; Liu, Y.; Yu, J.B.; Zhang, B. Research of the CSAMT exploration mode and experiment for the coalbed methane enrichment region in the north Qinshui basin. Chin. J. Geophys.-Chin. Ed. 2013, 56, 4310–4323. [Google Scholar]
- Su, B.Y.; Yu, J.C.; Sheng, C.X. Borehole Electromagnetic Method for Exploration of Coal Mining Goaf. Elektron. Ir Elektrotechnika 2016, 22, 37–40. [Google Scholar] [CrossRef]
- Xue, G.Q.; Chen, W.; Cheng, J.L.; Liu, S.C.; Yu, J.C.; Lei, K.X.; Guo, W.B.; Feng, X.H. A Review of Electrical and Electromagnetic Methods for Coal Mine Exploration in China. IEEE Access 2019, 7, 177332–177341. [Google Scholar] [CrossRef]
- Yu, C.T.; Wang, Z.; Tang, M.Y. Application of Microtremor Survey Technology in a Coal Mine Goaf. Appl. Sci. 2023, 13, 466. [Google Scholar] [CrossRef]
- Zhang, L.; Xu, L.; Xiao, Y.; Zhang, N.B. Application of Comprehensive Geophysical Prospecting Method in Water Accumulation Exploration of Multilayer Goaf in Integrated Mine. Adv. Civ. Eng. 2021, 2021, 1434893. [Google Scholar] [CrossRef]
- Cagniard, L. Basic theory of the magneto-telluric method of geophysical prospecting. Geophysics 1953, 18, 605–635. [Google Scholar] [CrossRef]
- Goldstein, M.A.; Strangway, D.W. Audio-Frequency Magnetotellurics with a Grounded Electric Dipole Source. Geophysics 1975, 40, 669–683. [Google Scholar] [CrossRef]
- An, Z.G.; Di, Q.Y.; Fu, C.M.; Xu, C.; Cheng, B. Geophysical Evidence through a CSAMT Survey of the Deep Geological Structure at a Potential Radioactive Waste Site at Beishan, Gansu, China. J. Environ. Eng. Geophys. 2013, 18, 43–54. [Google Scholar] [CrossRef]
- Di, Q.; Fu, C.; An, Z.; Wang, R.; Wang, G.; Wang, M.; Qi, S.; Liang, P. An application of CSAMT for detecting weak geological structures near the deeply buried long tunnel of the Shijiazhuang-Taiyuan passenger railway line in the Taihang Mountains. Eng. Geol. 2020, 268, 105517. [Google Scholar] [CrossRef]
- Di, Q.Y.; An, Z.G.; Fu, C.M.; Wang, Z.X. Imaging underground electric structure over a potential HLRW disposal site. J. Appl. Geophys. 2018, 155, 102–109. [Google Scholar] [CrossRef]
- Fu, C.; Di, Q.; An, Z. Application of the CSAMT method to groundwater exploration in a metropolitan environment. Geophysics 2013, 78, B201–B209. [Google Scholar] [CrossRef]
- Hu, X.; Peng, R.; Wu, G.; Wang, W.; Huo, G.; Han, B. Mineral Exploration using CSAMT data: Application to Longmen region metallogenic belt, Guangdong Province, China. Geophysics 2013, 78, B111–B119. [Google Scholar] [CrossRef]
- Luo, X.; Gong, S.; Huo, Z.G.; Li, H.Y.; Ding, X.P. Application of Comprehensive Geophysical Prospecting Method in the Exploration of Coal Mined-Out Areas. Adv. Civ. Eng. 2019, 2019, 2368402. [Google Scholar] [CrossRef]
- Wu, G.; Hu, X.; Huo, G.; Zhou, X. Geophysical Exploration for Geothermal Resources: An Application of MT and CSAMT in Jiangxia, Wuhan, China. J. Earth Sci. 2012, 23, 757–767. [Google Scholar] [CrossRef]
- Wynn, J.; Mosbrucker, A.; Pierce, H.; Spicer, K. Where is the Hot Rock and Where is the Ground Water-Using CSAMT to Map Beneath and Around Mount St. Helens. J. Environ. Eng. Geophys. 2016, 21, 79–87. [Google Scholar] [CrossRef]
- Guo, Q.; Sun, K.; Cheng, J. Methodology study on evaluation of radon flux from soil in China. Radiat. Prot. Dosim. 2004, 112, 291–296. [Google Scholar] [CrossRef]
- Ioannides, K.; Papachristodoulou, C.; Stamoulis, K.; Karamanis, D.; Pavlides, S.; Chatzipetros, A.; Karakala, E. Soil gas radon: A tool for exploring active fault zones. Appl. Radiat. Isot. Incl. Data Instrum. Methods Use Agric. Ind. Med. 2003, 59, 205–213. [Google Scholar] [CrossRef]
- Savovic, S.; Djordjevich, A.; Ristic, G. Numerical solution of the transport equation describing the radon transport from subsurface soil to buildings. Radiat. Prot. Dosim. 2012, 150, 213–216. [Google Scholar] [CrossRef] [PubMed]
- Urosevic, V.; Nikezic, D. Radon transport through concrete and determination of its diffusion coefficient. Radiat. Prot. Dosim. 2003, 104, 65–70. [Google Scholar] [CrossRef] [PubMed]
- Mullerova, M.; Holy, K.; Blahusiak, P.; Bulko, M. Study of radon exhalation from the soil. J. Radioanal. Nucl. Chem. 2018, 315, 237–241. [Google Scholar] [CrossRef]
- Liu, D.W.; Liu, H.F.; Zhang, X.J. Application of active carbon radon measurement in detection of coal mined-out area. Prog. Explor. Geophys. 2009, 32, 220–223+156. (In Chinese) [Google Scholar]
- Zhang, X.J.; Liu, H.F. Experimental Research on Radon Measurement Using Activated Charcoal in Field. J. Taiyuan Univ. Technol. 2004, 35, 304–306+314. (In Chinese) [Google Scholar]
- Zhang, W.; Dong, X.L.; Xu, Y.; Liang, Y.D.; Kang, P. Comparison and Application Of Common Soil Radon Measurement Methods. Nucl. Electron. Detect. Technol. 2020, 40, 313–317. (In Chinese) [Google Scholar]
- Lin, L.Q.; Ren, T.S.; Li, G.Y. A passive integrating charcoal detector for indoor radon survey. Radialization Prot. 1986, 6, 1–8. (In Chinese) [Google Scholar]
- Han, X.H.; Yu, C.X. Application of radon measurement in the survey of mined areas. Geotichnical Investig. Surv. 1996, 5, 63–66+72. (In Chinese) [Google Scholar]
- Lei, D.; Fayemi, B.; Yang, L.Y.; Meng, X.H. The non-static effect of near-surface inhomogeneity on CSAMT data. J. Appl. Geophys. 2017, 139, 306–315. [Google Scholar] [CrossRef]
- An, Z.; Di, Q. Application of the CSAMT Method for Exploring Deep Coal Mines in Fujian Province, Southeastern China. J. Environ. Eng. Geophys. 2010, 15, 243–249. [Google Scholar] [CrossRef]
- Mu, T.G. Discussion on Application of Radioactive Radon Gas in Detecting of Goaf Roadway. Taiyuan Sci. Technol. 2005, 6, 60–61. (In Chinese) [Google Scholar]
Disclaimer/Publisher’s Note: The statements, opinions and data contained in all publications are solely those of the individual author(s) and contributor(s) and not of MDPI and/or the editor(s). MDPI and/or the editor(s) disclaim responsibility for any injury to people or property resulting from any ideas, methods, instructions or products referred to in the content. |
© 2023 by the authors. Licensee MDPI, Basel, Switzerland. This article is an open access article distributed under the terms and conditions of the Creative Commons Attribution (CC BY) license (https://creativecommons.org/licenses/by/4.0/).