Article

Bulk Solids Stacking Strategy of a Rectangular Ship Cabin

1
School of Transportation and Logistics Engineering, Wuhan University of Technology, Wuhan 430063, China
2
Hainan Institute, Wuhan University of Technology, Sanya 572024, China
3
School of Engineering, The University of Newcastle, Newcastle, NSW 2287, Australia
4
School of Art and Design, Wuhan University of Technology, Wuhan 430070, China
*
Authors to whom correspondence should be addressed.
Appl. Sci. 2023, 13(6), 3940; https://doi.org/10.3390/app13063940
Submission received: 11 December 2022 / Revised: 6 March 2023 / Accepted: 15 March 2023 / Published: 20 March 2023
(This article belongs to the Special Issue New Frontiers in Advanced Manufacturing)

Abstract

:
Stacking of bulk solids in terminals, ships, trains, and other bulk solids storage yards is always challenging, considering the requirements of optimal utilization of storage areas. In this study, stacking shapes of a variety of bulk solids with different particle sizes were tested, and the curved shapes of the stockpiles were extracted to establish the actual three-dimensional models of the bulk solids accordingly. The three-dimensional curved stockpiles were used to design the bulk solids stacking strategy where the bulk stacking locations, the stacking volume, and the stacking flatness were optimized. A modified golden section method with a self-influenced factor was developed to improve the calculation efficiency of the stacking algorithm for bulk solids stacking flatness. Furthermore, the bulk solids stacking strategy and algorithm were verified by experiments. The results showed that the curved three-dimensional models were very close to the actual shapes of the bulk solids stockpiles, while the improved golden section method was more accurate and efficient than the traditional golden section method in determining the optimal values of the stacking volumes in terms of flatness. For the different bulk solids tested, the experiment results showed that good flat stacking can be achieved by using the developed stacking strategy.

1. Introduction

With the rapid development of bulk solids markets, storage and transportation of coal, ore, grain, and other bulk solids are widely required in diverse industries. Flat and balanced stacking of bulk solids in port yards, ships and trains is particularly important because uneven stacking of bulk solids may cause partial loads for equipment and even lead to the advent of safety accidents. More bulk solids can be loaded with flat stacking, more bulk solids can be loaded into a yard or a cabin, thereby utilizing the storage space better. At present, the automation of bulk solids stacking is low. It is difficult to reasonably plan the locations and volumes in a stacking process. As a result, the positions of stackers for stacking bulk solids in a storage yard are manually adjusted, which frequently causes uneven distribution of bulk solids and uneven stacking effect. Therefore, it is extremely important to reasonably design the stacking and loading strategy of bulk solids to achieve the effect of flat stacking.
In order to realize the flat stacking of bulk solids, it is necessary to establish a strategy that can predict the shape, volume, and location of each bulk solids stockpile in a storage yard. Angelelli et al. [1] studied the scheduling problem of stacker reclaimer in the stockyard of a coal export terminal. They introduced an abstract model of stacker reclaimer scheduling and studied the complexity of different variants of the model as well as algorithms for the solution of these variants. A critical assumption in this investigation is that all stockpiles to be reclaimed have to be placed on the two pads before reclaiming starts. On this basis, Kalinowski et al. [2] studied a variant of the stacker reclaimer scheduling problem in which this restriction is removed, as a consequence, more stockpile placement and reclaiming sequencing and routing decisions are required. Ünsal [3] studied the complex parallel scheduling problem of stacker reclaimer in a bulk cargo terminal and proposed a new constrained programming formula which can generate near optimal scheduling for different yard configurations in one minute. Pang and Su [4] developed a king-view-based bulk solids loading and unloading monitoring system to provide real-time feedback of a stacking process with unmanned remote control. Xue [5] installed a laser scanner on a bulk solids ship loader to scan the three-dimensional contour of the cabin and the materials in the cabin. The material shapes in the cabin were obtained using an image processing algorithm, based on which the free space was calculated and filled to achieve flat stacking. Sun et al. [6] considered the storage space allocation problem motivated by an inland bulk material stockyard and addressed various practical concerns of the storage space allocation in bulk material stockyard. A novel mathematical formulation was developed on the basis of the idea of partitioning the storage space into slots. Tang et al. [7] proposed a new mixed integer programming model with a Benders decomposition algorithm to improve the efficiency of solving the comprehensive allocation of storage space and ship scheduling in bulk cargo terminals. Tang et al. [8] developed a flexible and accurate modeling method for storage space of an iron ore terminal yard and established a mixed integer linear programming model to minimize the total travel distance of all iron ore arrivals. The near-optimal solution was obtained effectively using a heuristic method based on a genetic algorithm. Rekik and Elkosantini [9] studied the problem of a container stacking strategy in port terminals. They proposed a multi-agent system for the reactivity and decentralized control of container stacking in uncertain and disturbing environments. The system can capture, store, and reuse information to detect interference. It also can select the most appropriate stacking strategy, and determine the most appropriate stacking location. Gharehgozli and Zaerpour [10] studied the stacking problem of outbound containers at deep-sea container terminals. They proposed a stacking strategy that allows different types of containers to share the same stack. Maldonado et al. [11] proposed a decision support system to improve the efficiency of container stacking operations. Dwell times were predicted for each container using analytics techniques. This prediction was used as an input for a mathematical programming model that minimized container rehandles heuristically. Abdul Rahman et al. [12] proposed an innovative container stacking method to overcome the potential problem of insufficient container yard space. The established system improves the efficiency of handling containers and improves the profit rate of the port. Ambrosino and Xie [13] proposed a mixed 0/1 linear programming model and heuristic method to define storage rules to minimize the space use of the exit yard. Einicke [14] studied the filtering of lidar data in the loader environment. They proposed a high-order signal model which specified the optimal linear filter. Le Carrer et al. [15] combined a decision theory with stochastic optimization technology to optimize cargo loading and ship scheduling decisions in tidal ports. They designed a shipping decision model to calculate the cargo loading and dispatching decisions by taking into account the time series predicted by the sea level points of these ports. Celik and Akyuz [16] proposed a multi-criteria comprehensive decision method based on the extension of interval type-2 fuzzy sets for the selection of loader type in maritime transportation. This method combined the analytic hierarchy process and the similarity ranking method of ideal solutions under the IT2FSs environment and overcame the uncertainty of expert judgment and expression in the decision-making process.
To sum up, the stacking research mainly focuses on the scheduling of bulk solids stacking equipment, the intelligent monitoring of stacking site, the detection and feedback of stacking effect, and the rational utilization of yard space. However, there is little research on the strategy planning of flat stacking of bulk solids. The distribution of bulk solids in stacking process still requires manual intervention and judgment.
In this study, the stacking route and the stacking locations were designed considering the flat and balanced stacking. Then, the stockpile shape of bulk solids was extracted to establish a three-dimensional model. After that, a stacking strategy was proposed by adapting the golden section algorithm with a self-influence factor to optimize the modeling efficiency, from which the location and volume of each bulk solids stockpile can be obtained. Finally, the stacking strategy was used to stack five different materials. The performance was verified by comparing and analyzing the stacking flatness.

2. Strategy Design of Bulk Solids Stacking

2.1. Stacking Route Planning

In order to reduce the equipment loss, energy consumption, and the labor intensity during operation, it is necessary to reduce the movement of the stacker in the stacking process. The loading process is summarized as follows:
  • According to the stacking site size and the total loading capacity, the stacking locations and the corresponding stacking volume at each stacking location are planned.
  • A stacker stops at a certain stacking point for continuous loading bulk solids to form a certain size of a stockpile, and then the stacker moves to the next stacking point to continue loading bulk solids.
A bulk carrier with three cabins is considered as an example. The moving route of a ship loader is shown in Figure 1. During loading, the frequent start, stop, and movement of the ship loader will affect the service life of the equipment. Therefore, the moving route of the ship loader should be as short and continuous as possible. After loading at one stacking location, the ship loader shall continue loading at its adjacent location as far as possible, so as to ensure the continuity and high efficiency of loading. In addition, the moving route of the loader must also consider the stability and strength of the ship during loading. If the unilateral load is too large, the roll angle and trim angle of the hull will be greater than the stable value. On the basis of the above considerations, the moving route of the ship loader was designed as shown in the figure. First, 15–35% of the bulk solids is loaded from the bow to the stern along the center line of the cabin to stabilize the hull. Then, the remaining bulk solids is loaded alternately on the left or right side of the three cabins according to the double zigzag route shown in Figure 1.

2.2. Analysis on the Stacking Locations

A cabin of the above bulk carrier is selected to analyze the stacking locations. The size of this cabin is 40 m × 20 m × 16 m, and the total loading volume of materials is 1250 m3. The height of stockpiles and the difference between peaks and valleys are analyzed. The results are analyzed in Figure 2. As shown in the figure, with the increase of the number of stacking points, the slope of the height of stockpiles curve becomes gentle, and the difference between peaks and valleys decreases gradually. Furthermore, it can be observed that fewer stacking points lead to the increase in greater difference between the peaks and valleys and an uneven stacking effect. This will also cause problems, such as stress concentration and unbalanced load. On the other hand, if there are too many stacking points, the stacker will move frequently, causing the decrease in operation efficiency.
The difference between peaks and valleys of a stockpile is used as a criterion for evaluating the flatness of stockpiles. According to site experience and the actual investigation, for the selected cabin with this size, the maximum allowable height difference is approximated as 4 m, which is shown by the green straight line in Figure 2. With the consideration of operation efficiency and stacking flatness, the reasonable number of the stacking points should be set as 4.

2.3. Modelling of Bulk Solids Curved Stockpile

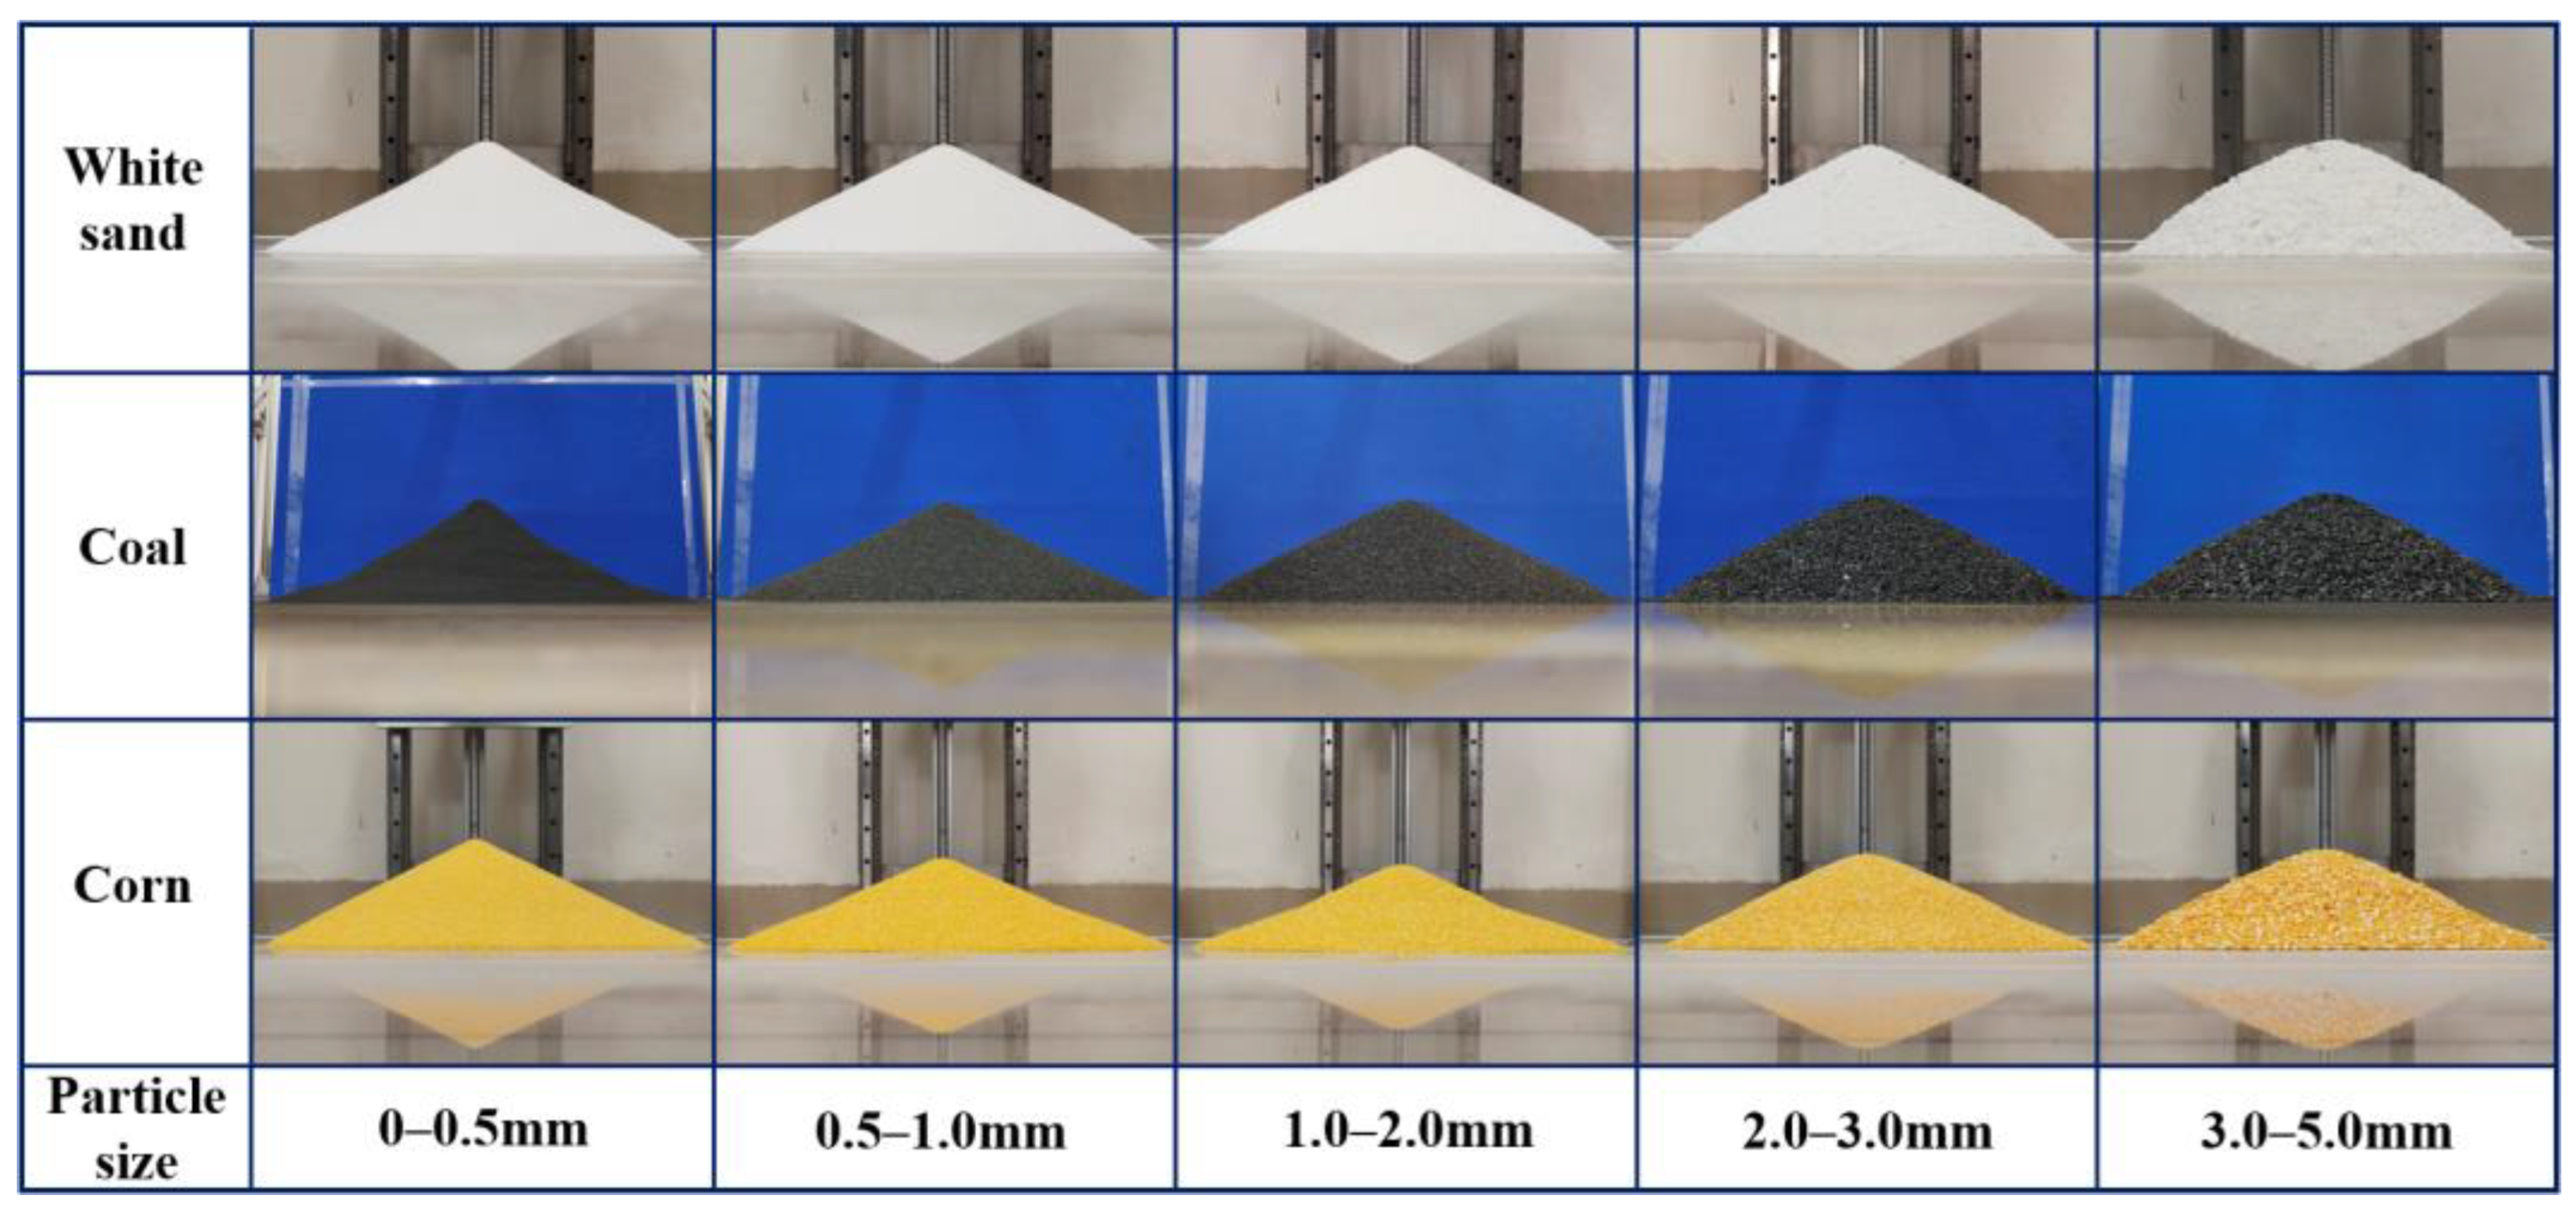
After determining the stacking locations, the next step is to calculate the stacking volume at each location. The shape of an ideal stockpile is similar to a dome cone [17,18,19], while in reality, the shape of the stockpile is curved and in a non-standard geometry. Furthermore, the adjacent stockpiles overlap with each other during stacking. Thus, it is difficult to calculate the stacking volume mathematically. To model the curved stockpiles, white sand, coal, and corn having five different particle size distributions are used for material stacking experiments. The contour curves of different particle sizes of the same material and the contour curves of the same particle size of different materials are compared, as shown in Figure 3. The actual shapes of the stockpiles are created according to the experiments in SolidWorks, after which the stacking volumes can be calculated subsequently.
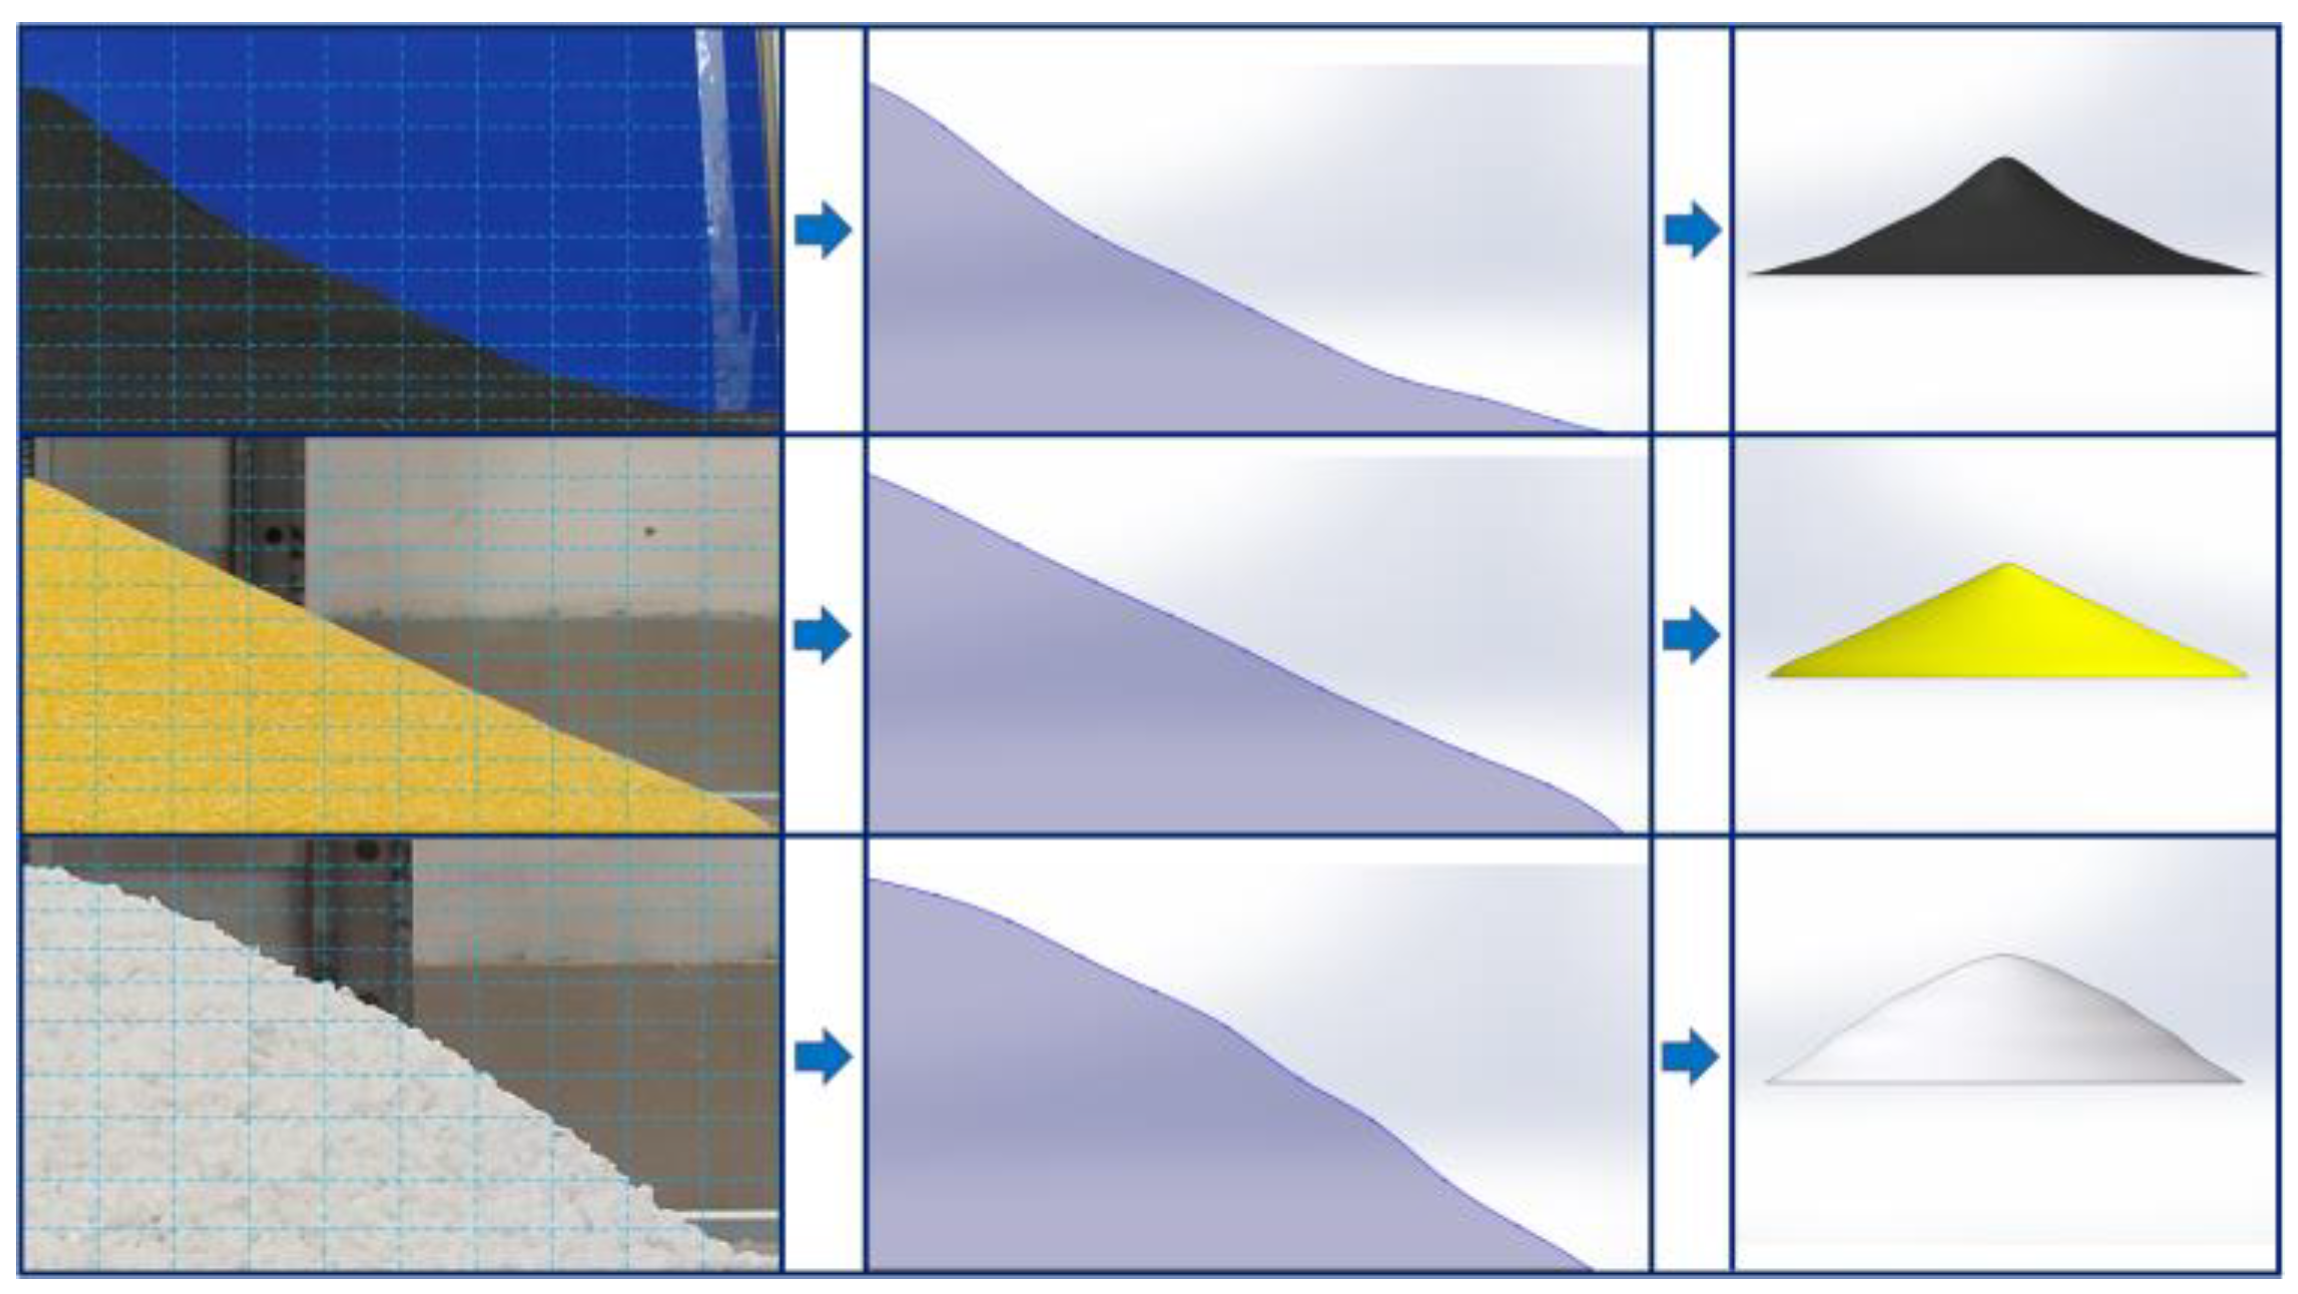
It can be observed from the experiment results that the bulk solids form different stockpile shapes with the variations of bulk solid types and particle sizes. Further analysis shows that the stockpile contours can be divided into three types of curves, namely the concave curve, straight curve, and convex curve, as shown in Figure 4, showing large volume deviations to the ideal stockpiles in which the slope lines are assumed to be straight.
In order to replicate the actual stockpile shape, a series of vertical lines with a fixed spacing along the horizontal direction are generated to intersect the contour curve of the stockpile, as shown in Figure 5. By connecting the intersections, the cross section of the stockpile can be obtained. Thus, the 3D model of the stockpile is established by rotating the cross section in SolidWorks to accurately simulate the actual contour shape of stockpile.

3. Determination of Stacking Volume and Algorithm Optimization

The total volume of bulk solids loaded into a ship cabin is the sum of the stacking volume of the bulk solids stockpile at each location. By retaining the curved shape and adjusting the bottom radius, each stockpile is scaled until the difference between the sum of the stockpile volumes at all locations and the total volume of bulk solids to be stacked is within the allowable range. Due to the overlaps among the stockpiles, the stacking volume at each location is calculated by subtracting the overall bulk solids volume at the previous stacking location from that at the current stacking location. This calculation is repeated to calculate the bulk solids volume at each stacking location. In the process mentioned above, the determination of the bottom radius of the bulk solids stockpile requires a large number of repeated iterative calculations, so it is necessary to select an appropriate algorithm to simplify the calculation steps and shorten the calculation time.
The absolute value of the difference between the total volume of the model and the total volume of bulk solids to be stacked is taken as the objective function. When the objective function value is zero, the bottom radius of the stockpile model is the optimal solution. When the radius value is less than the optimal solution, the objective function decreases monotonically; when the radius value is greater than the optimal solution, the objective function rises monotonically. Therefore, the search process of model volume is refined as an unconstrained single valley optimal solution problem [20].
According to the size of the yard, the advance and retreat method is used to preliminarily determine the range of the radius value. The advance and retreat method is an optimization algorithm commonly used to determine the search space [21]. Then, the preliminarily determined interval is divided by the golden section method [22,23] to obtain the optimal solution.
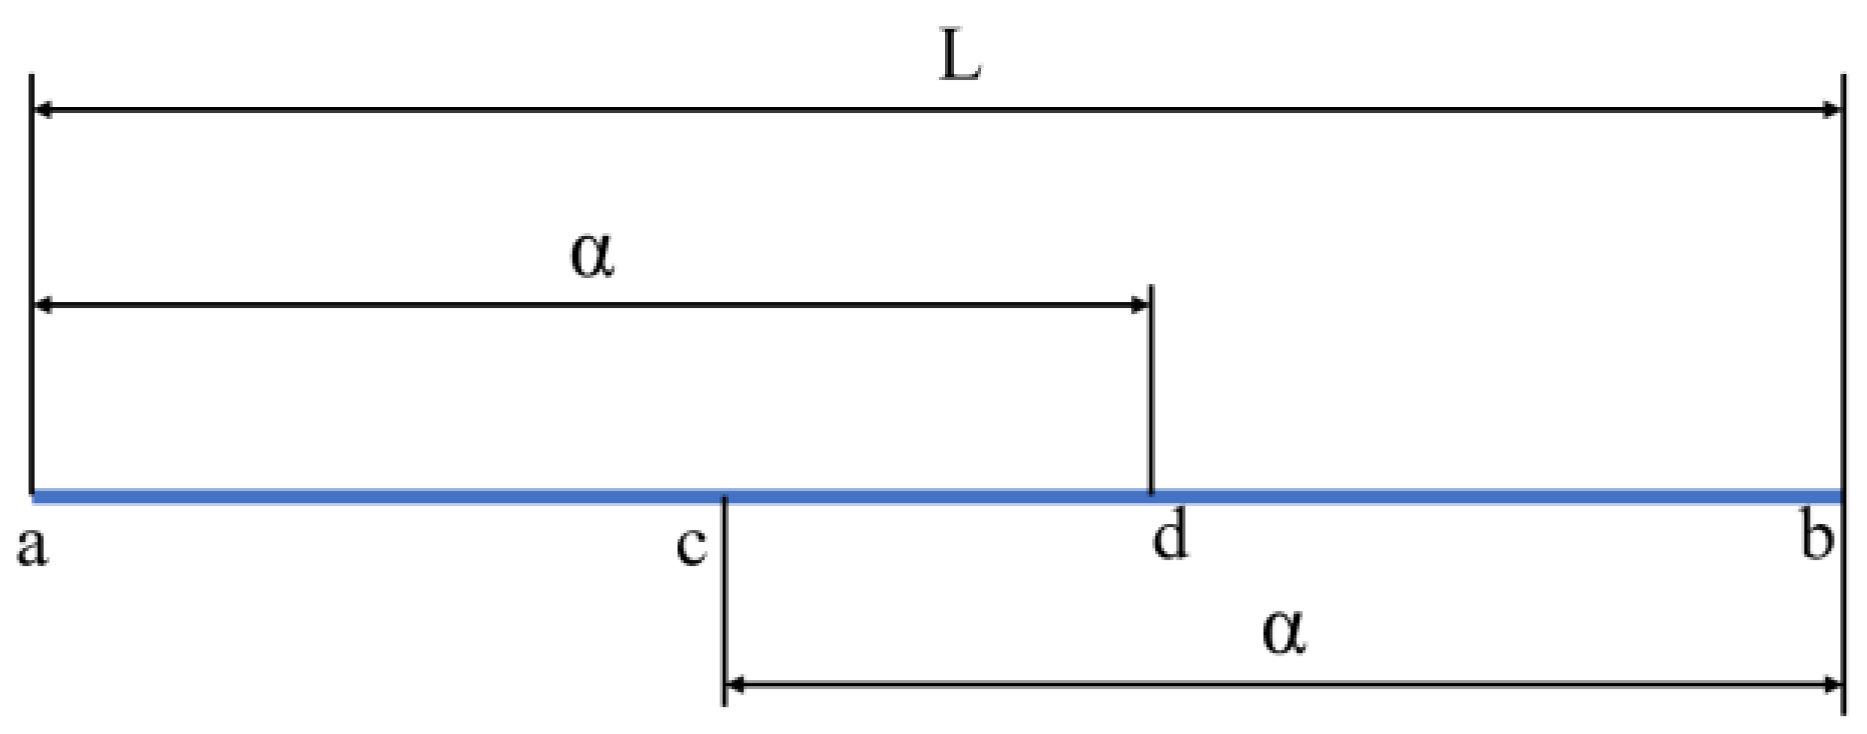
The basic principle of the golden section method is shown in Figure 6. The length of the interval [a, b] is set as “L”, and a point “d” in the interval is taken to ensure the distance between “a” and “d” is equal to “α”. If the ratio of “ad” to “ab” is equal to the ratio of “db” to “ad”, then:
α L = L α α α 0.618 L
Therefore, the interval is segmented using the value 0.618 in the golden section method, and a point “c” and point “d” are obtained, respectively.
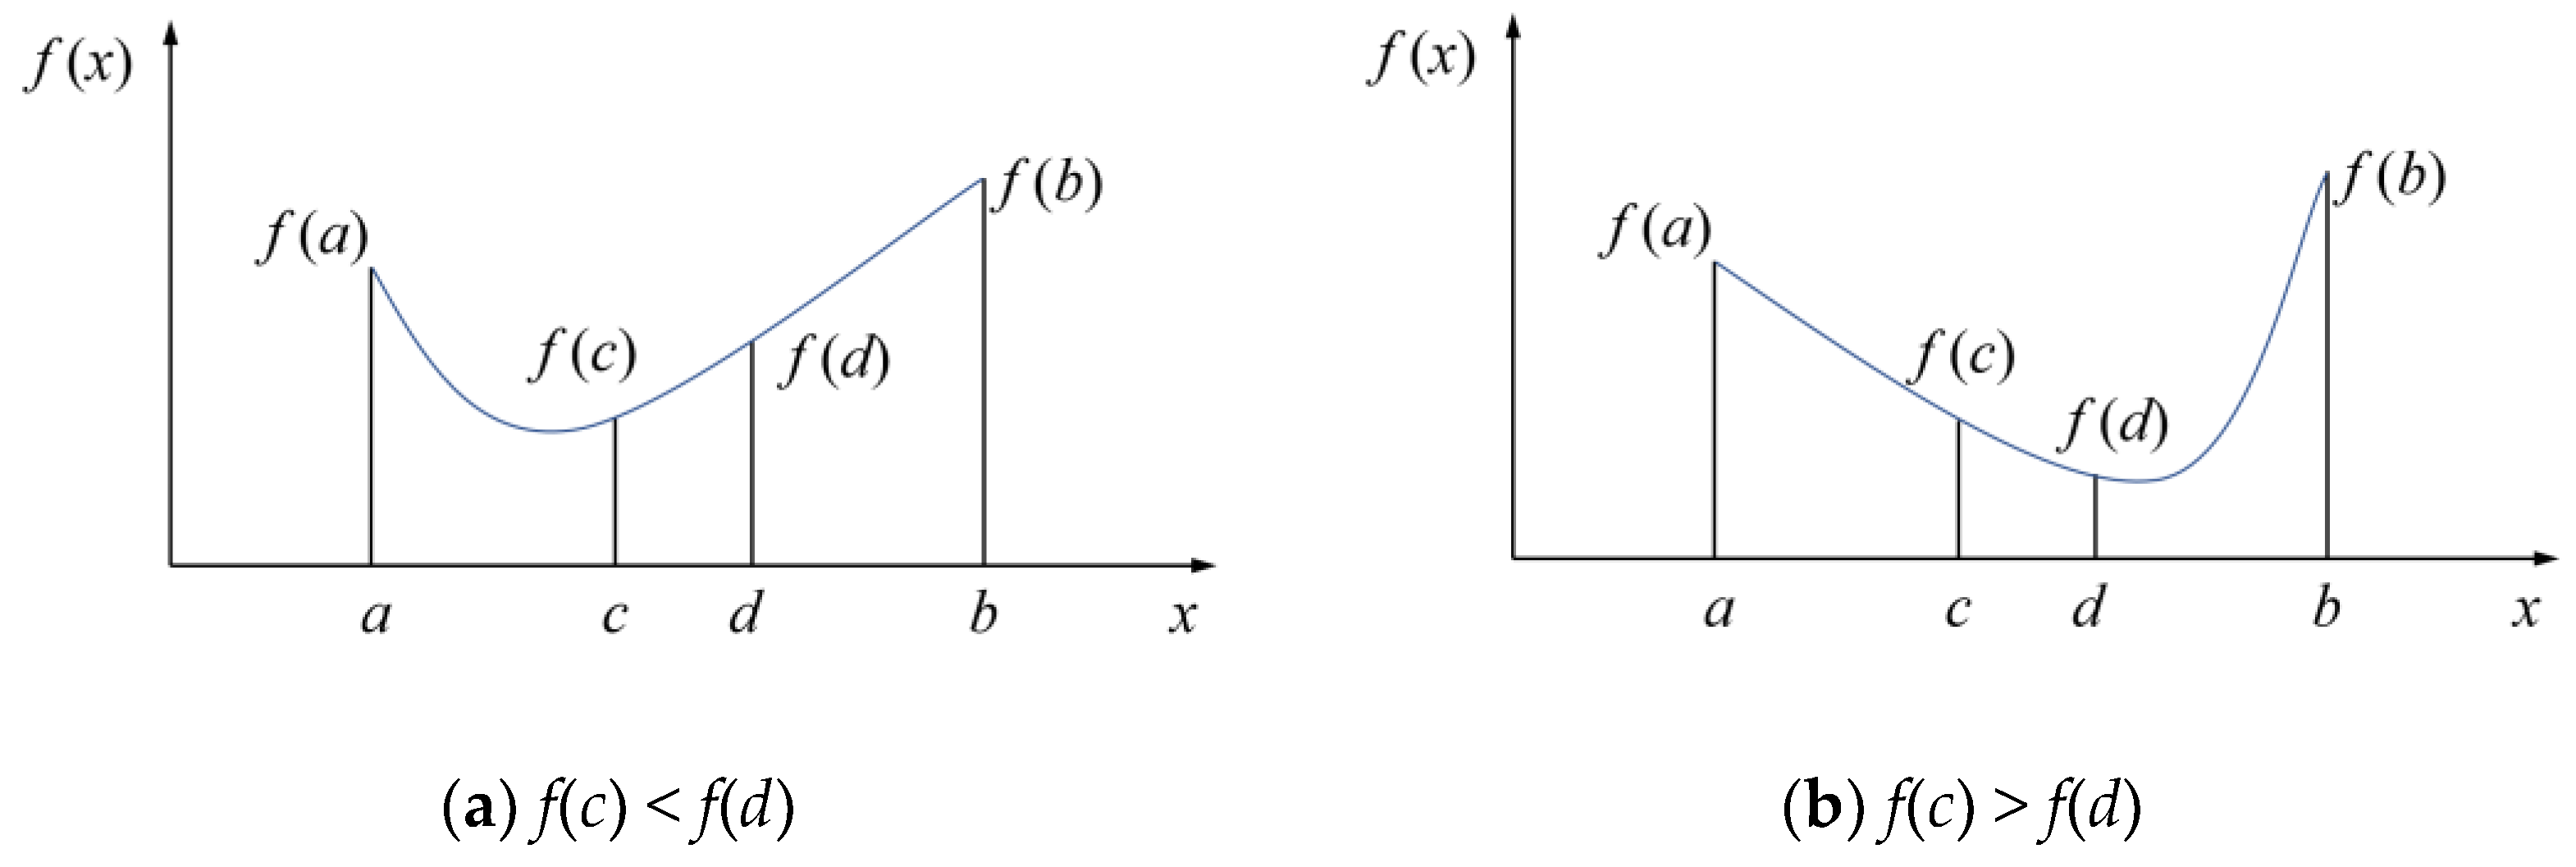
The function values corresponding to the point “c” and point “d” are compared in the unimodal interval [a, b]. If the function value corresponding to the point “c” is less than that of the point “d”, as shown in Figure 7a, the interval [b, d] is discarded and the interval [a, d] is retained to search for the optimal value. If the function value corresponding to point “c” is greater than that of point “d”, as shown in Figure 7b, the interval [a, c] is discarded and the interval [c, b] is retained to search for the optimal value.
The golden section method is capable of finding the optimal solution of the single valley function. In the iterative calculation process, the golden section method can ingeniously set each division point as the next golden section point and reuse the result of the last operation, thereby simplifying the calculation. Compared with dichotomy [24], it has a higher efficiency in solving extreme value problems of unimodal functions. To accelerate the search step, a self-influence factor was added to reduce the number of searches during searching.
The value range of the cone radius of the stacking model is set as [a, b], and the absolute value of the difference between the volume of the stacking model and the actual volume is set as the objective function F(x). The solution steps are as follows:
(1)
To find the minimum value in the interval [a, b], let x 1 = a + 0.382 ( b a ) , x 2 = b 0.382 ( b a ) , and compare the size of F(x1) and F(x2).
(2)
If F(x1) > F(x2), then remove the interval [a, x1], let c = x 1 , and accelerate the new interval [c, b]; let x 1 = a + 0.382 λ k ( b c ) , k is the acceleration trend, and λ is the acceleration iterations. After acceleration, if x1 < x2, cancel the acceleration.
(3)
If F(x1) < F(x2), then remove the interval [x2, b], let c = x 2 , and accelerate the new interval [a, c]; let x 2 = b 0.382 λ k ( b c ) , k is the acceleration trend, and λ is the accelerate iterations. After acceleration, if x1 > x2, cancel the acceleration.
According to the idea of self-influence factor in the particle swarm algorithm [25,26,27], the improved golden section method can avoid unnecessary iterations when the valley of the curve is too close to the endpoint of the interval; thus, that it can reduce the number of calculations in the modeling process and the modeling time and improve the operation efficiency of the system.
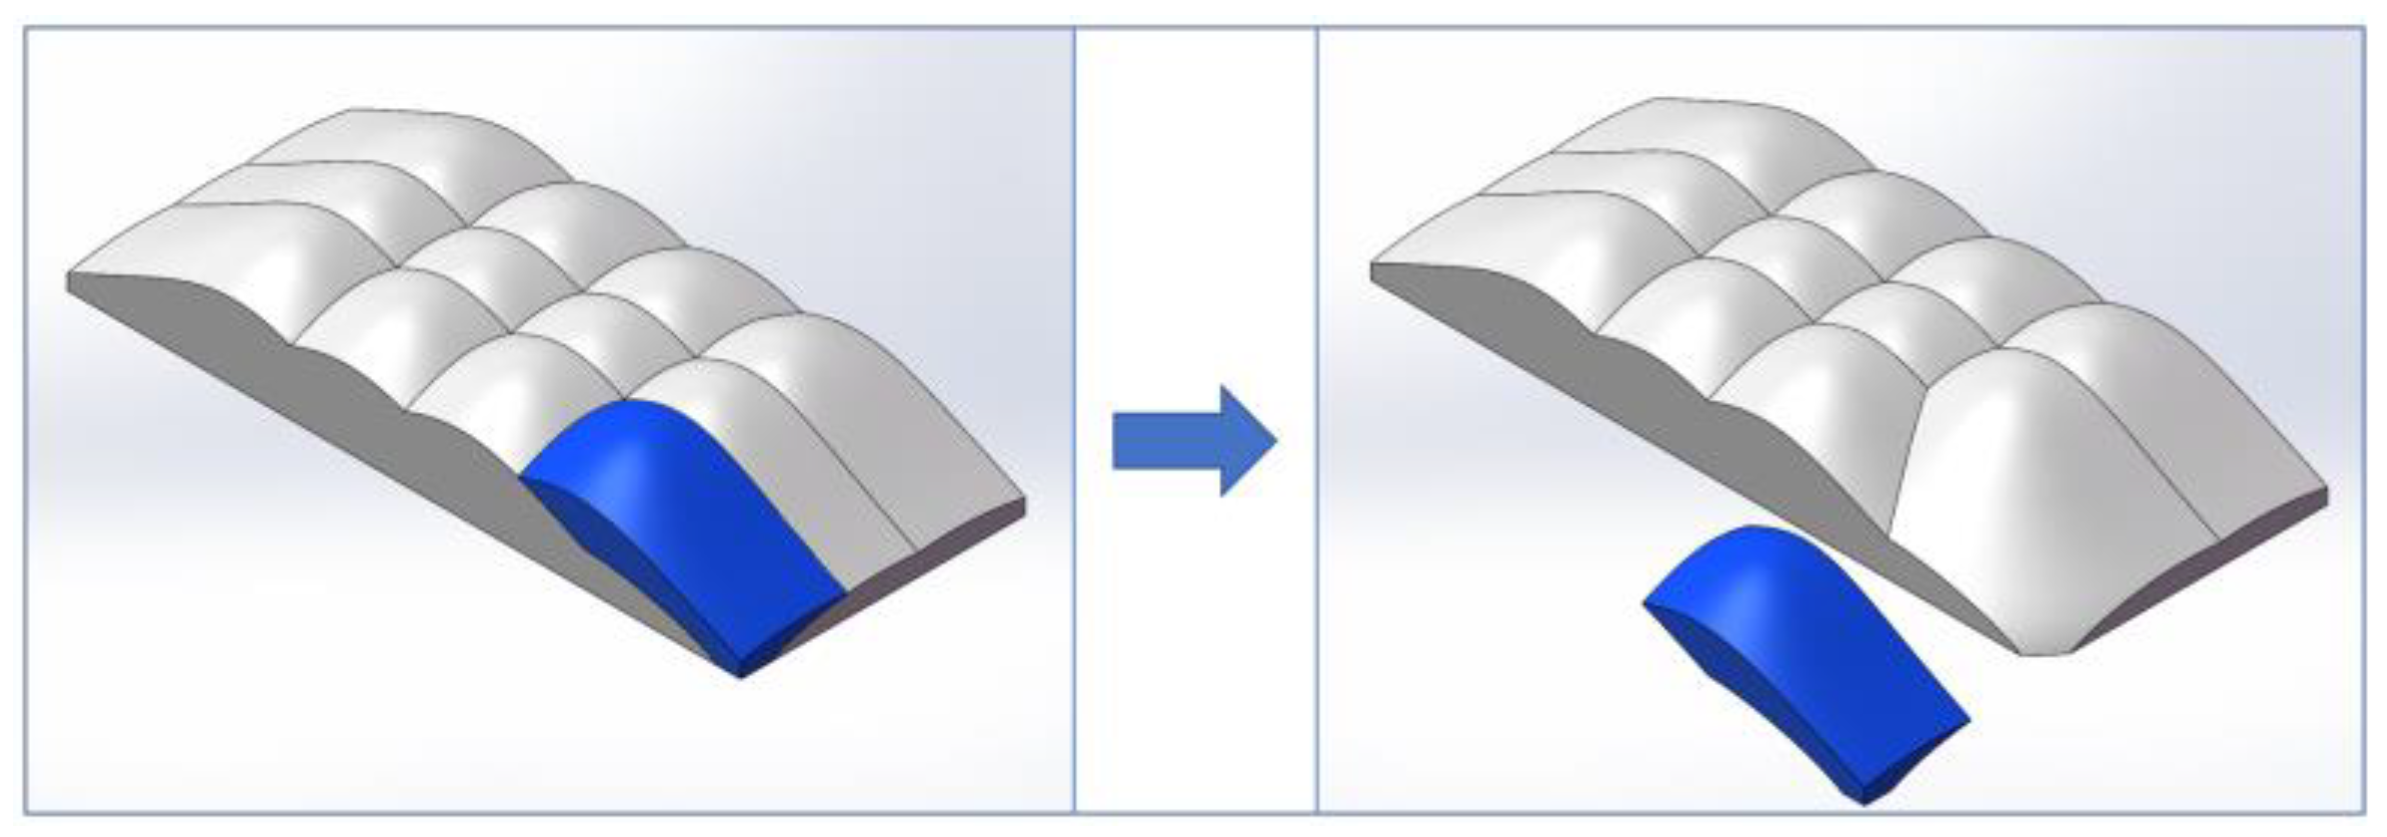
After the optimal solution of the cone radius of the stacking model was determined, the corresponding stacking model was established. The three-dimensional model is shown in Figure 8. After the optimal bulk volume is obtained, the stacking volume of each stacking location is extracted according to the stacking route. Based on the parameters of the overall model, the model corresponding to the stacking location is first subtracted from the model of the previous stacking location, and the stacking volume of the corresponding stacking location is extracted. By repeating this process, the planned stacking volume of each stacking location is obtained.

4. Experimental Verification and Analysis

4.1. Construction of Experimental Platform

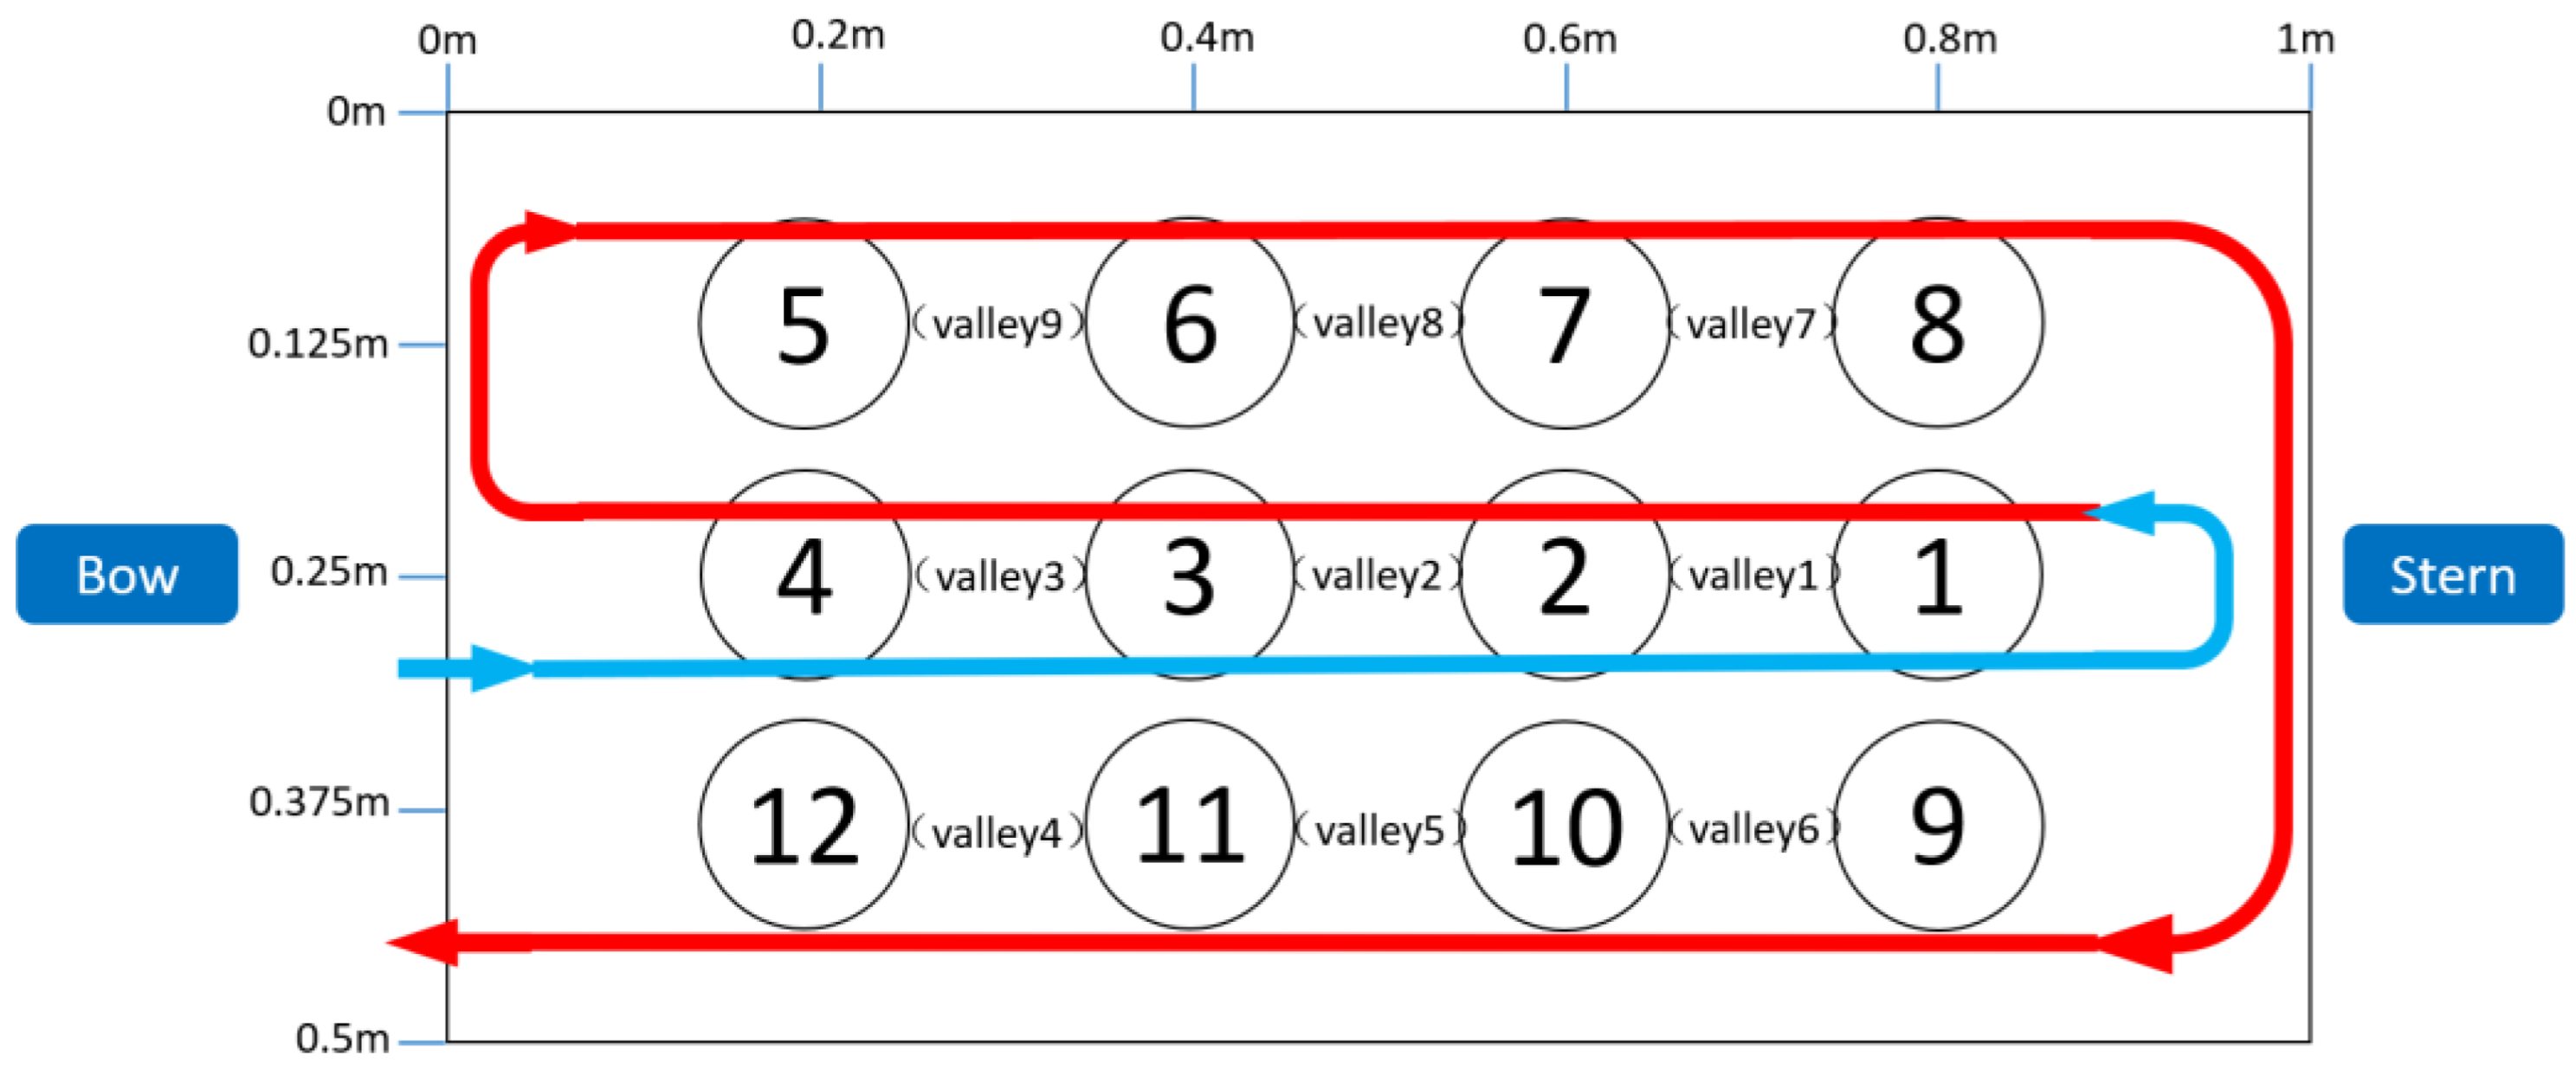
A rectangular single cabin model was used to perform scaled tests. The sequence of stacking locations is shown in Figure 9. In order to verify the applicability of the proposed stacking strategy, various bulk solids including resin particles, volcanic stone particles, corn, soybean and unhusked rice were selected as experimental materials. Through the stacking experiment, the contour curve of the stockpile was extracted and the three-dimensional model was established. The total mass and density of each material were determined as the calculation data. The optimal stacking model was calculated by the improved golden section method, and the stacking volume related to each stacking location was calculated. The test rig geometries and material parameters are shown in Table 1. The stacking locations of the first layer started from the middle of the bow, and the material was dropped at the four points of 0.2 m, 0.4 m, 0.6 m, and 0.8 m in sequence. The stacking locations of the second layer returned from the middle of the stern, and the material was dropped at the positions of 0.8 m, 0.6 m, 0.4 m, and 0.2 m. Then, the sequence moved to the side of the cabin 0.125 m away from the middle position and dropped materials at the four points of 0.2 m, 0.4 m, 0.6 m, and 0.8 m, and finally moved to the other side of the cabin 0.125 m away from the middle position and dropped materials at the four points of 0.8 m, 0.6 m, 0.4 m, and 0.2 m. The first layer of bedding materials accounted for 30% of the total, and the second layer accounted for 70% of the total.
The peak and valley heights of a pile are shown in Figure 10. The peak height was determined by subtracting the measured distance between the cabin top edge and the pile peak from the measured distance between the cabin top edge and the stockpile bottom. The valley height can be calculated in a similar way.

4.2. Analysis of Experimental Results

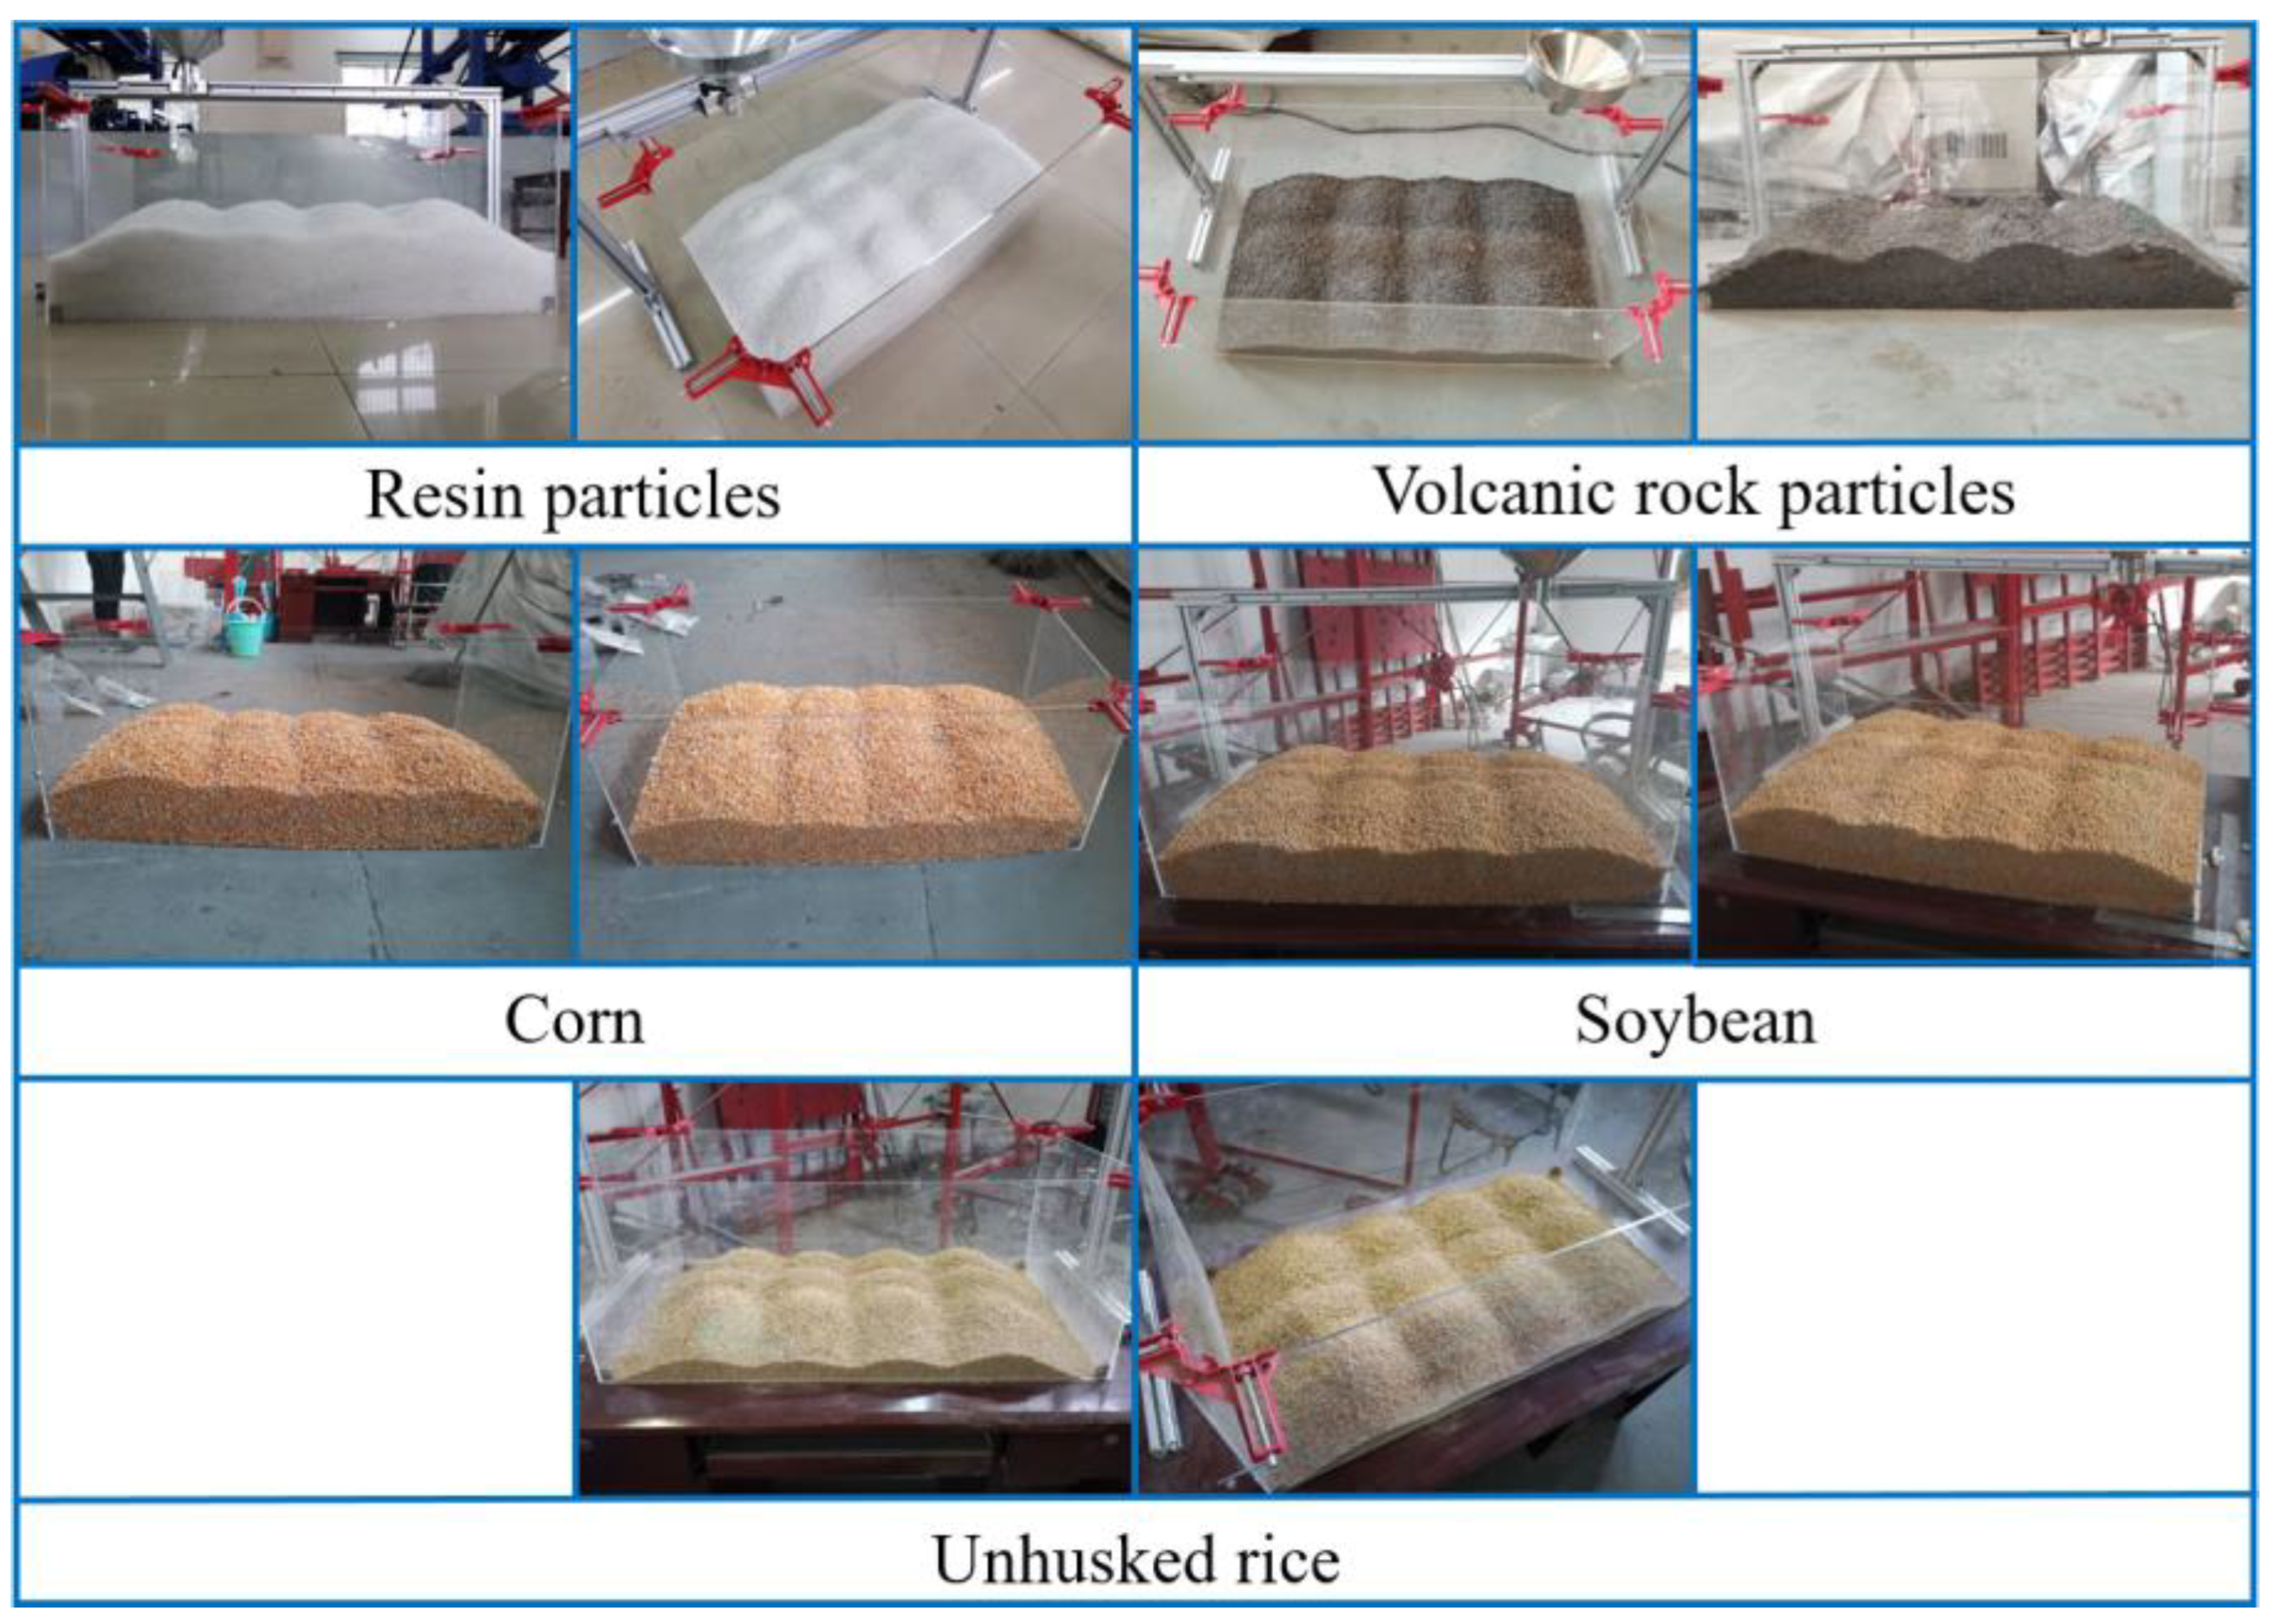
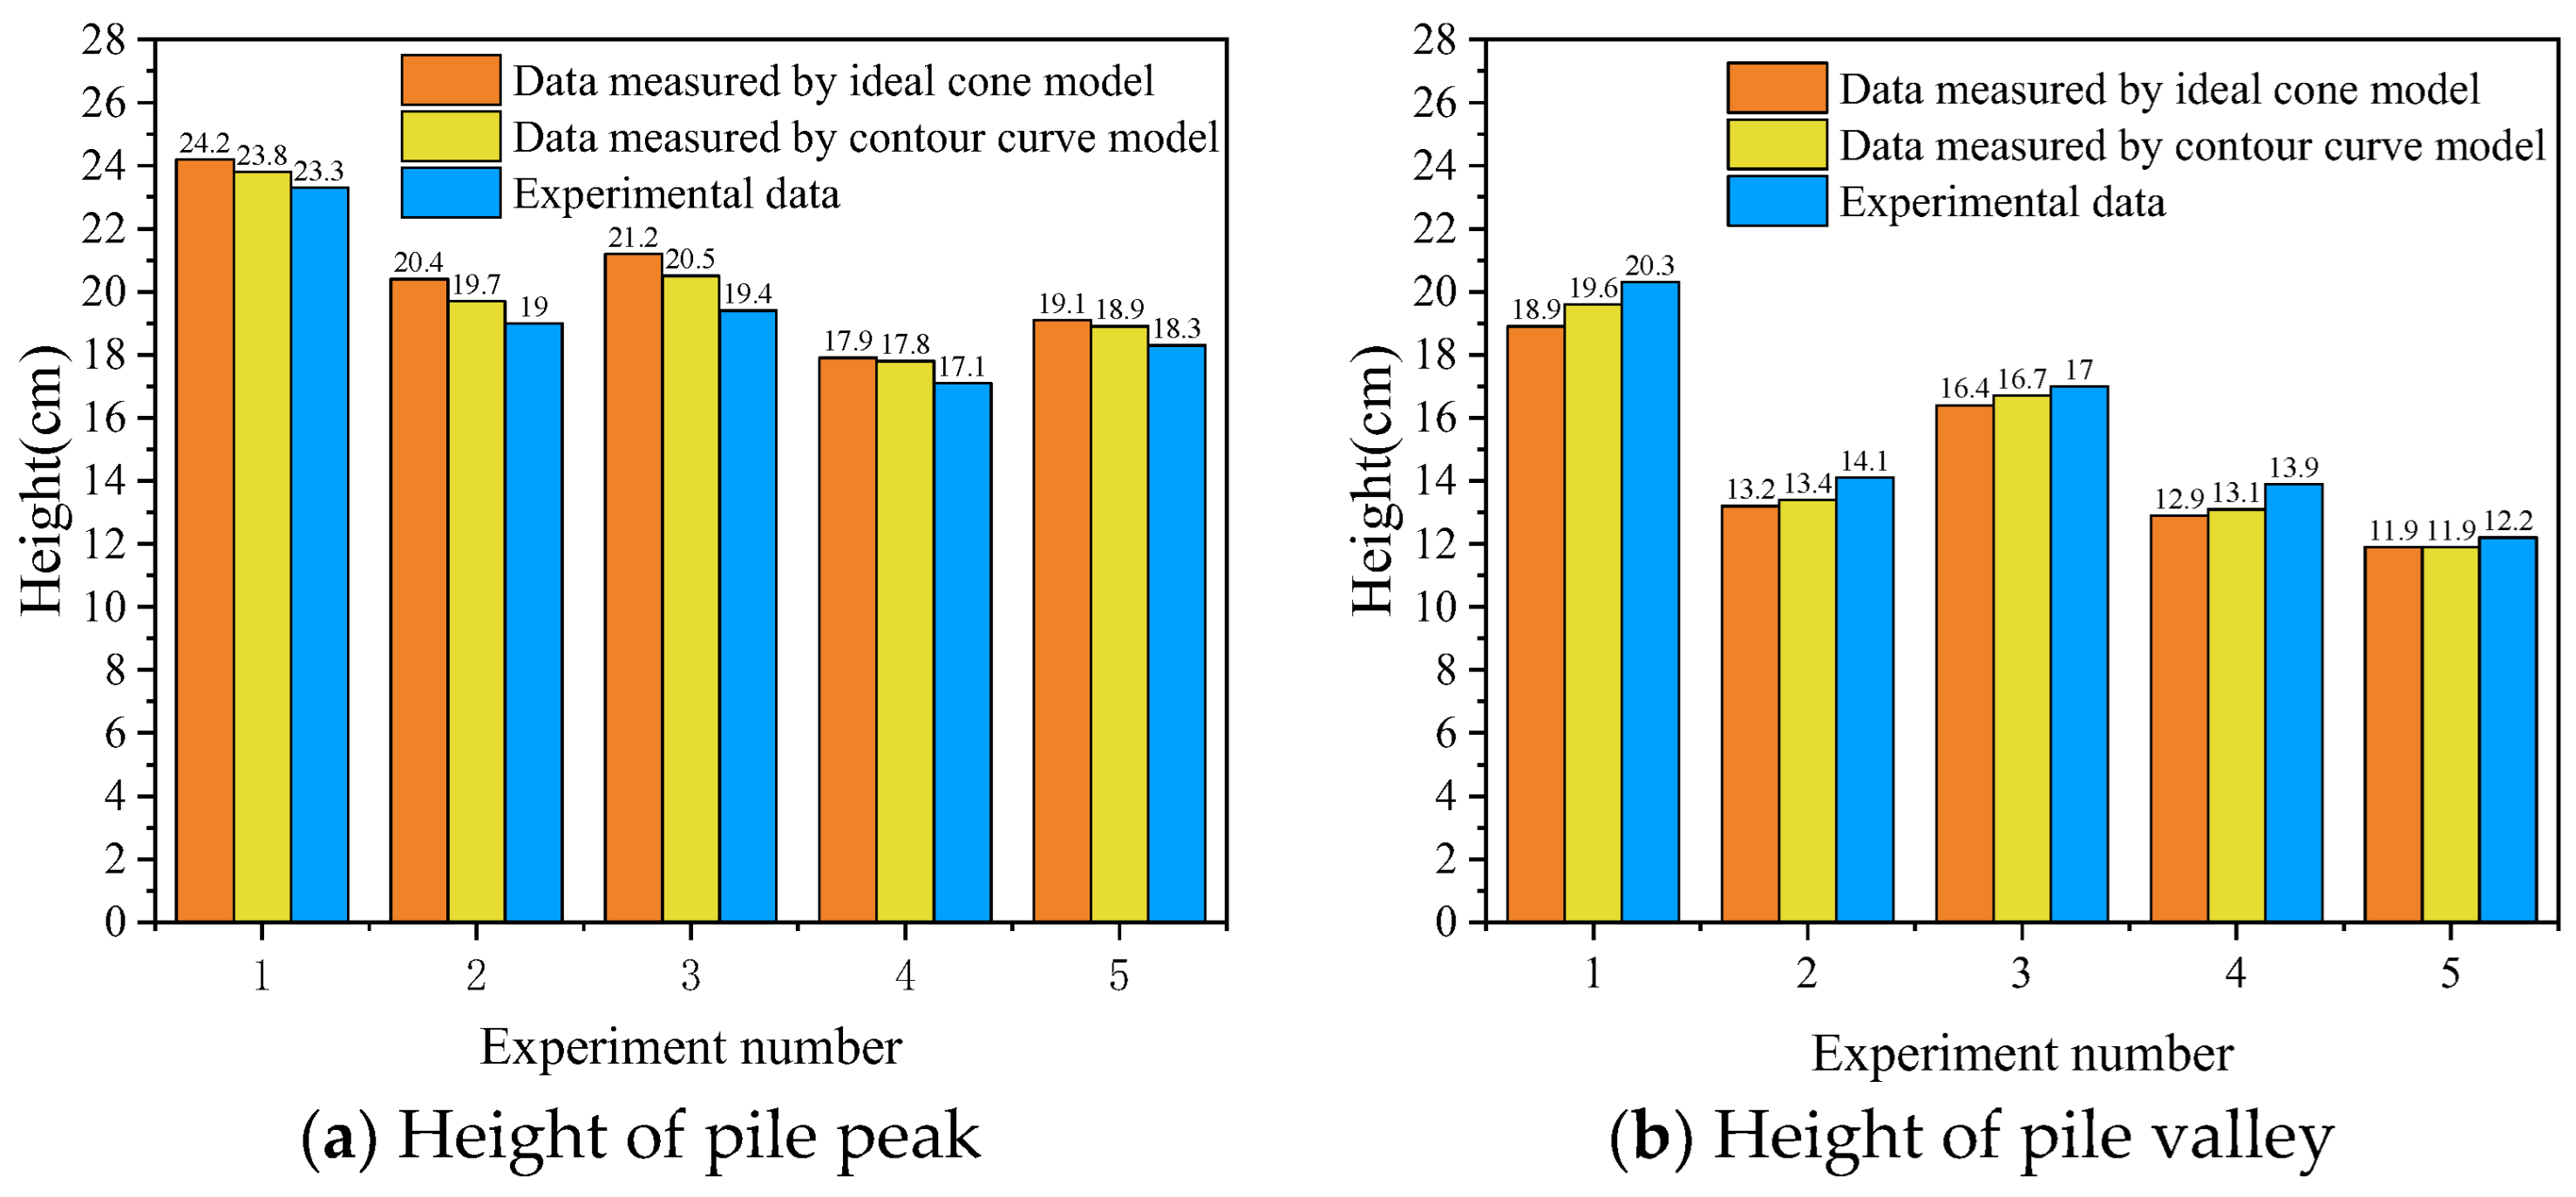
The experimental results of the five materials are shown in Figure 11. The height data of pile peak and pile valley measured by ideal cone model, contour curve model, and experimental results are compared, as shown in Figure 12. It can be observed that compared with the ideal cone model, the measured data of the model established by the contour curve were closer to the experimental measurements, which could more accurately simulate the actual stacking situation. Furthermore, the average peak heights measured in the experiment were less than the peak heights predicted by the three-dimensional model, while the average valley heights measured in the experiment were greater than the predicted valley height. This is because the bulk solids falling from a high location will push the stockpile at the stacking location farther and allow them to roll down from the pile peaks to the pile valleys and the sides of the box. On the other hand, due to the low mass and easy flow properties of the materials used in the experiment, the particles could not form an ideal cone, leading to smaller actual pile peak heights and greater actual pile valley heights than the theoretical values.
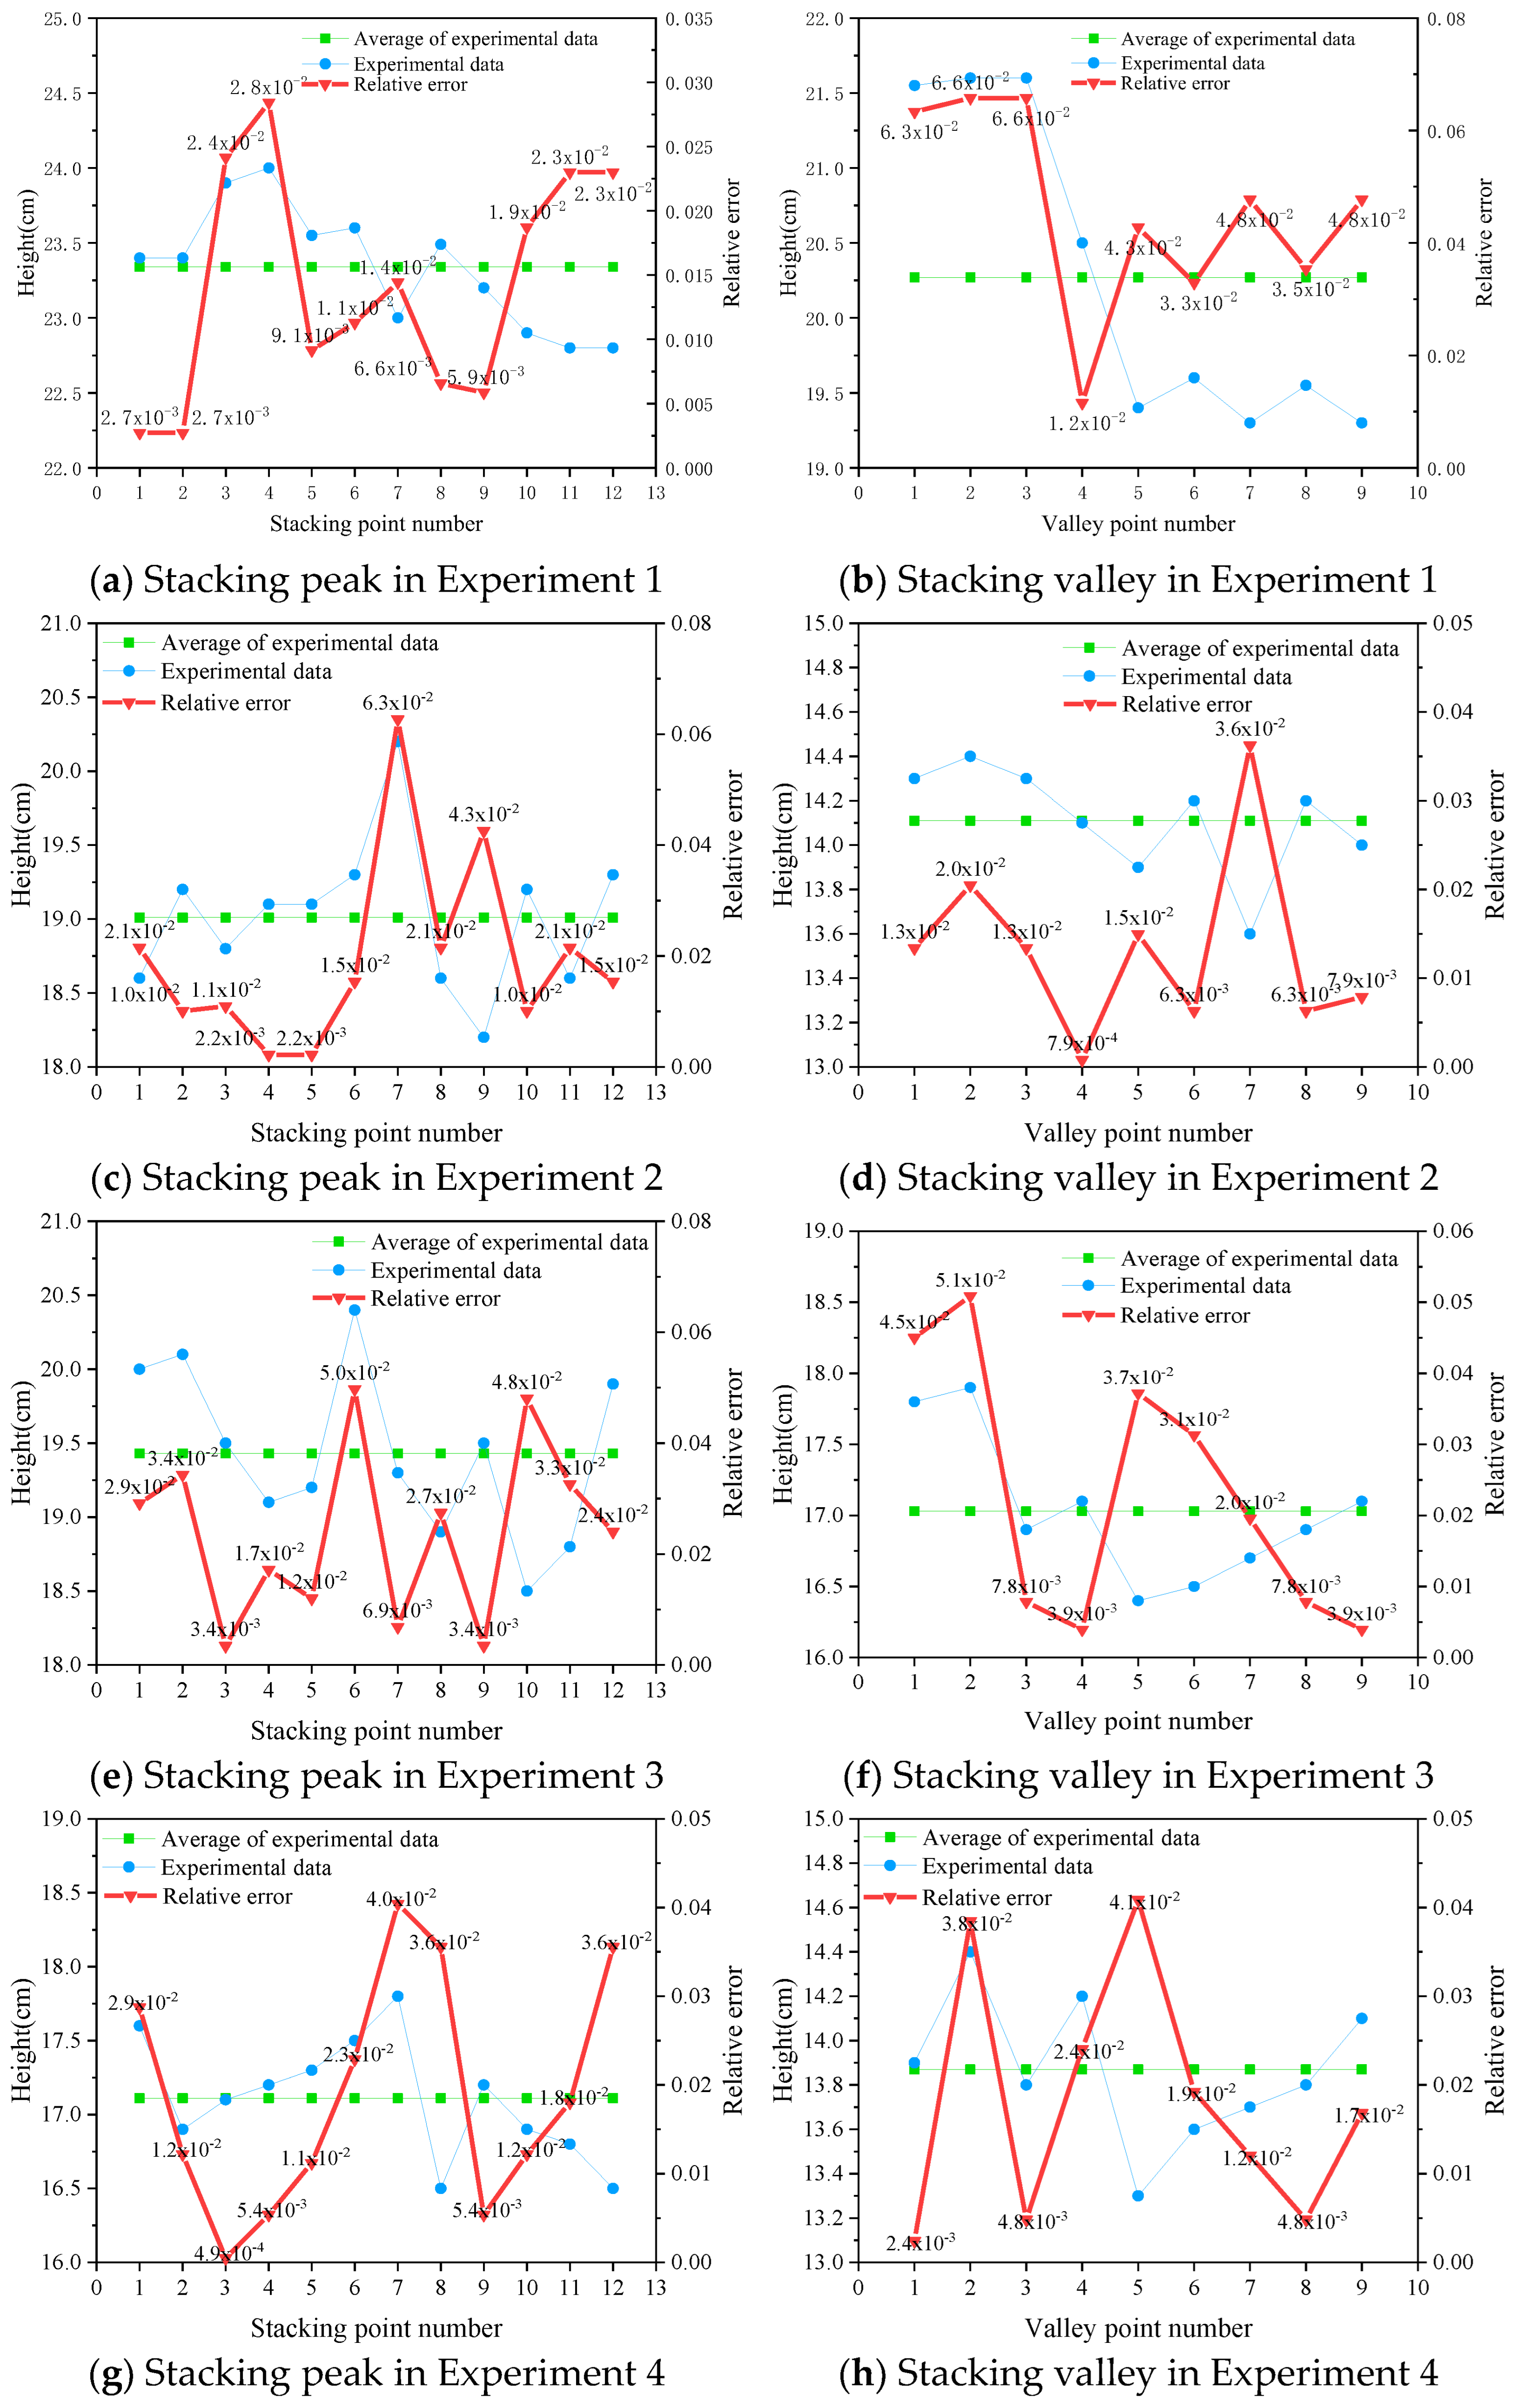
The flatness analysis of the peaks and valleys of each group of experiments is shown in Figure 13a–j. The experimental data of the pile peaks and the pile valleys were averaged, and the average values of the relative errors were calculated for the resin particles, volcanic rock particles, corn particles, soybean particles, and unhusked rice particles. The maximum relative errors of the peak height were 2.8%, 6.2%, 4.9%, 4.0%, and 3.1%, respectively, while the maximum relative errors of the valley height were 6.6%, 3.6%, 5.1%, 4.1%, and 5.6%, respectively. The relative error of the peak and valley heights of each group was averaged within 5%. Therefore, the heights of the pile peaks and valleys measured experimentally had only small fluctuations in a small range, indicating good stacking flatness.
In conclusion, the pile peaks and valleys from the experiments showed good flatness and smaller height differences between the pile peaks and valleys compared with the simulations. Therefore, the experiment achieved the expected balance and flat stacking effect. Moreover, similar effects were obtained for different materials. The experimental results showed that the stacking strategy adopted in this paper had a good agreement, showing high accuracy with the actual bulk solids stacking. In addition, the developed model was capable of stacking various materials.

5. Conclusions

Aiming at the problem of uneven stacking of bulk solids in a rectangular ship cabin, this paper proposes a stacking strategy to achieve flat stacking of bulk solids. An improved algorithm is developed to improve the computational efficiency of the stockpile volume at each stacking location for optimal flatness. Furthermore, experiments are conducted to verify the proposed stacking strategy. The main findings can be concluded as follows:
(1)
A stacking strategy is proposed for the flat stacking of bulk solids in which the stacking locations and the shape and volume of the stockpile at each location are considered to accurately model the actual stacking profile of the bulk solids during operation.
(2)
An improved golden section algorithm is adopted for the calculation of the bulk solids stockpile at each stacking location. The search interval of the stockpile radius aiming at flat stacking is preliminarily determined by the advance and retreat method. A self-influence factor is introduced to golden section algorithm to improve the searching speed of the optimal stockpile radius and the related stockpile volume.
(3)
The proposed stacking strategy is verified by bulk solids stacking experiments. The flatness of the stockpile is evaluated by the relative error of the heights of the pile peaks and pile valleys relative to their average heights. For five different materials tested, the average relative errors are within 5%, indicating the effectiveness and applicability of the stacking strategy.

Author Contributions

Conceptualization, J.Y. (Jianming Yuan) and D.L.; methodology, J.Y. (Jianming Yuan) and J.S.; software, D.L. and J.Y. (Jiahao Yan); experiment, D.L. and J.Y. (Jiahao Yan); investigation, J.Y. (Jianming Yuan), J.S. and C.X.; data curation, D.L. and J.S.; writing—original draft preparation, J.Y. (Jianming Yuan), D.L. and C.X.; writing—review and editing, J.Y. (Jianming Yuan), D.L., C.J., J.S., J.Y. (Jiahao Yan) and C.X. All authors have read and agreed to the published version of the manuscript.

Funding

The authors gratefully acknowledge the financial support from Hainan Institute at Wuhan University of Technology (Research Grant No. 2021KF0028).

Institutional Review Board Statement

Not applicable.

Informed Consent Statement

Not applicable.

Data Availability Statement

Data are contained within the article.

Conflicts of Interest

The authors declare no conflict of interest.

References

  1. Angelelli, E.; Kalinowski, T.; Kapoor, R.; Savelsbergh, M.-W.-P. A reclaimer scheduling problem arising in coal stockyard management. J. Sched. 2016, 19, 563–582. [Google Scholar] [CrossRef] [Green Version]
  2. Kalinowski, T.; Kapoor, R.; Savelsbergh, M.W.P. Scheduling reclaimers serving a stock pad at a coal terminal. J. Sched. 2017, 20, 85–101. [Google Scholar] [CrossRef]
  3. Ünsal, Ö. Reclaimer scheduling in dry bulk terminals. IEEE Access 2020, 8, 96294–96303. [Google Scholar] [CrossRef]
  4. Pang, X.S.; Su, Z.R. Bulk Unloading Crane Monitoring System’s Design and Development Based on Kingview. Appl. Mech. Mater. 2013, 423, 2431–2434. [Google Scholar]
  5. Xue, Y.T.; Branch, G. Design of Unmanned Intelligent Shipping System for Bulk Cargo Based on Quantitative Measurement. Port Oper. 2019, 4, 50–52. [Google Scholar]
  6. Sun, D.F.; Meng, Y.; Tang, L.X.; Liu, J.Y.; Huang, B.B.; Yang, J.F. Storage space allocation problem at inland bulk material stockyard. Transp. Res. Part E Logist. Transp. Rev. 2020, 134, 101856. [Google Scholar] [CrossRef]
  7. Tang, L.X.; Sun, D.F.; Liu, J.Y. Integrated storage space allocation and ship scheduling problem in bulk cargo terminals. IIE Trans. 2016, 48, 428–439. [Google Scholar] [CrossRef] [Green Version]
  8. Tang, X.Y.; Jin, J.G.; Shi, X.N. Stockyard storage space allocation in large iron ore terminals. Comput. Ind. Eng. 2022, 164, 107911. [Google Scholar] [CrossRef]
  9. Rekik, I.; Elkosantini, S. A multi agent system for the online container stacking in seaport terminals. J. Comput. Sci. 2019, 35, 12–24. [Google Scholar] [CrossRef]
  10. Gharehgozli, A.; Zaerpour, N. Stacking outbound barge containers in an automated deep-sea terminal. Eur. J. Oper. Res. 2018, 267, 977–995. [Google Scholar] [CrossRef]
  11. Maldonado, S.; González-Ramírez, R.G.; Quijada, F.; Ramírez-Nafarrate, A. Analytics meets port logistics: A decision support system for container stacking operations. Decis. Support Syst. 2019, 121, 84–93. [Google Scholar] [CrossRef]
  12. Abdul Rahman, N.S.F.; Ismail, A.; Lun, V.Y.H. Preliminary study on new container stacking/storage system due to space limitations in container yard. Marit. Bus. Rev. 2016, 1, 21–39. [Google Scholar] [CrossRef]
  13. Ambrosino, D.; Xie, H. Optimization Approaches for Defining Storage Strategies in Maritime Container Terminals. Soft Comput. 2022, 27, 4125–4137. [Google Scholar] [CrossRef]
  14. Einicke, G.A. High-Order Filtering of LIDAR Data to Assist Coal Shiploading. IEEE Trans. Aerosp. Electron. Syst. 2017, 53, 1481–1488. [Google Scholar] [CrossRef]
  15. Le Carrer, N.; Ferson, S.; Green, P.L. Optimising cargo loading and ship scheduling in tidal areas. Eur. J. Oper. Res. 2020, 280, 1082–1094. [Google Scholar] [CrossRef]
  16. Celik, E.; Akyuz, E. An interval type-2 fuzzy AHP and TOPSIS methods for decision-making problems in maritime transportation engineering: The case of ship loader. Ocean. Eng. 2018, 155, 371–381. [Google Scholar] [CrossRef]
  17. Schulz, D.; Schwindt, N.; Schmidt, E.; Kruggel-Emden, H. Modelling of dust emissions induced by flow over stockpiles and through packed beds. Particuology 2020, 59, 55–63. [Google Scholar] [CrossRef]
  18. Li, C.Z.; Honeyands, T.; O’Dea, D.; Moreno-Atanasio, R. The angle of repose and size segregation of iron ore granules: DEM analysis and experimental investigation. Powder Technol. 2017, 320, 257–272. [Google Scholar] [CrossRef]
  19. Al-Hashemi, H.M.B.; Al-Amoudi, O.S.B. A review on the angle of repose of granular materials. Powder Technol. 2018, 330, 397–417. [Google Scholar] [CrossRef]
  20. Huang, Z.H.; Miao, X.H. Optimization Calculation Method; Science Press: Beijing, China, 2015. [Google Scholar]
  21. Zhang, L.W.; Dan, F. Optimization Method; Science Press: Beijing, China, 2018. [Google Scholar]
  22. Kheldoun, A.; Bradai, R.; Boukenoui, R.; Mellit, A. A new golden section method-based maximum power point tracking algorithm for photovoltaic systems. Energy Convers. Manag. 2016, 111, 125–136. [Google Scholar] [CrossRef]
  23. Song, J.L.; Qian, F.C. The global optimization method based on golden-section. Comput. Eng. Appl. 2005, 48, 95–96. [Google Scholar]
  24. Zhang, G.Z.; Xiang, Y.H.; Guo, H.X.; Nie, Y.H. Structural reliability and its sensitivity analysis based on the saddle point approximation-line sampling method by dichotomy of golden section. Eng. Rev. 2019, 39, 11–20. [Google Scholar] [CrossRef]
  25. Xue, L.; Ling, X.; Yang, S.S. Mechanical behaviour and strain rate sensitivity analysis of ta2 by the small punch test. Theor. Appl. Fract. Mech. 2019, 99, 9–17. [Google Scholar] [CrossRef]
  26. Meng, S.; Kang, J.S.; Chi, K.; Die, X.P. Gearbox fault diagnosis through quantum particle swarm optimization algorithm and kernel extreme learning machine. J. Vibroeng. 2020, 22, 1399–1414. [Google Scholar] [CrossRef]
  27. Zhang, E.Z.; Chen, Q.W. Multi-objective reliability redundancy allocation in an interval environment using particle swarm optimization. Reliab. Eng. Syst. Saf. 2016, 145, 83–92. [Google Scholar] [CrossRef]
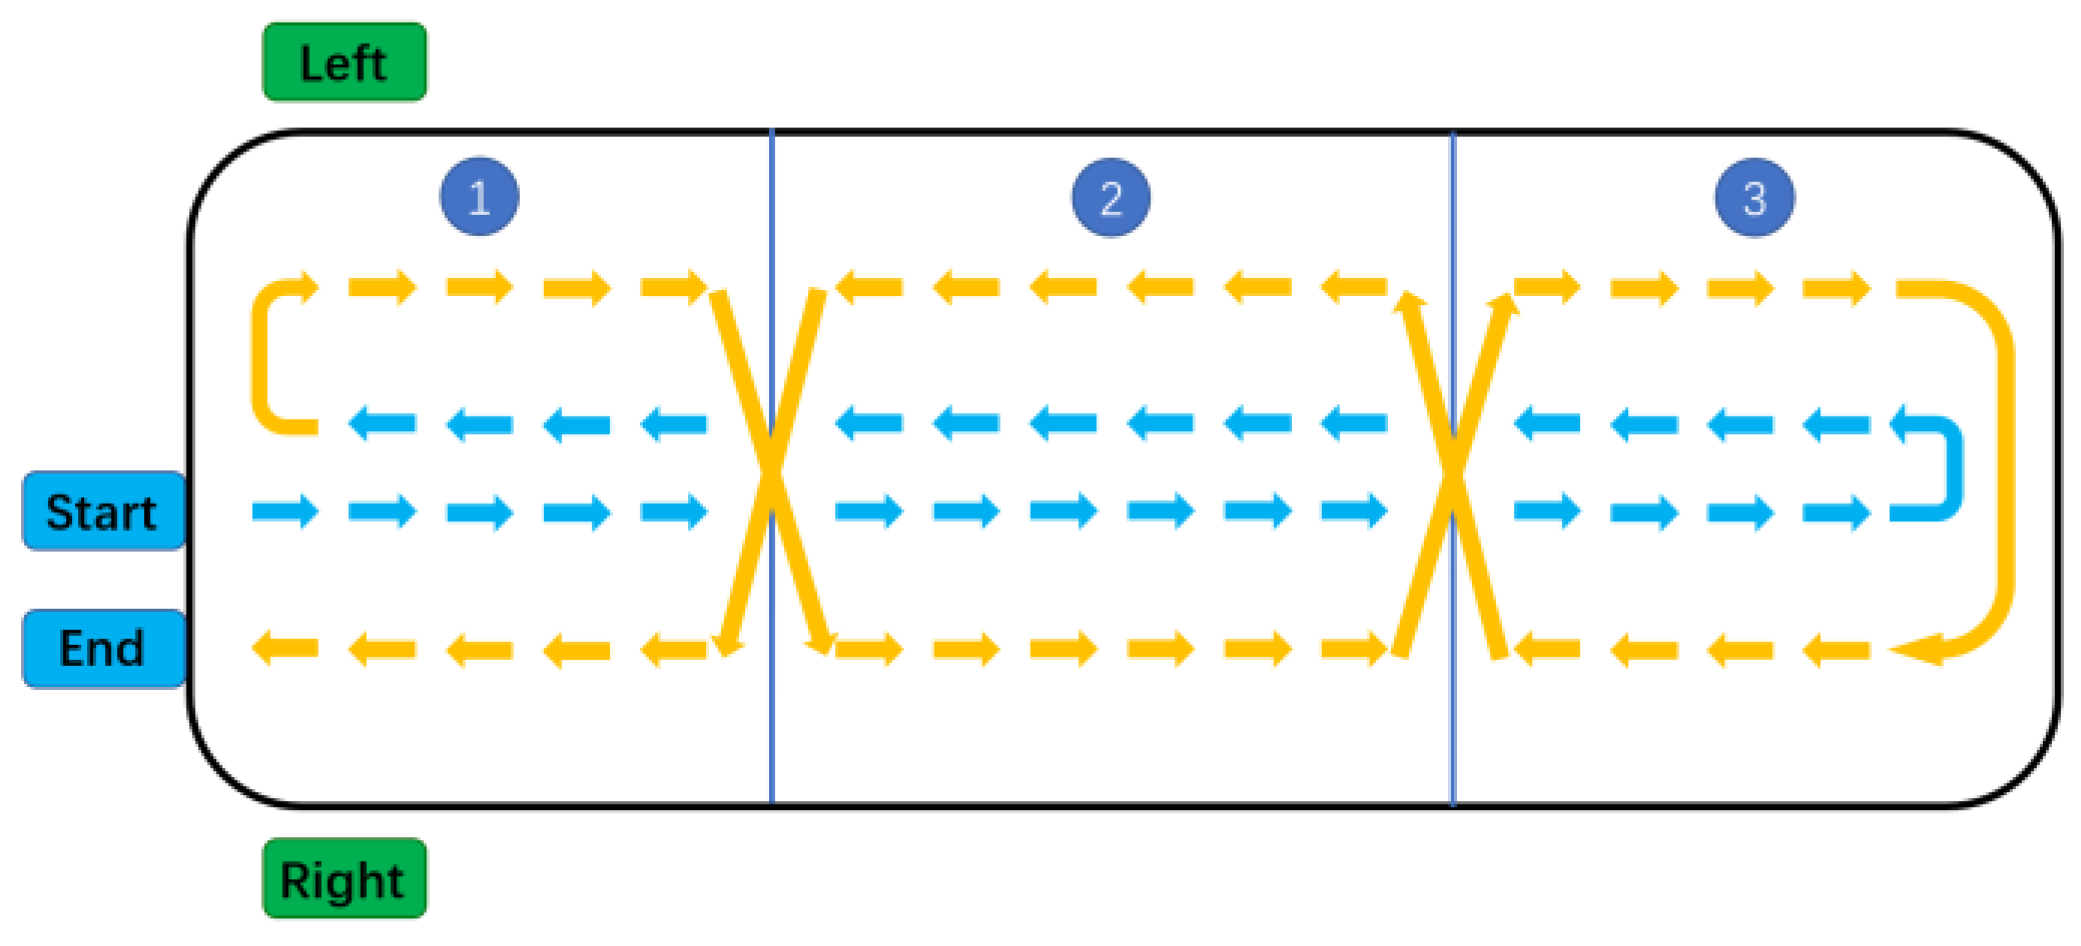
Figure 1. Walking route diagram of ship loader.
Applsci 13 03940 g001
Figure 2. Variation chart of different stacking points number in single rectangular cabin.
Applsci 13 03940 g002
Figure 3. Material stacking experiment.
Applsci 13 03940 g003
Figure 4. Schematic diagram of contour curve type of stockpile.
Applsci 13 03940 g004
Figure 5. Schematic diagram of contour curve extraction method.
Applsci 13 03940 g005
Figure 6. Interval division of the golden section method.
Applsci 13 03940 g006
Figure 7. Schematic diagram of the golden section method.
Applsci 13 03940 g007
Figure 8. The stacking model built by SolidWorks.
Applsci 13 03940 g008
Figure 9. Schematic diagram of stack position for bulk solids stacking experiment.
Applsci 13 03940 g009
Figure 10. Schematic diagram of peak height and valley height.
Applsci 13 03940 g010
Figure 11. Simulated stacking experiment of different materials.
Applsci 13 03940 g011
Figure 12. Comparison of experimental measurement data and algorithm modeling data.
Applsci 13 03940 g012
Figure 13. Flatness analysis results of experimental measurement data.
Applsci 13 03940 g013aApplsci 13 03940 g013b
Table 1. Record of experimental parameters.
Parameter (Unit)Value
MaterialsResin particlesVolcanic rockCornSoybeanUnhusked rice
Density (kg/m3)582942773750600
Weight (kg)56.25656557.520
Particle radius (m)2 × 10−33 × 10−34 × 10−32.5 × 10−32 × 10−3
Cabin size (m)1 × 0.5 × 0.41 × 0.5 × 0.41 × 0.5 × 0.41 × 0.5 × 0.41 × 0.5 × 0.4
Disclaimer/Publisher’s Note: The statements, opinions and data contained in all publications are solely those of the individual author(s) and contributor(s) and not of MDPI and/or the editor(s). MDPI and/or the editor(s) disclaim responsibility for any injury to people or property resulting from any ideas, methods, instructions or products referred to in the content.