Abstract
Scene text detection has become a popular topic in computer vision research. Most of the current research is based on deep learning, using Convolutional Neural Networks (CNNs) to extract the visual features of images. However, due to the limitations of convolution kernel size, CNNs can only extract local features of images with small perceptual fields, and they cannot obtain more global features. In this paper, to improve the accuracy of scene text detection, a feature enhancement module is added to the text detection model. This module acquires global features of an image by computing the multi-headed self-attention of the feature map. The improved model extracts local features using CNNs, while extracting global features through the feature enhancement module. The features extracted by both of these are then fused to ensure that visual features at different levels of the image are extracted. A shifted window is used in the calculation of the self-attention, which reduces the computational complexity from the second power of the input image width-height product to the first power. Experiments are conducted on the multi-oriented text dataset ICDAR2015 and the multi-language text dataset MSRA-TD500. Compared with the pre-improvement method DBNet, the F1-score improves by 0.5% and 3.5% on ICDAR2015 and MSRA-TD500, respectively, indicating the effectiveness of the model improvement.
1. Introduction
Text is an important tool for humans to express information. Textual content in images often contains rich and accurate high-level semantic information, which is an important cue for visual recognition. The task of text detection is to annotate the location coordinates of each text instance in the input image, which can be a single character location or an entire text line location. Scene text refers to text content that exists in any natural scenario. Scene text detection is difficult due to text diversity (text color, size, font, shape, orientation, language, length), complex backgrounds and interference (image distortion, blur, low resolution, shadow, luminance), and dense or even overlapping text. The text detection technology of scene images helps to obtain and analyze the scene content information, which can be applied to image retrieval, industrial automation, automatic driving, license plate ticket recognition, and other scenarios, and has high research value.
Current research [1,2,3] has usually used deep learning methods, such as CNNs, Recurrent Neural Networks (RNNs), and other network structures to learn from a large number of samples to automatically obtain the feature representation of the input data, and perform text detection based on the features. According to the characteristics of text detection models, a large number of scene text detection methods based on deep learning that have emerged so far can be classified into two types based on text region suggestion and image semantic segmentation. The text-region-proposal-based methods mainly apply classical object detection algorithms to text detection, such as RCNN (Region Proposal CNN) [4], SSD (Single Shot multi-box Detector) [5], R-FCN (Region-based Fully Convolutional Networks) [6], and YOLO (You Only Look Once) [7]. The method is also often referred to as a regression-based approach because it obtains text detection results by regressing the text box. This method works better for regular shape text detection, but it is often difficult to obtain smooth text wrap-around curves for solving curved text, and the model is more complex and does not have performance advantages. The methods based on image semantic segmentation have borrowed the ideas of classical semantic segmentation algorithms, such as FCNs (Fully Convolutional Networks) [8], FPNs (Feature Pyramid Networks) [9], and FCIS (Fully Convolutional Instance-aware Semantic Segmentation) [10]. This method predicts each pixel in the image and then obtains the minimum envelope curve of the text region through post-processing. This method does not need to consider the characteristics of long text and deformed text, and it can detect different shapes of text. However, its disadvantage is that the segmentation results can easily become sticky, and the post-processing method is more complicated.
The main method of improving the accuracy of text detection in natural scenes is by improving the image feature extraction network and acquiring complex features of natural scene text. The more comprehensive the acquired features, the higher the accuracy of text detection. In order to solve the problem of improving the accuracy of scene text detection with controlled computation, this paper proposed a scene text detection model based on shifting windows and multi-headed self-attention. To address the problem of the variable scale and diverse distribution of natural scene texts, this paper introduced the multi-headed self-attention mechanism proposed in the Transformer [11] model, while using convolutional networks to extract local features. The multi-headed self-attention mechanism is used to obtain the global features of an image by taking advantage of its characteristic that the number of operations required to compute the relationship between any two pixels in an image does not grow with the distance between pixels. Then, the features of different levels are fused to improve the accuracy of detection. To avoid increasing the computational effort, the method of the shifted window [12] was used to calculate the self-attention. The input image was divided into non-overlapping windows and the self-attention was calculated in window units. The model obtained by training with this method generated a weight related to the input data itself when processing new data, which increased the diversity of the model and also improved the accuracy of the detection.
To verify the effectiveness of the method proposed in this paper, experiments were conducted on a multi-oriented text detection dataset and a multi-language, multi-oriented text detection dataset. The results showed that the detection results of the proposed method in this paper were improved in accuracy compared with previous methods.
2. Related Work
In recent years, scene text detection methods based on deep learning have been mainly classified into two types based on text region suggestion and image semantic segmentation.
2.1. Text Region Suggestion
The text detection methods based on text region suggestion adopt the framework of the classical object detection method, which uses CNNs to extract image features and then generates a text Region of Interest (RoI). Then, this method judges whether the region belongs to the text instance and filters out the redundant candidate region to obtain the final detection results.
To make the object detection algorithm SSD applicable to the text detection task, the algorithm of TextBoxes [13] replaces the fully connected layer in SSD with a convolutional layer. In addition, considering the text aspect ratio, the size of the convolution kernel is adjusted using a 1 × 5 convolution kernel instead of a 3 × 3 convolution kernel, and the ratio of candidate boxes is adjusted.
In order to solve the problem that TextBoxes can only detect horizontal text, TextBoxes++ [14] extends TextBoxes to produce rectangular text detection boxes with a rotation angle, which can effectively detect rotated text. In addition, it changes the 1 × 5 convolution kernel to 3 × 5 and also adjusts the aspect ratio of the candidate box.
The ContourNet [15] algorithm decouples the texture features of the image into contour detection in the horizontal and vertical directions, and suppresses the False Positives (FP) problem, which is common in text detection algorithms, by its joint response. In addition, to address the problem of inaccurate text detection with drastic scale transformation, a modeling that focuses on the text’s own shape information was proposed, and a scale-insensitive metric was used to optimize the detection effect of the network.
To address the problem of the low detection rate caused by the close alignment and multi-directional position of text words in practical applications and the need to improve the detection speed of the algorithm, the YOLOv3 text detection algorithm was improved in [16]. A new CIOU-based rotating box loss function MD-Closs was proposed to improve the detection accuracy. In addition, a step-by-step NMS approach was used to further reduce the computational effort.
The MOST [17] algorithm dynamically adjusts the perceptual field of the localization prediction layer by aligning the image features with the coarse detection results. At the same time, it adaptively merges the original predictions to focus on accurate predictions and discards inaccurate predictions based on the position of the predictions at the time of the original prediction.
2.2. Semantic Segmentation
The text detection method based on image semantic segmentation extracts the feature map of the input image first, then predicts the probability that each pixel in the input image is a text instance based on the feature map. Afterward, the final output is obtained by post-processing according to the geometric features of the text.
To solve the problem of indistinguishable close text instances, based on the idea that the central regions of different text instances have distinguishable boundaries, PSENet [18] proposes a progressive scale expansion algorithm. Starting from a distinguishable text region with the smallest scale, the text region is gradually expanded to the surrounding pixel points in a breadth-first search, increasing the text region until the largest text region is found as the prediction result.
DBNet [19] uses the differentiable binarization operation instead of the standard binarization operation with fixed thresholds, and it introduces the binarization operation into the segmentation network so that the threshold of binarization is no longer fixed but is obtained by adaptive learning of the network, which greatly simplifies the post-processing process and also improves the performance of text detection.
FCENet [20] introduces the Fourier Contour Embedding (FCE) method to accurately fit complex shaped text regions, converting the contours of text instances from point sequences to Fourier feature vectors. The text instances are predicted in the Fourier domain, and then the text contour point sequence is reconstructed in the image space domain by the inverse Fourier transform to obtain the final prediction results. The method is more accurate in predicting results for highly curved text shapes, but it does not work well for non-curved text.
To solve the problem of complex model design and time-consuming training, the method of FCOS was proposed in [21]. The approach uses a Bidirectional Feature Pyramid Network (BiFPN) as the backbone network to improve the model learning capability, increase the receptive field, and improve the feature representation of FCOS in text detection tasks.
3. Method
The general framework of the scene text detection based on multi-headed self-attention proposed in this paper is shown in Figure 1. First, the features at five scales were extracted from the input image using the CNN-based residual neural network ResNet50 [22] noted as ,, , , and , which were 1/2, 1/4, 1/8, 1/16, and 1/32 the size of the original image, respectively. Then, the four scales of , , , and were fed into the FPN [9]; multi-scale feature fusion was performed by up-sampling the higher-level features and connecting the low-level features top-down; four features of ¼ the size of the original image were obtained, noted as , , , and . The detailed process is described in Section 3.1. After that, , , , and were fed into the feature enhancement module for multi-headed self-attention calculation based on shifting windows, and finally an enhanced feature E was obtained. The detailed process is described in Section 3.2 and Section 3.3. Then, a probability map and a threshold map of the same size as the original map were generated by a series of convolution operations on a feature E of 1/4 size during training. The binary map was also obtained using a differentiable binarization. Then, the detection results were obtained by post-processing. The detailed procedure is described in Section 3.4. In addition, label generation is introduced in Section 3.5; the loss function is introduced in Section 3.6; the evaluation metrics are introduced in Section 3.7.
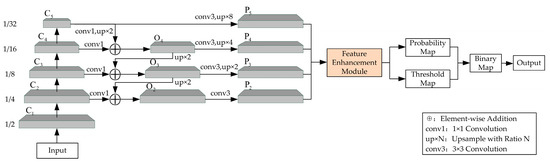
Figure 1.
Framework of scene text detection based on multi-headed self-attention.
3.1. Feature Pyramid Network
The resolution of the five features of ,, , , and that were extracted by the ResNet50 network from the bottom-up gradually decreased, but the perceptual field gradually increased, and the level of the semantic information extracted gradually increased. The top-down and horizontally connected process of the feature pyramid network ensured that the semantic information of the higher-level features could be utilized, while the detailed information could be located by using the bottom-level features. The top-down process of the feature pyramid was to first up-sample the more abstract and semantically stronger higher-level feature maps. Then, we fused the results of the up-sampling with the bottom-up feature maps of the same size generated by the ResNet50 network through a horizontally connected process. This process was iterative until the final feature map with the desired resolution was generated.
The initial iteration needed to start with a 1 × 1 convolution for feature with a size of 1/32 of the original image to ensure a fixed feature dimension, and the result was noted as . The detailed calculation is shown in Equation (1):
This step was not required for the other layer iterations. The iterative process was up-sampling with a ratio of 2 for at first to ensure the same size as the previous layer of features. At the same time, the features were convolved 1 × 1 once for dimensional transformation. Then, the two features were summed by element to obtain the feature . The detailed calculation is shown in Equation (2):
where conv1 denotes 1 × 1 convolution; i = 2, 3, 4; up2 denotes up-sampling with a ratio of 2; ⊕ denotes summation by elements.
Finally, in order to reduce the overlap effect of up-sampling, a 3 × 3 convolution was attached to , , , and . In order to obtain the same size of the feature map where all were 1/4 of the original size, a corresponding number of up-sampling repeats were added after convolution to obtain the four final feature maps for , , , and . The details were calculated with Equations (3)–(6):
3.2. Feature Enhancement Module
For convolution, the setting of the convolution kernel limits the size of the perceptual field, resulting in a network that often requires multiple layers of stacking for focusing on the entire feature map. The advantage of self-attention is that its attention is global, and it can obtain the global spatial information of the feature map by simple query and assignment. The feature enhancement module does feature fusion and self-attention calculation on the basis of the four features, , , , and , obtained from the FPN network, to gain a global feature of the feature map itself. This global feature was added with , , , and , respectively, and then fused. The final enhanced feature E had both the local features extracted by the CNN network and the global features obtained by the self-attention calculation.
As shown in Figure 2, the four features , , , and were fused by the concat operation. Then, a 3 × 3 convolution was appended for dimensional transformation to obtain the fused features F. After that, the self-attention calculation was performed, which was calculated by using shifted window to obtain a self-attention feature S. Then, , , , and were summed with S by element, respectively, and , , , and were correspondingly obtained. A concat operation was performed on , , , and for feature fusion to obtain a final enhanced feature E. The specific calculation formulae are given in Equations (7)–(10):
where conv3 denotes 3 × 3 convolution; concat denotes feature association; SA denotes self-attention calculation; j = 2, 3, 4, and 5.
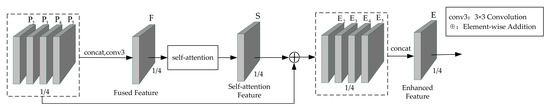
Figure 2.
Module of feature enhancement.
3.3. Multi-Headed Self-Attention Based on Shifted Windows
Multiheaded self-attention first appears in the Transformer model from Natural Language Processing (NLP). For an input image of size M × M and input dimension C, when the number of multi-heads was h and the probability mapping function was SoftMax, the specific calculations are shown in Equations (11) and (12):
where are the query, key, and value matrices, respectively, which are obtained by multiplying the pixel matrix of size by the matrices , , and of size with random initialization and learnable parameters, respectively; d is the dimension of the query and key matrices, also equal to C/h; is the relative position bias; concat is the feature association operation; is a one-time self-attention calculation, 1 ≤ i ≤ h, and ; is the fusion matrix, which is used to reduce the feature matrix to .
ViT (Vision of Transformer) [23] formally introduces the Transformer into the field of computer vision. By slicing the input 2D image into properly sized patches, each patch is flattened into a 1D vector, and then position encoding is added and then fed into the Transformer encoder. To reduce the computational cost of computing the global self-attention of an image, Swin Transformer [12] improves on ViT. After slicing the input image into patches, the whole input image is then divided into multiple windows of fixed size that do not overlap, and then the self-attention is computed separately inside each window. The idea of shifted windows is proposed to increase the connection across windows, and the self-attention is calculated once more after shifted windows, which is used to obtain the relationship between windows. At the same time, for the convenience of computation, cyclic shift and mask operations are used to reduce the computation and ensure the non-interference between each window. In this paper, we borrowed the latter idea in calculating the self-attention of fused features F. The complete multi-headed self-attention calculation process is shown in Figure 3.
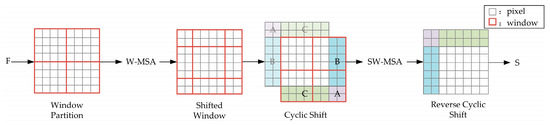
Figure 3.
Multi-headed self-attention based on shifted windows.
The input fused feature map F was first divided into a window size of M × M, and then the self-attention inside each window was calculated using Equation (11). The multi-headed self-attention was calculated using Equation (12), which is called Windows Multi-headed Self Attention (W-MSA) inside the window.
At this point, the computed multi-headed self-attention was only within each window and lacked connections across windows on the feature map. To increase the mutual interaction between windows, the divided windows were shifted from the upper left corner of the feature map in the ⌊M/2, M/2⌋ steps to the lower right window. The new generated windows crossed the previous window boundaries, providing a link between them. Another multi-headed self-attention calculation was then performed, and this attention calculation was called Shifted Windows Multi-headed Self Attention (SW-MSA).
However, the number of windows was larger than that previously, and the computation volume increased. The size of each window was not fixed, so it could not be computed in parallel. In order to solve this problem, the window was fully filled to its original size by using cyclic shift, which can be seen in Figure 3. However, cyclic shift will cause some windows to be composed of some actual non-adjacent sub-windows inside, which need to be masked to ensure that they do not interfere with each other when calculating the multi-headed self-attention. Finally, each pixel in the feature map was then reset to its original position by the reverse cyclic shift operation to obtain the self-attention feature S.
A feature map with scale h × w × C could be introduced according to Equations (11) and (12), for which the computation of multi-headed self-attention (MSA) using the classical approach is shown in Equation (13), and the computation after splitting the window into M × M using the shifting window approach (W-MSA) is shown in Equation (14).
When M is a smaller constant, the latter is only linearly related to the first power of hw, while the former will contain the second power of hw; thus, W-MSA greatly reduces the computational effort.
3.4. Differentiable Binarization
The method of converting a probability map to a binary map using the standard binarization method of setting a fixed threshold is not differentiable and will result in a network that cannot be optimized at training time. To better separate the background from the foreground, a threshold map obtained from the network prediction rather than from a fixed threshold was added. In order to improve the inference speed, the threshold map was used only during training. In addition, to ensure that the gradient was differentiable during training, a differentiable binarization method was used by approximating the step function in the standard binarization, which is expressed in Equation (15):
where is the value of point (i, j) in the approximate binary map ; k is the enhancement factor for gradient scaling, which is empirically set to 50; is the value of point (i, j) in the probability map P; is the value of point (i, j) in the threshold map T.
In the training phase, three feature maps, a probability map, threshold map, and binary map, were supervised to learn and update the parameters of each module. The automatically adjusted thresholds not only improved the accuracy, but also simplified post-processing and improved the performance of text detection. In the inference process, the probability map was used directly and the text detection results were obtained by fixing the thresholds, which simplified the inference process and improved the inference speed.
3.5. Label Generation
The training phase generated three feature maps: a probability map, threshold map, and binary map. The probability map and binary map used the same supervisory signal, and the threshold map used a separate supervisory signal, so two labels need to be generated to guide the training.
For a given input image, a number of vertices are generally used to represent the external polygons of the text regions in the image. The label generation for probability and binary maps used the Vatti clipping algorithm to shrink the original polygonal text region G to G_s. The shrinkage offset D was calculated from the circumference C and area A of the original polygon, according to Equation (16):
where A is the area of the original region; C is the circumference of the original region; r is the shrinkage factor, which was empirically set to r = 0.4.
Using a similar process, labels were generated for the threshold map. The original polygon text region G was expanded to , and the offset D of the expansion was the same as D in the probability map. Then, the gap between the shrinking box and the expanding box was considered the boundary of the text area, and the normalized distance from each pixel point in this gap to the original image boundary G was calculated. According to the calculation results, the value of the normalized distance between the pixel point on the expansion box and the pixel point on the contraction box was the largest, and the pixel point on the original text border had the smallest value of 0. The overall trend was to gradually increase the values in the direction of and , with the original text border as the base. The values were then normalized by dividing them by the offset D. The values on and became 1. The values were then subtracted from 1 to obtain the values on the original text border as 1 and on and as 0. The values in the direction of and became progressively smaller with the original text border as the base. At this point, the values in the and regions were in the range [0, 1]. We normalized again and took the value of (0, 1) to obtain the final label.
In the inference phase, text bounding boxes can be computed using either probability maps or binary maps. For efficiency, using probability graphs was chosen to make it possible to remove threshold branches during inference. The formation of the text box can be divided into three steps. First, the probability map (or binary map) was binarized using a fixed threshold (0.2) to obtain a binary map. Then, the connected region (shrink text region) was obtained from the binary map. Finally, the shrink text region was expanded by the offset factor of the Vatti clipping algorithm to obtain the final text box, and the formula for calculating is shown in Equation (17):
where and are the area and circumference of the shrinking region, respectively; and is empirically set to 1.5 (corresponding to the shrinking ratio r = 0.4).
3.6. Loss Function
Because three prediction maps are generated in the training phase, which are the probability map, threshold map, and binary map, for the loss function, it is also necessary to combine these three prediction maps with their corresponding true labels to construct the 3-part loss function. As the overall process of the proposed method in this paper is similar to DBNet, the design of the loss function refers to the implementation code of DBNet. The formula of the total loss function is defined as shown in Equation (18):
where L is the total loss; is the loss function of the binary map, which was used in this experiment as Dice Loss; is the probability map loss, which was used in this experiment as the Binary Cross-Entropy Loss (BCE Loss) function, while a hard-negative sample sampling strategy was used in order to balance the positive and negative samples with a 3:1 setting for the background and foreground regions; is the threshold map loss, which was used in this experiment as L1 Loss, which calculates the L1 distance between predicted values and labels. Only the inner region of the expanded polygon was calculated while the rest of the region was ignored; α and β are the weight factors, which were set to 5 and 10, respectively, in this experiment.
The formula of Dice Loss is shown in Equation (19):
where X is the labeled graph; Y is the predicted graph; |X| and |Y| denote the number of elements of X and Y, respectively; |X∩Y| denotes the number of elements of the intersection of X and Y.
The formula for BCE Loss is shown in Equation (20):
where is the sample set with a positive to negative sample ratio of 1:3; is the label value of the probability map; is the predicted value of the probability map.
The formula for L1 Loss is shown in Equation (21):
where is the expanded polygon; is the label value of the threshold map; is the predicted value of the threshold map.
3.7. Evaluation Metrics
Considering that DB post-processing detection frames are diverse and not horizontal, the text detection evaluation method of ICDAR Challenges4 was referred to in this paper’s experiments. A simple calculation of Intersection over Union (IoU) was used to evaluate whether the prediction was correct.
There are three main evaluation metrics for the commonly used scene text detection algorithms, which are Precision, Recall, and F1-score. Precision is the ratio of the number of correctly predicted text boxes to the total number of predicted text boxes. Recall is the ratio of the number of correctly predicted text boxes to the total number of labeled text boxes. F1-Score is the summed average of precision and recall. The specific calculation formula is shown in Equations (22)–(24), respectively:
where TP is the number of correctly predicted text boxes; FP is the number of incorrectly predicted text boxes; FN is the number of positive samples not predicted; TP + FP is the number of all predicted text boxes; TP + FP is the number of all labeled text boxes.
4. Experiments
4.1. Datasets
The datasets used in the experiments of this paper were as follows. Some samples of the datasets are shown in Figure 4.
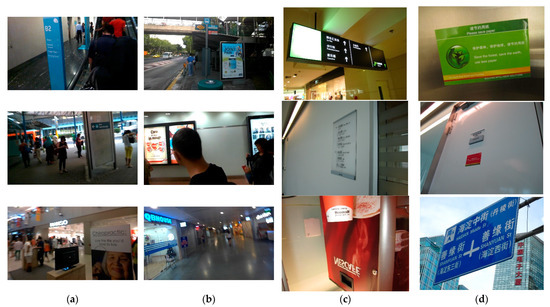
Figure 4.
Some samples of the datasets. (a) From the ICDAR2015 training set; (b) from the ICDAR2015 test set; (c) from the MSRA-TD500 training set; (d) from the MSRA-TD500 test set.
SynthText [24]: synthetic dataset containing 800,000 images synthesized from 8000 background images and a total of 6 million text instances. This dataset was only used for pre-training.
ICDAR2015 [25]: multi-directional text dataset of natural scenes, plain English, taken by Google Glasses without guaranteeing the image quality. All images have a resolution of 720 × 1280, most of the text in the images is very small and blurred, and the text orientation is irregular. A total of 1000 training images and 500 test images are included, and all are character-level-annotated.
MSRA-TD500 [26]: a multi-directional, multilingual (Chinese, English, and mixed Chinese and English) text dataset of natural scenes, captured from indoor (office and shopping mall) and outdoor (street) scenes using a pocket camera. The resolutions of the images range from 1296 × 864 to 1920 × 1280. The dataset was divided into a training set, which contained 300 randomly selected images from the original dataset, and a test set with the remaining 200 images, all of which were annotated at the text line level. In addition, 400 images from the HUST-TR400 [27] dataset were also added to the training set together.
4.2. Implementation Details
In this paper, the proposed scene text detection network based on a shifting window multi-headed self-attention mechanism was implemented using the PaddlePaddle deep learning framework. The hardware environment used for training was a 16 GB Tesla V100 graphics card.
For the actual training, a pre-training model was obtained by pre-training on the SynthText dataset for two iterations. Then, 1000 iterations were trained on the corresponding dataset for targeted fine-tuning.
To consider the training efficiency, all image resolutions were adjusted to 640 × 640 during training, and data augmentation operations such as random rotation in the range of ±10°, random cropping, and random flipping were performed. The hyperparametric training batch size was set to 8, the window size M was set to 8, and the number of multi-heads H was also set to 8.
The specific process was as follows: Using the pre-trained model obtained on the SynthText dataset, we trained on the training set of ICDAR2015. Then, we evaluated based on the test set of ICDAR2015 at every 2000 iterations, and we saved the model with the best evaluation after the training was completed. The training and testing curves of the ICDAR2015 dataset are shown in Figure 5.
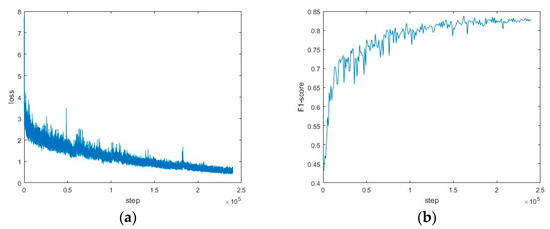
Figure 5.
The training and testing curves of the ICDAR2015 dataset. (a) The loss curves in training; (b) the F1-score curves in testing.
Using the pre-trained model obtained on the SynthText dataset and considering that the MSRA-TD500 training set was small, the training sets from MSRA-TD500 and HUST-TR400 were combined as a new training set. Then, we evaluated based on the test set of MSRA-TD500 at every 2000 iterations, and the best evaluated model was saved after the training was completed. The training and testing curves of the MSRA-TD500 dataset are shown in Figure 6.
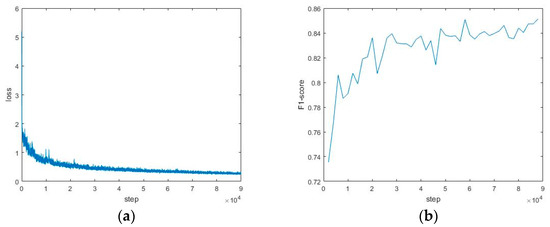
Figure 6.
The training and testing curves of the MSRA-TD500 dataset. (a) The loss curves in training; (b) the F1-score curves in testing.
The learning rate (LR) in the training process adopted the Poly strategy of exponential transformation, and the specific formula is given in Equation (25):
where lr is the learning rate of the current iteration, base_lr is the initial learning rate, iter is the number of current iterations, max_iter is the maximum number of iterations, and power is the exponent.
In this experiment, base_lr was set to 0.007, power was set to 0.9, and the weight decay and momentum used were 0.0001 and 0.9, respectively.
In the inference stage, the batch size was set to 1. In addition, considering that the minimum feature map extracted in the feature extraction network was 1/32 of the original image, the image resolution of the evaluation set was adjusted to 736 × 1280 while maintaining the aspect ratio of the test image to ensure that the aspect was a multiple of 32.
4.3. Comparisons with Previous Methods
In order to verify the effectiveness of the methods in this paper, experiments were conducted on two benchmark datasets and compared with some previous methods. One benchmark dataset was the multi-oriented text detection dataset ICDAR2015, and the other was the multi-language text detection benchmark dataset MSRA-TD500.
As can be seen in Table 1, the experimental results of the proposed method in this paper were higher than those of DBNet and other methods on the multi-oriented text detection dataset ICDAR2015, and the F1-score value was improved by 0.5% compared to DBNet.

Table 1.
Results of ICDAR2015 [25].
The experimental results on the MSRA-TD500 dataset also showed the robustness of the proposed method on the multilingual text detection dataset in this paper. As can be seen in Table 2, the proposed method in this paper improved by 3.5% over DBNet in F1-score, while it improved by 0.3% in Precision and 6.1% in Recall.
Table 2.
Results of MSRA-TD500 [26].
5. Conclusions
To address the challenge of text detection in natural scenes, the text detection algorithm was improved in this paper. The global features of the input image were obtained using a multi-headed self-attention mechanism, and then fused with the local features extracted by CNN to obtain a fused feature. In addition, a shifting window calculation was used to reduce the computational effort when calculating the self-attention. Finally, the experimental results in terms of the F1-score values on two benchmark datasets, ICDAR2015 and MSRA-TD500, reached 85.9% and 88.4%, respectively. Compared with the F1-score values of 85.4% and 84.9% of the pre-improved method DBNet for these two datasets, the improvement was 0.5% and 3.5%, respectively, which verified the effectiveness of the proposed method in this paper.
In the future, we are interested in extending our network to improve the feature extraction from irregular text and the generalization of the model by finding simpler and more efficient global feature extraction methods.
Author Contributions
Conceptualization, X.F.; methodology, X.F.; validation, X.F.; writing—original draft preparation, X.F.; writing—review and editing, B.H.; supervision, B.H.; funding acquisition, B.H. All authors have read and agreed to the published version of the manuscript.
Funding
This research was funded by National Natural Science Foundation of China grant number 61962005.
Data Availability Statement
The data presented in this study are openly available in reference number [24,25,26,27].
Conflicts of Interest
The authors declare no conflict of interest.
References
- Cao, D.; Zhong, Y.; Wang, L.; He, Y.; Dang, J. Scene Text Detection in Natural Images: A Review. Symmetry 2020, 12, 1956. [Google Scholar] [CrossRef]
- Ibravim, M.; Li, Y.; Hamdulla, A. Scene Text Detection Based on Two-Branch Feature Extraction. Sensors 2022, 22, 6262. [Google Scholar] [CrossRef] [PubMed]
- Hassan, E.; Lekshmi, V. Scene Text Detection Using Attention with Depthwise Separable Convolutions. Appl. Sci. 2022, 12, 6425. [Google Scholar] [CrossRef]
- Girshick, R.; Donahue, J.; Darrell, T.; Malik, J. Rich feature hierarchies for accurate object detection and semantic segmentation. In Proceedings of the IEEE Conference on Computer Vision and Pattern Recognition, Columbus, OH, USA, 23–28 June 2014; pp. 580–587. [Google Scholar]
- Liu, W.; Anguelov, D.; Erhan, D.; Szegedy, C.; Reed, S.; Fu, C.; Berg, A.C. SSD: Single shot multibox detector. In Proceedings of the Computer Vision—ECCV 2016, Amsterdam, The Netherlands, 11–14 October 2016; pp. 21–37. [Google Scholar]
- Dai, J.; Li, Y.; He, K.; Sun, J. R-FCN: Object detection via region-based fully convolutional networks. Adv. Neural Inf. Process. Syst. 2016, 29, 379–387. [Google Scholar]
- Redmon, J.; Divvala, S.; Girshick, R.; Farhadi, A. You only look once: Unified, real-time object detection. In Proceedings of the IEEE Conference on Computer Vision and Pattern Recognition, Las Vegas, NV, USA, 27–30 June 2016; pp. 779–788. [Google Scholar]
- Long, J.; Shelhamer, E.; Darrell, T. Fully convolutional networks for semantic segmentation. In Proceedings of the IEEE Conference on Computer Vision and Pattern Recognition, Boston, MA, USA, 7–12 June 2015; pp. 3431–3440. [Google Scholar]
- Lin, T.; Dollár, P.; Girshick, R.; He, K.; Hariharan, B.; Belongie, S. Feature pyramid networks for object detection. In Proceedings of the IEEE Conference on Computer Vision and Pattern Recognition, Honolulu, HI, USA, 21–26 July 2017; pp. 2117–2125. [Google Scholar]
- Li, Y.; Qi, H.; Dai, J.; Ji, X.; Wei, Y. Fully convolutional instance-aware semantic segmentation. In Proceedings of the IEEE Conference on Computer Vision and Pattern Recognition, Honolulu, HI, USA, 21–26 July 2017; pp. 2359–2367. [Google Scholar]
- Vaswani, A.; Shazeer, N.; Parmar, N.; Uszkoreit, J.; Jones, L.; Gomez, A.N.; Kariser, Ł.; Polosukhin, I. Attention is all you need. Adv. Neural Inf. Process. Syst. 2017, 30, 1–9. [Google Scholar]
- Liu, Z.; Lin, Y.; Cao, Y.; Hu, H.; Wei, Y.; Zhang, Z.; Lin, S.; Guo, B. Swin transformer: Hierarchical vision transformer using shifted windows. In Proceedings of the IEEE/CVF International Conference on Computer Vision, Montreal, QC, Canada, 10–17 October 2021; pp. 10012–10022. [Google Scholar]
- Liao, M.; Shi, B.; Bai, X.; Wang, X.; Liu, W. Textboxes: A fast text detector with a single deep neural network. In Proceedings of the Thirty-first AAAI Conference on Artificial Intelligence, San Francisco, CA, USA, 4–9 February 2017. [Google Scholar]
- Liao, M.; Shi, B.; Bai, X. Textboxes++: A single-shot oriented scene text detector. IEEE Trans. Image Process. 2018, 27, 3676–3690. [Google Scholar] [CrossRef] [PubMed]
- Wang, Y.; Xie, H.; Zha, Z.; Xing, M.; Fu, Z.; Zhang, Y. ContourNet: Taking a further step toward accurate arbitrary-shaped scene text detection. In Proceedings of the IEEE/CVF Conference on Computer Vision and Pattern Recognition, Seattle, WA, USA, 13–19 June 2020; pp. 11753–11762. [Google Scholar]
- Xiao, L.; Zhou, P.; Xu, K.; Zhao, X. Multi-Directional Scene Text Detection Based on Improved YOLOv3. Sensors 2021, 21, 4870. [Google Scholar] [CrossRef] [PubMed]
- He, M.; Liao, M.; Yang, Z.; Zhong, H.; Tang, J.; Cheng, W.; Yao, C.; Wang, Y.; Bai, X. MOST: A multi-oriented scene text detector with localization refinement. In Proceedings of the IEEE/CVF Conference on Computer Vision and Pattern Recognition, Nashville, TN, USA, 20–25 June 2021; pp. 8813–8822. [Google Scholar]
- Wang, W.; Xie, E.; Li, X.; Hou, W.; Lu, T.; Yu, G.; Shao, S. Shape robust text detection with progressive scale expansion network. In Proceedings of the IEEE/CVF Conference on Computer Vision and Pattern Recognition, Long Beach, CA, USA, 15–20 June 2019; pp. 9336–9345. [Google Scholar]
- Liao, M.; Wan, Z.; Yao, C.; Chen, K.; Bai, X. Real-time scene text detection with differentiable banalization. In Proceedings of the AAAI Conference on Artificial Intelligence, New York, NY, USA, 7–12 February 2020; pp. 11474–11481. [Google Scholar]
- Zhu, Y.; Chen, J.; Liang, L.; Kuang, Z.; Jin, L.; Zhang, W. Fourier contour embedding for arbitrary-shaped text detection. In Proceedings of the IEEE/CVF Conference on Computer Vision and Pattern Recognition, Nashville, TN, USA, 20–25 June 2021; pp. 3123–3131. [Google Scholar]
- Cao, D.; Dang, J.; Zhong, Y. Towards Accurate Scene Text Detection with Bidirectional Feature Pyramid Network. Symmetry 2021, 13, 486. [Google Scholar] [CrossRef]
- He, K.; Zhang, X.; Ren, S.; Sun, J. Deep residual learning for image recognition. In Proceedings of the IEEE Conference on Computer Vision and Pattern Recognition, Las Vegas, NV, USA, 27–30 June 2016; pp. 770–778. [Google Scholar]
- Dosovitskiy, A.; Beyer, L.; Kolesnikov, A.; Weissenborn, D.; Zhai, X.; Unterthiner, T.; Dehghani, M.; Minderer, M.; Heigold, G.; Gelly, S.; et al. An image is worth 16x16 words: Transformers for image recognition at scale. arXiv 2020, arXiv:2010.11929. [Google Scholar]
- Gupta, A.; Vedaldi, A.; Zisserman, A. Synthetic data for text localization in natural images. In Proceedings of the IEEE Conference on Computer Vision and Pattern Recognition, Las Vegas, NV, USA, 27–30 June 2016; pp. 2315–2324. [Google Scholar]
- Karatzas, D.; Gomez-Bigorda, L.; Nicolaou, A.; Ghosh, S.; Bagdanov, A.; Iwamura, M.; Matas, J.; Neumann, L.; Chandrasekhar, V.R.; Lu, S.; et al. ICDAR 2015 competition on robust reading. In Proceedings of the 2015 13th International Conference on Document Analysis and Recognition (ICDAR), Tunis, Tunisia, 23–26 August 2015; pp. 1156–1160. [Google Scholar]
- Yao, C.; Bai, X.; Liu, W.; Ma, Y.; Tu, Z. Detecting texts of arbitrary orientations in natural images. In Proceedings of the 2012 IEEE Conference on Computer Vision and Pattern Recognition, Providence, RI, USA, 16–21 June 2012; pp. 1083–1090. [Google Scholar]
- Yao, C.; Bai, X.; Liu, W. A Unified Framework for Multioriented Text Detection and Recognition. IEEE Trans. Image Process. 2014, 23, 4737–4749. [Google Scholar] [CrossRef] [PubMed]
- Tian, Z.; Huang, W.; He, T.; He, P.; Qiao, Y. Detecting Text in Natural Image with Connectionist Text Proposal Network. In Proceedings of the European Conference on Computer Vision, Amsterdam, The Netherlands, 11–14 October 2016; pp. 56–72. [Google Scholar]
- He, P.; Huang, W.; He, T.; Zhu, Q.; Qiao, Y.; Li, X. Single shot text detector with regional attention. In Proceedings of the IEEE International Conference on Computer Vision, Venice, Italy, 22–29 October 2017; pp. 3047–3055. [Google Scholar]
- Hu, H.; Zhang, C.; Luo, Y.; Wang, Y.; Han, J.; Ding, E. WordSup: Exploiting word annotations for character based text detection. In Proceedings of the IEEE International Conference on Computer Vision, Venice, Italy, 22–29 October 2017; pp. 4940–4949. [Google Scholar]
- Lyu, P.; Yao, C.; Wu, W.; Yan, S.; Bai, X. Multi-oriented scene text detection via corner localization and region segmentation. In Proceedings of the IEEE Conference on Computer Vision and Pattern Recognition, Salt Lake City, UT, USA, 18–23 June 2018; pp. 7553–7563. [Google Scholar]
- Liao, M.; Zhu, Z.; Shi, B.; Xia, G.; Bai, X. Rotation-sensitive regression for oriented scene text detection. In Proceedings of the IEEE Conference on Computer Vision and Pattern Recognition, Salt Lake City, UT, USA, 18–23 June 2018; pp. 5909–5918. [Google Scholar]
- Liu, Z.; Lin, G.; Yang, S.; Feng, J.; Lin, W.; Goh, W.L. Learning markov clustering networks for scene text detection. In Proceedings of the IEEE Conference on Computer Vision and Pattern Recognition, Salt Lake City, UT, USA, 18–23 June 2018; pp. 6936–6944. [Google Scholar]
- Long, S.; Ruan, J.; Zhang, W.; He, X.; Wu, W.; Yao, C. Textsnake: A flexible representation for detecting text of arbitrary shapes. In Proceedings of the European Conference on Computer Vision, Munich, Germany, 8–14 September 2018; pp. 20–36. [Google Scholar]
- Tian, Z.; Shu, M.; Lyu, P.; Li, R.; Zhou, C.; Shen, X.; Jia, J. Learning shape-aware embedding for scene text detection. In Proceedings of the IEEE/CVF Conference on Computer Vision and Pattern Recognition, Long Beach, CA, USA, 15–20 June 2019; pp. 4234–4243. [Google Scholar]
- Wang, W.; Xie, E.; Li, X.; Liu, X.; Liang, D.; Zhibo, Y.; Lu, T.; Shen, C. Pan++: Towards efficient and accurate end-to-end spotting of arbitrarily-shaped text. IEEE Trans. Pattern Anal. Mach. Intell. 2021, 44, 5349–5367. [Google Scholar] [CrossRef] [PubMed]
- Chen, Z.; Wang, J.; Wang, W.; Chen, G.; Xie, E.; Luo, P.; Lu, T. FAST: Faster arbitrarily-shaped text detector with minimalist kernel representation. arXiv 2023, arXiv:2111.02394v2. [Google Scholar]
- He, W.; Zhang, X.; Yin, F.; Liu, C. Deep direct regression for multi-oriented scene text detection. In Proceedings of the IEEE International Conference on Computer Vision, Venice, Italy, 22–29 October 2017; pp. 745–753. [Google Scholar]
- Baek, Y.; Lee, B.; Han, D.; Yun, S.; Lee, H. Character region awareness for text detection. In Proceedings of the IEEE/CVF Conference on Computer Vision and Pattern Recognition, Long Beach, CA, USA, 15–20 June 2019; pp. 9365–9374. [Google Scholar]
Disclaimer/Publisher’s Note: The statements, opinions and data contained in all publications are solely those of the individual author(s) and contributor(s) and not of MDPI and/or the editor(s). MDPI and/or the editor(s) disclaim responsibility for any injury to people or property resulting from any ideas, methods, instructions or products referred to in the content. |
© 2023 by the authors. Licensee MDPI, Basel, Switzerland. This article is an open access article distributed under the terms and conditions of the Creative Commons Attribution (CC BY) license (https://creativecommons.org/licenses/by/4.0/).