Abstract
Background: Obesity, which causes physical and mental problems, is a global health problem with serious consequences. The prevalence of obesity is increasing steadily, and therefore, new research is needed that examines the influencing factors of obesity and how to predict the occurrence of the condition according to these factors. This study aimed to predict the level of obesity based on physical activity and eating habits using the trained neural network model. Methods: The chi-square, F-Classify, and mutual information classification algorithms were used to identify the most critical factors associated with obesity. The models’ performances were compared using a trained neural network with different feature sets. The hyperparameters of the models were optimized using Bayesian optimization techniques, which are faster and more effective than traditional techniques. Results: The results predicted the level of obesity with average accuracies of 93.06%, 89.04%, 90.32%, and 86.52% for all features using the neural network and for the features selected by the chi-square, F-Classify, and mutual information classification algorithms. The results showed that physical activity, alcohol consumption, use of technological devices, frequent consumption of high-calorie meals, and frequency of vegetable consumption were the most important factors affecting obesity. Conclusions: The F-Classify score algorithm identified the most essential features for obesity level estimation. Furthermore, physical activity and eating habits were the most critical factors for obesity prediction.
1. Introduction
Obesity is a multifactorial disease that leads to uncontrolled weight gain due to low energy expenditure and high-calorie intake, resulting in abnormal or excessive fat accumulation that can harm health [1,2]. According to the World Health Organization (WHO), in 2016, 39% of adults aged 18 years and older were overweight, and 13% were obese. These records are only increasing yearly; since 1975, the number of people with obesity has tripled worldwide [3]. The anticipated monetary cost of obesity, which represents 5–14% of health spending from 2020 to 2050, is beyond dispute [4].
According to Colditz [5], the direct costs of inactivity and obesity account for about 9.4% of national healthcare expenditures in the United States. In comparison, in the case of Colombia, it is estimated to be USD 2158 million [6]. Additionally, the cost accounts for 1.52% of the expenditure of Peru’s gross domestic product, and 1.83% in the case of Mexico [7]. Although these estimates of obesity-related spending may not be entirely correct [8], such high spending underscores the importance of obesity screening.
Research in the literature suggests that the risk of obesity depends not only on individual factors, but also on demographic characteristics, community infrastructure, socioeconomic conditions, and environmental and other community-specific factors [9,10,11,12]. In lower socioeconomic status groups in some countries, obesity rates have increased by a factor of three or more due to urbanization, dietary and food supply changes, and a decline in physical activity [13,14]. Due to the elevated mortality rate from non-communicable diseases such as type 2 diabetes, atherosclerotic cardiovascular diseases, and some types of cancer, obesity can result in a life expectancy reduction of up to 20 years [15,16,17,18]. Considering that obesity is preventable [19] and the significant risk of comorbidities and complications that it brings, early detection of obesity is vital, as it can cause diseases such as cardiovascular problems [20], diabetes [21], and asthma [22]. To this end, it is known that obesity has a multifactorial origin [23] and is influenced by variables such as socioeconomic status [24], occupation [25], and habits such as smoking [26] or the amount of physical activity performed [27].
Physical activity and eating habits are considered two main variables in preventing obesity [28]. The root cause of overweight and obesity is an energy imbalance between calories consumed and expended [29]. A typical technique for losing weight is to create a negative energy balance by reducing energy intake, increasing energy expenditure, or both [30]. People put on unhealthy amounts of weight by consuming foods and beverages that contain more energy than they need for their daily activities. Under these circumstances, the body converts the excess energy into fat for later use, thus reaching a state of obesity. Therefore, obesity depends mainly on a healthy diet and regular physical activity [8].
Early detection can result in rapid obesity prevention, and numerous strategies have been researched and evaluated to identify obesity trends. Current approaches to estimating obesity levels include machine learning (ML)-based classification analysis and risk factor (threshold)-based categorizations based on specific criteria. ML-based feature selection approaches and prediction models can identify links between risk factors for obesity. ML techniques can combine data from large patient groups to provide personalized predictions. For obesity, these techniques can be used to develop risk categories and da-ta-based guidance at the policy level. More specifically, ML can offer a patient-specific treatment method by clarifying the unique characteristics of each patient. In addition, individual evaluation of alternative treatments’ efficacy and possible side effects may guide treatment selection and patient follow-up. Predicting the risk of future obesity can provide relevant data and information on many individual variables using ML-based methods. Feature selection approaches are useful for better understanding the prediction results of ML models. With the contribution of these approaches, fewer important risk factors for diseases such as obesity are determined. Therefore, the information obtained from the results of a methodology combining feature selection and ML can be used in the diagnosis, treatment, and follow-up processes of patients [31,32].
From this point of view, the primary aim of this study is to develop a trained neural network-based ML model for the prediction of obesity levels based on some sociodemographic information, physical activity status, and different dietary habits. The secondary aim of the study is to examine the effects of different feature selection methods on the performance of obesity level estimation with the trained neural network model, as well as the most important risk factors for obesity.
2. Materials and Methods
2.1. Relevant Dataset
The current research was designed with an observational scheme. This study was approved by Inonu University Health Sciences Non-Interventional Clinical Research Ethics Committee (approval number: 2022/4190). This investigation included data for the estimation of obesity levels, including the eating habits and physical activity statuses of 498 participants between the ages of 14 and 61 from Barranquilla, Colombia; Lima, Peru; and the City of Mexico, Mexico [33]. The information and descriptive statistics for the dataset are given in Table 1. A survey was administered using a web-based platform in which anonymous individuals answered each question, and 17 featured datasets were obtained (see Table 1). The features related to eating habits were: frequent consumption of high-caloric food (FAVC), frequency of consumption of vegetables (FCVC), number of main meals (NCP), consumption of food between meals (CAEC), consumption of water daily (CH20), and consumption of alcohol (CALC). The features related to the physical condition were: calorie consumption monitoring (SCC), physical activity frequency (FAF), time using technological devices (TUE), and transportation used (MTRANS). The other variables we obtained were: gender, age, height, and weight. Finally, after all calculations to determine each individual’s body mass index (BMI) were completed, obesity levels were categorized by WHO data: underweight = less than 18.5; normal = 18.5 to 24.9; overweight = 25.0 to 29.9; obesity I = 30.0 to 34.9; obesity II = 35.0 to 39.9; obesity III = higher than 40.

Table 1.
Description and values of the features in the dataset related to the obesity level.
2.2. Experimental Analysis
2.2.1. Data Generated: Training, Testing, and Validation Procedure
In this study, obesity levels were predicted using a dataset including 16 features and 498 samples. In the first phase of experiments, the datasets for training, testing, and validation were generated from the original dataset. For this purpose, 25% of the original dataset was selected randomly to generate a testing dataset, and the remaining data were used for training. After that, the training dataset was divided into two parts to generate the training set for validation (trainForVal) and the testing set for validation (testForVal) in Python software. For this purpose, 20% of the training set was selected randomly to generate testForVal, and the remaining were employed for trainForVal. The functions of testForVal and trainForVal were used for parameter optimization, and the testing and training sets were utilized to assess the performance of the model, which used optimum hyperparameters. Table 2 shows the distribution of the number of samples in each dataset by classes.
Table 2.
The number of observations for obesity level categories in training, testing, and validation datasets.
2.2.2. Neural Network (NN) and Hyperparameters Optimization
In this study, a NN model with one hidden layer was developed using the Keras library [34]. A NN model was used since it is more configurable than other ML models thanks to its hyperparameters. In addition, if more data are collected, the model can be easily converted into a deep neural net. NNs can be considered powerful learning models that reveal favorable outcomes when addressing a variety of supervised and unsupervised ML tasks. For NNs, there are always explicit objectives and qualification procedures. An artificial neural network can reflect intricate, highly nonlinear interactions between input and output properties with strong evaluation skills, and it has been demonstrated that a network with only one hidden layer and enough neurons may express any function. Once training is complete, the neural network can infer outputs based on previously unknown inputs. In general, NNs are well adapted to handle machine perception challenges for which the fundamental features at hand cannot be independently understood. To accomplish pattern recognition, grouping, classification, and prediction tasks, NNs have, therefore, been carefully examined and used. These techniques work well, since NNs can analyze a significant amount of data during the training phase and cut down on the amount of time needed for diagnosis [35]. The NN model used in this study consisted of three layers: input, hidden, and output. The number of neurons in the input layer was the same as the number of features in the datasets, i.e., 16 for the original model and 5 for the models that were trained using selected features. The number of neurons in the output layer was seven, equal to the number of classes in the dataset, and the number of neurons in the hidden layer was optimized. Hyperparameters are one of the most critical factors affecting neural networks’ performance. NN models have several hyperparameters, and they can take many different values. Thus, hyperparameter space for optimization in NN models is generally ample. The learning rate and the number of neurons are just two examples of the many variables that affect how well neural networks perform. In order to determine the ideal combination of hyperparameters, many methods have been developed and researched. Grid search and random search are two optimization techniques.
Nevertheless, there are several problems with these approaches. For instance, the grid search is inefficient since it is very demanding of the central processing unit (CPU) and graphics processing unit (GPU). The grid search technique is superior to random search; however, the issue is that the precise solution is more likely to be overlooked. Bayesian optimization is the best candidate for seeking hyperparameters compared to these two techniques. First, because the Gaussian process is involved, the Bayesian optimization approach could consider prior results. In other words, every step calculation could be recalled to help identify a better set of hyperparameters. Second, when Bayesian optimization is compared to other approaches, it requires fewer repetitions and has a faster operation speed (for example, grid search might encounter a dimension explosion). Finally, Bayesian optimization might remain reliable even while dealing with non-convex issues (it is difficult to obtain a globally optimal solution when the grid search solves the non-convex problems) [36,37].
In this study, Bayesian optimization, which is faster and more effective than traditional techniques, was used to optimize the number of neurons in the hidden layer (n_unit_dense), learning rate (LR), number of epochs (epoch), and bath sizes (batch). For this purpose, the model was trained using trainForVal, and the best hyperparameter set was selected according to the accuracy of testForVal. Unlike the traditional techniques, the Bayesian optimization method accepts an interval (i.e., minimum and maximum values) for each parameter and can consider any value in that interval. Table 3 shows each hyperparameter’s lowest, highest, and optimum values. The Bayesian optimization was implemented using the skopt library in Python software [38]. The gp_minimize function was used in this library, and acq_func and n_cals were set to “EI” and 300, respectively.
Table 3.
The hyperparameter optimization details of the NN model used for the obesity level estimation.
In addition to these hyperparameters, Glorot Uniform with seed one was used as the kernel_initializer, relu was used as the activation function, the batch normalization was implemented after the hidden layer, Softmax was used as the activation function of the classification layer, Adam was used as an optimizer, categorical_crossentropy was used as the loss function, the beta1 parameter was set to 0.95, and the beta2 parameter was set to 0.99. In the third phase, a model was trained ten times with optimum hyperparameters; thus, the robustness of the model was also tested. In this phase, the training dataset was employed to train the model, and the testing dataset was used to compute accuracy measures.
2.2.3. Feature Scoring and Selection
Three different score functions (chi-square, F-Classify, and mutual information classification) were used to score each feature in the dataset to identify the most important risk factors contributing to obesity level estimation. Important features were selected using these functions, and the results were compared according to the contribution of the utilized feature selection methods to the performance of the trained NN model. For this purpose, the feature_selection library of Scikit-learn was used. In the first phase, scores were calculated separately using chi-square, F-Classify, and mutual information classification. Afterwards, the five best features were selected using the SelectKBest function, and new datasets were generated using these selected features for each score function. The chi-square function determines whether two variables have a relationship or dependency. In chi-square, one of the variables can be qualitative, the other can be quantitative, or both can be either qualitative or quantitative. In this method, a hypothesis is created, and a decision is made as to whether a hypothesis is correct or not according to the chi-square score. F-Classify is one of the methods used to check whether the variances of the groups are equal to each other. The F value is obtained by dividing the variance of the group with the greatest variance by the variance of the group with the least variance. The obtained F value is compared with the selected confidence level and the table value corresponding to the degrees of freedom for each group, and the homogeneity is decided accordingly. The mutual information classification basis is based on entropy, which measures the uncertainty in a random variable. Uncertainty is a measurement that produces a value between 0 and 1. Mutual information classification measures the shared information between two random variables. This method analyzes the features according to their dependencies with the class and their redundancy with each other [39].
2.2.4. Model Evaluation
The mean accuracy and FI-score measures were calculated to evaluate the performance of the predictive models. The F1-score is a mean measure of sensitivity and specificity and an important source of information for testing the model’s validity [40]. In this study, the Brier score was also calculated to examine the models’ calibration. The Brier score is a metric that reflects both calibration and discrimination, and lower values indicate superior model performance. The Brier score also penalizes the overfitting, because the overfitting results in incorrect calibration [41].
The process flow diagram of the proposed model is also shown in Figure 1 for a better understanding of the system.
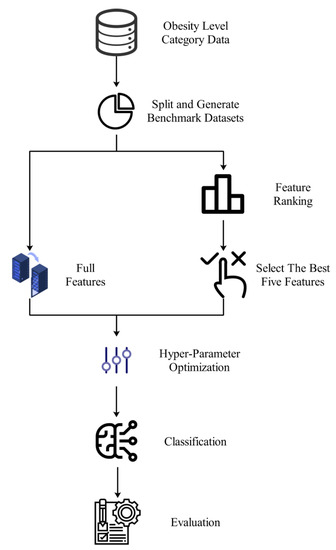
Figure 1.
Demonstration of an end-to-end workflow diagram of the proposed system.
3. Results
Table 4 presents the performance measure of each trial. This table shows the F1-score for each class and the accuracy. In addition, the mean of 10 trials and the standard deviation (SD) between the trials are also shown in Table 4. According to the results in this table, our model obtained 93.06% mean accuracy. When class-based results are examined, it can be seen that all classes except “Obesity Type II” were well detected.
Table 4.
Performance evaluation criteria for obesity prediction of the trained neural network model for each trial.
Another aim of this study was to measure the effects of the features used in the dataset to determine the obesity level. In the next phase of the study, feature ranking approaches were applied to our dataset to achieve this aim. For this purpose, the SelectKBest function from the feature_selection package of the sklearn library was used in Python software [42] with the trainForVal and testForVal datasets. The scores of the features, calculated by score functions, are shown in Table 5. In this table, a low score indicates that the effect of the feature is higher in determining the class.
Table 5.
Results of feature importance scores for feature selection methods.
A bar chart of scores, shown in Figure 2, was drawn to show the effect of attributes. Since there is an inverse relationship between the score and the class determination effect, the y-axis of these bar charts represents the .
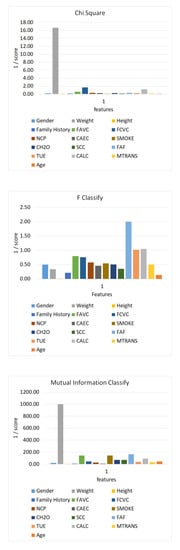
Figure 2.
Bar chart of feature class determination scores. Each chart shows the importance of features in the data in the corresponding feature selection algorithm.
In the final phase of experiments, optimizing and classification processes were repeated by choosing the best five features to measure the effect of feature selection algorithms on the classification algorithm. In this regard, weight, FCVC, CALC, FAVC, and FAF features were selected using chi-square; FAF, CALC, TUE, FAVC, and FCVC features were selected using F-Classify; and weight, FAF, smoke, FAVC, and CALC features were selected using mutual information classification. The same lowest and highest values were used for parameter optimization, and the exact steps were applied using the same datasets. The optimum hyperparameters for each feature selection technique are shown in Table 6.
Table 6.
Optimum values of hyperparameters of the neural network model that are trained using features selected by feature selection algorithms.
After parameter optimization, a separate model was trained ten times for each method using optimum hyperparameters, similarly to the model that used all of the features in the training and testing datasets. Table 7 shows the mean accuracy, mean weighted average F1-score (mean F1-score), SD between accuracy computed in each trial (SD accuracy), SD between weighted average F1-score computed in each trial (SD F1-score), sensitivity, specificity, and Brier score for multi-class classification. The result of the model, which was trained used all of the features, was also added to this table to easily make comparisons between models. The results showed that the model obtained using the features selected with F-Classify had a better performance. Furthermore, when Brier scores were examined, scores of 0.094, 0.147, 0.122, and 0.194 were obtained for the NN which was created after feature selection with the NN model, where all variables from the chi-square, F-Classify, and mutual information classification variable selection algorithms were used. The lowest Brier score was obtained for the NN model using all variables (Brier score = 0.094) and this was the model showing the best calibration. When variable selection methods were compared in terms of calibration, the NN model created after the F-Classify algorithm showed the best calibration (Brier score = 0.122). Therefore, F-Classify was the approach that showed the best performance, provided the best calibration, and selected the most relevant features for the model among the feature selection methods. From this point of view, physical activity, alcohol consumption, the duration of use of technological devices, frequent consumption of high-calorie meals, and the frequency of vegetable consumption are the most important features affecting obesity levels.
Table 7.
Performance evaluation criteria for trained neural network and comparison of different feature selection methods.
4. Discussion
In this study, we developed a neural network-based classification model for the prediction of obesity levels based on physical activity levels and eating habits. The F-Classify, chi-square, and mutual information classification algorithms were used to identify risk factors associated with obesity. The hyperparameters of the models were optimized using the Bayesian optimization technique, which is faster and more effective than traditional techniques. The results show that for the purpose of estimating obesity levels, results close to those of the model in which all features were used can be obtained using fewer features. The best features were selected using the F-Classify score function, and physical activity and dietary habits were important for obesity prediction. The model trained with the features selected using chi-square was the most robust. Furthermore, according to the Brier score results, the calibration of the model trained after F-Classify was the best among the feature selection approaches.
The results were compared with the two most recent established methods in the literature for the purpose of estimating the level of obesity. The first method was developed by Kivrak using deep learning, and 82.00% accuracy was obtained [1]. In the current study, the trained neural network model was more successful in estimating obesity levels. Even the lowest-performing model, using features selected by the reciprocal information classification, achieved statistically better accuracy than a two-tailed Z-test [43], with p values less than 0.1. In another study in the literature, several decision tree algorithms were used by De-La-Hoz-Correa et al. [44], and 97.8% accuracy was obtained in the estimation of obesity level using the J48 algorithm. The J48 model achieved 0% accuracy in classifying the “Obesity Type III” class, although the authors achieved better accuracy than the models trained in the current study. Therefore, the model developed in the current study can be considered to be more robust than this model.
In addition, most of the studies in the relevant literature have focused on identifying risk factors that cause obesity. In one study, the authors defined the overall pattern of pediatric obesity development and the onset of early childhood obesity. However, they developed the XGBoost model to predict whether individuals had early obesity. With the XGBoost model, the accuracy was 30.90%, the F1-score was 44.60%, the accuracy was 66.14%, and the specificity was 63.27% [45]. Another study was conducted with a total of 7162 participants, and 11 different methods were applied to predict obesity. The highest sensitivity value was obtained with the J48 algorithm (72.9%), and it was reported that physical activity was an essential factor in the prediction of obesity, but factors such as gender, age, and race were less important [46]. The model developed in the current study outperformed the related studies described above in predicting obesity, and similarly, we found physical activity to be among the top five risk factors for obesity levels, as reported in similar clinical research [47,48].
In a study with similar results in the literature, conducted by Janssen et al. [6,49], the prevalence of overweight and obesity was exceptionally high in North America, Great Britain, and Southwest European countries. In most countries, physical activity levels were lower in overweight youth compared to normal weight youth, and obesity was associated with physical activity levels [49]. In another study, relative childhood weight was associated with slightly higher physical activity levels [50].
Among Malaysian children with Autism Spectrum Disorder, low physical activity, low probability of food refusal, and high probability of food selectivity were found to be risk factors for body mass index [51]. Evidence for the causes of obesity indicates a causal role of sedentary behavior [52]. A sedentary lifestyle doubles the risk of being overweight among schoolchildren [53]. Physical activity and a sedentary lifestyle are among the most critical behavioral determinants of overweight and obesity in children and adolescents [54]. Obese children have lower physical activity levels than non-obese children [9]. The effectiveness of physical activity in preventing obesity can probably be explained by preventing fat accumulation in the body by accelerating calorie burning. Studies have investigated whether BMI and/or body fatness are related to physical activity in bouts of under 10 min [55,56,57,58]. Indeed, one of the experimental studies was conducted by Ebisu et al., and the results showed that multiple runs equivalent to 30 min per day (i.e., three sessions of 10 min) over eight weeks improved high-density lipoprotein (HDL) in young men [59]. Our findings and other research in the literature show that physical activity is associated with obesity, and as a result of this, physical activity is an important tool for preventing and reducing body fat. In the current study, physical activity levels and certain dietary habits (such as consuming high-calorie foods and frequency of vegetable consumption) were among the most important risk factors for obesity level estimation.
In another study confirming the results of the present study, the most important determinants of obesity were identified as eating habits for adolescents [60]. Lack of physical exercise and time spent engaged in sedentary activities have been found to be predictors of obesity for young and middle-aged adults [60]. In one study, a generalized prediction equation model showed that slower eating prevents the development of obesity [61]. In another study, regular eating habits were an essential parameter in preventing obesity [53]. Among the most critical behavioral determinants of overweight and obesity in children and adolescents is excessive consumption of energy-dense foods [54]. Obese children have higher levels of food addiction than non-obese children [9]. The reason why eating habits can lead to being obese or overweight may be that diets contain more and more high-calorie and, at the same time, high-fat foods, leading to a significant accumulation of fat in the body.
This study has some limitations. Obesity has a complex structure. It is expected that more factors, such as blood values or the presence of diabetes, will need to be considered in order to obtain a more reliable estimate. There are also many biomarkers for obesity; microRNA, adipocytes, oxidative stress, blood cell profile, nutrients, and microbiota are promising biomarkers for determining the occurrence of obesity. The current research is limited, as different data that may elucidate other risk factors for clinical obesity are not provided, and predictive models that examine demographic or clinical biomarkers with different structural characteristics can be developed in future studies. For this purpose, in future studies, patients’ demographic information; clinical, genomic, and metabolomics data; and data based on imaging techniques can be used in obesity level estimation and biomarker discovery research. Another limitation of the current study is the small sample size in the Obesity Type I category. In this study, the sample numbers in the Obesity Type I class were lower because the BMI results were classified according to the WHO ranges for the total sample. However, all categories were included in the modeling to avoid disturbing the clinical characterization. As a result of this situation, it can be concluded that the model is nearly robust except for the “Obesity Type I” category, according to the SD values. The reason for the high SD value for “Obesity Type I” is the small number of samples. “Obesity Type I” was predicted incorrectly in only two trials, but the SD deviation was high because the number of samples was one. In order to estimate obesity levels, there is a need for new studies in which larger samples are examined in multicenter trials, and this limitation can be overcome. Another limitation of this study was that it lacked external validation by an independent cohort, which could provide further evidence to confirm the superiority of the proposed prediction model. Further expansion of the current study is essential to include multicenter trials in future studies or to use relevant data from different centers for external validation.
5. Conclusions
The main finding of this study was that the most important risk factors in predicting obesity are eating habits and physical activity levels. The analysis of obesity/overweight data using ML algorithms in the current research did not produce brand-new risk factors. However, it did help us to understand some information: first, how the identified risk factors are related to weight change, and second, how the results will guide research aimed at preventing “obesity and overweight” and promoting a healthy lifestyle. Consequently, increasing participation in physical activity and regulating eating habits should be the focus of strategies for the prevention and treatment of overweight and obesity.
Author Contributions
Conceptualization, F.H.Y., M.G., Y.G., A.C.-B. and C.C.; data curation, F.H.Y., M.G. and Y.G.; formal analysis, F.H.Y., M.G. and Y.G.; methodology, F.H.Y., M.G. and Y.G.; supervision, F.H.Y., M.G., Y.G., A.C.-B., C.C., G.G., F.F. and S.C.; writing—original draft, F.H.Y., M.G., Y.G., A.C.-B., C.C., G.G., F.F. and S.C.; writing—review and editing, F.H.Y., M.G., Y.G., A.C.-B., C.C., G.G., F.F. and S.C. All authors have read and agreed to the published version of the manuscript.
Funding
This research received no external funding.
Institutional Review Board Statement
The study was conducted according to the guidelines of the Declaration of Helsinki and approved by Inonu University Health Sciences Non-Interventional Clinical Research Ethics Committee (Approval Number 2022/4190).
Informed Consent Statement
Informed consent was obtained from all subjects involved in the study.
Data Availability Statement
Data are available for research purposes upon reasonable request to the corresponding author.
Conflicts of Interest
The authors declare no conflict of interest.
References
- Kivrak, M. Deep Learning-Based Prediction of Obesity Levels According to Eating Habits and Physical Condition. J. Cogn. Syst. 2021, 6, 24–27. [Google Scholar] [CrossRef]
- Hernández Álvarez, G.M. Prevalencia de Sobrepeso y Obesidad, y Factores de Riesgo, en Niños de 7-12 Años, en una Escuela Pública de Cartagena Septiembre-Octubre de 2010. 2011. Available online: https://repositorio.unal.edu.co/handle/unal/7739 (accessed on 17 January 2023).
- Obesity and Overweight. Available online: https://www.who.int/news-room/fact-sheets/detail/obesity-and-overweight (accessed on 1 January 2023).
- Cecchini, M.; Vuik, S. The Heavy Burden of Obesity; OCED: Paris, France, 2019. [Google Scholar]
- Colditz, G.A. Economic costs of obesity and inactivity. Med. Sci. Sport. Exerc. 1999, 31, S663–S667. [Google Scholar] [CrossRef] [PubMed]
- Gil-Rojas, Y.; Garzón, A.; Hernández, F.; Pacheco, B.; González, D.; Campos, J.; Mosos, J.D.; Barahona, J.; Polania, M.J.; Restrepo, P. Burden of disease attributable to obesity and overweight in Colombia. Value Health Reg. Issues 2019, 20, 66–72. [Google Scholar] [CrossRef] [PubMed]
- Oshinubi, K.; Rachdi, M.; Demongeot, J. Analysis of reproduction number R0 of COVID-19 using current health expenditure as gross domestic product percentage (CHE/GDP) across countries. Healthcare 2021, 9, 1247. [Google Scholar] [CrossRef] [PubMed]
- Van Baal, P.H.M.; Polder, J.J.; de Wit, G.A.; Hoogenveen, R.T.; Feenstra, T.L.; Boshuizen, H.C.; Engelfriet, P.M.; Brouwer, W.B.F. Lifetime medical costs of obesity: Prevention no cure for increasing health expenditure. PLoS Med. 2008, 5, e29. [Google Scholar] [CrossRef]
- Gülü, M.; Yapici, H.; Mainer-Pardos, E.; Alves, A.R.; Nobari, H. Investigation of obesity, eating behaviors and physical activity levels living in rural and urban areas during the covid-19 pandemic era: A study of Turkish adolescent. BMC Pediatr. 2022, 22, 405. [Google Scholar] [CrossRef]
- Reidpath, D.D.; Burns, C.; Garrard, J.; Mahoney, M.; Townsend, M. An ecological study of the relationship between social and environmental determinants of obesity. Health Place 2002, 8, 141–145. [Google Scholar] [CrossRef]
- Cohen, D.A.; Finch, B.K.; Bower, A.; Sastry, N. Collective efficacy and obesity: The potential influence of social factors on health. Soc. Sci. Med. 2006, 62, 769–778. [Google Scholar] [CrossRef]
- Lamerz, A.; Kuepper-Nybelen, J.; Wehle, C.; Bruning, N.; Trost-Brinkhues, G.; Brenner, H.; Hebebrand, J.; Herpertz-Dahlmann, B. Social class, parental education, and obesity prevalence in a study of six-year-old children in Germany. Int. J. Obes. 2005, 29, 373–380. [Google Scholar] [CrossRef]
- Ng, M.; Fleming, T.; Robinson, M.; Thomson, B.; Graetz, N.; Margono, C.; Mullany, E.C.; Biryukov, S.; Abbafati, C.; Abera, S.F. Global, regional, and national prevalence of overweight and obesity in children and adults during 1980–2013: A systematic analysis for the Global Burden of Disease Study 2013. Lancet 2014, 384, 766–781. [Google Scholar] [CrossRef]
- Ford, E.S.; Mokdad, A.H. Epidemiology of obesity in the Western Hemisphere. J. Clin. Endocrinol. Metab. 2008, 93, S1–S8. [Google Scholar] [CrossRef]
- Fontaine, K.R.; Redden, D.T.; Wang, C.; Westfall, A.O.; Allison, D.B. Years of life lost due to obesity. JAMA 2003, 289, 187–193. [Google Scholar] [CrossRef] [PubMed]
- Berrington de Gonzalez, A.; Hartge, P.; Cerhan, J.R.; Flint, A.J.; Hannan, L.; MacInnis, R.J.; Moore, S.C.; Tobias, G.S.; Anton-Culver, H.; Freeman, L.B.; et al. Body-mass index and mortality among 1.46 million white adults. N. Engl. J. Med. 2010, 363, 2211–2219. [Google Scholar] [CrossRef]
- Whitlock, G.; Lewington, S.; Sherliker, P.; Clarke, R.; Emberson, J.; Halsey, J.; Qizilbash, N.; Collins, R.; Peto, R. Body-mass index and cause-specific mortality in 900 000 adults: Collaborative analyses of 57 prospective studies. Lancet 2009, 373, 1083–1096. [Google Scholar] [CrossRef] [PubMed]
- Pischon, T.; Boeing, H.; Hoffmann, K.; Bergmann, M.; Schulze, M.B.; Overvad, K.; van der Schouw, Y.T.; Spencer, E.; Moons, K.G.; Tjønneland, A.; et al. General and abdominal adiposity and risk of death in Europe. N. Engl. J. Med. 2008, 359, 2105–2120. [Google Scholar] [CrossRef]
- Jaacks, L.M.; Vandevijvere, S.; Pan, A.; McGowan, C.J.; Wallace, C.; Imamura, F.; Mozaffarian, D.; Swinburn, B.; Ezzati, M. The obesity transition: Stages of the global epidemic. Lancet Diabetes Endocrinol. 2019, 7, 231–240. [Google Scholar] [CrossRef]
- Lavie, C.J.; McAuley, P.A.; Church, T.S.; Milani, R.V.; Blair, S.N. Obesity and cardiovascular diseases: Implications regarding fitness, fatness, and severity in the obesity paradox. J. Am. Coll. Cardiol. 2014, 63, 1345–1354. [Google Scholar] [CrossRef]
- Koh-Banerjee, P.; Franz, M.; Sampson, L.; Liu, S.; Jacobs Jr, D.R.; Spiegelman, D.; Willett, W.; Rimm, E. Changes in whole-grain, bran, and cereal fiber consumption in relation to 8-y weight gain among men. Am. J. Clin. Nutr. 2004, 80, 1237–1245. [Google Scholar] [CrossRef] [PubMed]
- Ford, E.S. The epidemiology of obesity and asthma. J. Allergy Clin. Immunol. 2005, 115, 897–909. [Google Scholar] [CrossRef]
- Bakhshi, E.; Koohpayehzadeh, J.; Seifi, B.; Rafei, A.; Biglarian, A.; Asgari, F.; Etemad, K.; BIDHENDI, Y.R. Obesity and related factors in Iran: The STEPS Survey, 2011. Iran. Red Crescent Med. J. 2015, 17, e22479. [Google Scholar] [CrossRef]
- Sarlio-Lähteenkorva, S.; Silventoinen, K.; Lahelma, E. Relative weight and income at different levels of socioeconomic status. Am. J. Public Health 2004, 94, 468–472. [Google Scholar] [CrossRef] [PubMed]
- Bonauto, D.K.; Lu, D.; Fan, Z.J. Peer reviewed: Obesity prevalence by occupation in Washington State, behavioral risk factor surveillance system. Prev. Chronic Dis. 2014, 11, E04. [Google Scholar] [CrossRef] [PubMed]
- John, U.; Hanke, M.; Rumpf, H.; Thyrian, J. Smoking status, cigarettes per day, and their relationship to overweight and obesity among former and current smokers in a national adult general population sample. Int. J. Obes. 2005, 29, 1289–1294. [Google Scholar] [CrossRef] [PubMed]
- Besson, H.; Ekelund, U.; Luan, J.; May, A.; Sharp, S.; Travier, N.; Agudo, A.; Slimani, N.; Rinaldi, S.; Jenab, M. A cross-sectional analysis of physical activity and obesity indicators in European participants of the EPIC-PANACEA study. Int. J. Obes. 2009, 33, 497–506. [Google Scholar] [CrossRef] [PubMed]
- Kahan, S. Overweight and obesity management strategies. Am. J. Manag. Care 2016, 22, s186–s196. [Google Scholar]
- Popkin, B.M.; Adair, L.S.; Ng, S.W. Global nutrition transition and the pandemic of obesity in developing countries. Nutr. Rev. 2012, 70, 3–21. [Google Scholar] [CrossRef]
- Spiegelman, B.M.; Flier, J.S. Obesity and the regulation of energy balance. Cell 2001, 104, 531–543. [Google Scholar] [CrossRef]
- Mondal, P.K.; Foysal, K.H.; Norman, B.A.; Gittner, L.S. Predicting Childhood Obesity Based on Single and Multiple Well-Child Visit Data Using Machine Learning Classifiers. Sensors 2023, 23, 759. [Google Scholar] [CrossRef]
- Dhal, P.; Azad, C. A comprehensive survey on feature selection in the various fields of machine learning. Appl. Intell. 2022, 52, 4543–4581. [Google Scholar] [CrossRef]
- Palechor, F.M.; de la Hoz Manotas, A. Dataset for estimation of obesity levels based on eating habits and physical condition in individuals from Colombia, Peru and Mexico. Data Brief 2019, 25, 104344. [Google Scholar] [CrossRef]
- Keras: The Python Deep Learning API. 2022. Available online: https://keras.io/ (accessed on 13 December 2022).
- Heidari, A.A.; Faris, H.; Aljarah, I.; Mirjalili, S. An efficient hybrid multilayer perceptron neural network with grasshopper optimization. Soft Comput. 2019, 23, 7941–7958. [Google Scholar] [CrossRef]
- Wu, J.; Chen, X.-Y.; Zhang, H.; Xiong, L.-D.; Lei, H.; Deng, S.-H. Hyperparameter optimization for machine learning models based on Bayesian optimization. J. Electron. Sci. Technol. 2019, 17, 26–40. [Google Scholar]
- Jones, D.R. A taxonomy of global optimization methods based on response surfaces. J. Glob. Optim. 2001, 21, 345–383. [Google Scholar] [CrossRef]
- Head, T.; Kumar, M.; Nahrstaedt, H.; Louppe, G.; Shcherbatyi, I. Scikit-Optimize: Sequential Model-Based Optimization in Python—Scikit-Optimize 0.8.1 Documentation. 2022. Available online: https://scikit-optimize.github.io/stable/user_guide.html (accessed on 13 December 2022).
- Celik, C.; Bilge, H.S. Feature Selection With Weighted Conditional Mutual Information. J. Gazi Univ. Fac. Eng. Archit. 2015, 30, 585–596. [Google Scholar]
- Takahashi, K.; Yamamoto, K.; Kuchiba, A.; Koyama, T. Confidence interval for micro-averaged F1 and macro-averaged F1 scores. Appl. Intell. 2022, 52, 4961–4972. [Google Scholar] [CrossRef]
- Assel, M.; Sjoberg, D.D.; Vickers, A.J. The Brier score does not evaluate the clinical utility of diagnostic tests or prediction models. Diagn. Progn. Res. 2017, 1, 19. [Google Scholar] [CrossRef]
- sklearn.feature_selection.SelectKBest. Scikit-Learn. 2022. Available online: https://scikit-learn/stable/modules/generated/sklearn.feature_selection.SelectKBest.html (accessed on 13 December 2022).
- Stangroom, J. Z Score Calculator for 2 Population Proportions. Soc. Sci. Stat 2016. Available online: https://www.socscistatistics.com/tests/ztest/ (accessed on 23 December 2022).
- De-La-Hoz-Correa, E.; Mendoza Palechor, F.; De-La-Hoz-Manotas, A.; Morales Ortega, R.; Sánchez Hernández, A.B. Obesity Level Estimation Software Based on Decision Trees. J. Comput. Sci. 2019, 15, 67–77. [Google Scholar] [CrossRef]
- Pang, X.; Forrest, C.B.; Lê-Scherban, F.; Masino, A.J. Prediction of early childhood obesity with machine learning and electronic health record data. Int. J. Med. Inform. 2021, 150, 104454. [Google Scholar] [CrossRef]
- Cheng, X.; Lin, S.-Y.; Liu, J.; Liu, S.; Zhang, J.; Nie, P.; Fuemmeler, B.F.; Wang, Y.; Xue, H. Does physical activity predict obesity—A machine learning and statistical method-based analysis. Int. J. Environ. Res. Public Health 2021, 18, 3966. [Google Scholar] [CrossRef]
- Adams, S.A.; Der Ananian, C.A.; DuBose, K.D.; Kirtland, K.A.; Ainsworth, B.E. Physical activity levels among overweight and obese adults in South Carolina. South. Med. J. 2003, 96, 539–544. [Google Scholar] [CrossRef]
- Carbone, S.; Del Buono, M.G.; Ozemek, C.; Lavie, C.J. Obesity, risk of diabetes and role of physical activity, exercise training and cardiorespiratory fitness. Prog. Cardiovasc. Dis. 2019, 62, 327–333. [Google Scholar] [CrossRef]
- Janssen, I.; Katzmarzyk, P.T.; Boyce, W.F.; Vereecken, C.; Mulvihill, C.; Roberts, C.; Currie, C.; Pickett, W. Comparison of overweight and obesity prevalence in school-aged youth from 34 countries and their relationships with physical activity and dietary patterns. Obes. Rev. 2005, 6, 123–132. [Google Scholar] [CrossRef]
- Klesges, R.C.; Eck, L.H.; Hanson, C.L.; Haddock, C.K.; Klesges, L.M. Effects of obesity, social interactions, and physical environment on physical activity in preschoolers. Health Psychol. 1990, 9, 435. [Google Scholar] [CrossRef]
- Kamal Nor, N.; Ghozali, A.H.; Ismail, J. Prevalence of Overweight and Obesity Among Children and Adolescents With Autism Spectrum Disorder and Associated Risk Factors. Front. Pediatr. 2019, 7, 38. [Google Scholar] [CrossRef] [PubMed]
- Whitaker, R.C. Obesity prevention in pediatric primary care: Four behaviors to target. Arch. Pediatr. Adolesc. Med. 2003, 157, 725–727. [Google Scholar] [CrossRef] [PubMed]
- Al-Domi, H.A.; Faqih, A.; Jaradat, Z.; Al-Dalaeen, A.; Jaradat, S.; Amarneh, B. Physical activity, sedentary behaviors and dietary patterns as risk factors of obesity among Jordanian schoolchildren. Diabetes Metab. Syndr. Clin. Res. Rev. 2019, 13, 189–194. [Google Scholar] [CrossRef] [PubMed]
- Al-Dalaeen, A.; Al-Domi, H. Factors Associated with Obesity among School Children in Amman, Jordan. Malays. J. Nutr. 2017, 23, 211–218. [Google Scholar]
- Ayabe, M.; Kumahara, H.; Morimura, K.; Sakane, N.; Ishii, K.; Tanaka, H. Accumulation of short bouts of non-exercise daily physical activity is associated with lower visceral fat in Japanese female adults. Int. J. Sport. Med. 2013, 34, 62–67. [Google Scholar] [CrossRef]
- Cameron, N.; Godino, J.; Nichols, J.F.; Wing, D.; Hill, L.; Patrick, K. Associations between physical activity and BMI, body fatness, and visceral adiposity in overweight or obese Latino and non-Latino adults. Int. J. Obes. 2017, 41, 873–877. [Google Scholar] [CrossRef]
- Fan, J.X.; Brown, B.B.; Hanson, H.; Kowaleski-Jones, L.; Smith, K.R.; Zick, C.D. Moderate to vigorous physical activity and weight outcomes: Does every minute count? Am. J. Health Promot. 2013, 28, 41–49. [Google Scholar] [CrossRef]
- Jefferis, B.J.; Parsons, T.J.; Sartini, C.; Ash, S.; Lennon, L.T.; Wannamethee, S.G.; Lee, I.M.; Whincup, P.H. Does duration of physical activity bouts matter for adiposity and metabolic syndrome? A cross-sectional study of older British men. Int. J. Behav. Nutr. Phys. Act. 2016, 13, 36. [Google Scholar] [CrossRef] [PubMed]
- Ebisu, T. Splitting the distance of endurance running: On cardiovascular endurance and blood lipids. Jpn J. Phys. Educ. 1985, 30, 37–43. [Google Scholar]
- Siddarth, D. Risk factors for obesity in children and adults. J. Investig. Med. 2013, 61, 1039–1042. [Google Scholar] [CrossRef] [PubMed]
- Hurst, Y.; Fukuda, H. Effects of changes in eating speed on obesity in patients with diabetes: A secondary analysis of longitudinal health check-up data. BMJ Open 2018, 8, e019589. [Google Scholar] [CrossRef] [PubMed]
Disclaimer/Publisher’s Note: The statements, opinions and data contained in all publications are solely those of the individual author(s) and contributor(s) and not of MDPI and/or the editor(s). MDPI and/or the editor(s) disclaim responsibility for any injury to people or property resulting from any ideas, methods, instructions or products referred to in the content. |
© 2023 by the authors. Licensee MDPI, Basel, Switzerland. This article is an open access article distributed under the terms and conditions of the Creative Commons Attribution (CC BY) license (https://creativecommons.org/licenses/by/4.0/).