Article

Seismotectonics, Geomorphology and Paleoseismology of the Doroud Fault, a Source of Seismic Hazard in Zagros

1
Geological Survey of Iran, Zagros 68149-93113, Iran
2
UNESCO Chair on Coastal Geo-Hazard Analysis, Research Institute for Earth Sciences, Tehran 13878-35841, Iran
3
Department of Earthquake Research, Shahid Bahonar University of Kerman, Kerman 76169-13439, Iran
4
Department of Seismotectonics, International Institute of Earthquake Engineering and Seismology, Tehran 19537-14453, Iran
5
Department of Geology, University of Birjand, Birjand 97174-34765, Iran
6
Department of Geology, Shahid Bahonar University of Kerman, Kerman 76169-13439, Iran
7
Department of Earth Sciences, Utrecht University, 3584 CB Utrecht, The Netherlands
*
Author to whom correspondence should be addressed.
Appl. Sci. 2023, 13(6), 3747; https://doi.org/10.3390/app13063747
Submission received: 10 February 2023 / Revised: 7 March 2023 / Accepted: 11 March 2023 / Published: 15 March 2023
(This article belongs to the Special Issue Predictive Modeling in Mining and Geotechnical Engineering)

Abstract

:
In this study, the active tectonics, paleoseismicity, and seismic hazards of the Doroud Fault are examined through high-resolution satellite image interpretations, field investigations, outcrop and trench excavations, and the dating of geochronology samples. The Doroud Fault (DF), one of the essential segments of the Main Recent Fault in the northern margin of the Zagros mountain range, has a historical and instrumental background of high seismicity. We present the first constraints from tectonic geomorphology and paleoseismology along the Doroud Fault near the capital city of Dorud. Detailed observations from satellite imagery, field investigations, real-time kinematic (RTK) measurements, paleoseismological trenching, the radiocarbon (C14), and optically stimulated luminescence (OSL) as ages allowed us to map the fault in detail, describe and characterize its kinematics, and document its recent activity and seismic behavior (cumulative displacements, paleoseismicity, and magnitude, as well as recurrence interval) relevant to the recent seismic activity of the Doroud Fault during the late Holocene as one of the most important seismogenic faults in Zagros. Modern alluvial terraces of gullies and loess accumulations are systematically deflected and/or offset with co-seismic rupture, landslides, and scarps, indicating that the Doroud Fault has been active in the late Quaternary and is characterized by dextral strike–slip movements with a normal component. In addition, our findings provide a comprehensive analysis of the fault displacement, the timing of paleoearthquakes, and the right-lateral slip rate of the Doroud Fault. The late Holocene slip rate of the Doroud Fault using the OSL dating the gully is as follows: the minimum and maximum horizontal slip rates are estimated to be 1.82 and 2.71 mm/yr, and vertical slip rates of 1.03 and 1.53 mm/yr are calculated for the past 4600 ± 900 years in the middle segment of the fault. This study focused on a paleoseismological trench within the archeological sites of Darbe-Astaneh. The central portion of the fault has historically hosted more than nine earthquakes in the last 66 ka years, according to the study’s findings. According to paleoseismology studies, the Doroud Fault has the seismic capability to cause earthquakes with a magnitude of more than 7.4 and a total slip rate of about 3.83 ± 0.1 m. The average recurrence interval for the identified paleoearthquakes is approximately 104 ± 7 years.

1. Introduction

Paleoseismology studies with a geomorphologic viewpoint on tectonically active areas are essential for modern seismic hazard assessment and determining the seismic potential of seismogenic faults over much more extended periods than instrumental measurements [1]; moreover, these studies provide tightly constrained data for the location, size, and recurrence of large earthquakes associated with surface rupture in recent geological time, which are critical for the assessment of seismic potential and hazards along active faults [2,3,4,5]. Strike–slip faults have played a critical role in the development of paleoseismology for several reasons. First, strike–slip faults are often the longest faults on continental landmasses and typically have conspicuous geomorphic expressions [6,7]. Second, many of these faults have long records of seismicity because they pass through populated continental regions and have experienced surface ruptures during large and great historical earthquakes. Third, because coseismic deformation along strike–slip faults is horizontal, subsequent earthquakes do not deeply bury or expose erosion or traces of earlier events [5]. Using earthquake geology, paleoseismology, and archaeology in regions with long historical records, we can determine earthquake construction, potentially slippery conditions, and slip allocation over multiple earthquake cycles [8]. Paleoseismic research aims to ascertain past earthquake activity by locating fault movements, rupture sites, and slip/ground shaking strength distributions. One of the most fundamental principles of paleoseismology is reconstructing the sequence of past earthquakes in relatively young geological units [9]. One of the primary goals of earthquake geology and seismology is to determine the earthquake recurrence interval, which permits probabilistic predictions of the time and magnitude of future earthquakes along a fault [10,11,12,13]. Iran, located in the Alpine-Himalayan belt, is one of the most seismically active areas on the planet. Its seismic activity is distributed along the same active fault lines (Figure 1), with individual faults rupturing every few hundred to thousands of years during strong earthquakes with a magnitude higher than 7.4 [14,15,16,17,18,19,20,21,22]. Iran experienced 145 earthquakes with a magnitude higher than 5.5 between 1900 and 2022, which resulted in 190,300 fatalities. More than 1000 people were killed in 17 of these earthquakes, 11 of which had a magnitude of 7 or higher [23]. The magnitude and time of the last seismic events are crucial to figuring out the earthquake’s recurrence. Understanding a fault’s past behavior can help predict how it might behave in the future, which can help with loss mitigation and seismic hazard estimation.
The Zagros mountain range (Figure 1a), one of the main structural zones of SW Iran, which includes a large number of Iran’s devastating earthquakes, is a fold-and-thrust belt at the leading edge of the Arabia–Eurasia continental collision zone, which accounts for about one-third of the collision zone’s overall 20 to 30 mm/year convergence rate [25,26]. The perceptive impact of large-magnitude earthquakes and the intervening destructive episodes of historical and antique cultural heritage sites located in earthquake-prone areas near active faults (especially in the Zagros) are of scientific, architectural, engineering, cultural, and social significance. The Main Recent Fault (MRF), located on the northwestern side of the Zagros Mountains (Figure 1b), is the most active fault system in the region where the convergence of the Arabian and Eurasian plates is oblique to the range’s trend [27,28,29]. The oblique convergence is consummated by the spatial separation of the strike–slip and reverse components on parallel faults [30,31]. It seems that a significant portion of the strike–slip mechanism is spent along the MRF [32]. The trend of the MRF along its length changes from ~330° in the northwest, between Nahavand and Borujerd, to ~300° in the central part and to ~315° in the Doroud–Borujerd basin, where it ends in frequent splay faults. Based on the geomorphology along with the northwestern and southeastern general segments of the MRF, as well as the focal mechanism of earthquakes, some researchers (e.g., [30]) suggest that the normal slip vector is approximately parallel to the middle segment (Doroud Fault), which has experienced destructive earthquakes (Figure 2a). The Doroud Fault, throughout its length, has cut through Quaternary sedimentary units, the Bakhtyari formation (Pliocene–Pleistocene), Khanehkat–Neyriz formations (Triassic–Jurassic), Gerey and limestone rock units (Triassic–Jurassic), and Dalan (Permian) and Mila formations (Cambrian–Late Ordovician) (Figure 2b). Within and on the border of the rock units, the Doroud Fault trace with a deformation of the geomorphic features can be clearly seen. In this paper, the geomorphology and paleoseismology of the Doroud Fault, as well as its geometry and kinematics, are investigated. The primary goal of this research is to improve seismic hazard assessments, thereby providing the means to mitigate the eventual devastation caused by large earthquakes resulting from the activity of the Doroud Fault. A crucial factor in determining the seismic potential of active faults is the slip rate. The lateral slip rate of strike–slip faults is estimated by reconstructing the offset of linear features with known ages. Geomorphological analysis of surface features, such as offset channels [33,34,35,36,37,38], can be used to figure out the offsets, or paleoseismological trenching can be used to measure the offsets from linear features that are buried, such as paleochannels [39,40,41,42,43,44]. In this study, paleoseismology and geomorphology were used appropriately to determine the slip rate of the Doroud Fault in order to understand its seismic behavior and accurately assess the earthquake risk in SW Iran.

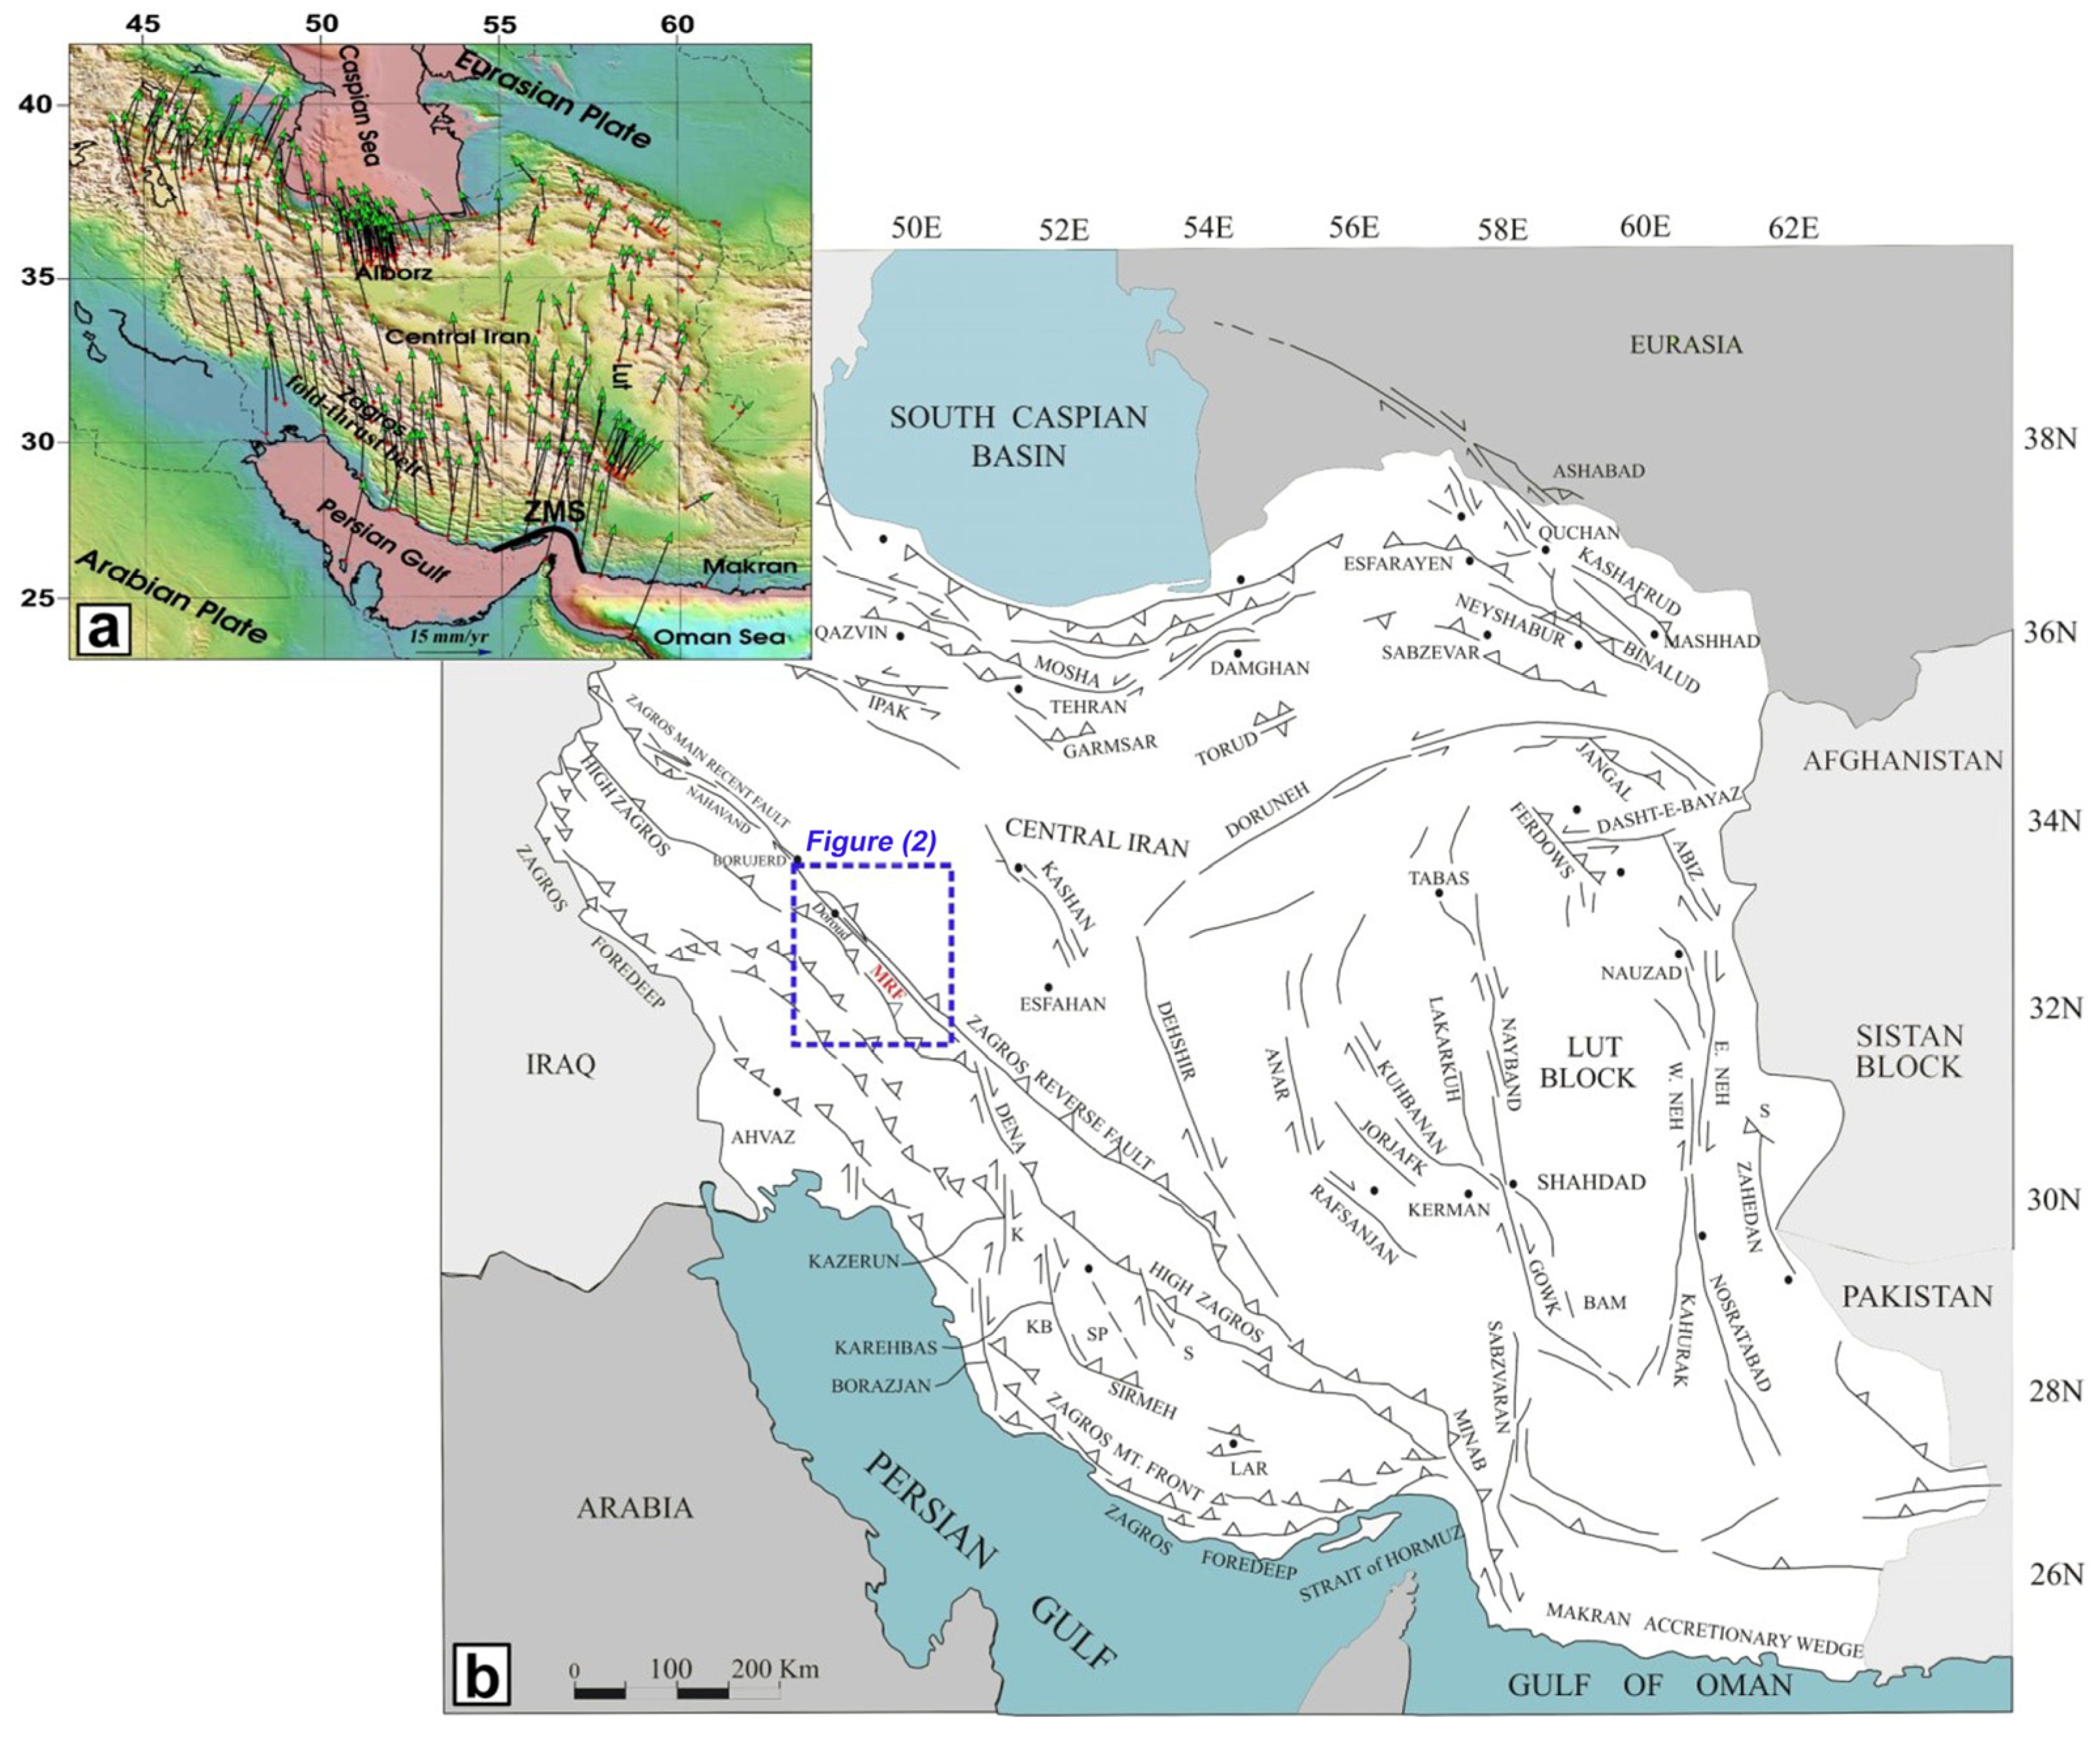
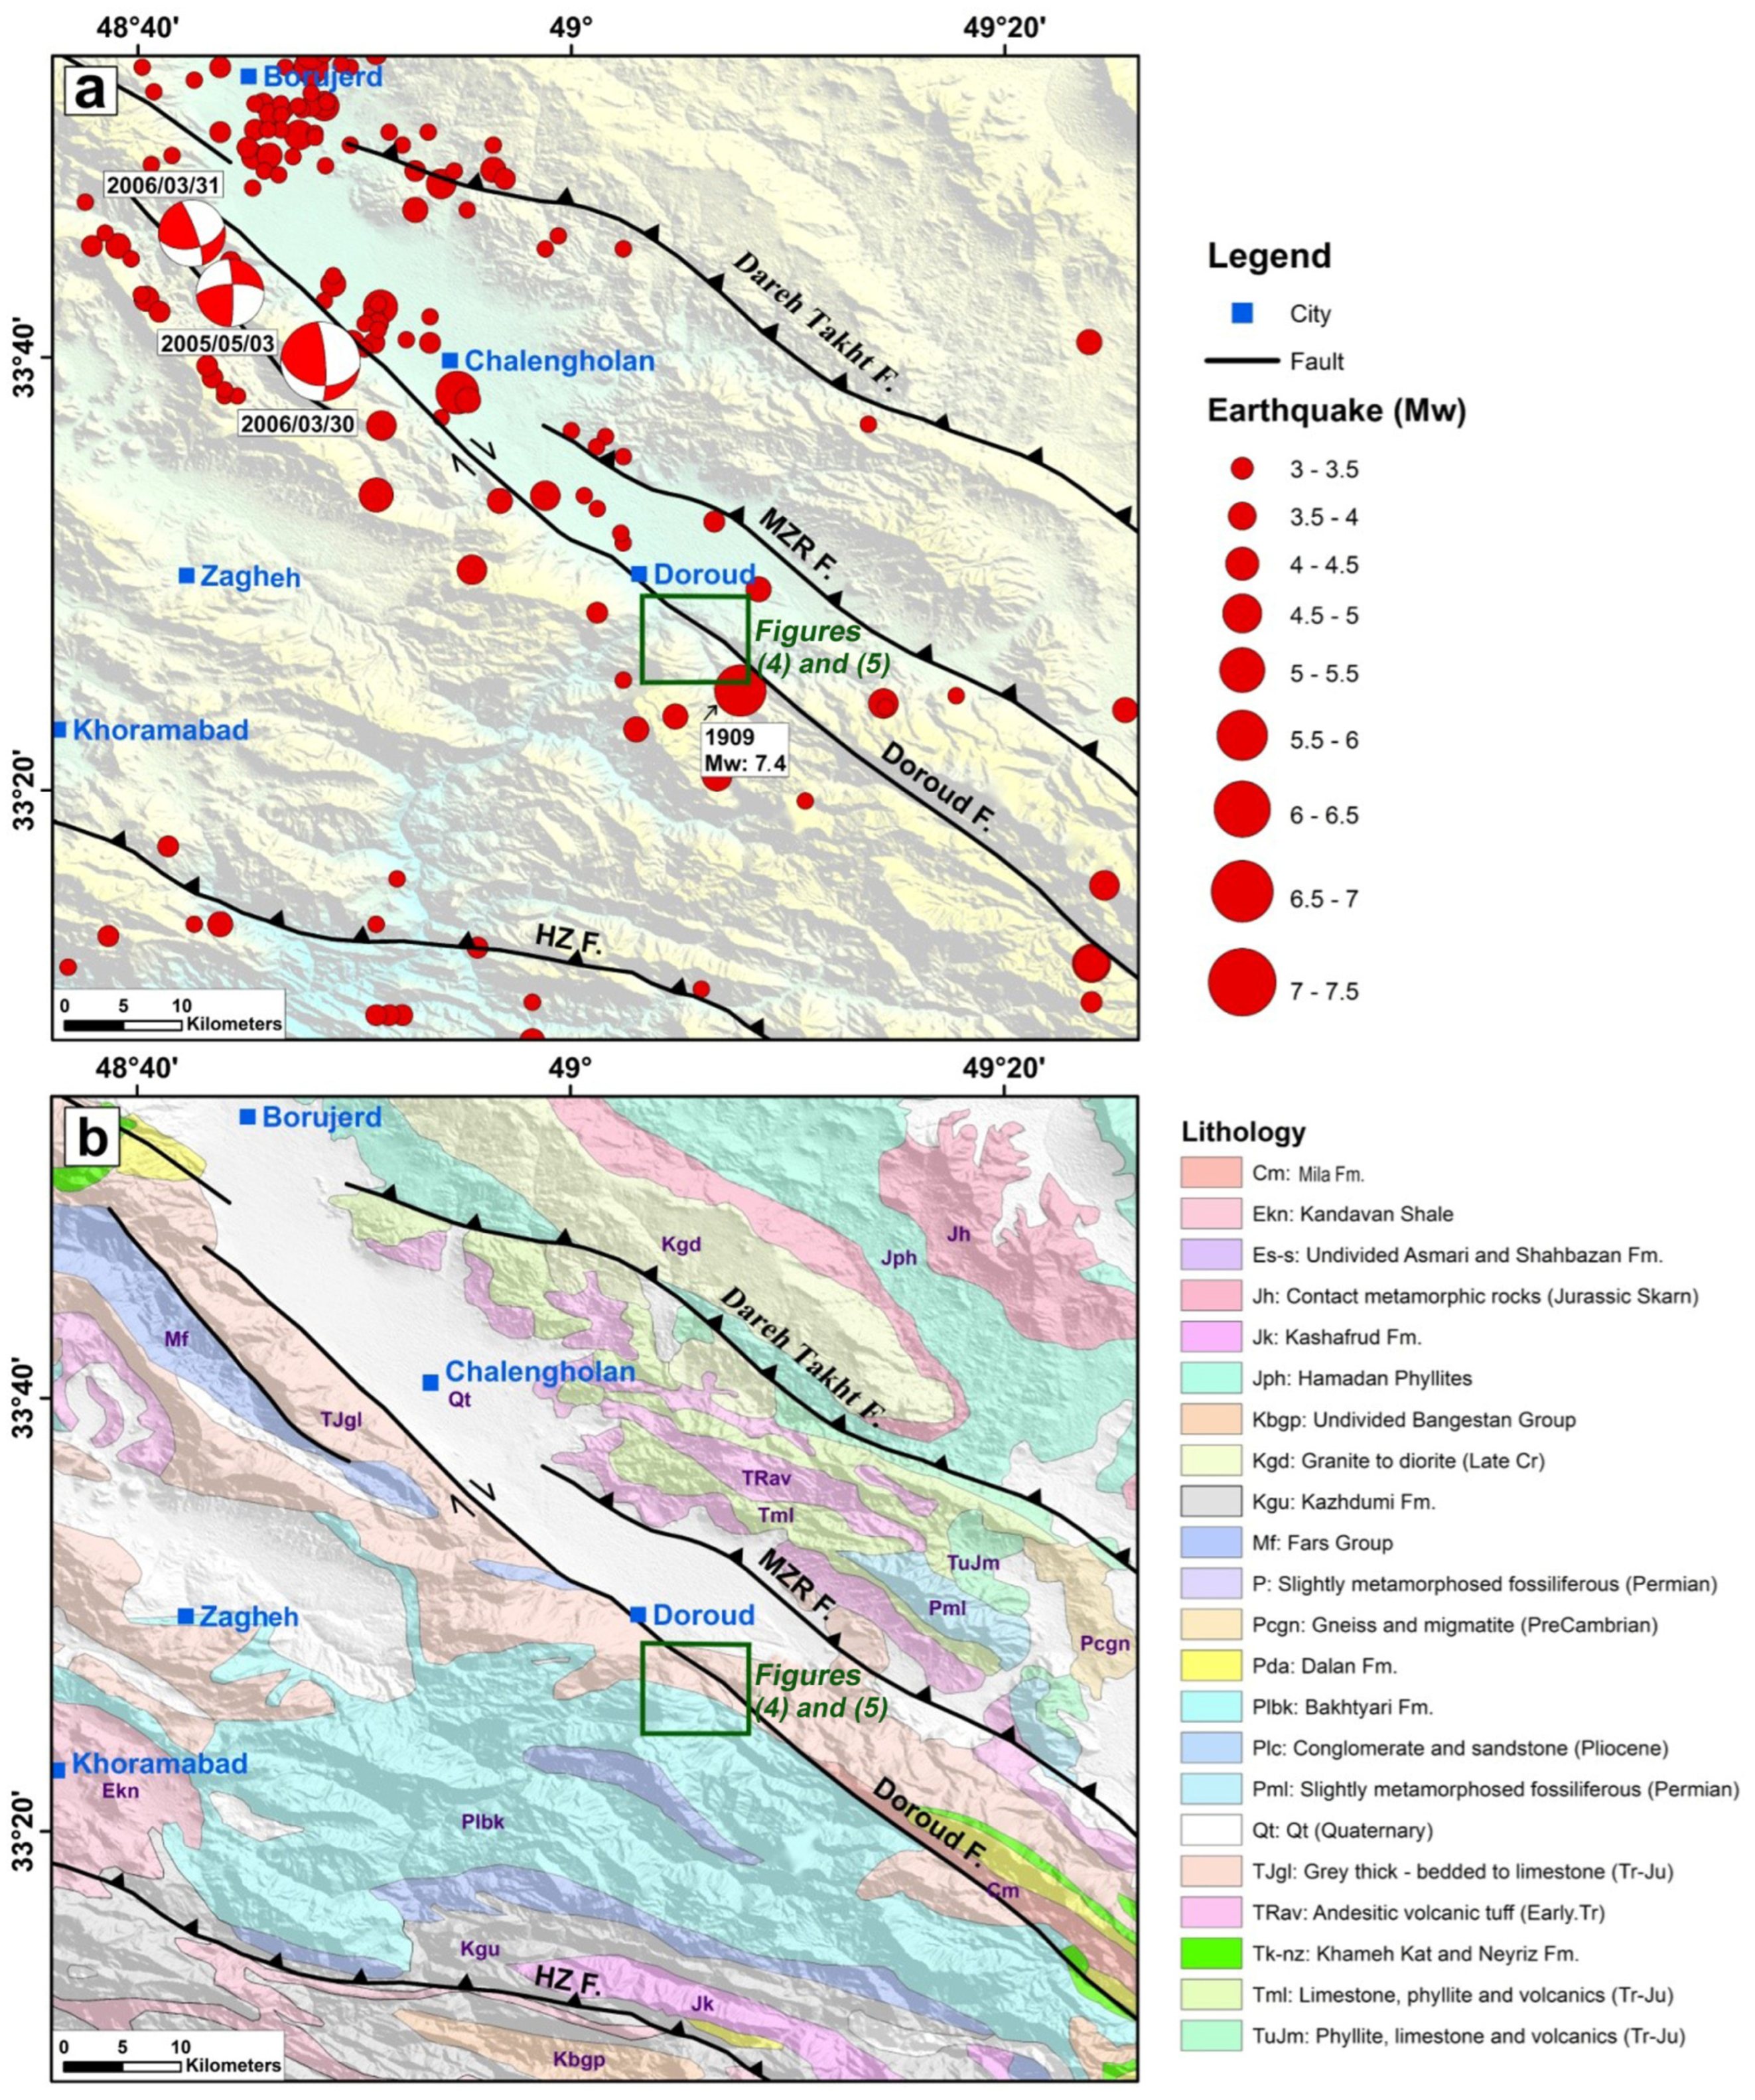
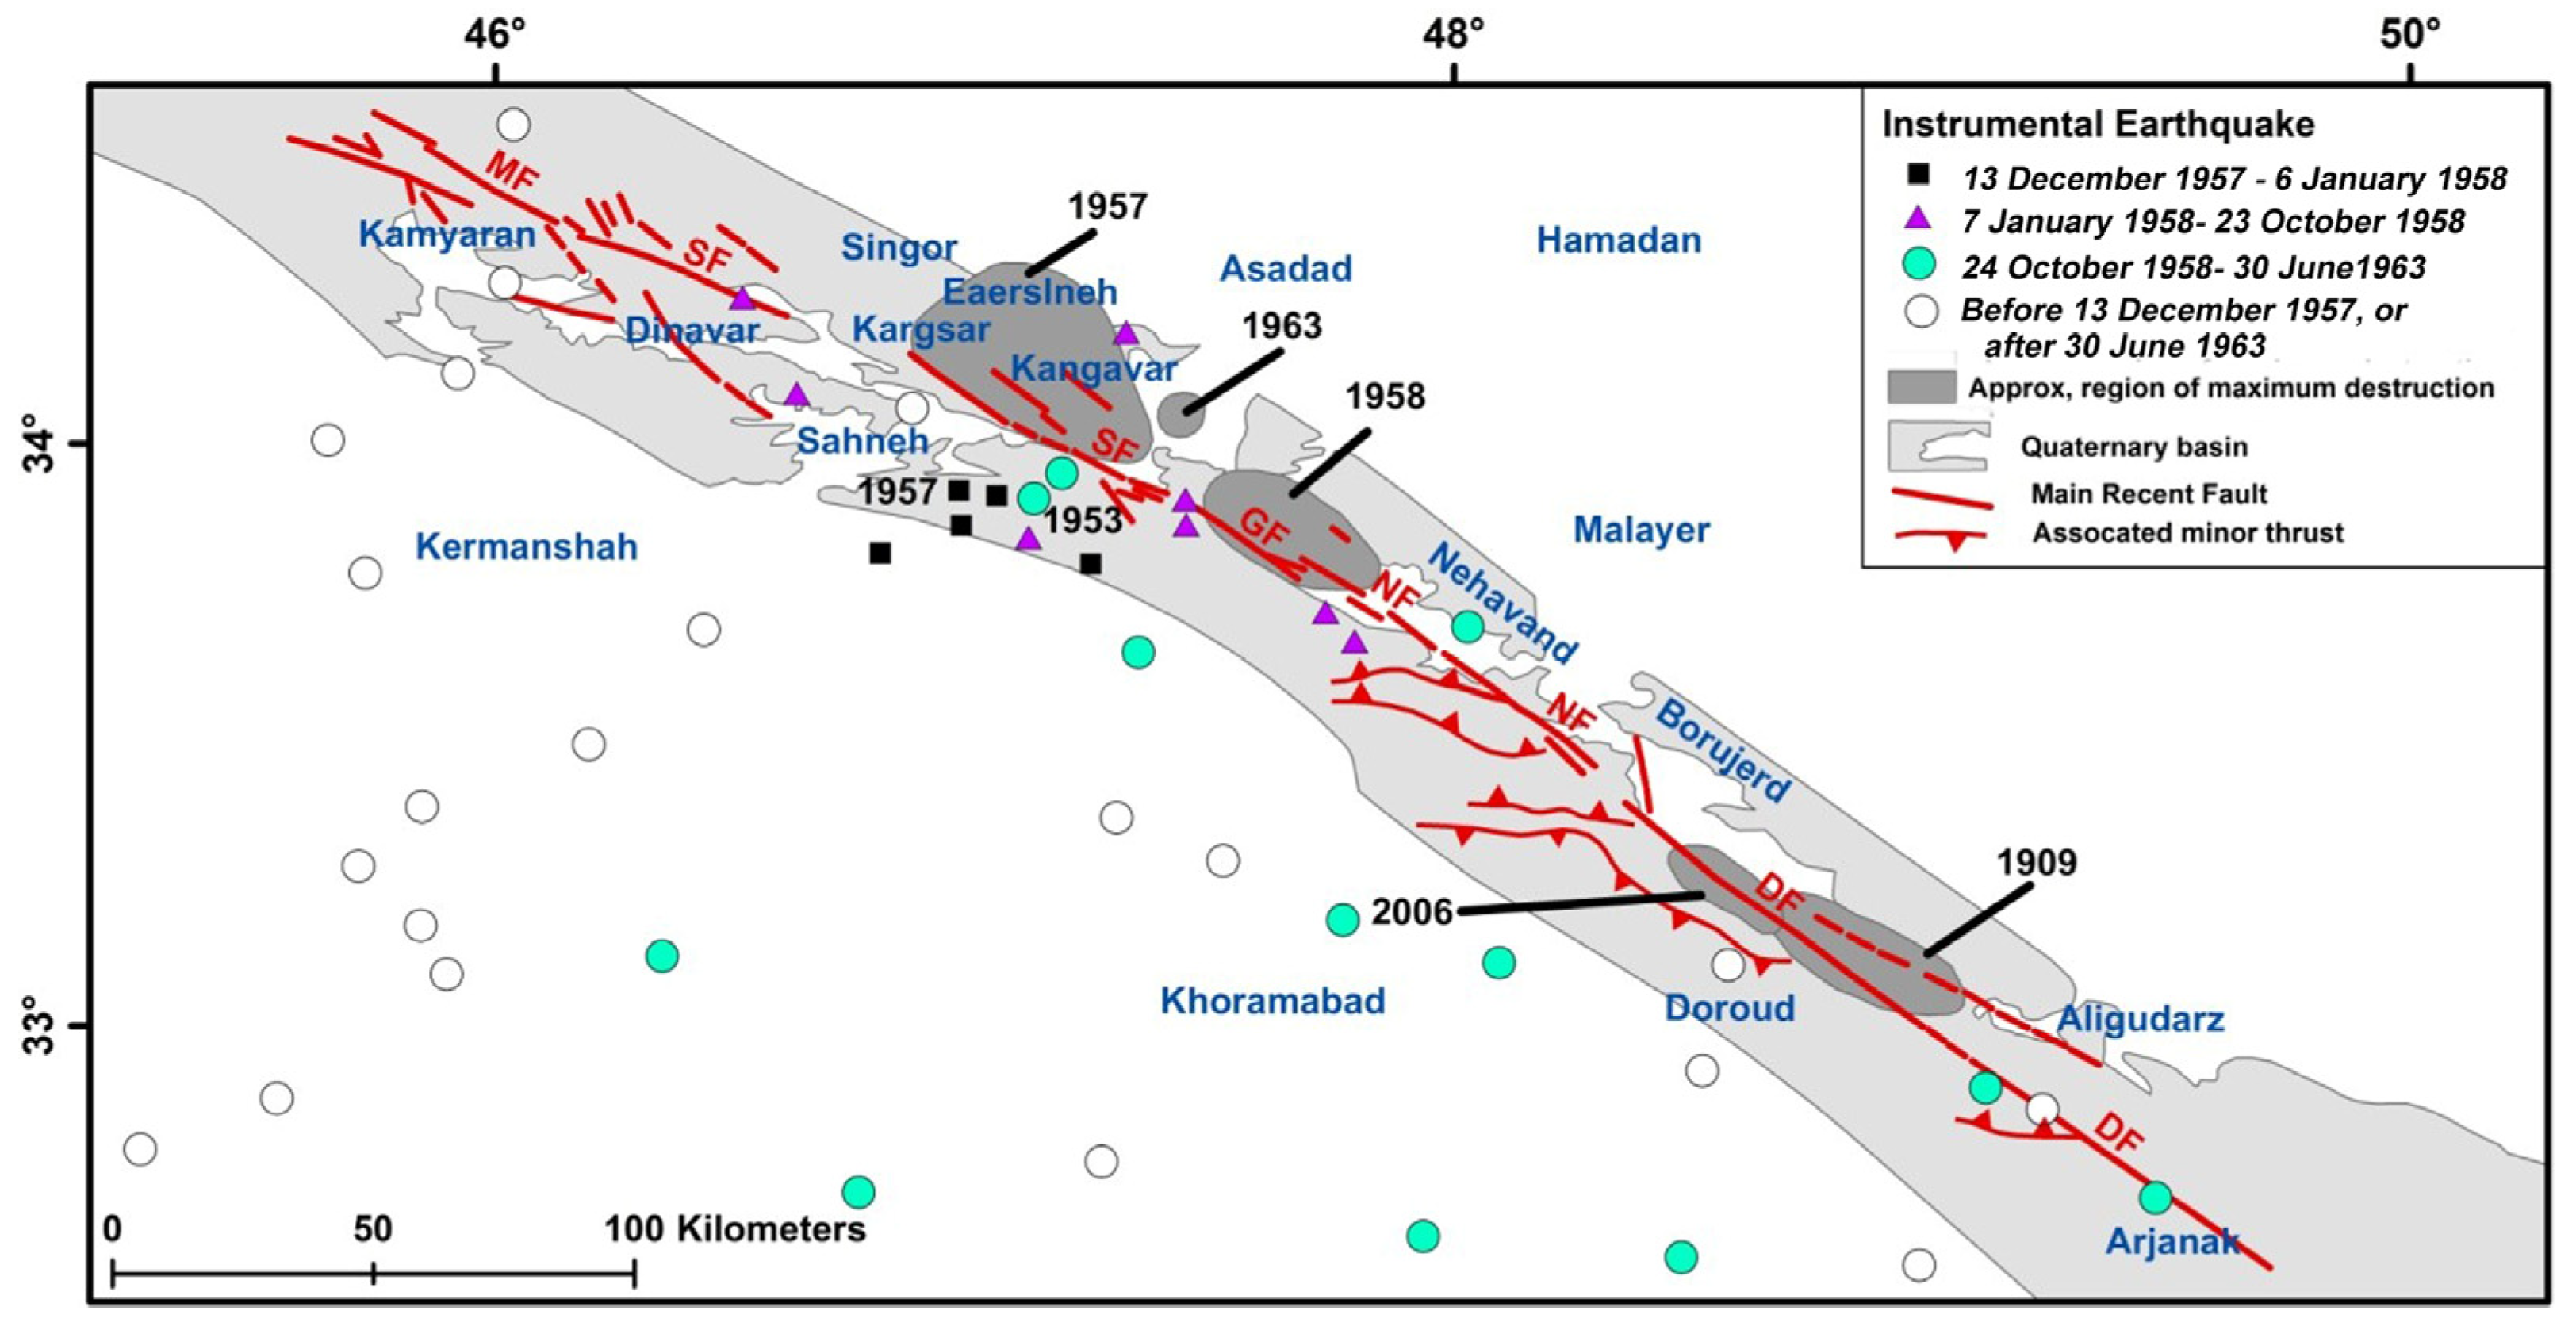
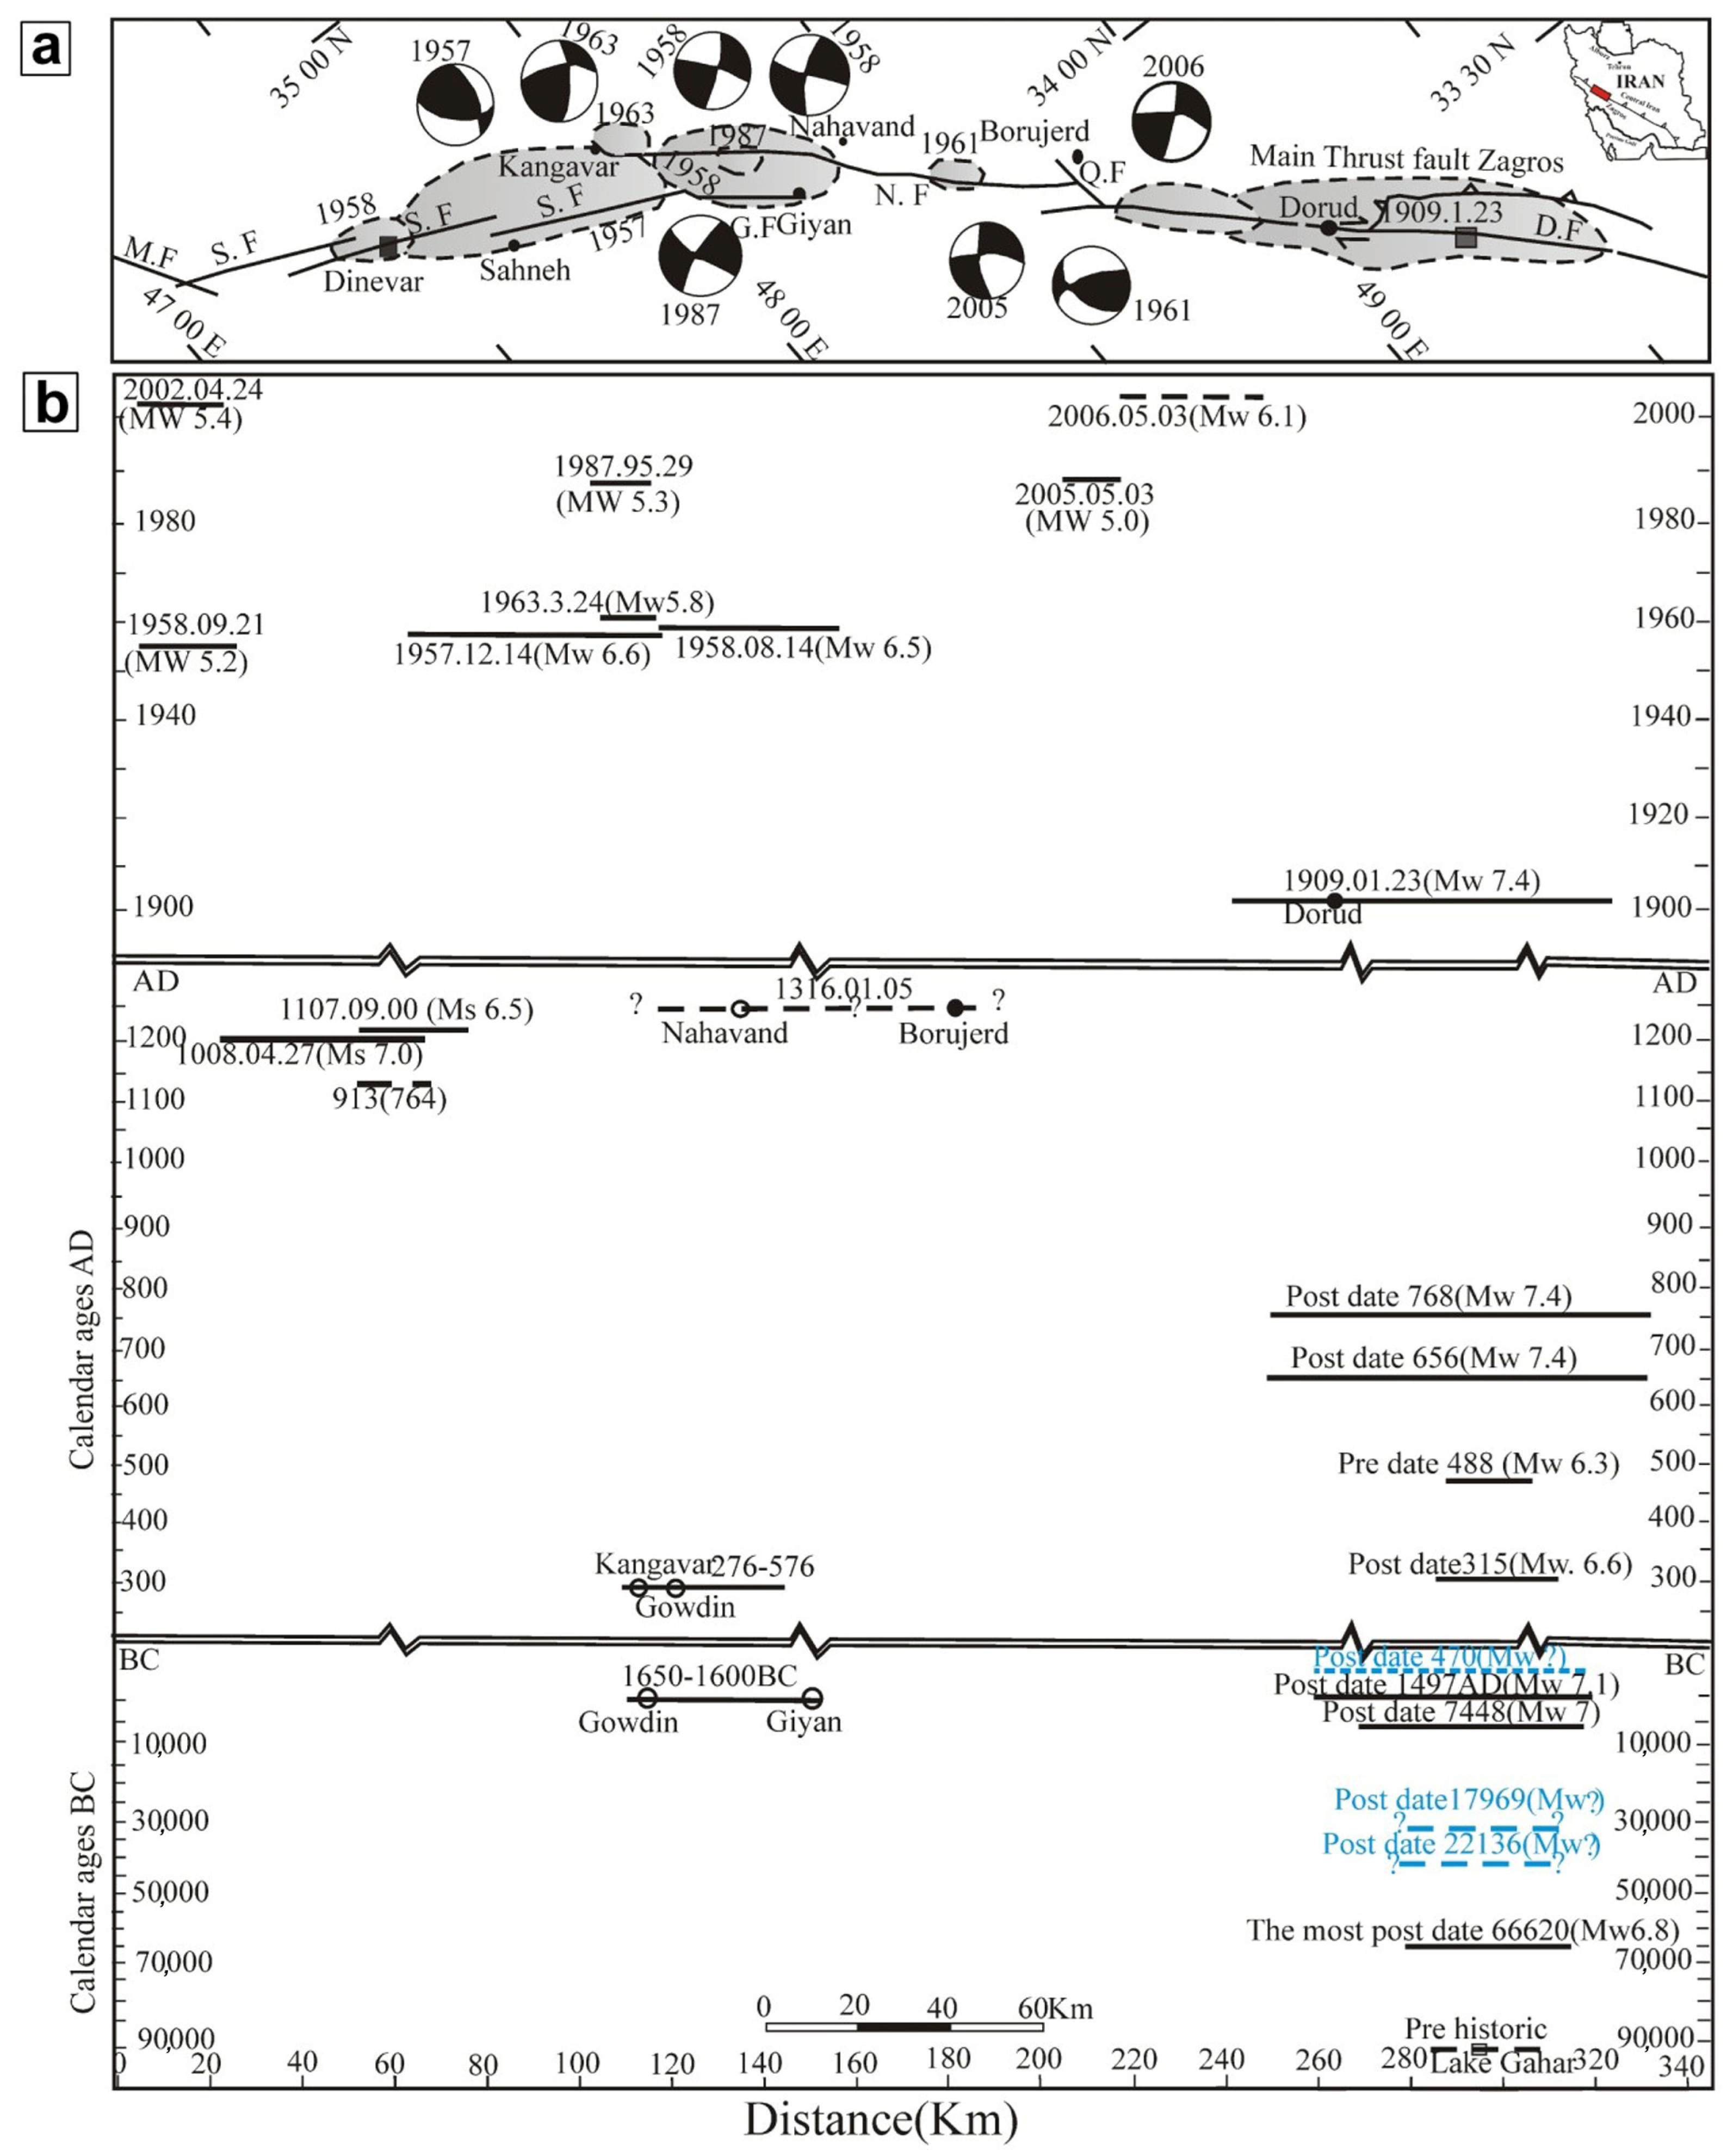
2. Tectonic Setting and Seismicity

The Zagros mountain range in southwest Iran (Figure 1a) expanded from ~250 km to ~400 km in width and ~1500 km in length from SE Turkey (in the west) to the Hormuz Strait (in the east) (Figure 1). This range was formed in a series of tectonic events related to the collision of the Arabian plate with the Eurasia plate in the Miocene [45,46]. The Main Zagros Reverse Fault (MZRF) and MRF delineate the Arabia–Eurasia suture that limits the northern extension of the Zagros range (Figure 3) [16].
The main structural features of the Zagros and its evolution history are known by various researchers [16,45,47]. During the Arabia–Eurasia collisional process, the sedimentary rock units in the northern domain of the Arabian plate have been folded and detached from its Pan-African basement into a long belt (Zagros fold-thrust belt). To the north of the Zagros fold-thrust belt and parallel to it is the Sanandaj–Sirjan Zone, and the Urumieh–Dokhtar magmatic arc, which consists of imbricated sedimentary and metamorphic rocks, and Andean-type volcanic rocks, respectively [47].
The obduction of the Neo-Tethys oceanic crust onto the northern margin of the Arabian plate in the late Cretaceous has been the first tectonic event in the development of the Zagros orogenic belt. In the late Campanian, the obduction finished while remains of the Neo-Tethys oceanic crust continued to subduct beneath Central Iran in the Oligocene–Miocene. Based on the NUVEL-1A plate motion model [28], currently, the collisional stage is active with a convergence rate of ~30 mm/yr in the north–south direction. However, the GPS proposed a velocity of ~20 mm/yr of the Arabian plate related to Central Iran [25]. The GPS indicates about half of the convergence is consumed by Zagros. The rates of convergence along the Zagros belt are seen to be continuously decreasing from SE to NW, from ~9 mm/yr in SE Zagros to ~6 mm/yr and ~4 mm/yr in Central and N Zagros, respectively.
The multisegmented Zagros Main Recent fault is a major NW–SE-trending right-lateral strike–slip seismic fault zone of more than 800 km long located between the Zagros fold-and-thrust belt in the southwest and Central Iranian range-and-basin in the northeast [16,20,32]. The fault trace in the northern margin of the Zagros range depicted by Ambraseys and Melville [48] is equivalent to what is now known as the MRF, but there was no field evidence for the strike–slip component; only vertical displacements were observed (north-east side down). The MRF is divided into five major segments (from Kamyaran to Arjanak), including the Doroud, Nahavand, Garun, Sahneh, and Morvarid segments [32] (Figure 3). In the last century, several destructive earthquakes, such as Silakhorin 1909.01.23 with Mw7.3; Razan 1955.12.04, UTC: 14:02, epicenter: 33.50 N–48.80 E Ms 6.0; Heydarabad 1961.10.28, UTC: 10:46:33.54 N–48.49 E and Ms 5.0; Sahneh 1958.08.14, UTC: 15:26 and Ms 5.5; Nahavand 1958.08.16, Mw 6.6, UTC: 19:13 and epicenter: 34.25 N–47.84 E; Dinevar 1958.09.21, UTC: 16:18 and Mw 5.2; 1987.05.29, epicenter: 34.06 N–48.28 E, Ms 6.5 and Night/Wednesday; Farsineh 1957.12.13 with Mw 6.5; Nevahand 1958.08.16 with Mw = 6.7; Karkhaneh 1963.03.24, UTC: 12:44, epicenter: 34.43 N–47.89 E and Mw 5.8; and Chalencholan 2006.03.31 with Mw = 6.1, have occurred on these segments (Figure 3) [25]. The most destructive was the 1909 earthquake (Ms 7.4) associated with a fault rupture over 45 km long [32]. It was felt in a large area where 128 villages were damaged and it caused more than 8000 people to be killed [18,48].
The event Chalencholan 2006.03.31 with Mw~6.1 (with 68 deaths and ~1400 injured) had a consistent focal mechanism of the right-lateral strike–slip action, and it ruptured the Doroud segment of the MRF. According to relocation models, the dextral slip of up to 90 cm was recorded at a depth of ~4 km in the 2006 Chalencholan event. Based on Peyret et al. [49], the maximum horizontal displacement near Chalencholan city is suggested to be ~12 cm. In any case, geomorphological evidence shows 50–70 km of right-lateral displacement along the MRF [30].

3. Method and Data

To determine the slip rate of the Doroud Fault, the offsets of tectonic features were analysed using field observations, topographic data, Google Earth satellite images, and OSL dating results [50,51,52]. The topographic data were obtained using real-time kinematic measurements (RTK). Given that the horizontal uncertainties for RTK data is <0.5 m, measurement errors on the displacements mainly arise from the determination of markers and construction of fitting lines [13,53]. We thus chose potential research sites based on the interpretation of a digital elevation model (DEM) and Google Earth satellite images; moreover, before digging trenches, Holocene and Pleistocene rock units were carefully separated, the fault trace and surface geomorphic features around the fault were mapped in the field, and topographic cross-sections from RTK data were drawn (using The Environment for Visualizing Images (ENVI)) software across the fault scarps at the site. To study paleoseismology, we excavated a trench (see its location in Figure 4; TC (Trench)) using both hand and machine tools across the fault scarp and pond, and mainly along the middle segment of the Doroud Fault. We chose the pond to excavate a trench because it is a location of accumulation of recent sediments that certainly record seismic events, and this pond was formed due to the action of the fault in the hanging wall of the Doroud Fault and is the closest location to the epicenter of the 1909 earthquake. A string grid defining 1 m × 1 m panels was strung along the length of the trench walls after the walls were scraped and cleaned. Then, each grid panel was photographed with four images that slightly overlapped with one another. The sedimentary layers in each trench were classified as separate units based on color, particle size, sorting, texture, bedding thickness, and other characteristics, such as the colluvium wedge. The sequence of ground-rupturing events was then determined based on strata cross-cutting relationships, sediment thickness variations, soft sediment deformation, and fissures. The radiocarbon (C14) and optically stimulated luminescence (OSL) ages of sediment samples collected from trenches were utilized to constrain the ages of the stratigraphic units and, consequently, the interpreted events.

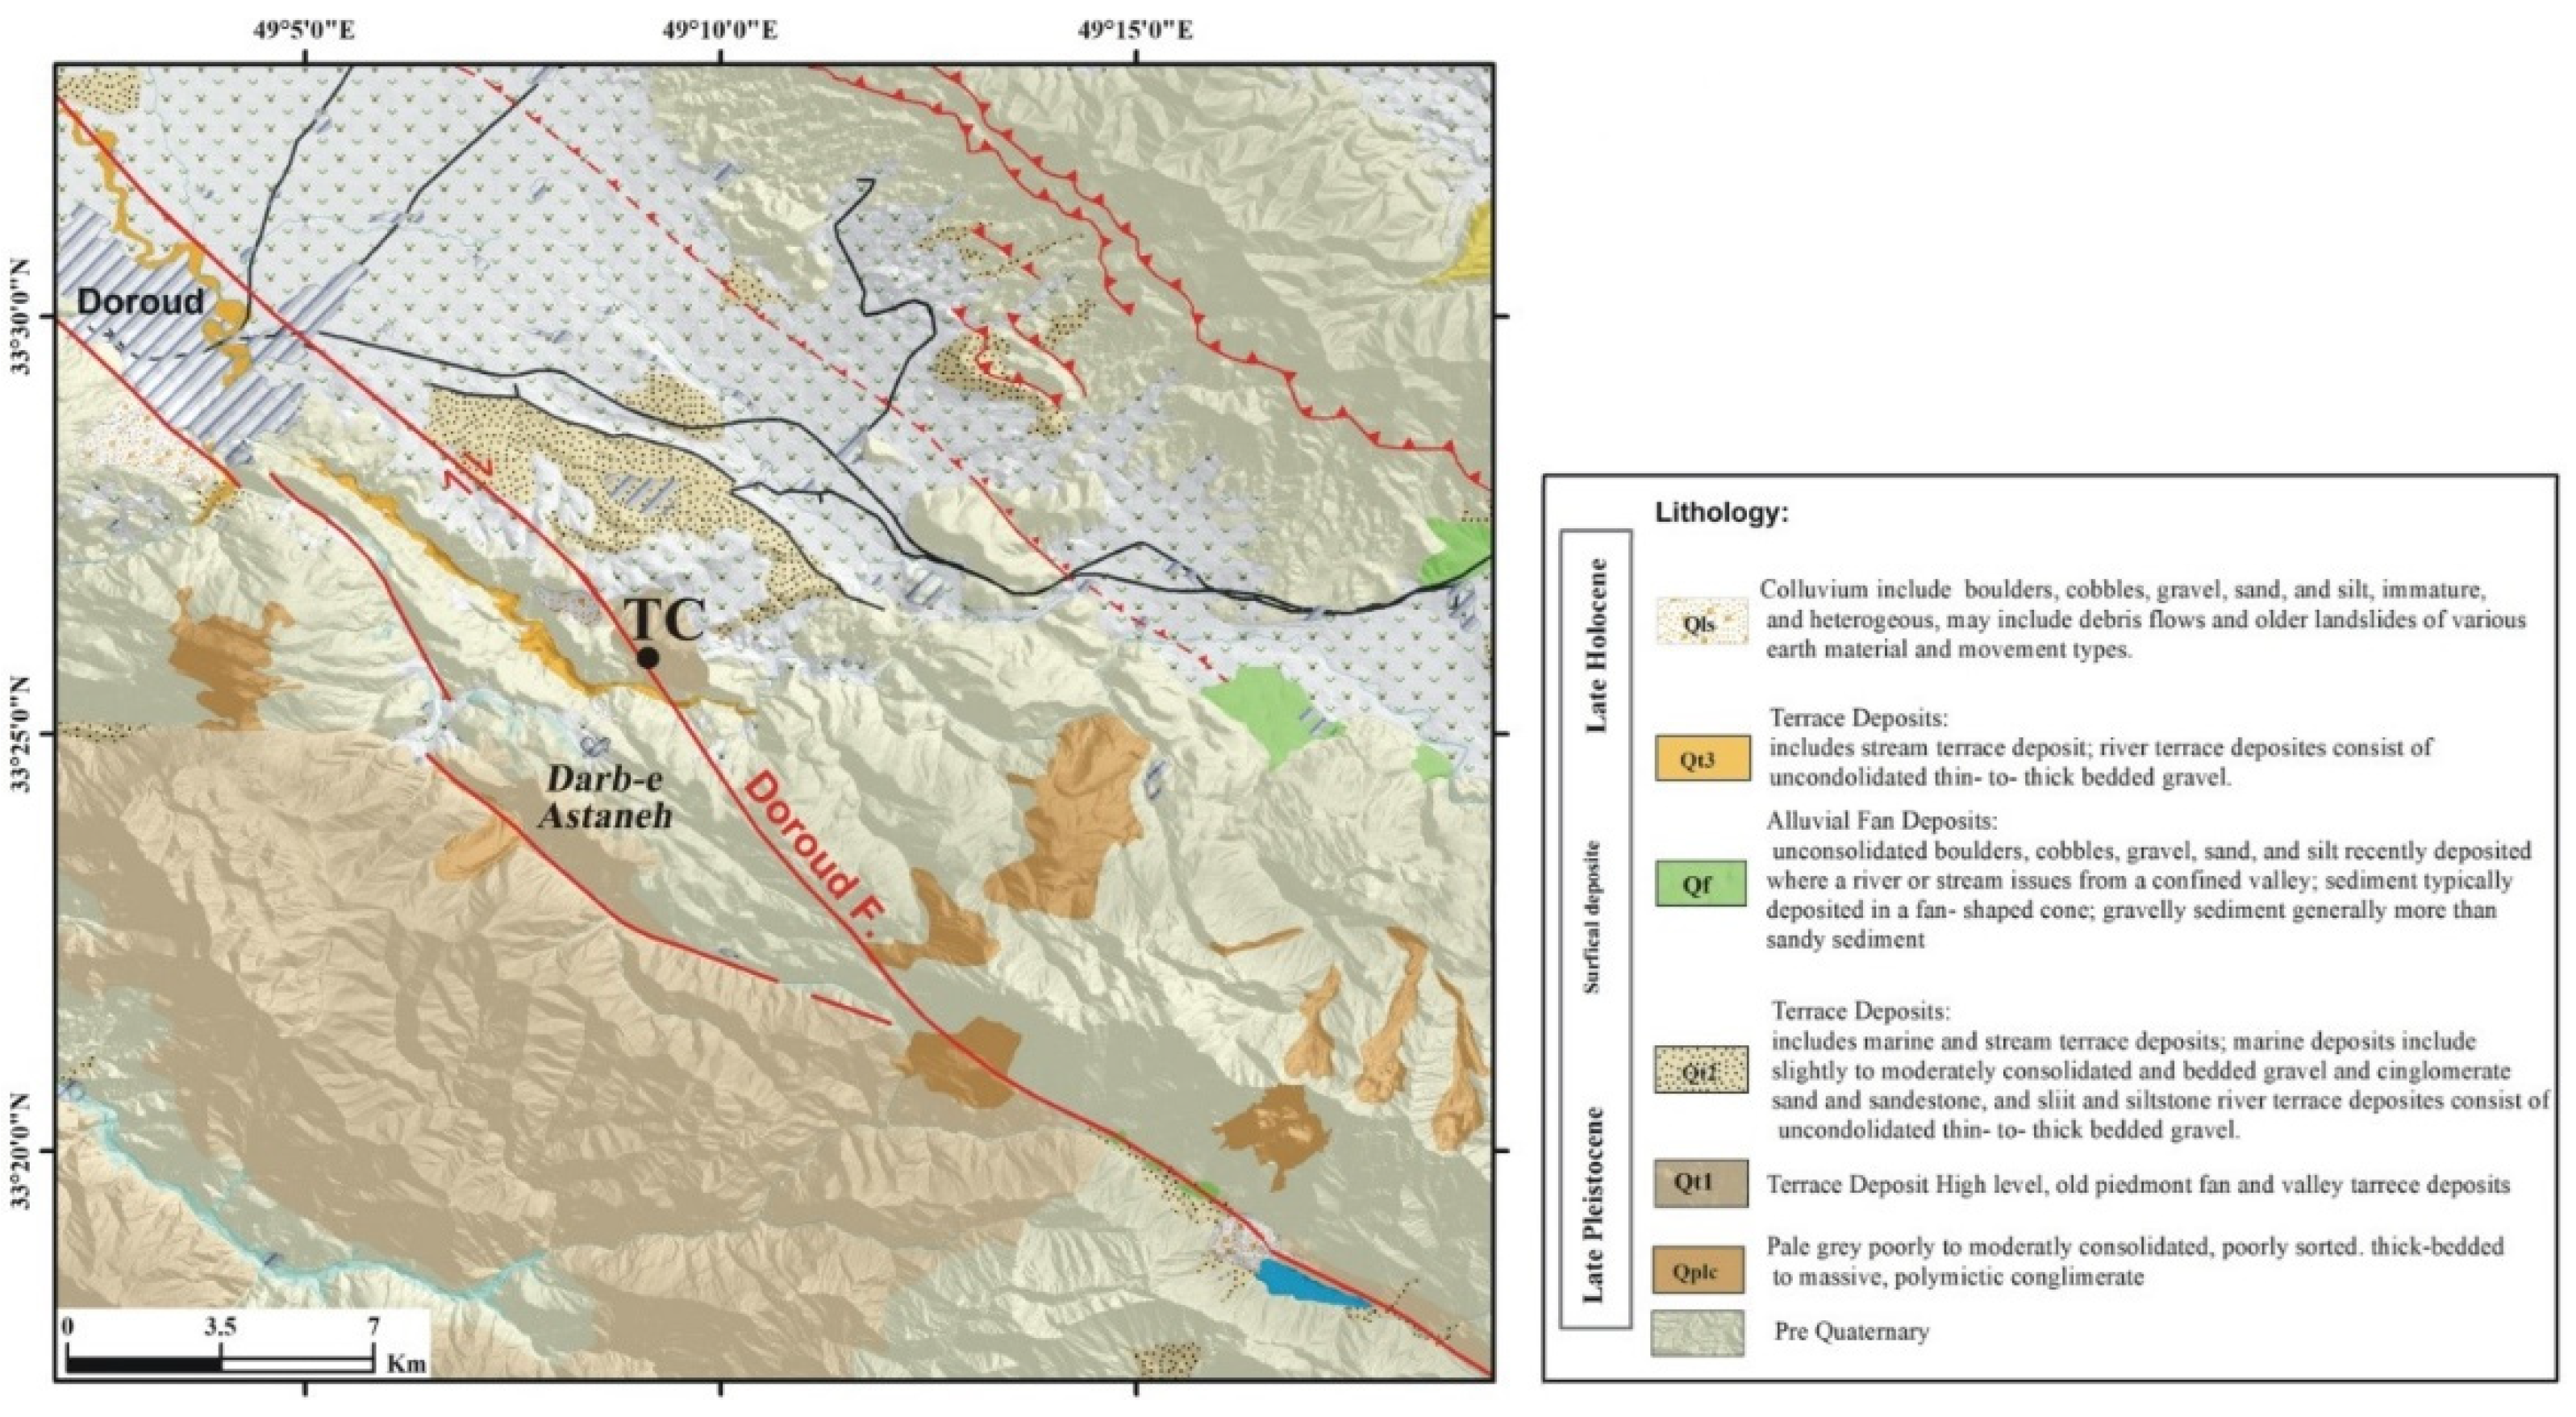
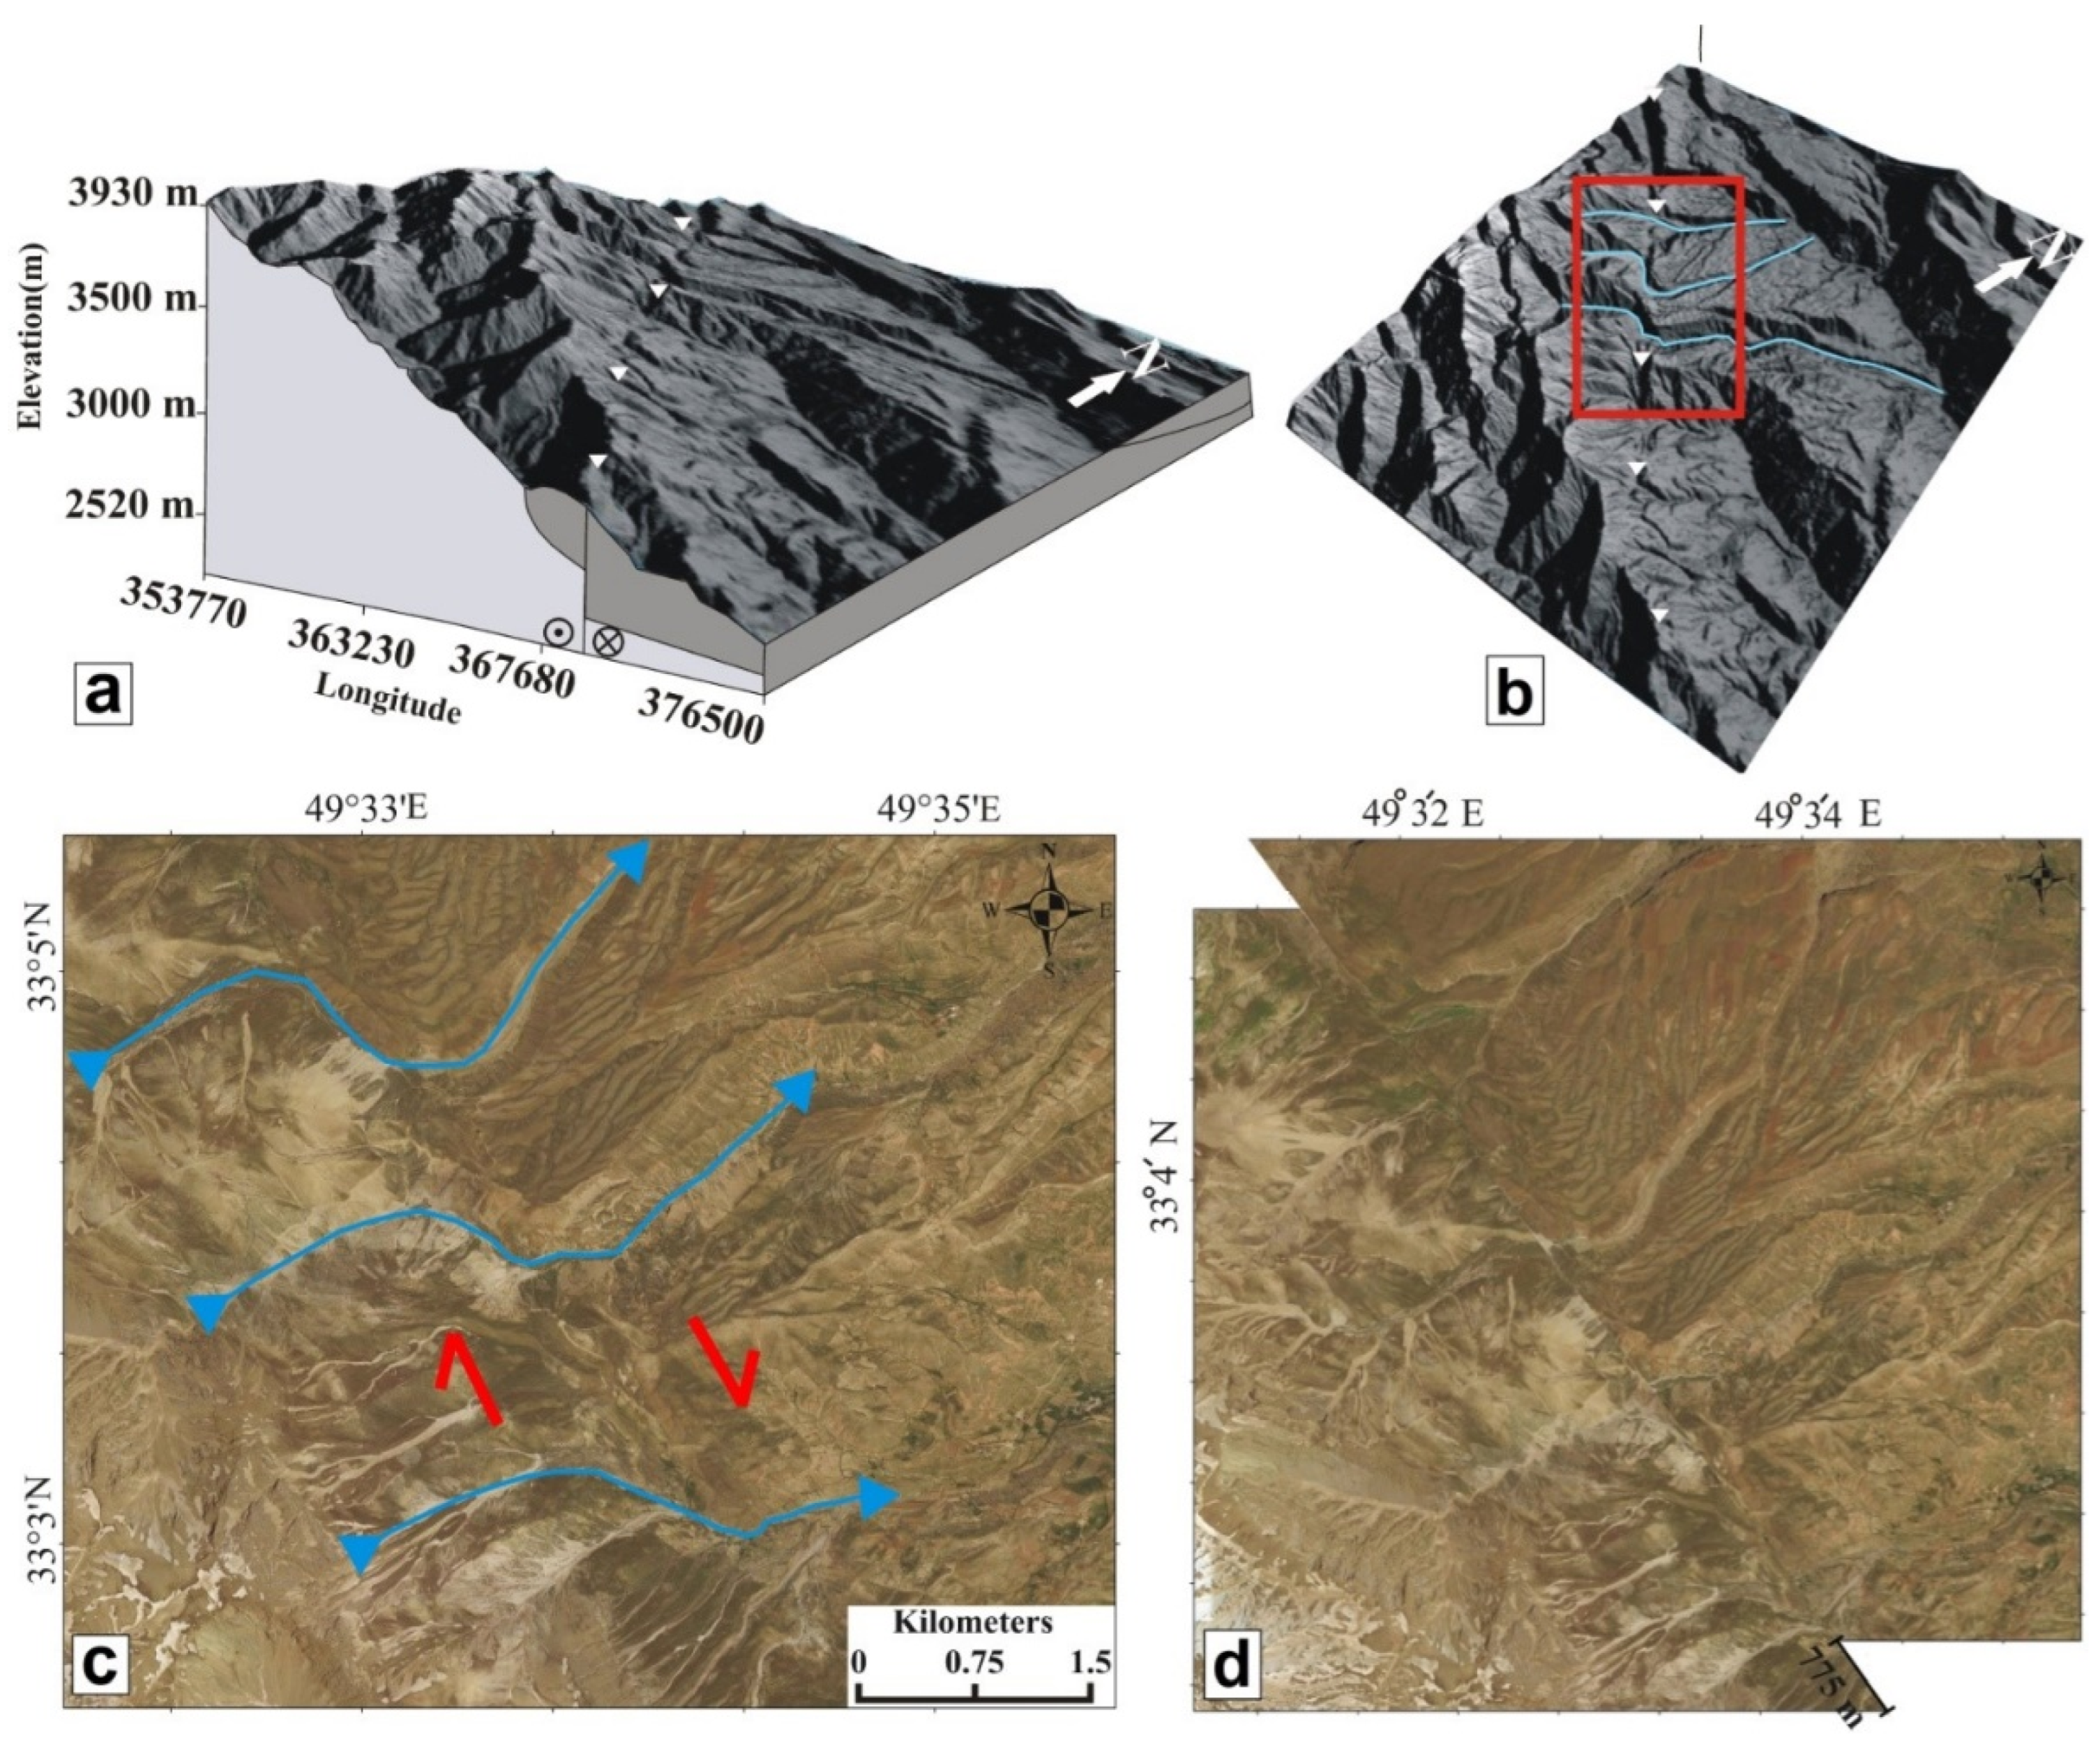
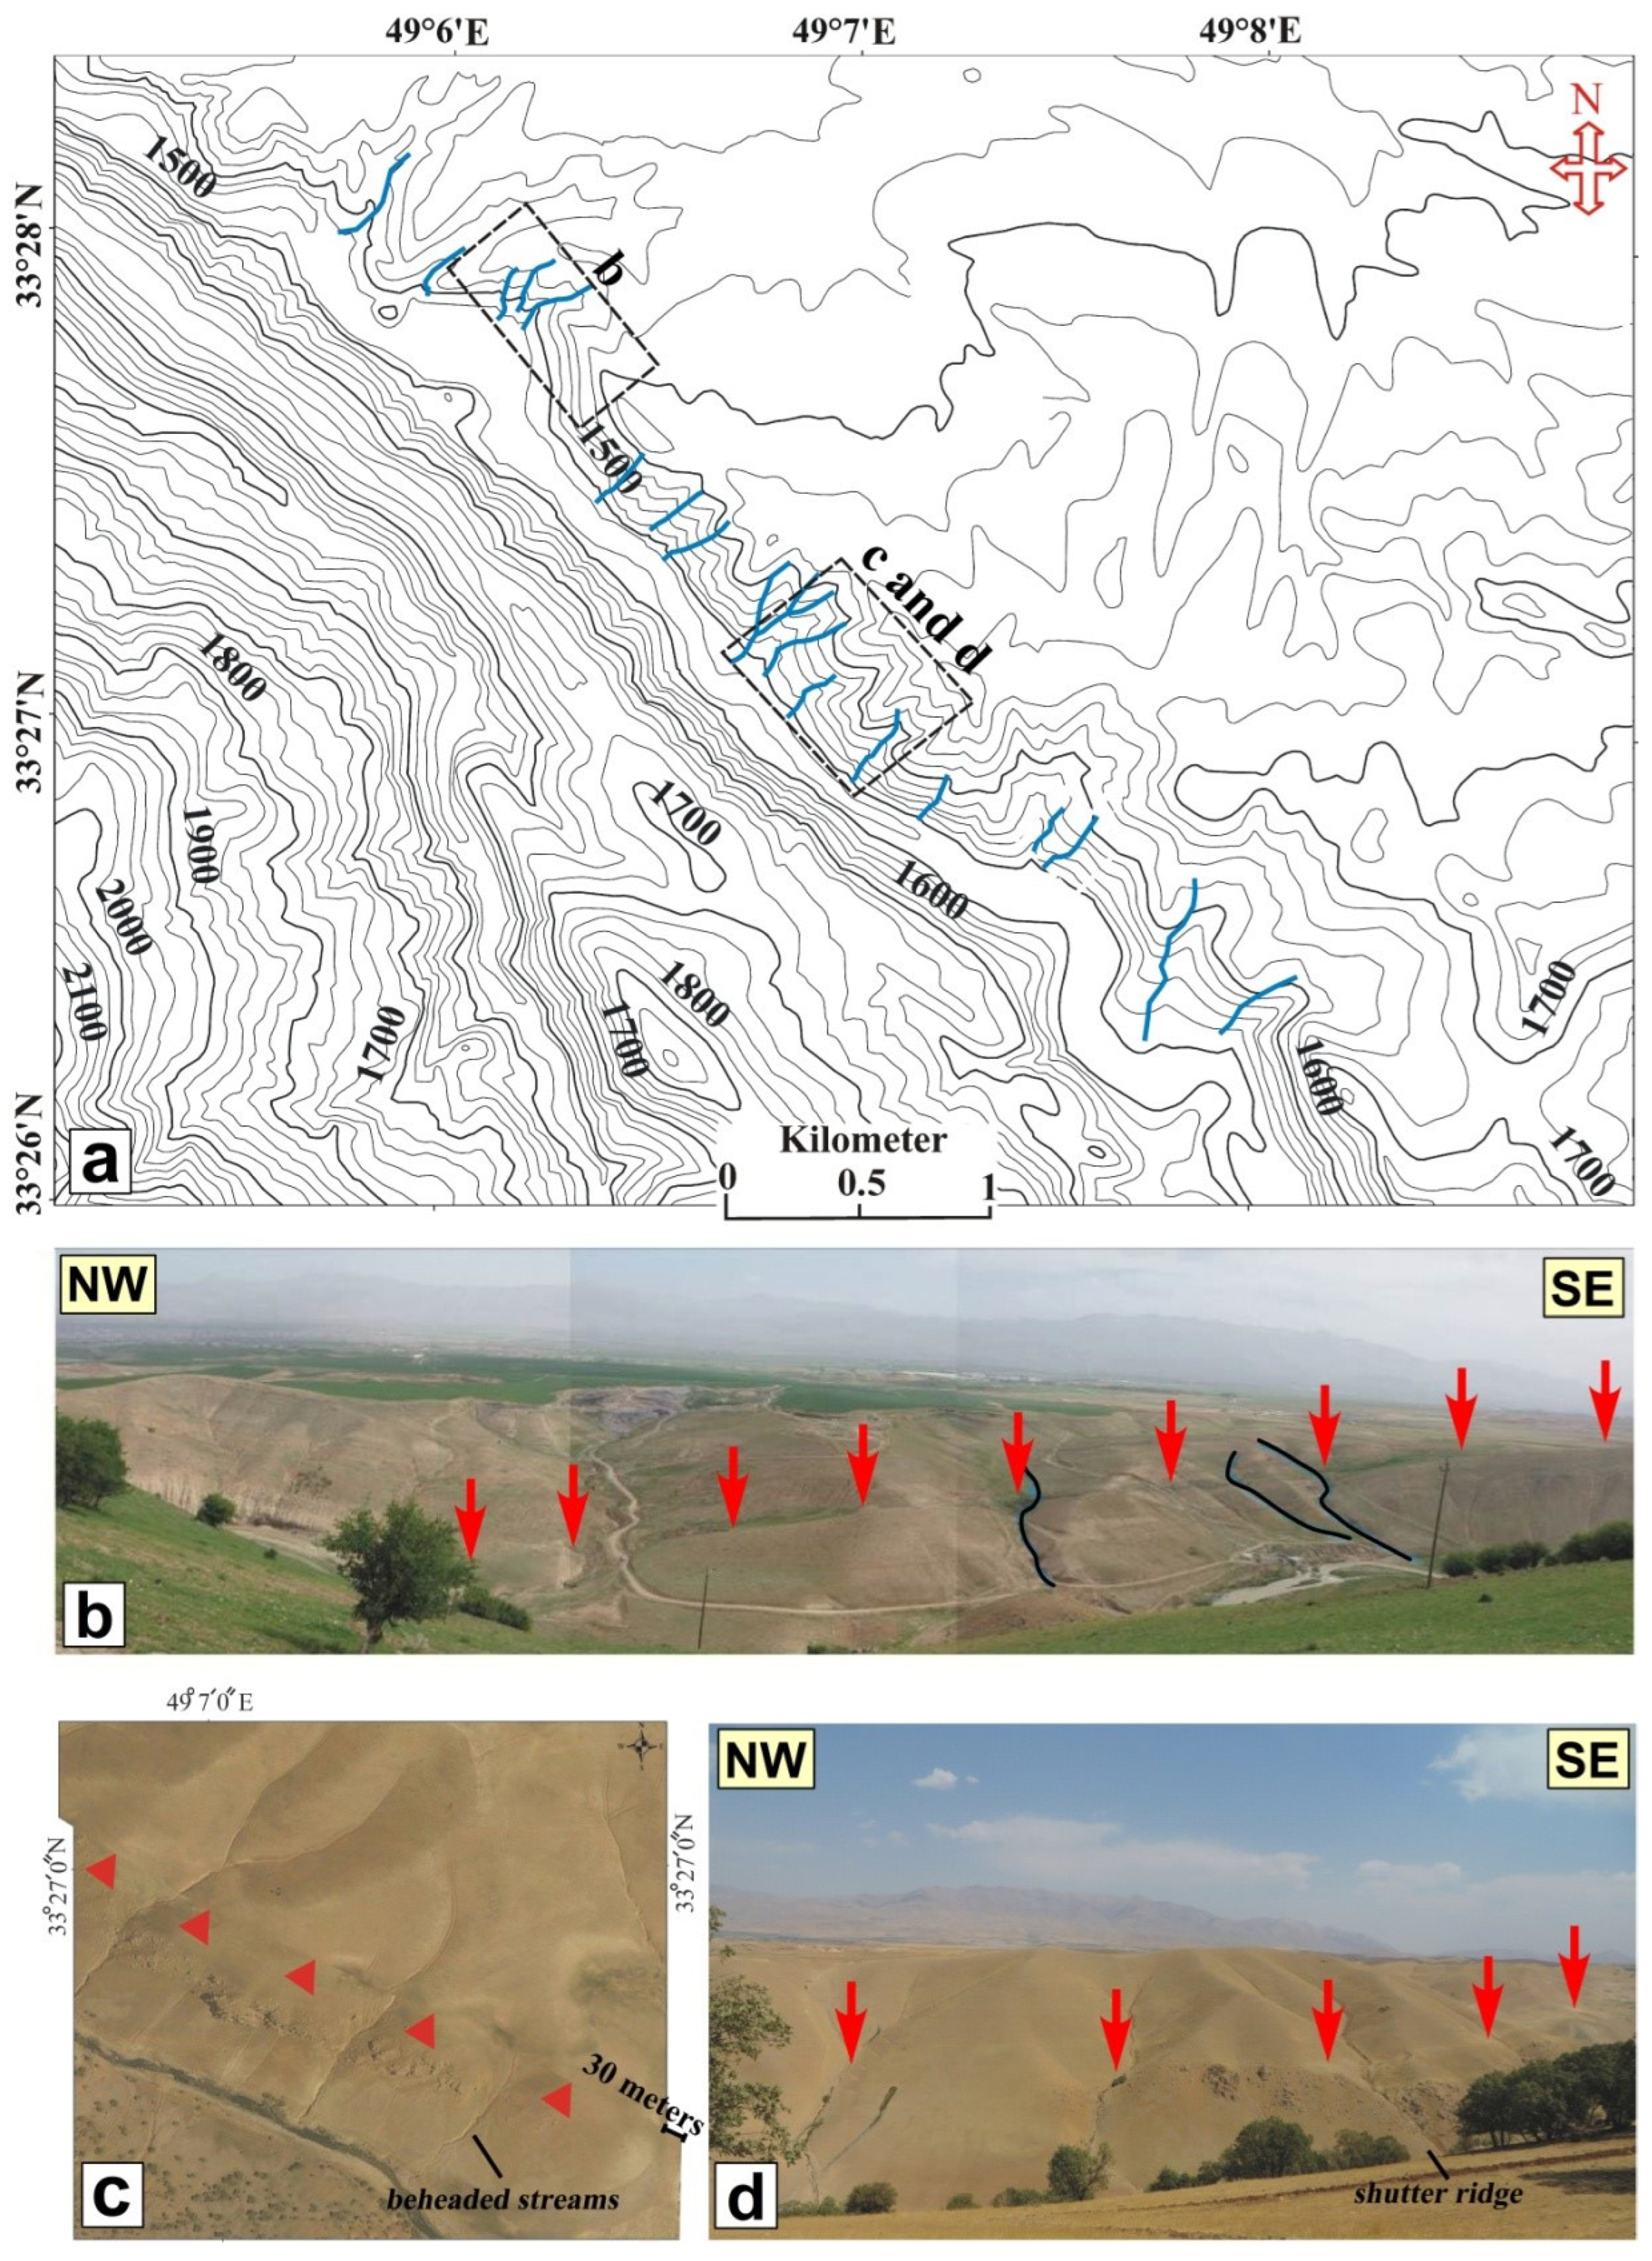
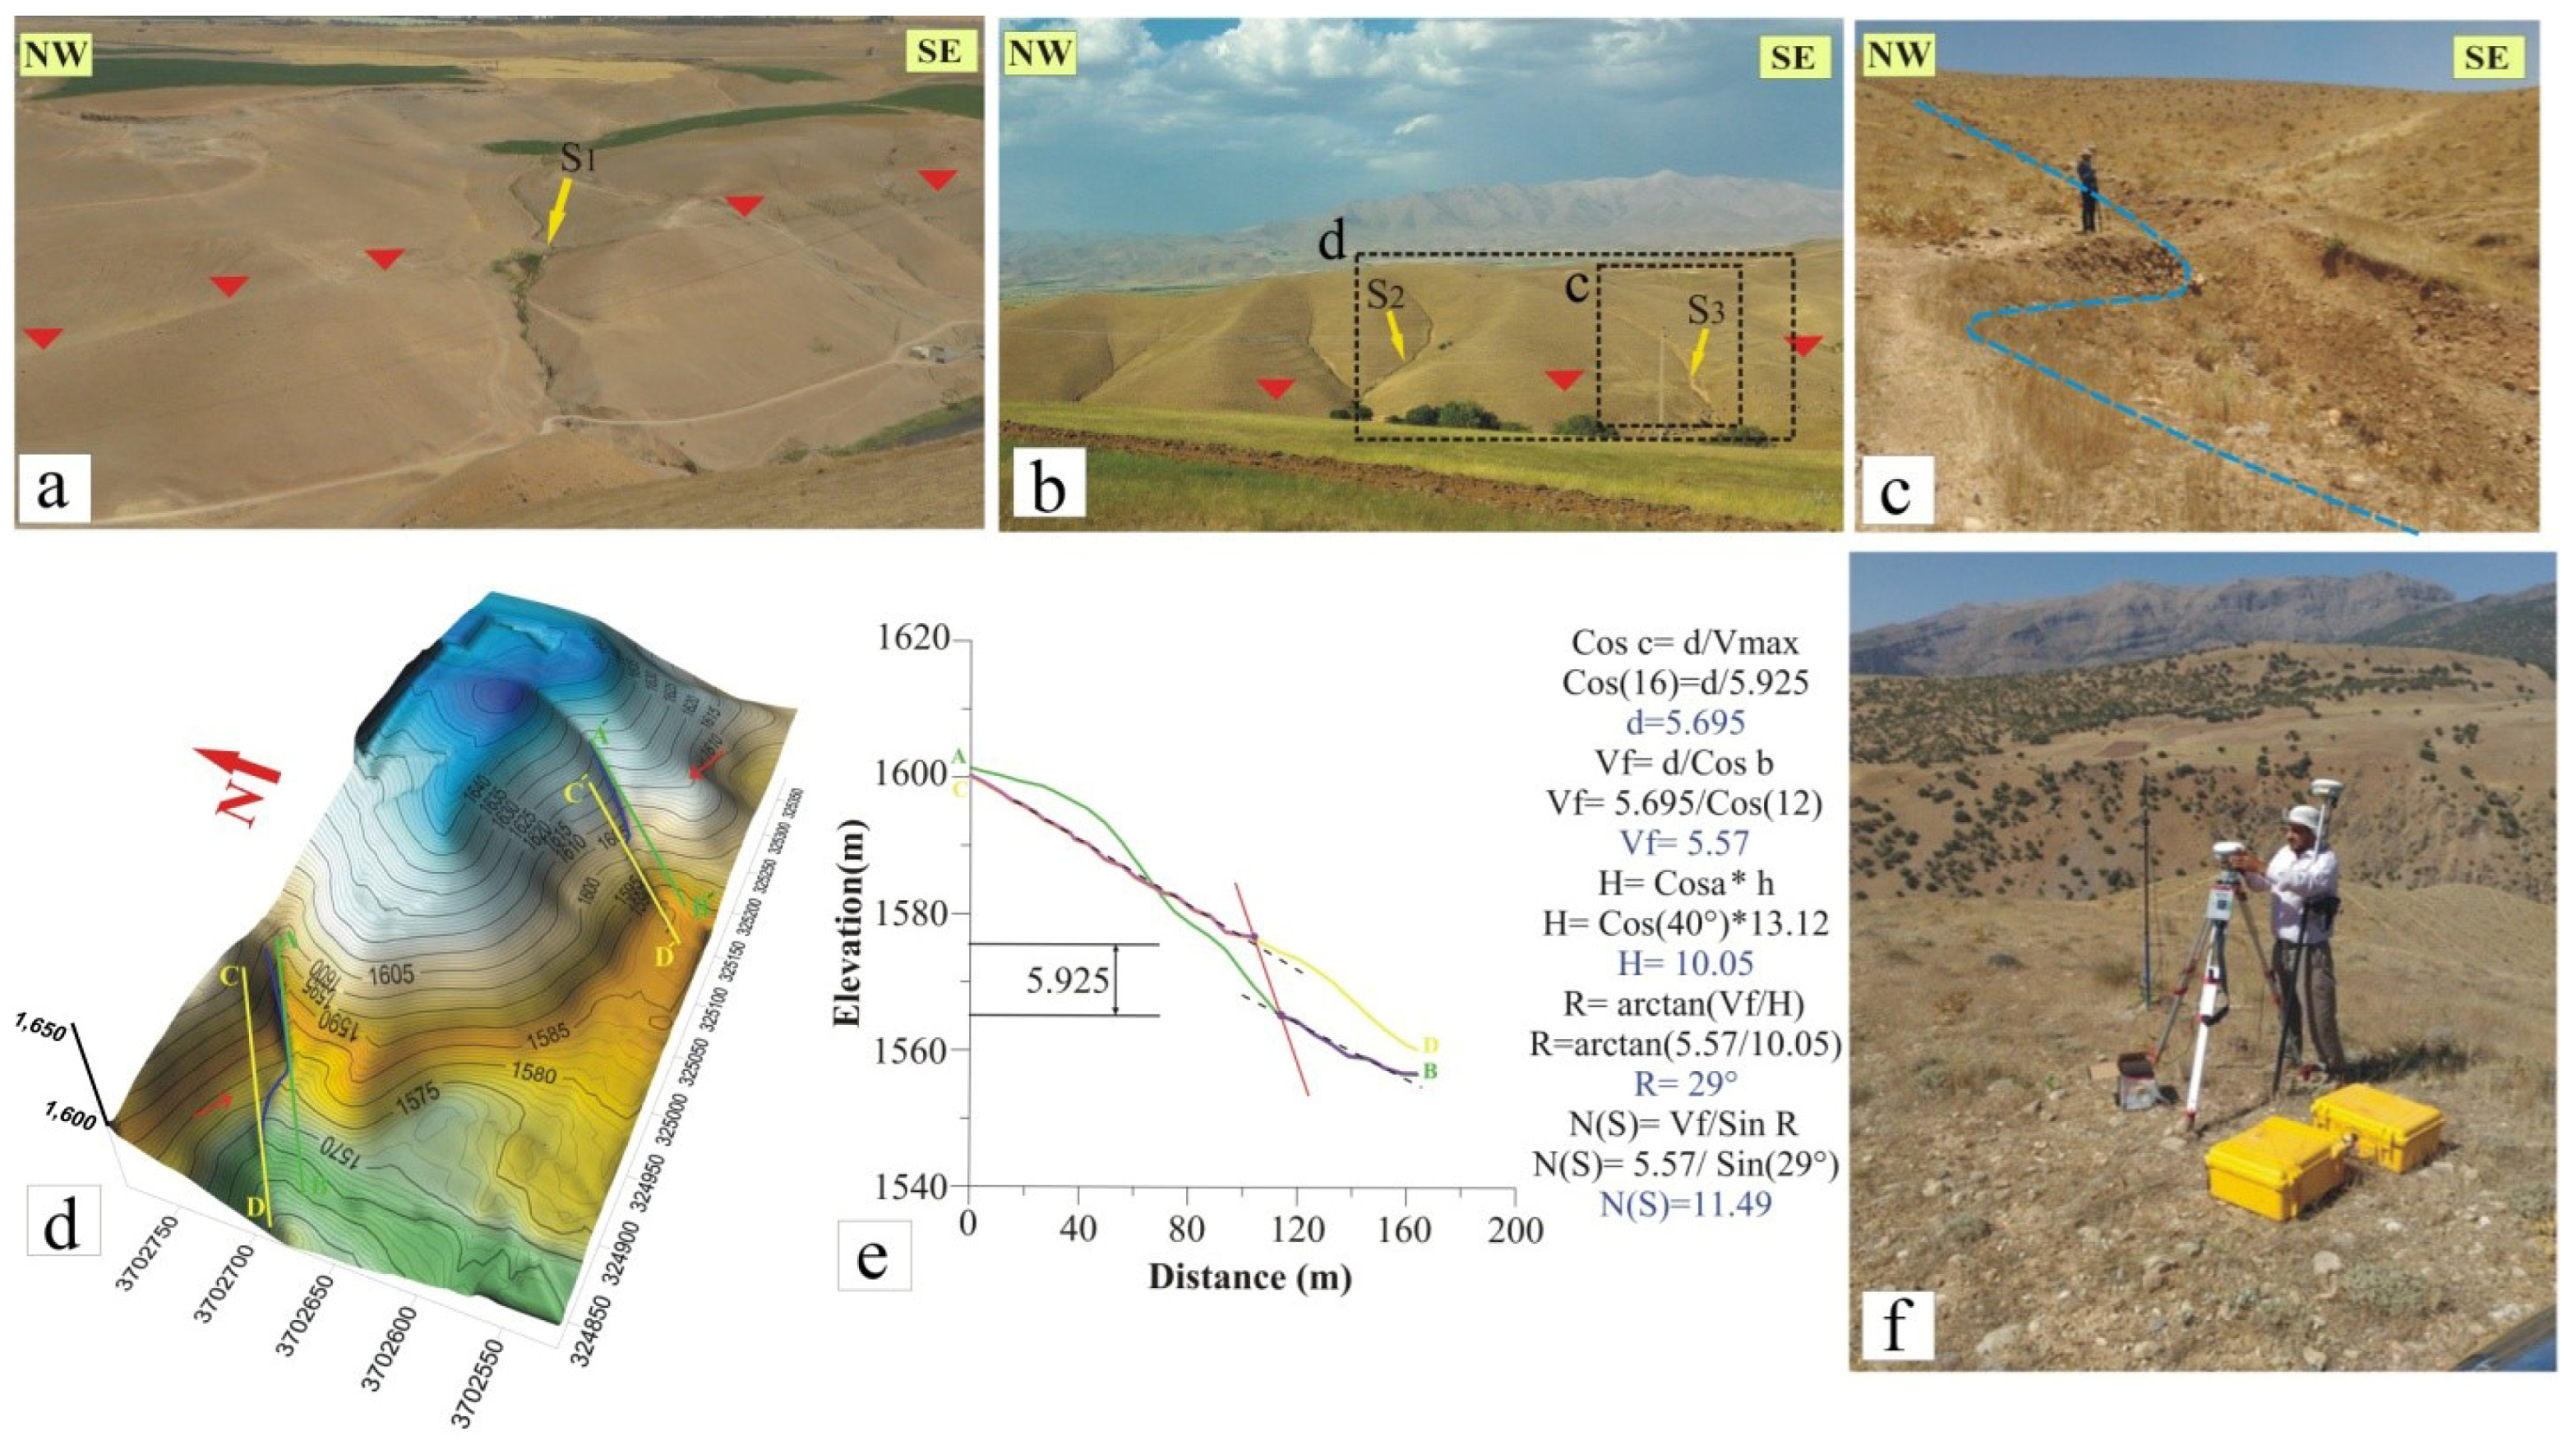
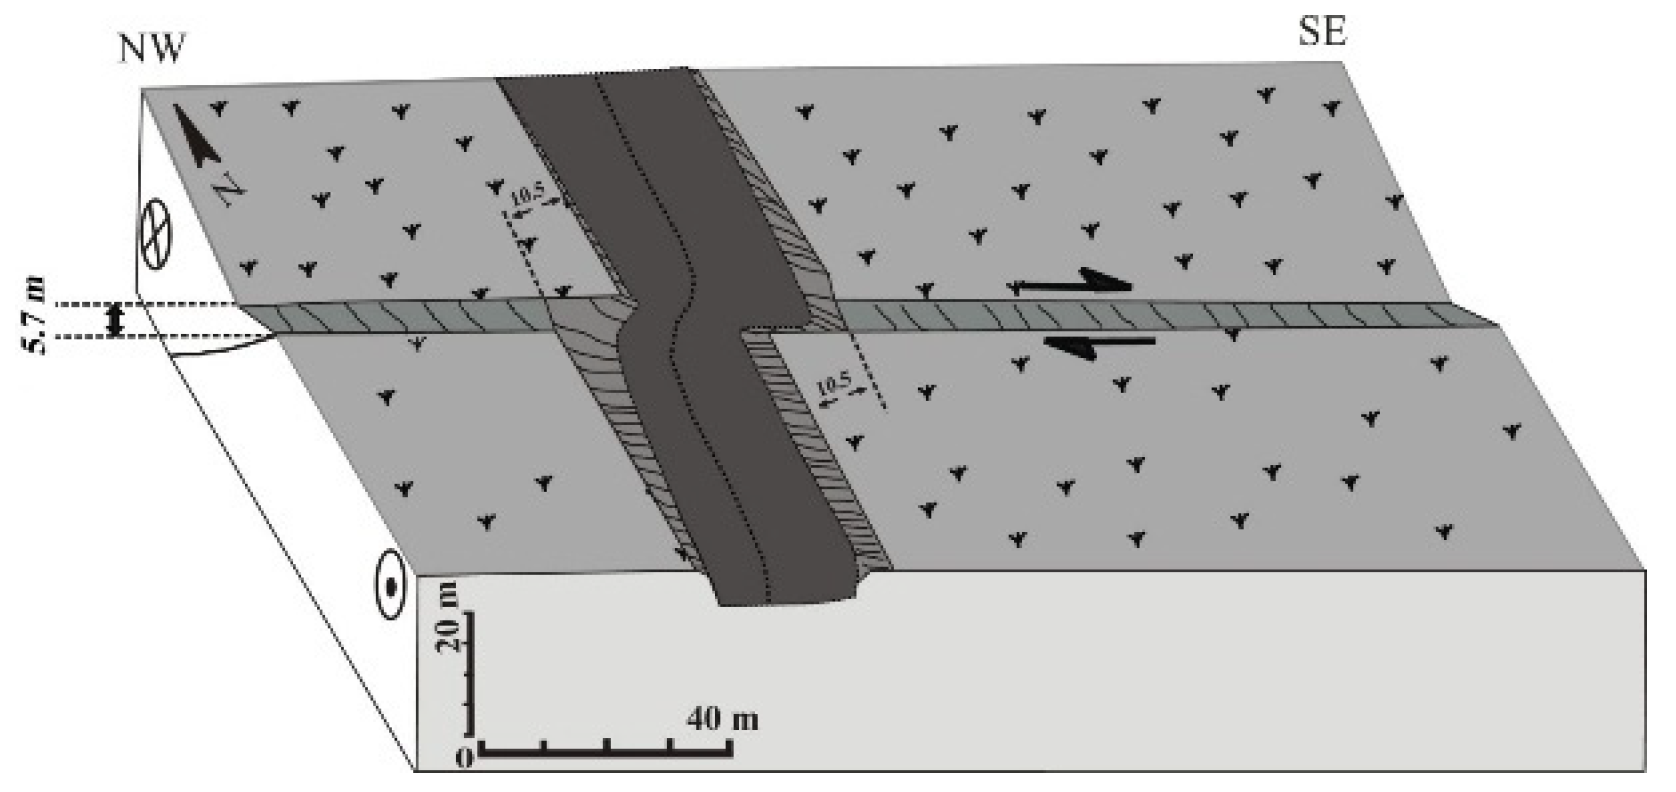
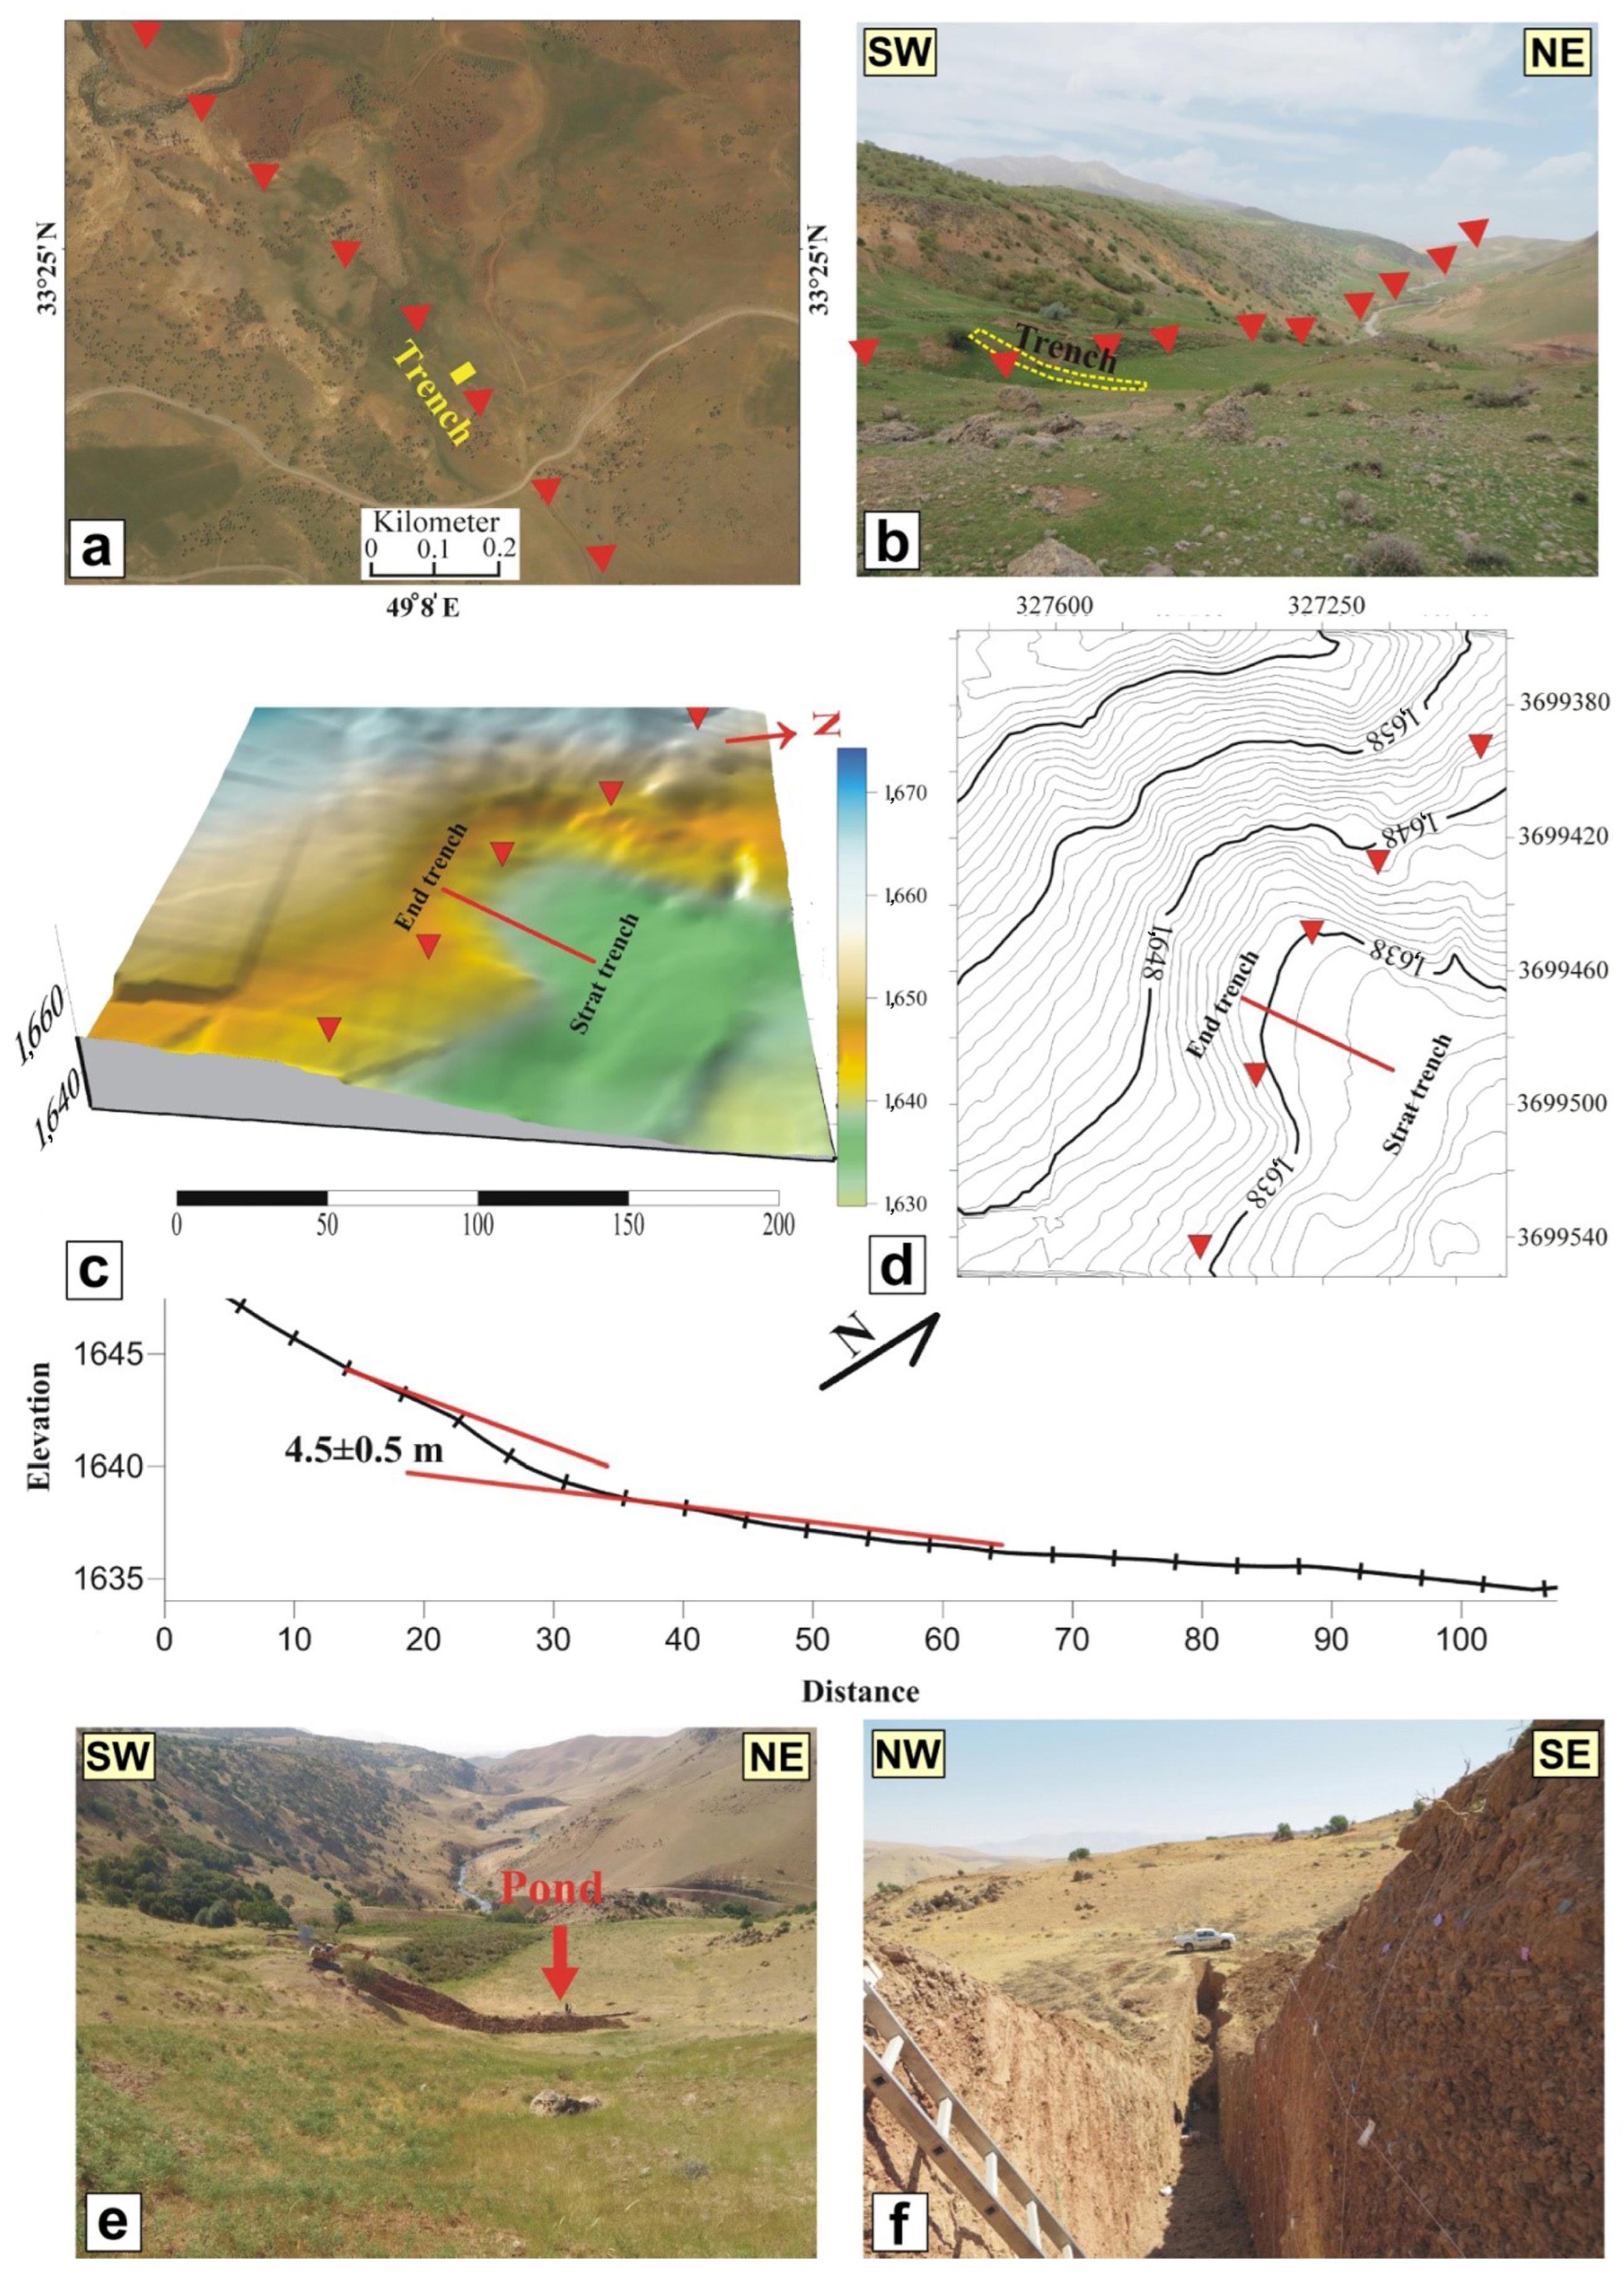
4. Geomorphology and Slip Rate of the Doroud Fault

The use of morphological offsets to determine the long-term slip rate on an active fault requires datable morphologic features, which were first displaced by the fault motions and then preserved over the observable displacement [54,55,56]. We used the satellite image of the satellite interpretations of the digital elevation model (DEM) at 10 m, SASPlanet satellite images (http://www.sasgis.ru), and the field observations by reconstructing the satellite image and measuring in the field; we came to the conclusion that the Doroud Fault has caused the maximum cumulative horizontal (dextral) offsets in the Pliocene–Quaternary units of the rivers by ~775 m and ~30 m (Figure 5 and Figure 6). The observed displacements are associated with the southeastern and middle segments of the Doroud Fault, which ruptured during the 1909 Silakhor earthquake [16,18,32,48]. Geomorphic evidence, such as dextral surface ruptures including beheaded gullies (Figure 6c) and shutter ridges (Figure 6d), is visible within the mezoseismal area of the 1909 earthquake, which demonstrates the fault zone in this region (Figure 6 and Figure 7) and its relationship to the late Pleistocene–Holocene activity of the Doroud Fault. However, the surface expression of the strike–slip fault is poorly exposed in the study area, with only a few possible nominations. These offsets, ranging from several meters to a kilometer, are observed from southeast to northwest.
Slip rate studies are landform-based paleoseismic studies, the aim of which is to calculate a long-term fault slip rate from landforms offset by multiple events. They are usually reconnaissance studies on poorly known faults and precede trenching studies. Slip rate studies can be performed at widely varying spatial and temporal scales [5]. These different sizes of offset features propose an excellent opportunity to better document the seismic behavior and the occurrence of past large earthquakes on the Doroud Fault. Several displaced gullies close to the TC trench site (Figure 4) afford an opportunity to establish the fault slip rate. We document offset terraces, and river channels at three sites using the resulting high-resolution topographic map allow one to restore the offset channels to simple linear patterns along the fault, illustrating cumulative dextral offsets along the fault trace on the order of about 30 m (Figure 6).
It is difficult to determine the long-term slip rate along the Doroud Fault because of the intense human activity (e.g., agriculture fields and constructions) which has changed the original geomorphology in many places. However, a few geomorphologic features can be used to analyze the tectonic activity of the fault. In the central part of the fault, 3 km east of Doroud city, close to the Darbe-Astaneh village, the features have been displaced by multiple earthquakes. Therefore, the offsets represent the cumulative amounts of surface movements. We used kinematic GPS (real-time kinematic/GNSS) to obtain accurate displacement measurements, and in order to obtain the time of sedimentation from the gully in Figure 7c, alluvial sediments of the present age consisting of gravel, sand, and silt were sampled, which were analyzed by the OSL, and the age of 4600 ± 900 was obtained. The obtained values were used for the calculation of fault parameters and the preparation of digital elevation models. Our analysis was focused on three shifted crest lines in the central part of the fault (S1, S2, and S3 in Figure 7a,b). Using the trigonometric functions Vf = V/sinδ and ρ = artg (Vf/H), where H is the horizontal component, V is the vertical component, Vf is the vertical component projected along the fault, δ the dip, and ρ the rake (see Figure 7e) [57], we estimated a rake angle for the slip vector comprised between 20 and 40 degrees. We constrained the kinematics of the fault at a smaller scale within its southeastern part. The offset drainages were measured both in the field with a tape and, on the high-resolution topographic map obtained by a real-time kinematic (RTK) survey devoted to a systematic survey of offset drainages (Figure 7d), S1 and S2 in Figure 7a,b have cumulative horizontal offsets of ~22 m and ~14 m and cumulative vertical offsets of ~14.35 m and ~6.8 m; the cumulative horizontal and vertical offsets of S3 are ~10.5 m (A’B’ in Figure 7d) and ~5.7 m (C’D’ in Figure 7f), respectively (Table 1). In order to calculate the amount of slip rate, we used the data of S3.
In Figure 8, we presented a schematic model of the Doroud Fault, which cuts the gully in the long fault in S3. We discussed the ages of these geomorphic markers using OSL dating (Dt1 Post IRSL gully) to derive the slip rate averaged over the late Pleistocene–Holocene. Based on the formula (Average slip rate = slip distance/slip time), slip rates were calculated thus [58]:
10.5/4600 ± 900 = 2/28 ± 0.42 mm/yr
5.7/4600 ± 900 = 1.29 ± 0.23 mm/yr
The results indicate the horizontal slip rate of the Doroud Fault, in the period of the last 4600 ± 900 years, is 2.28 ± 0.42 mm/yr (between 2.7–1.86 mm/yr) and the vertical slip rate is ~1.29 ± 0.23 mm/yr (between 1.52–1.6 mm/yr).

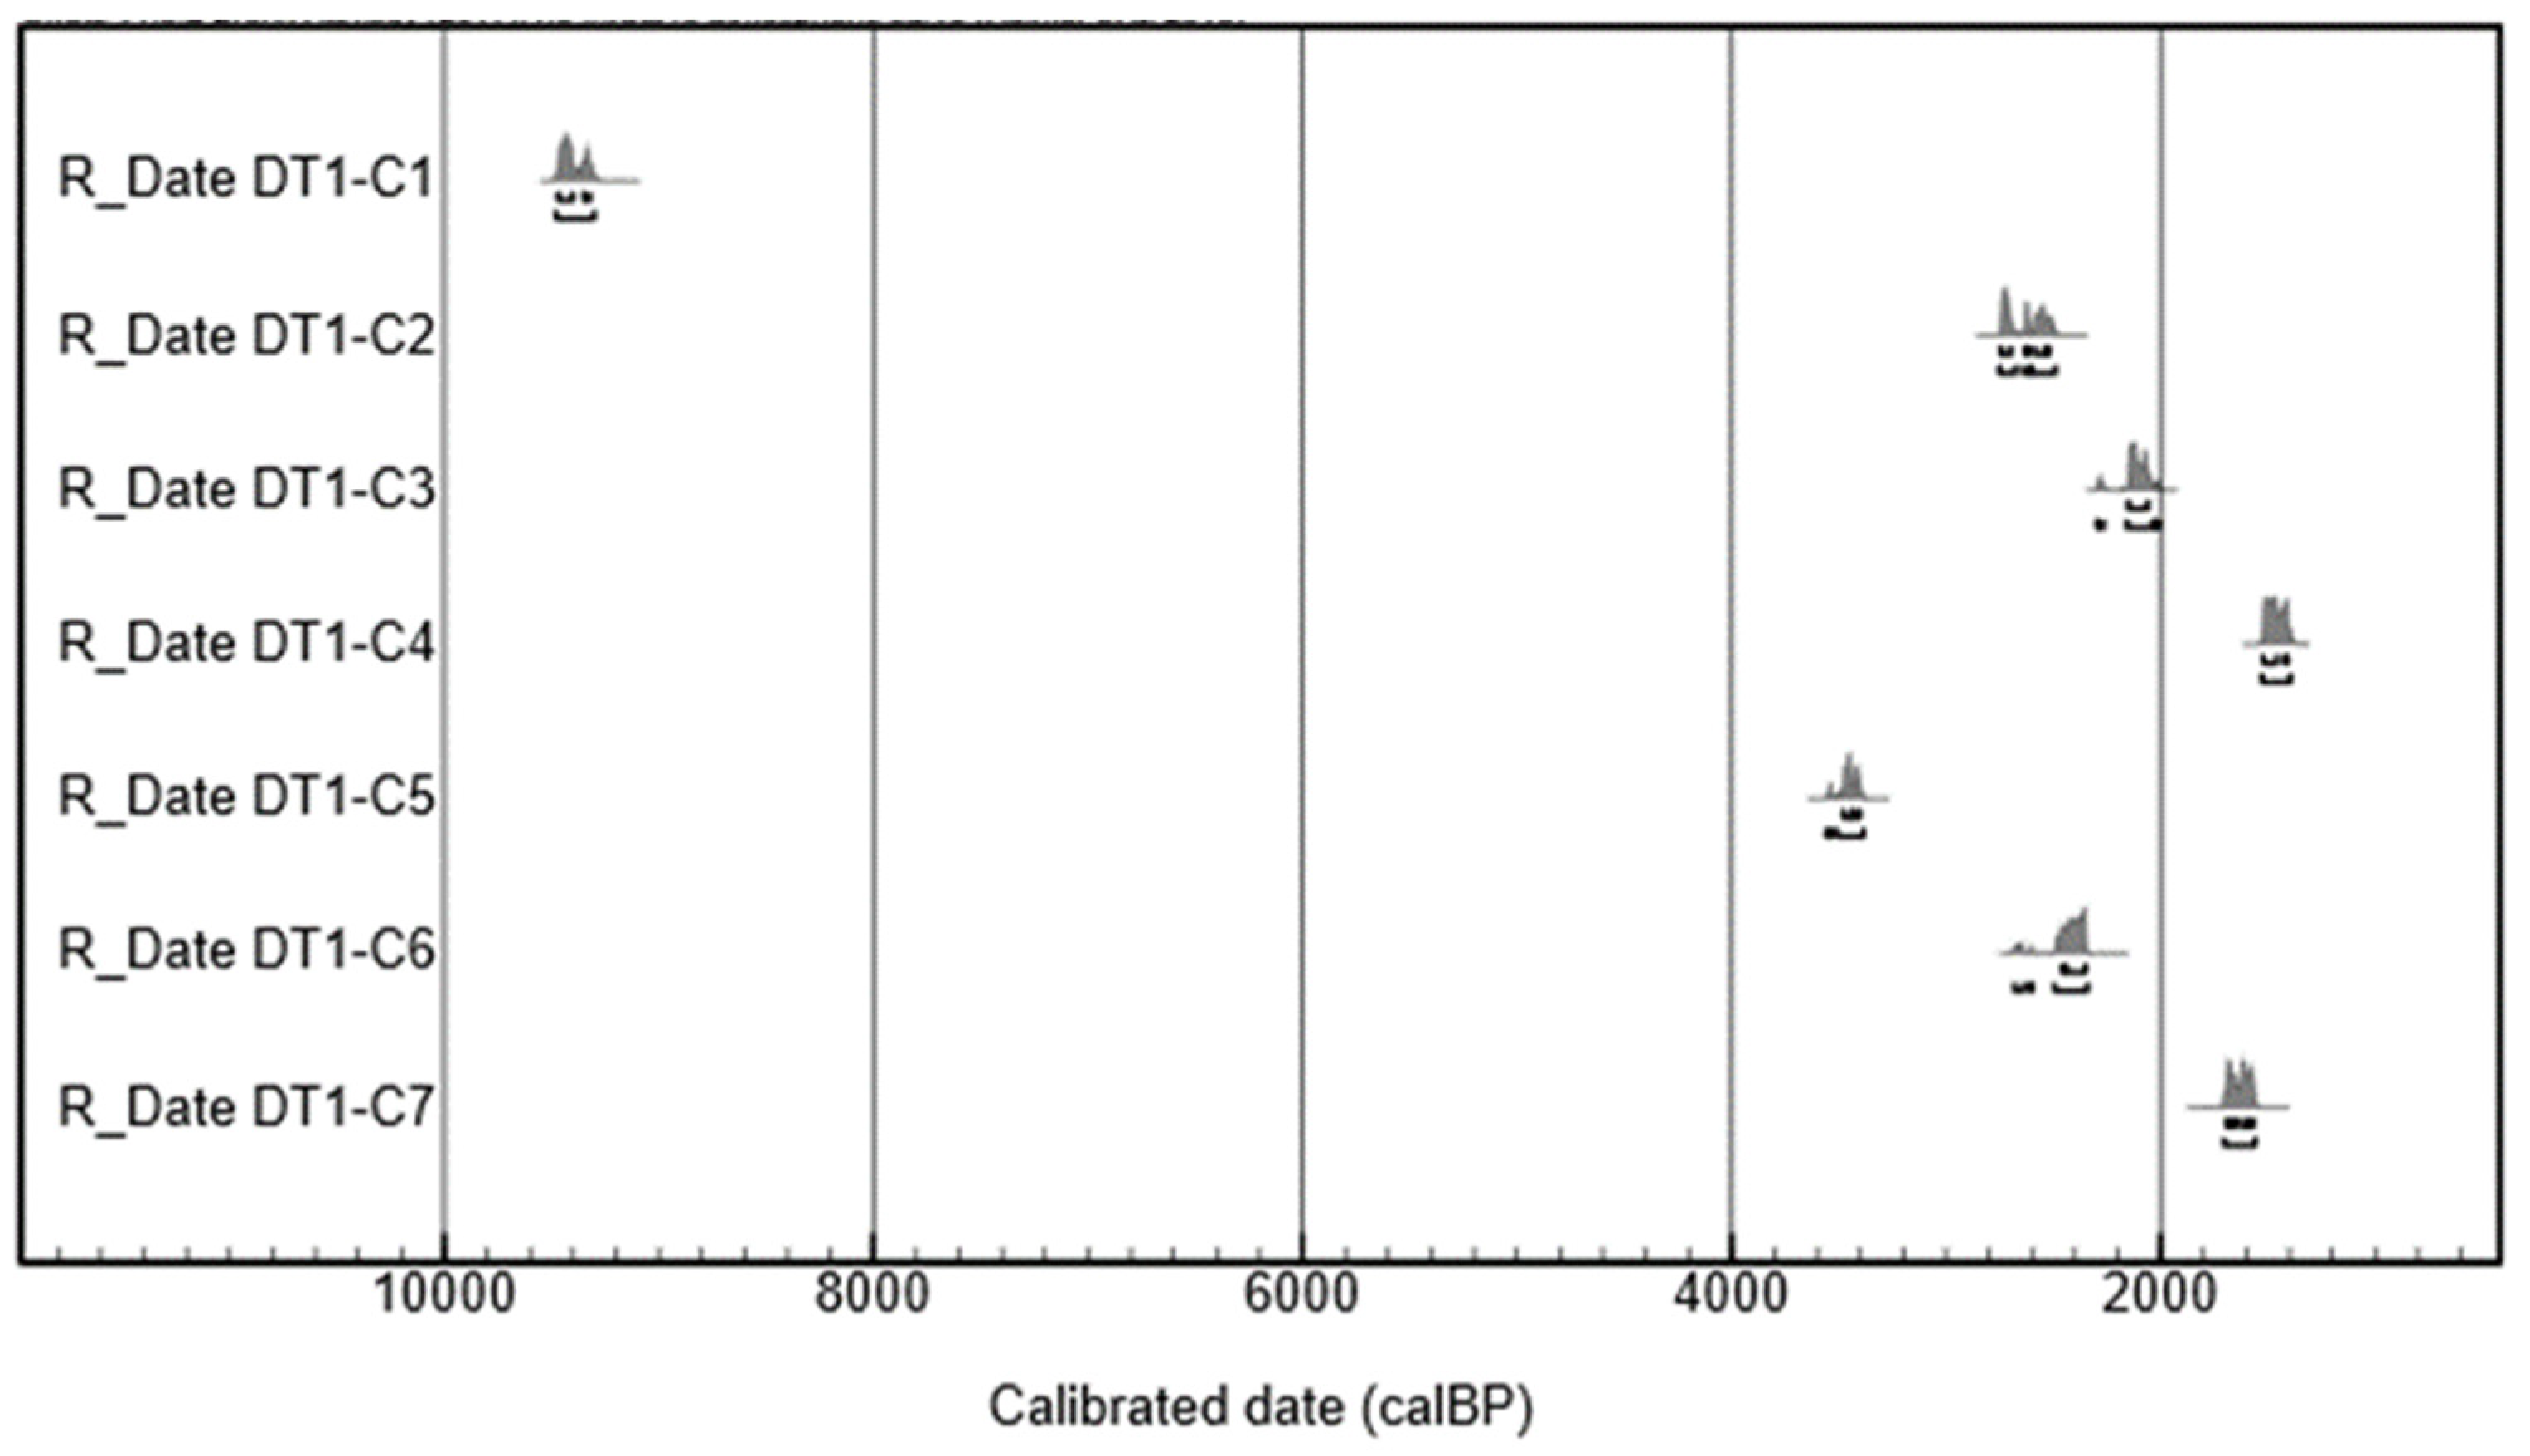
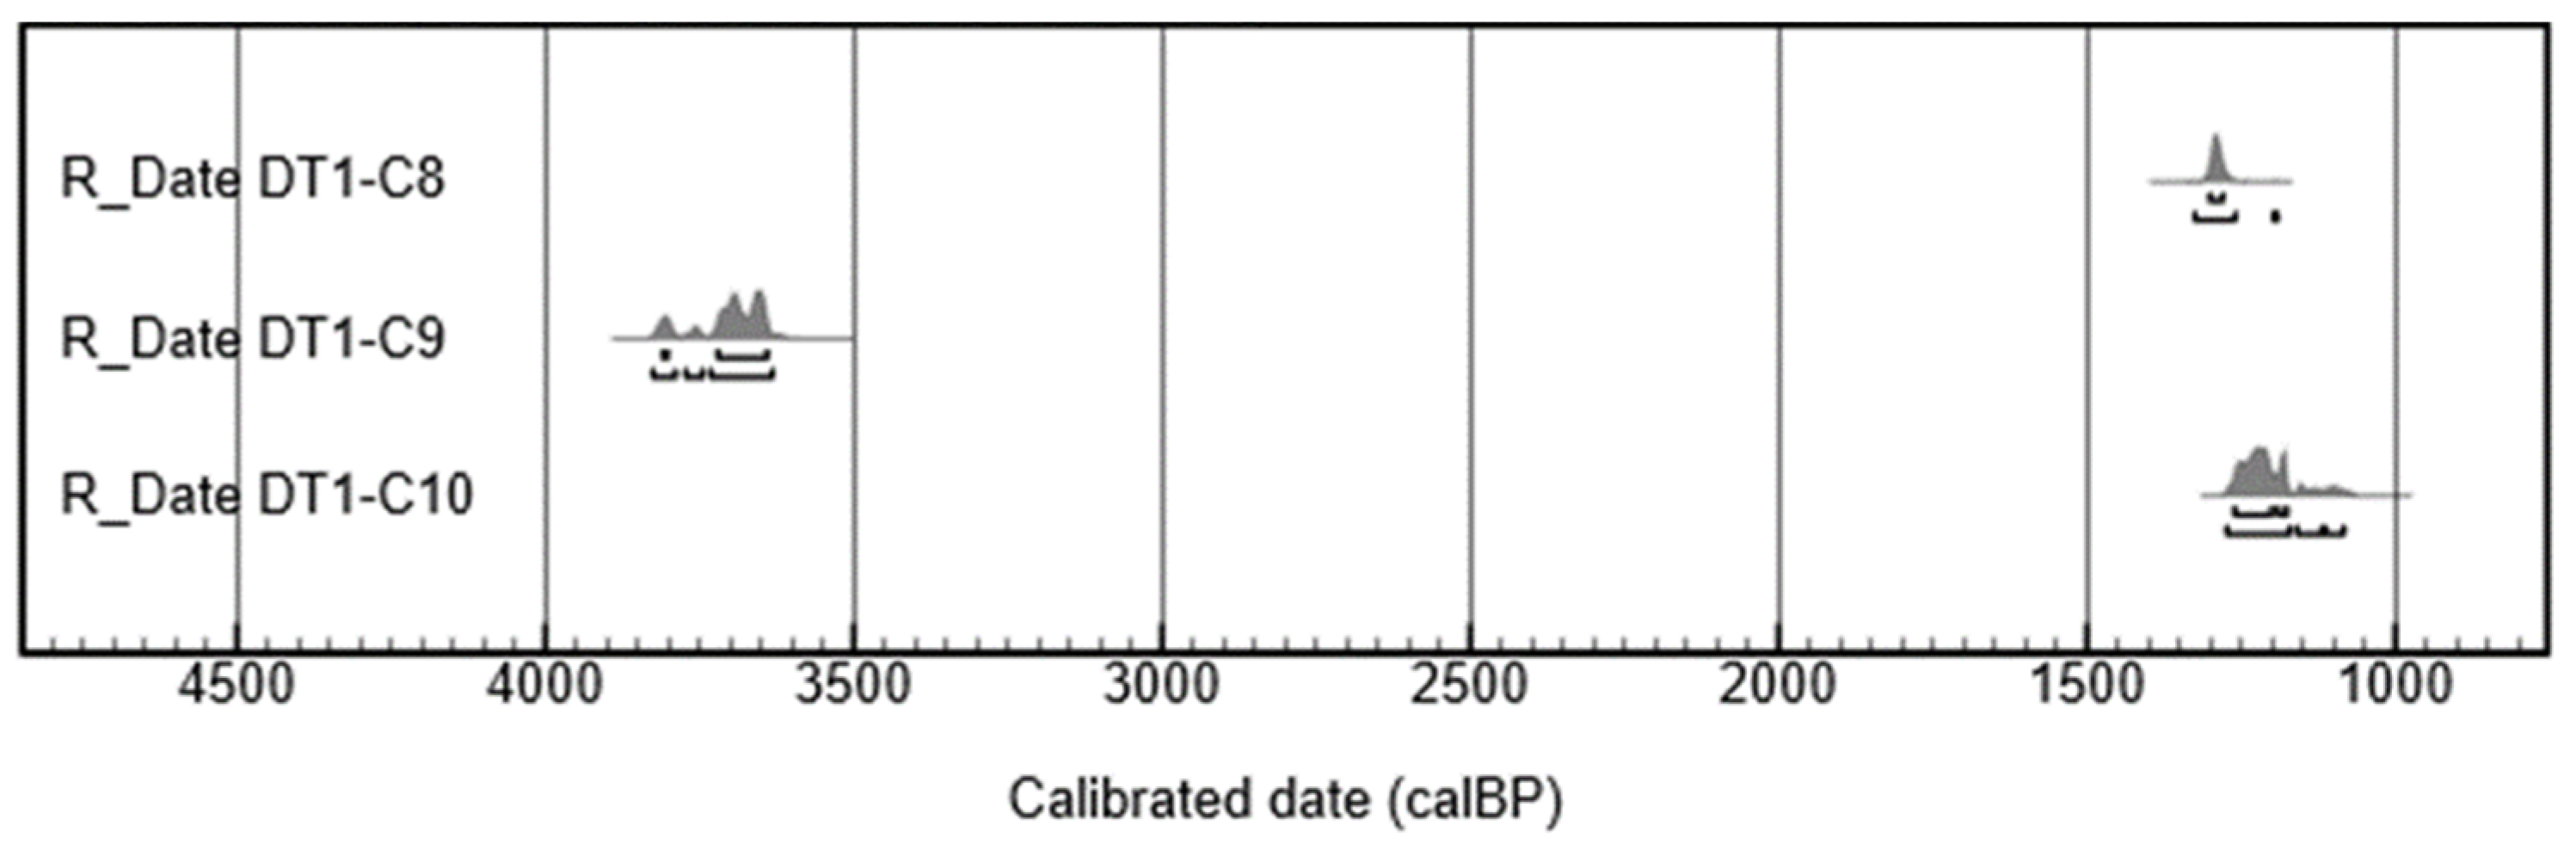
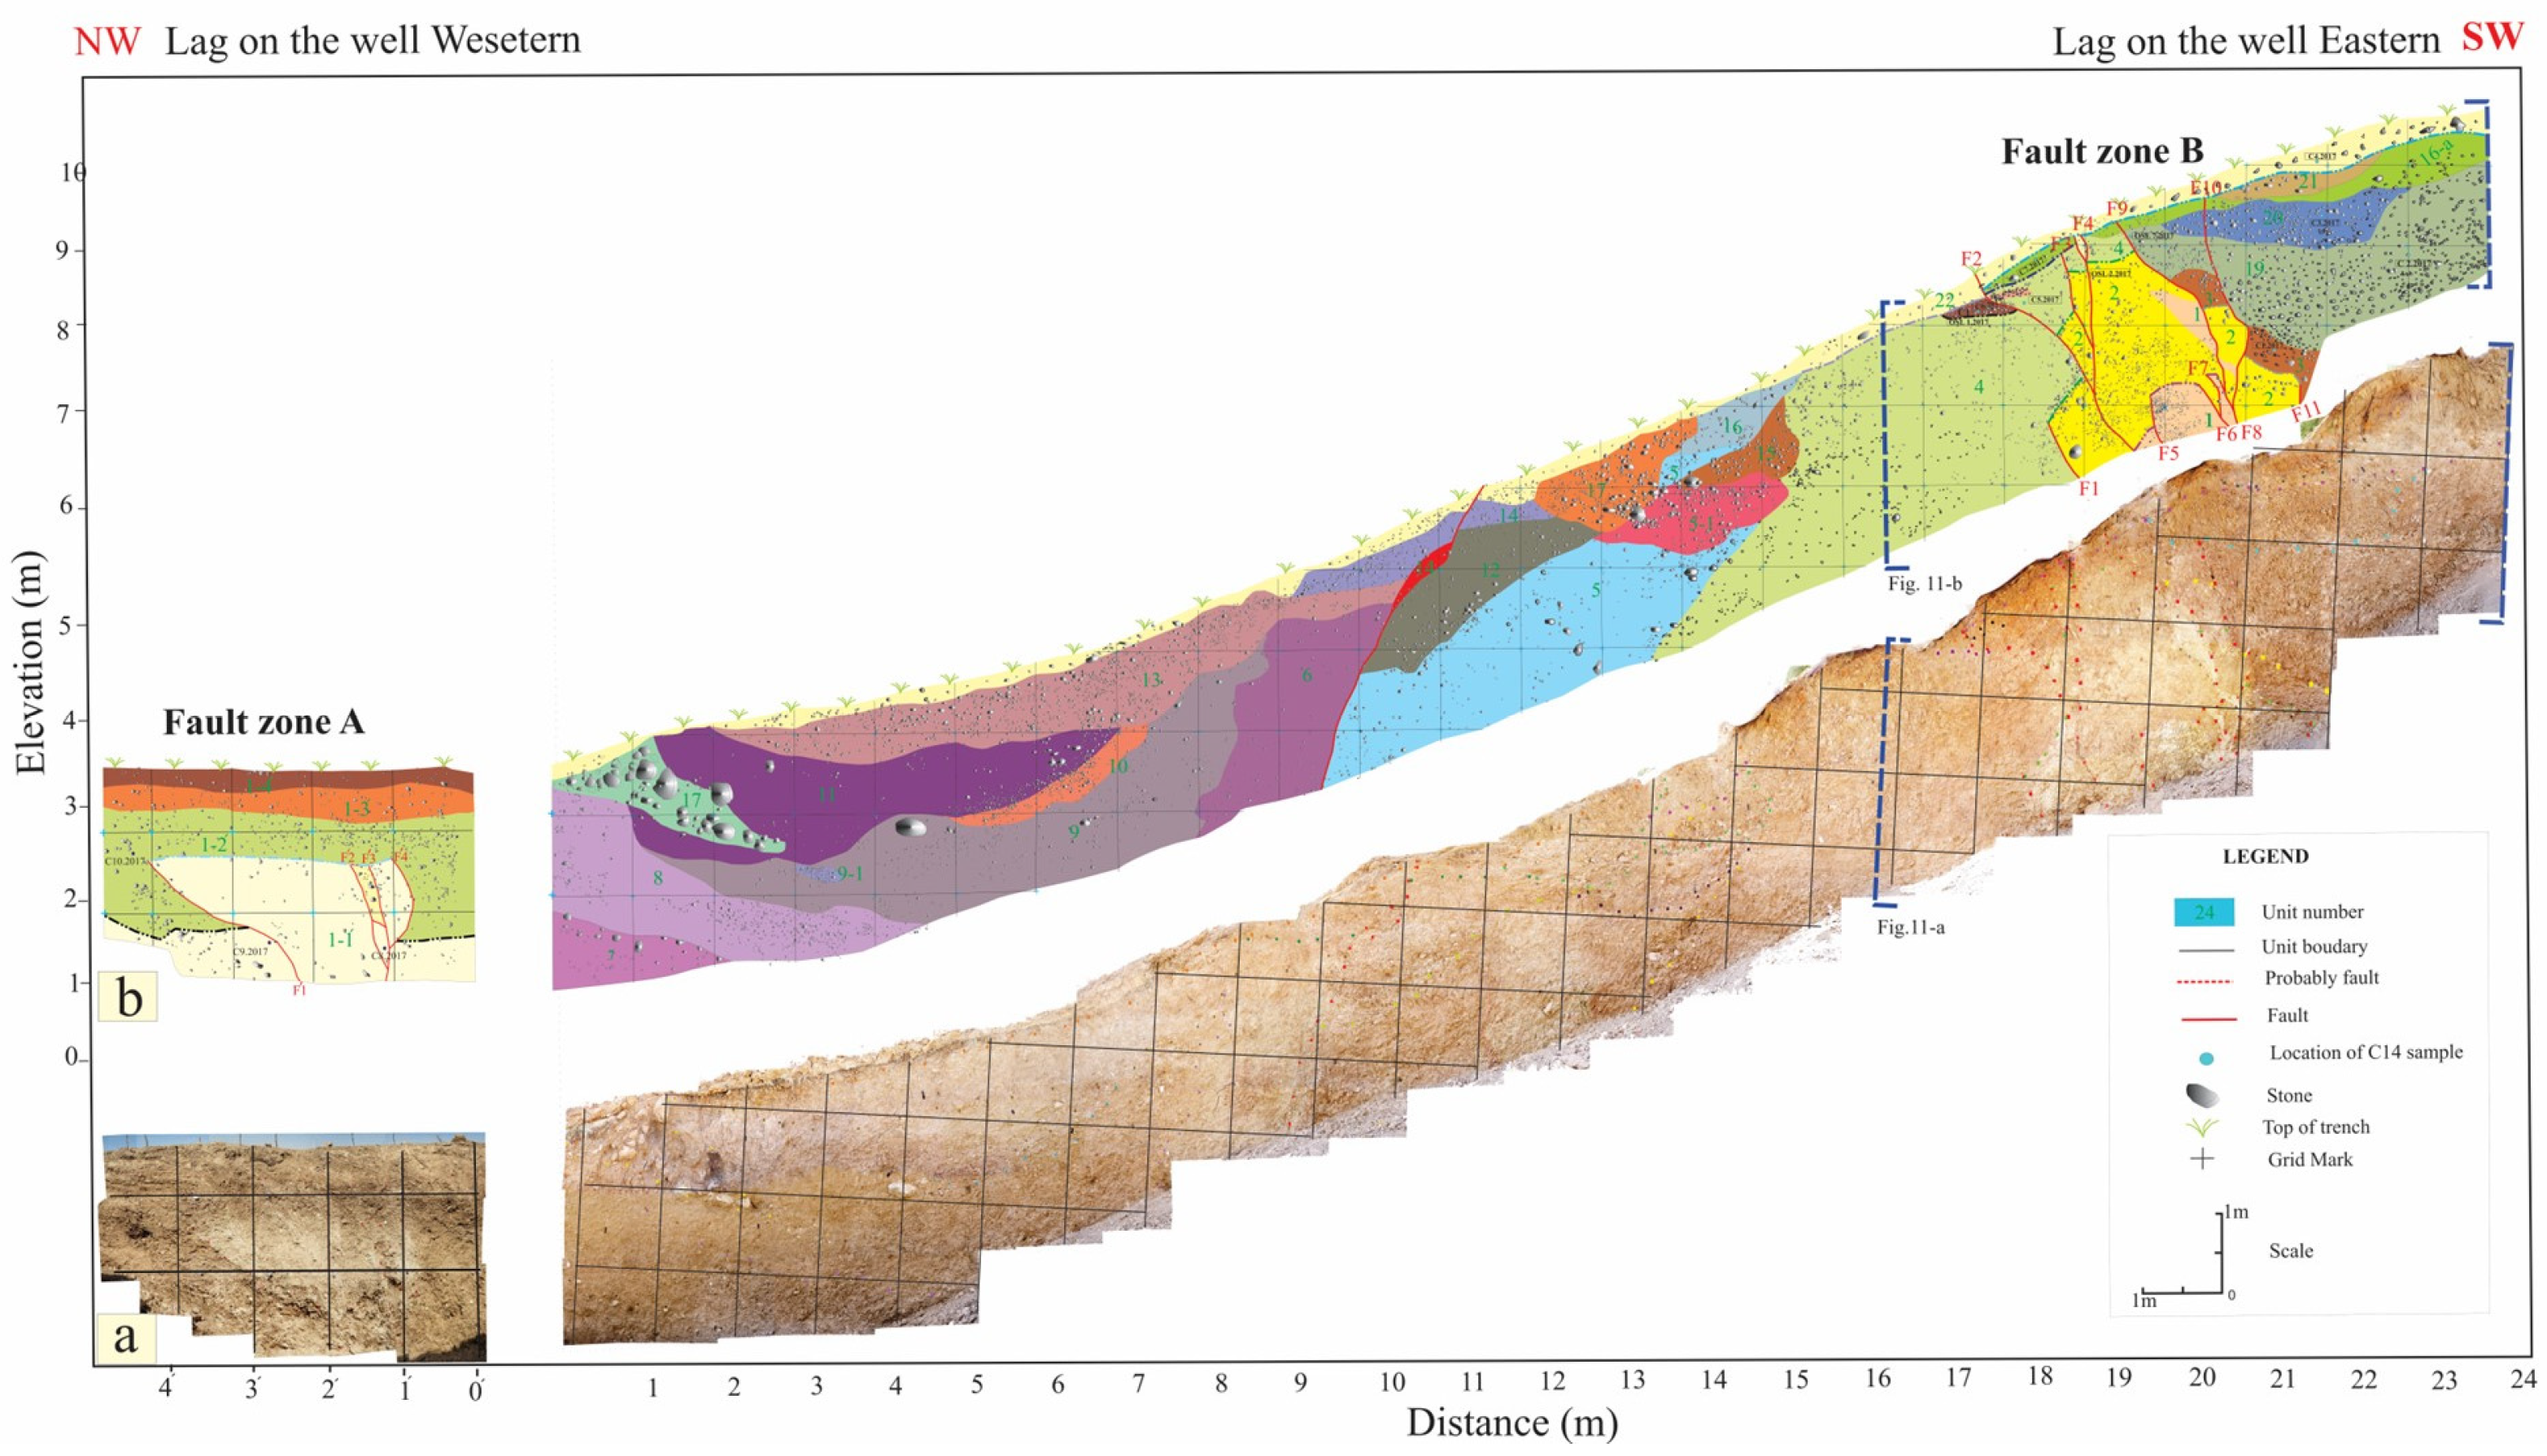
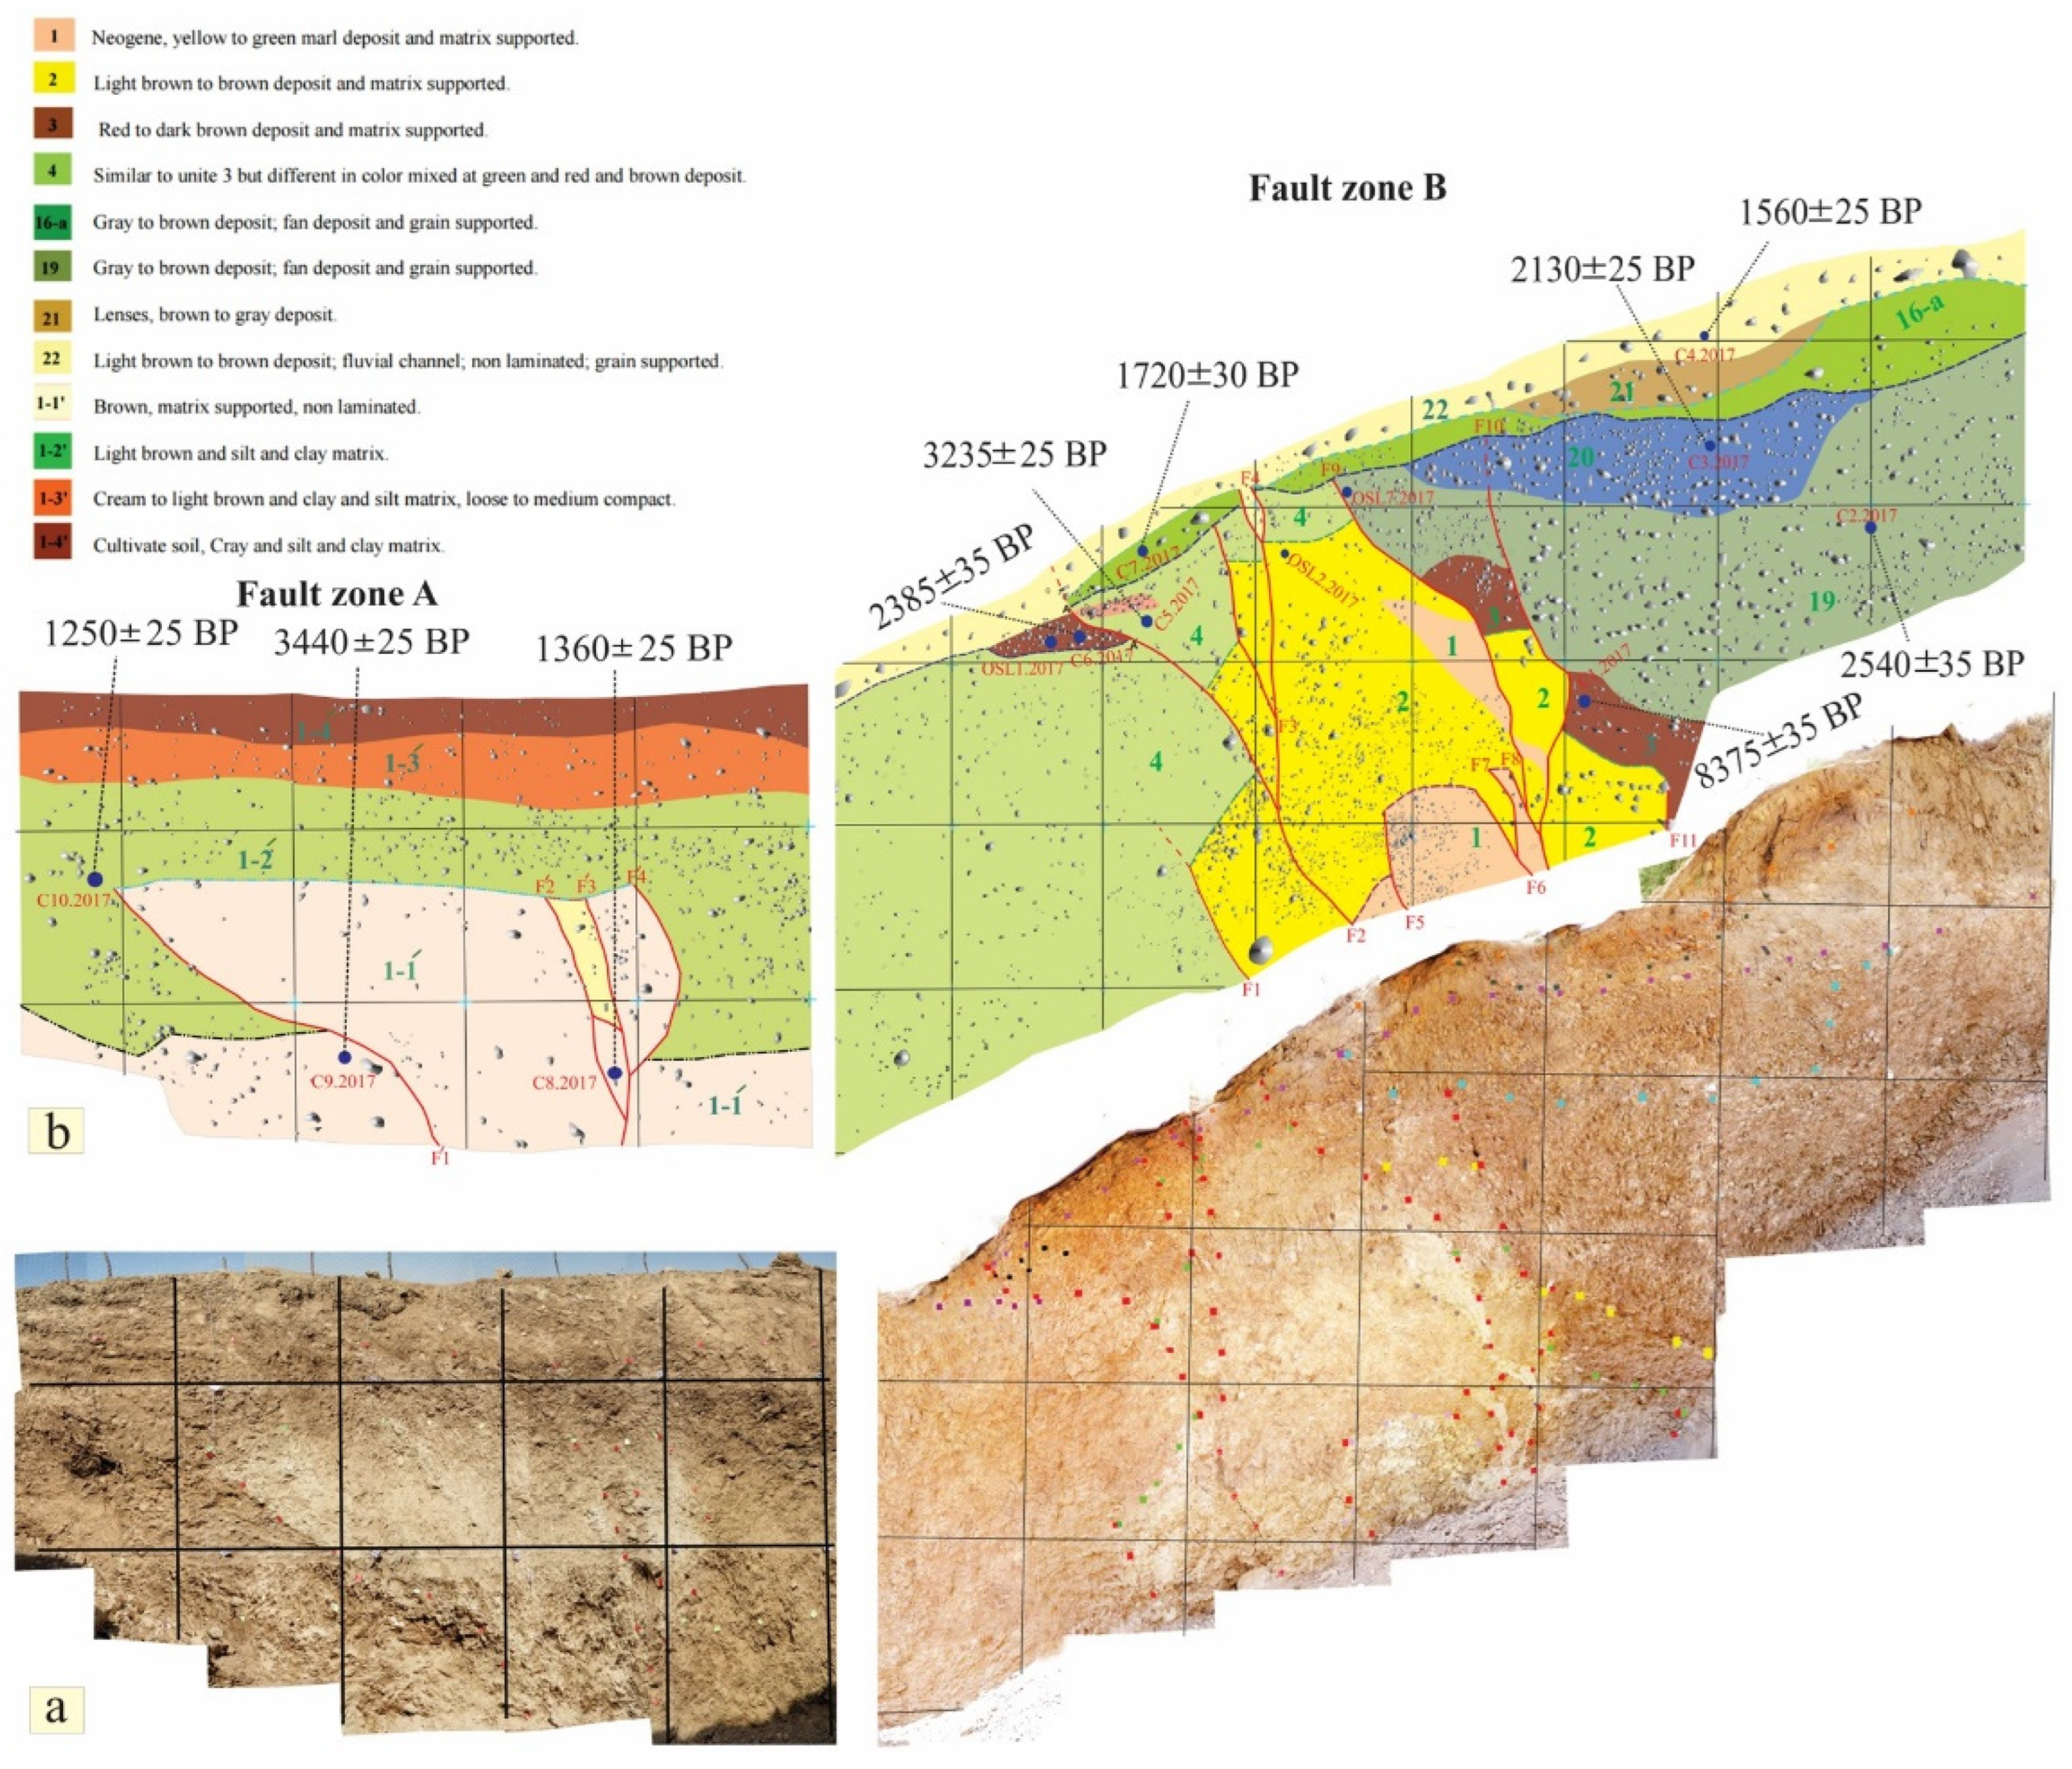
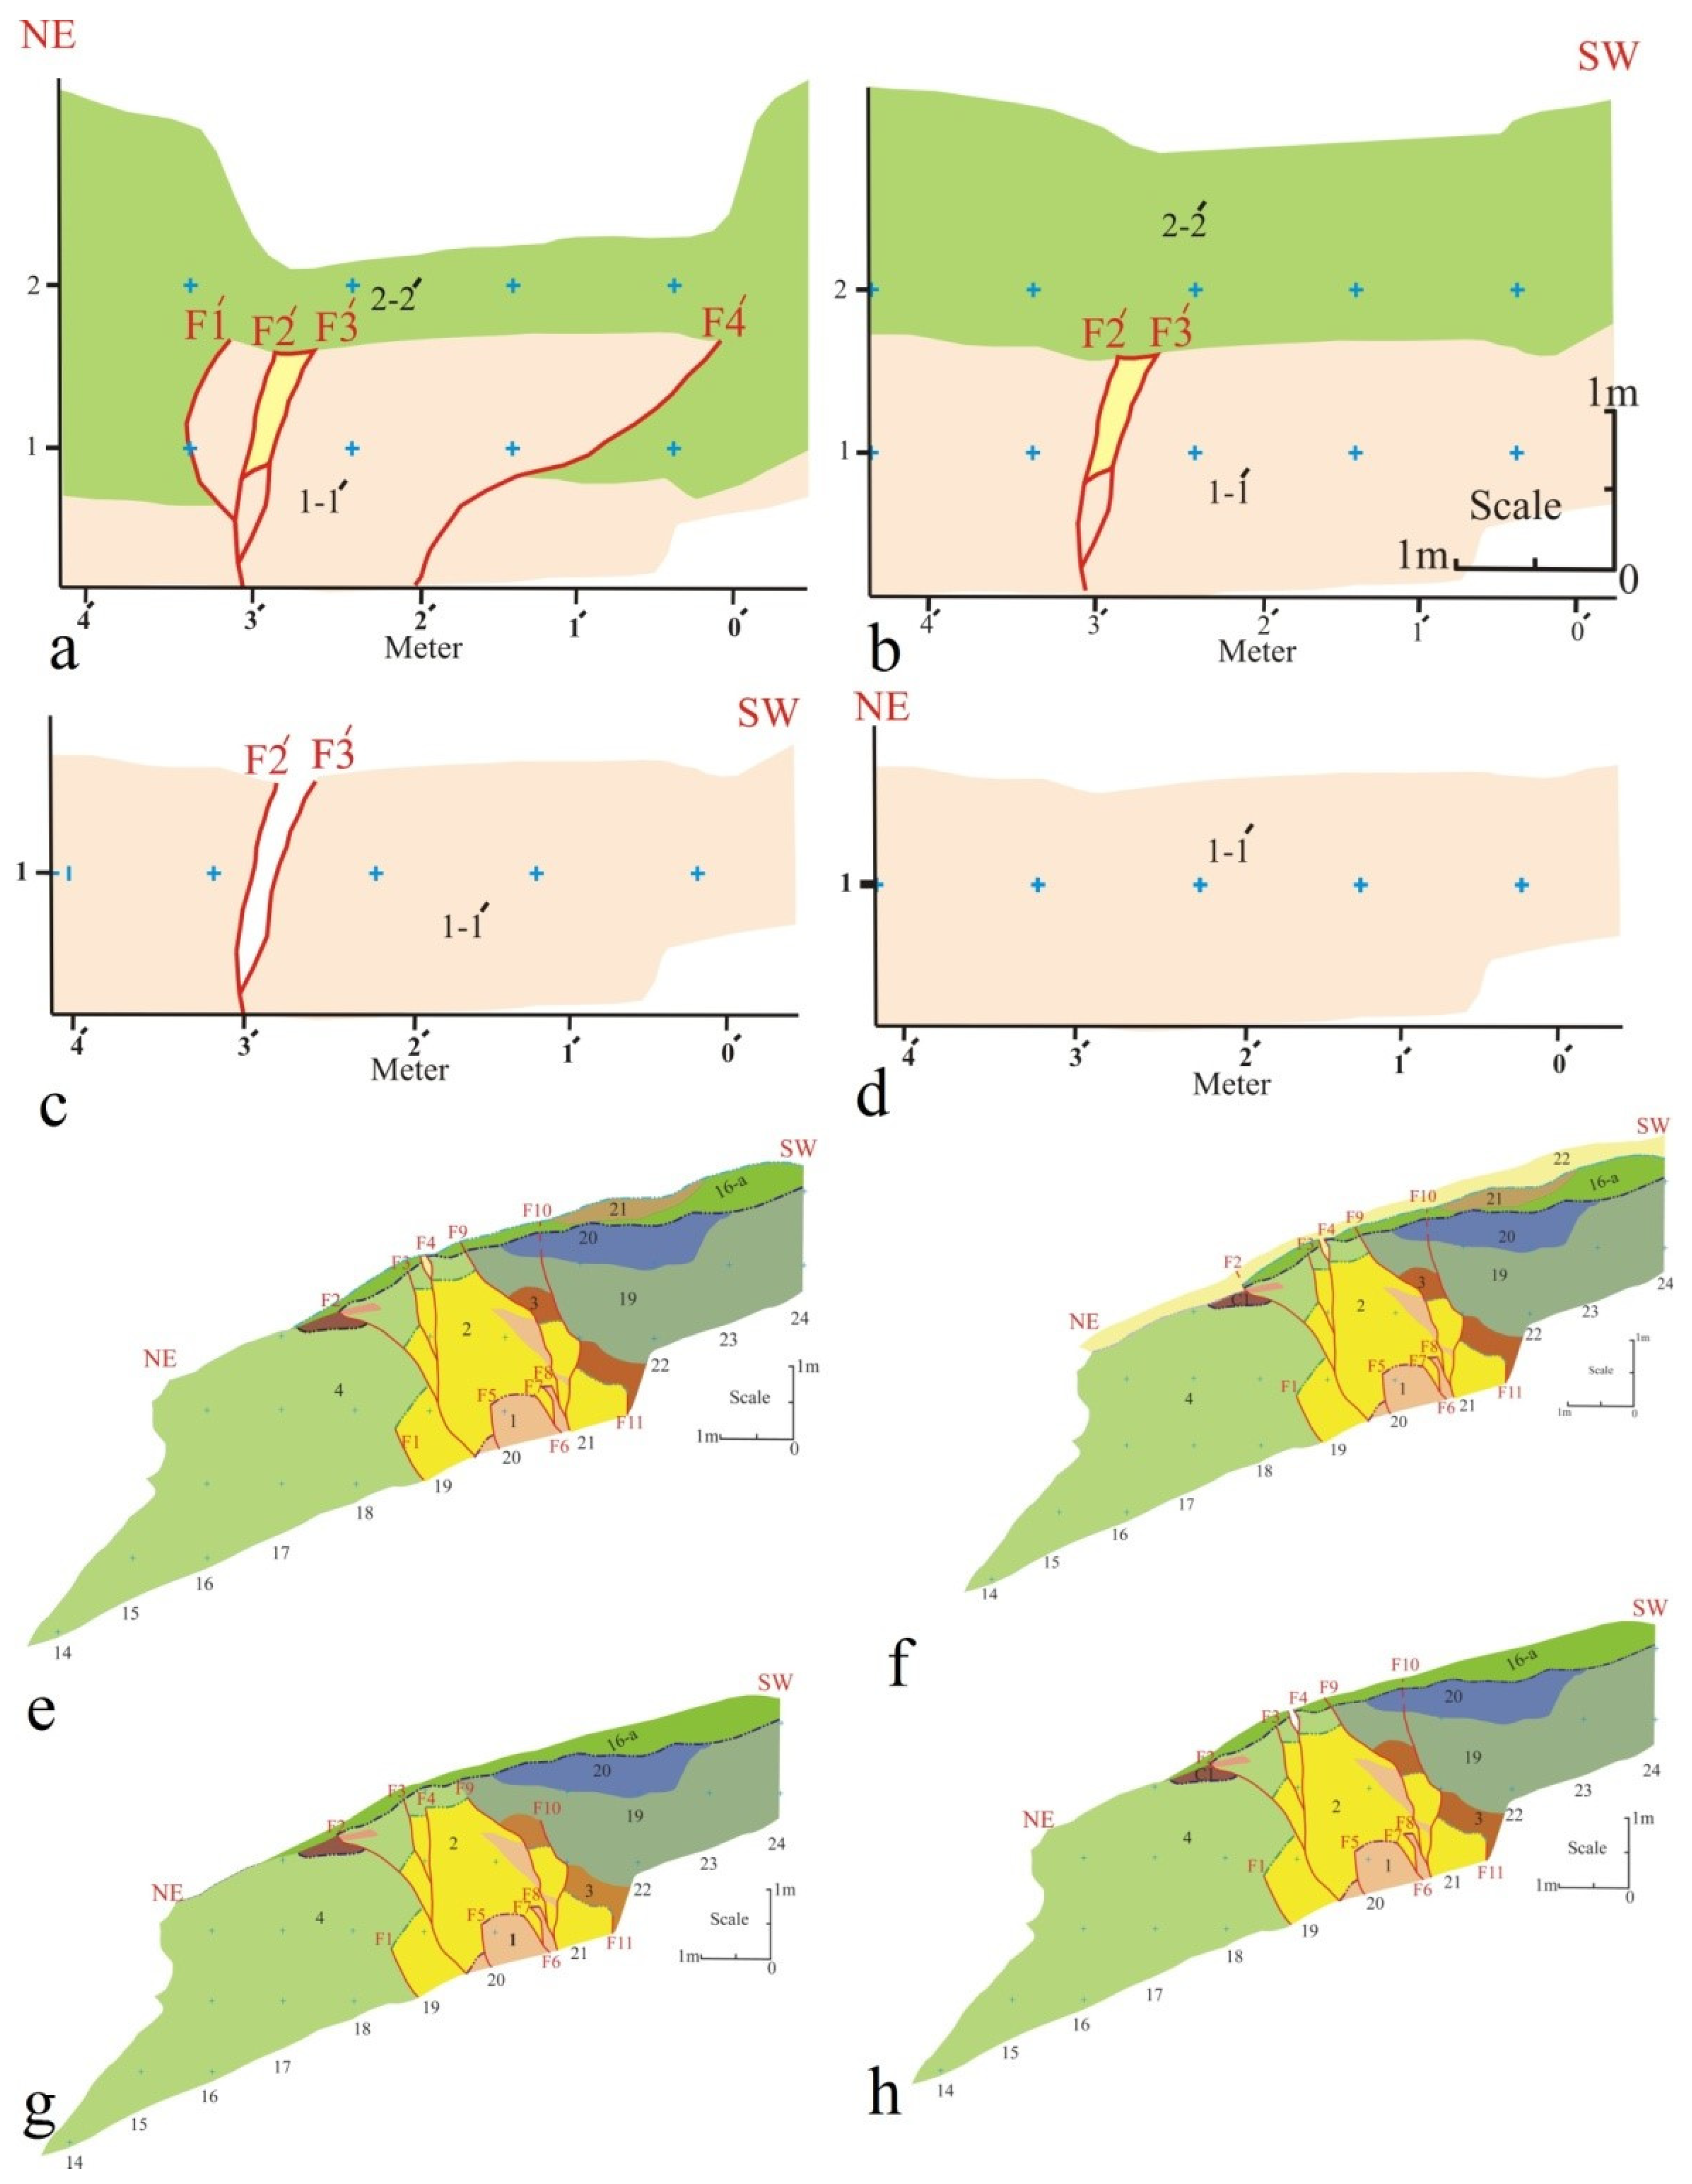
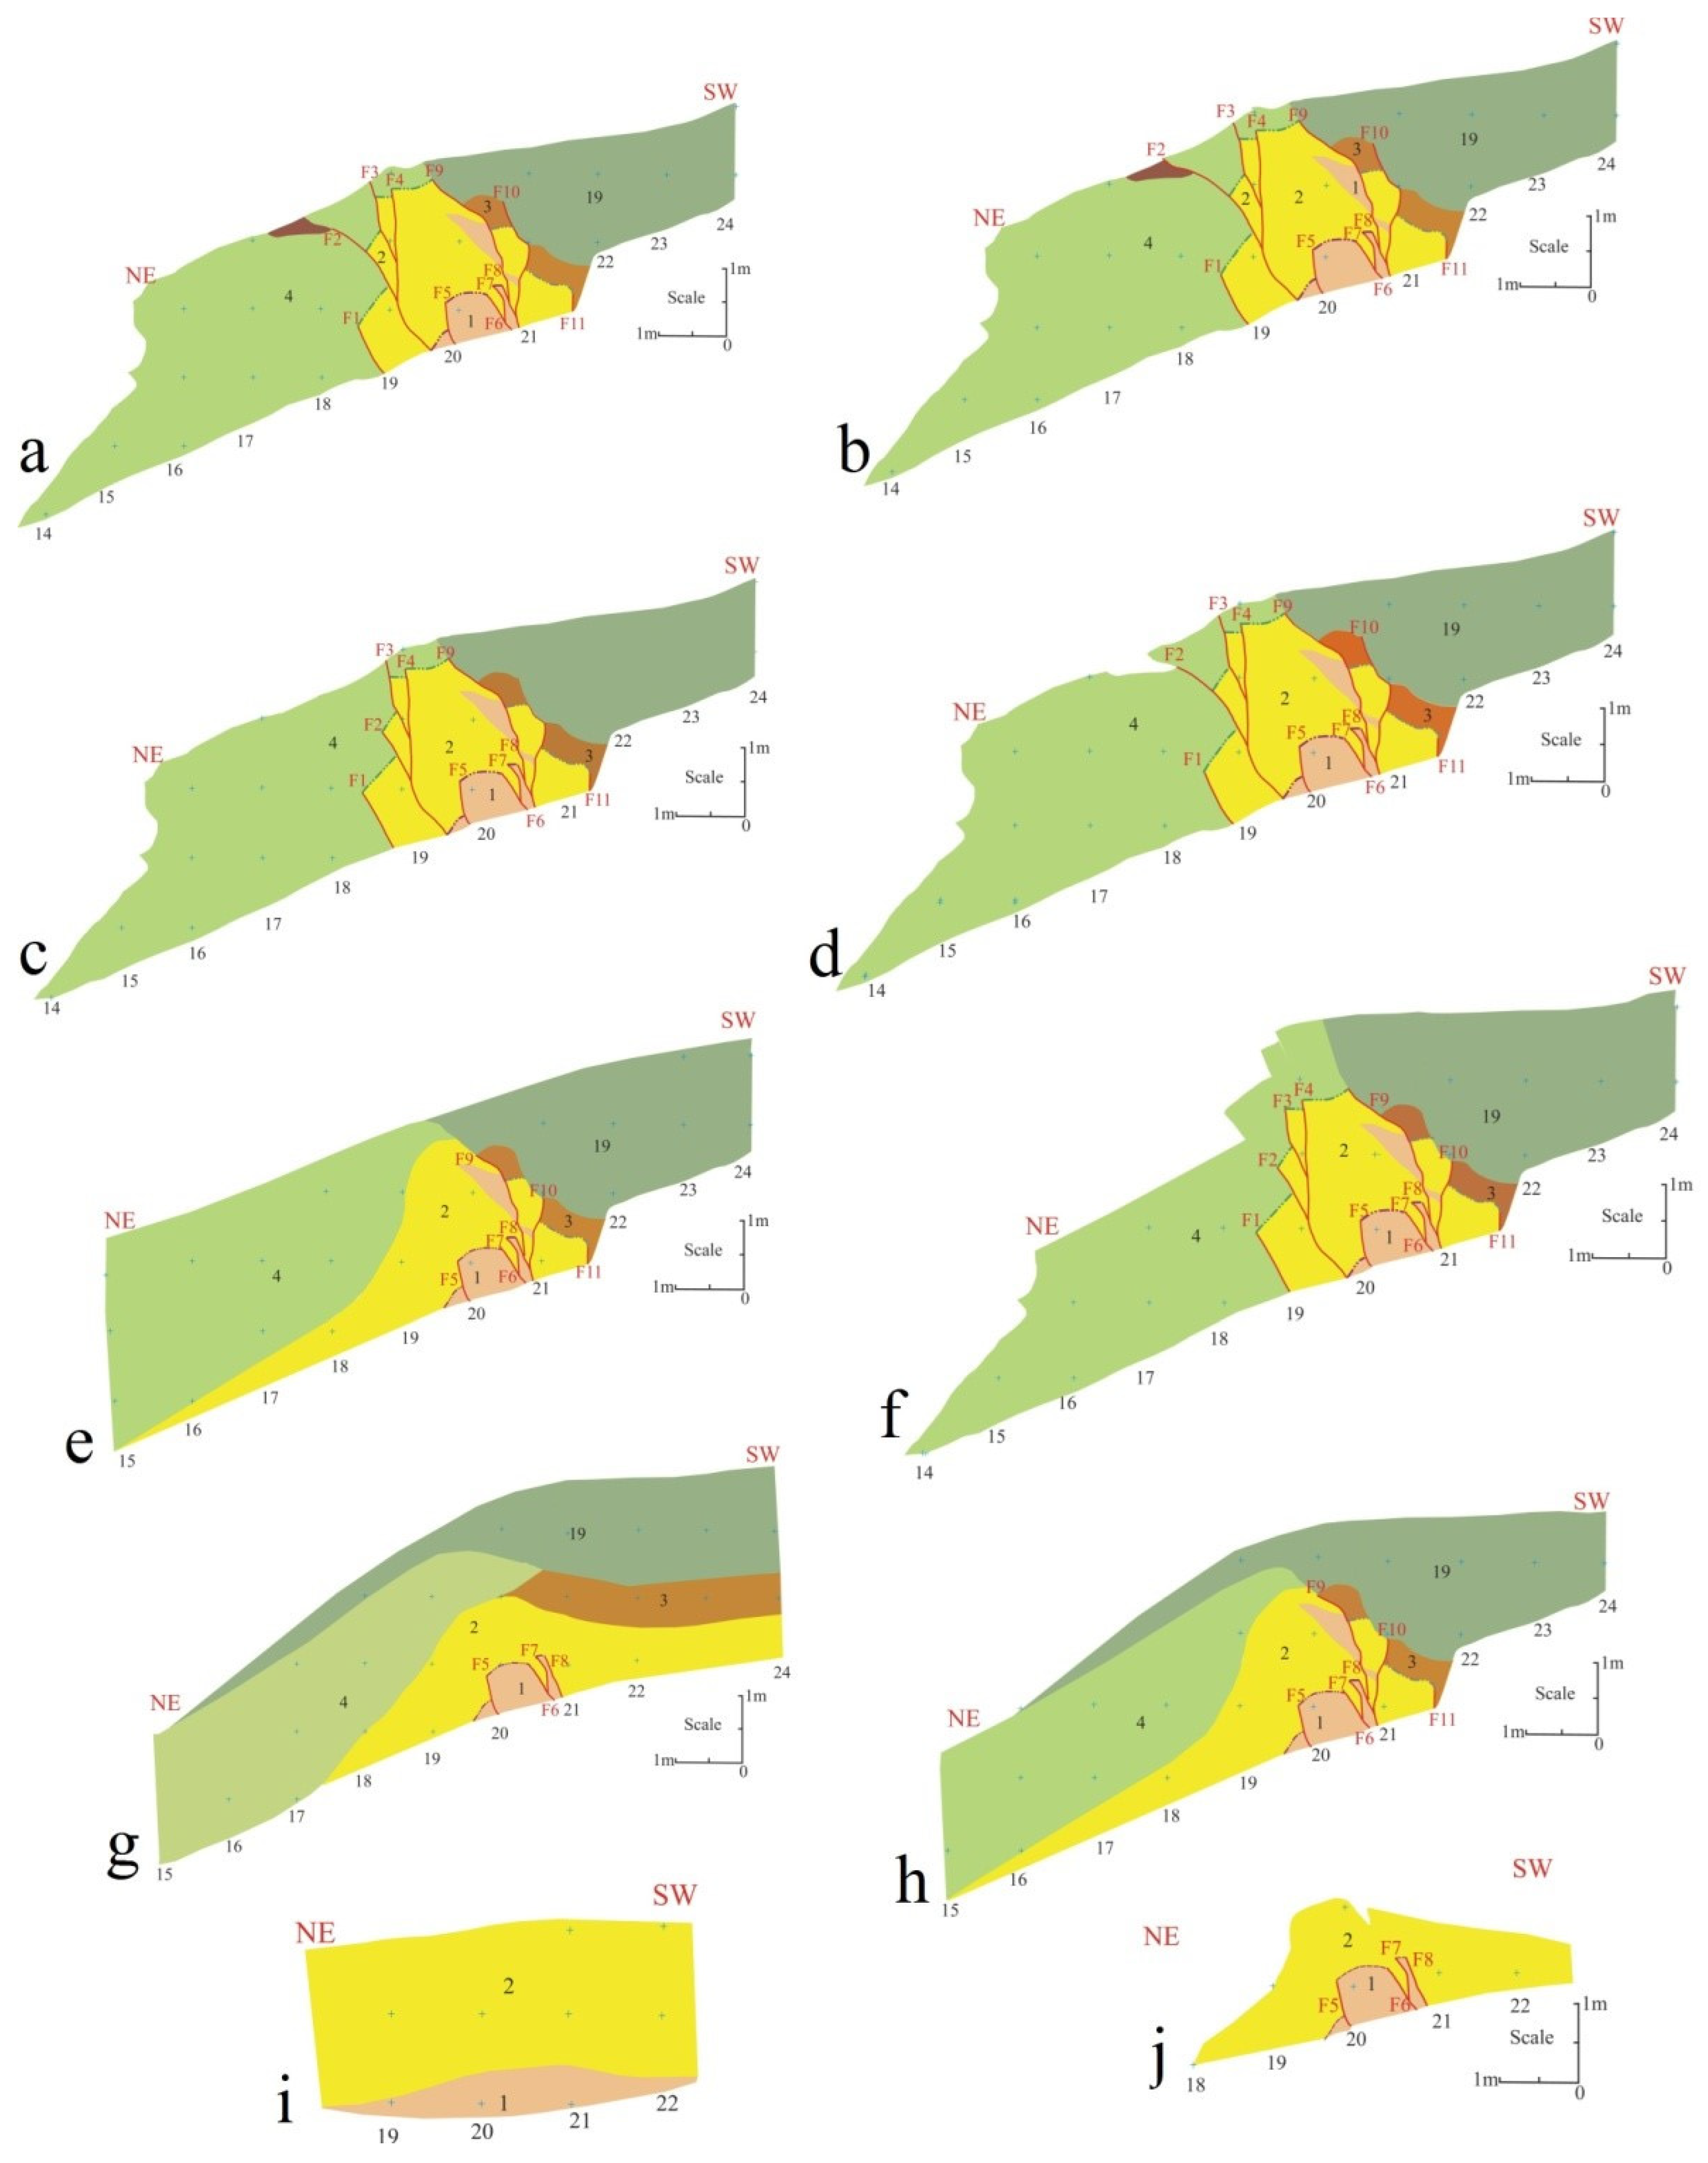
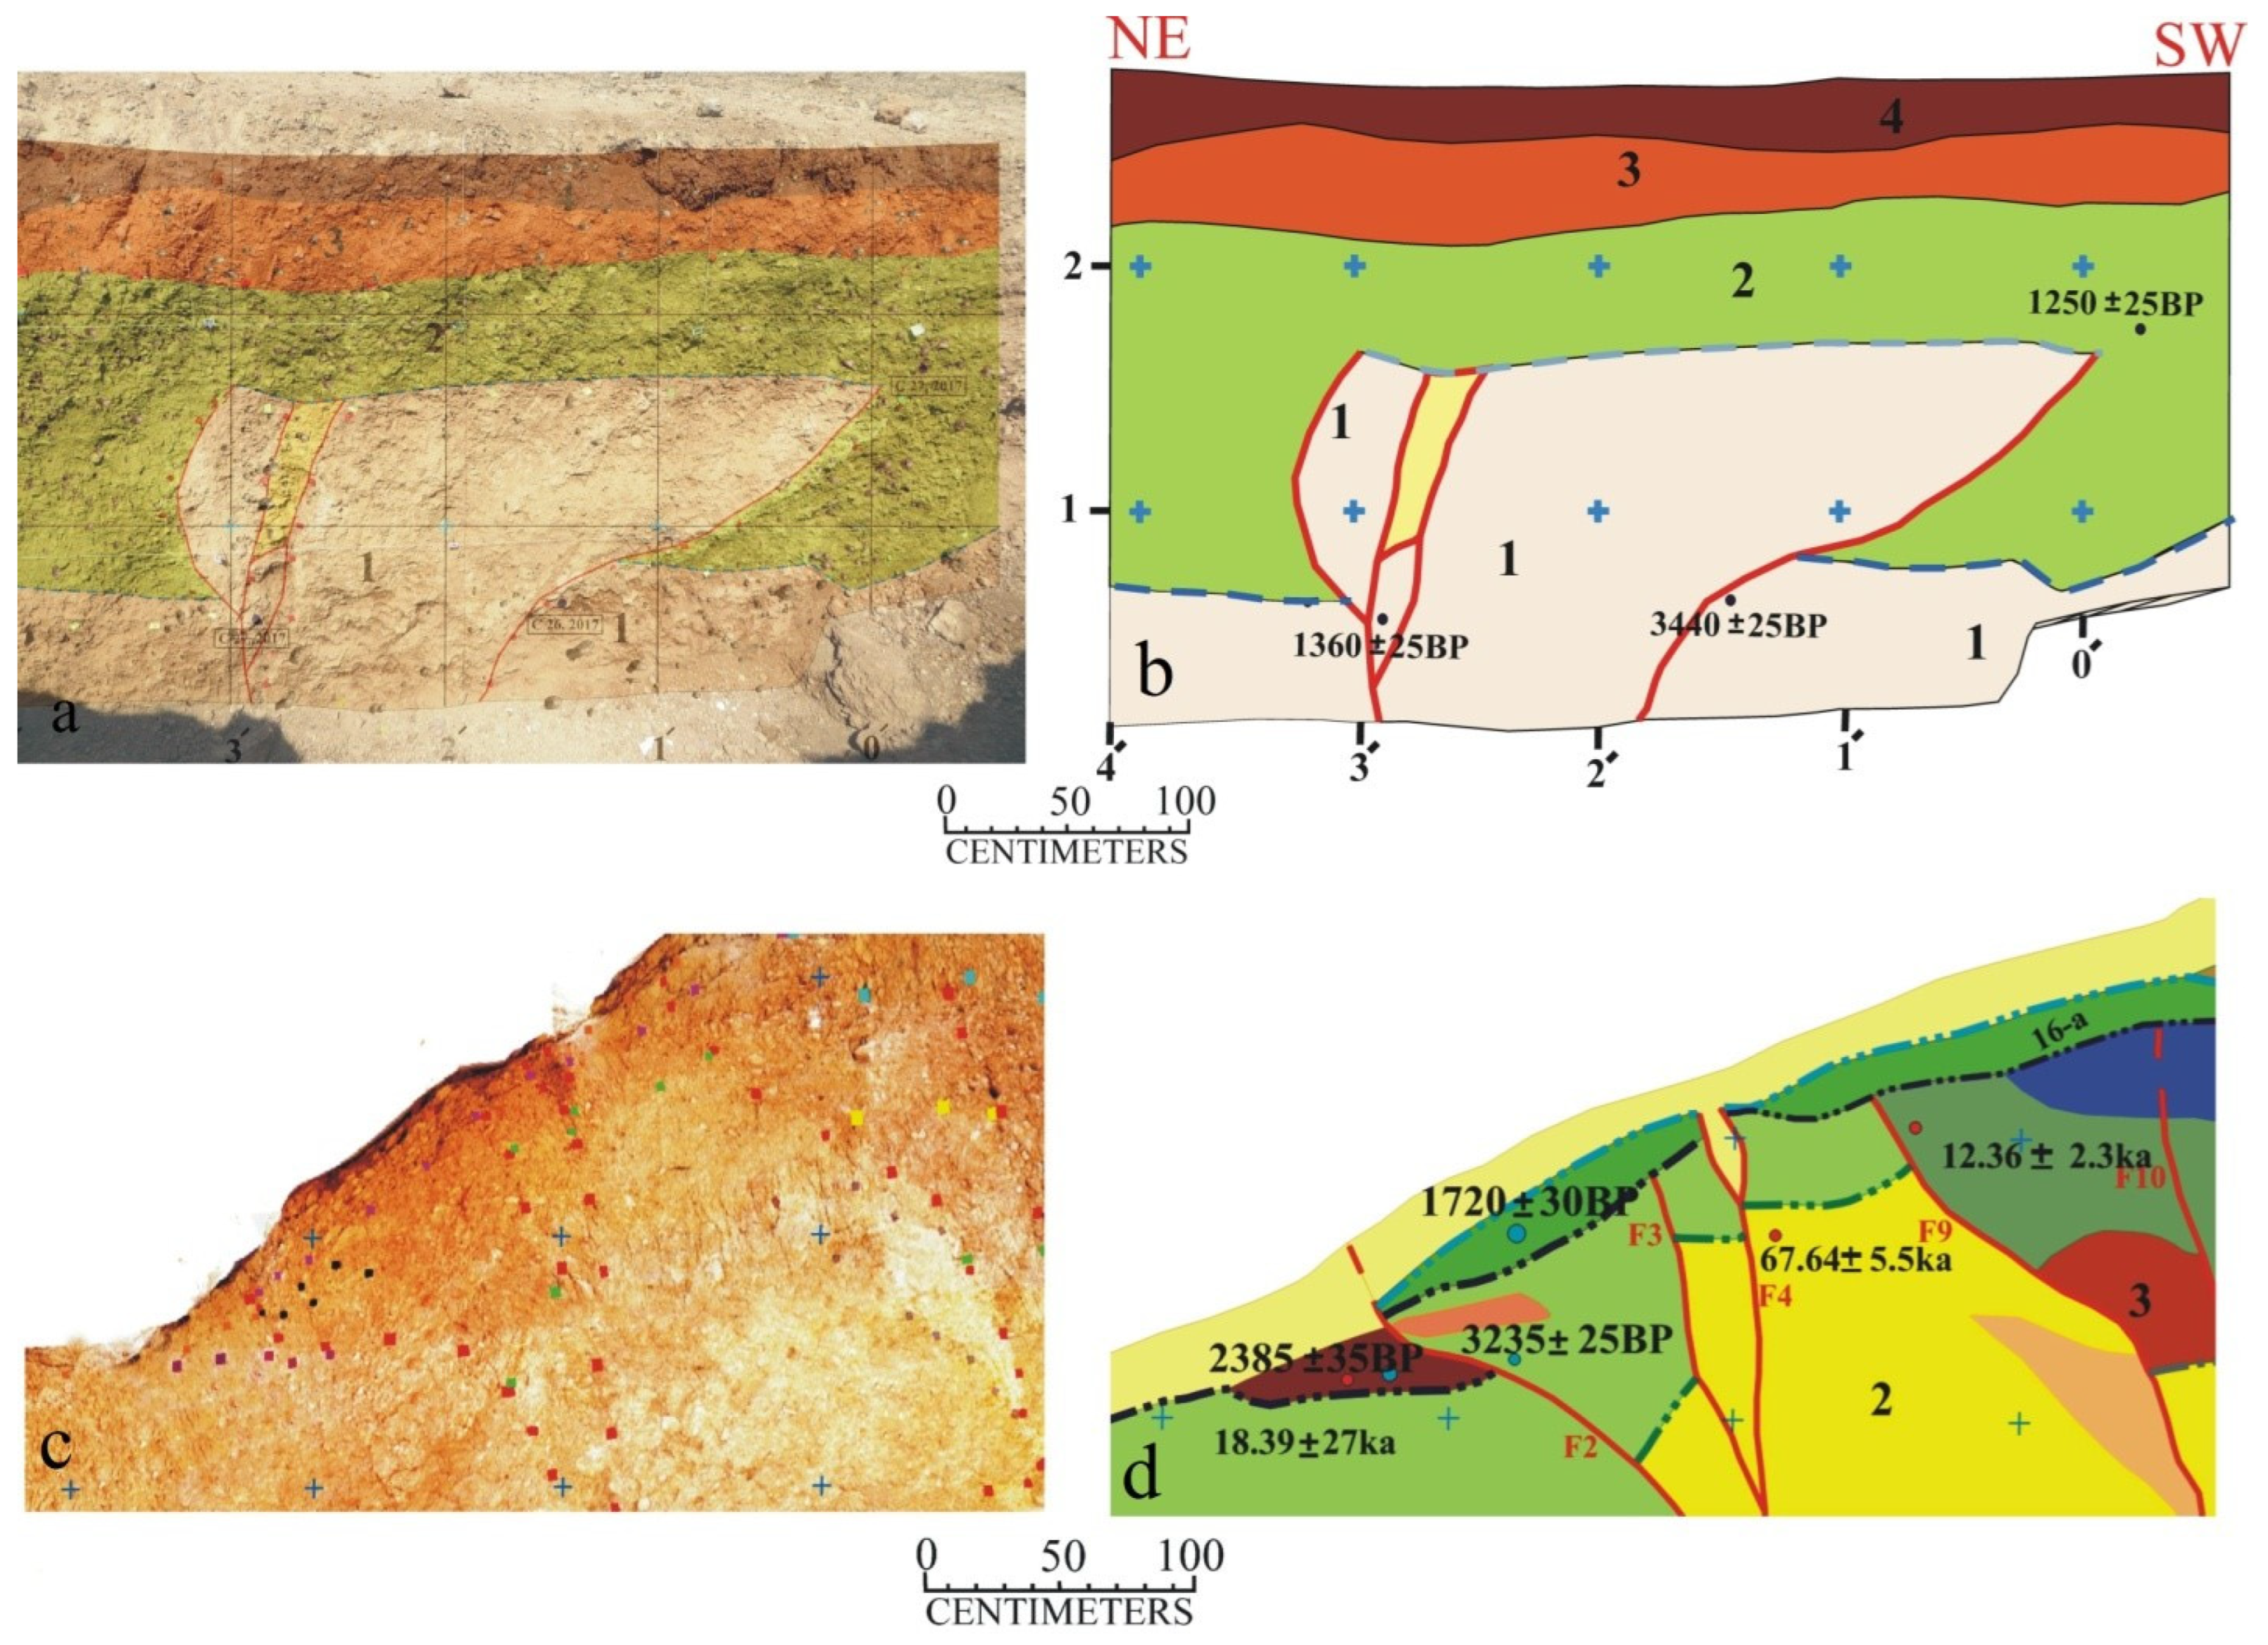
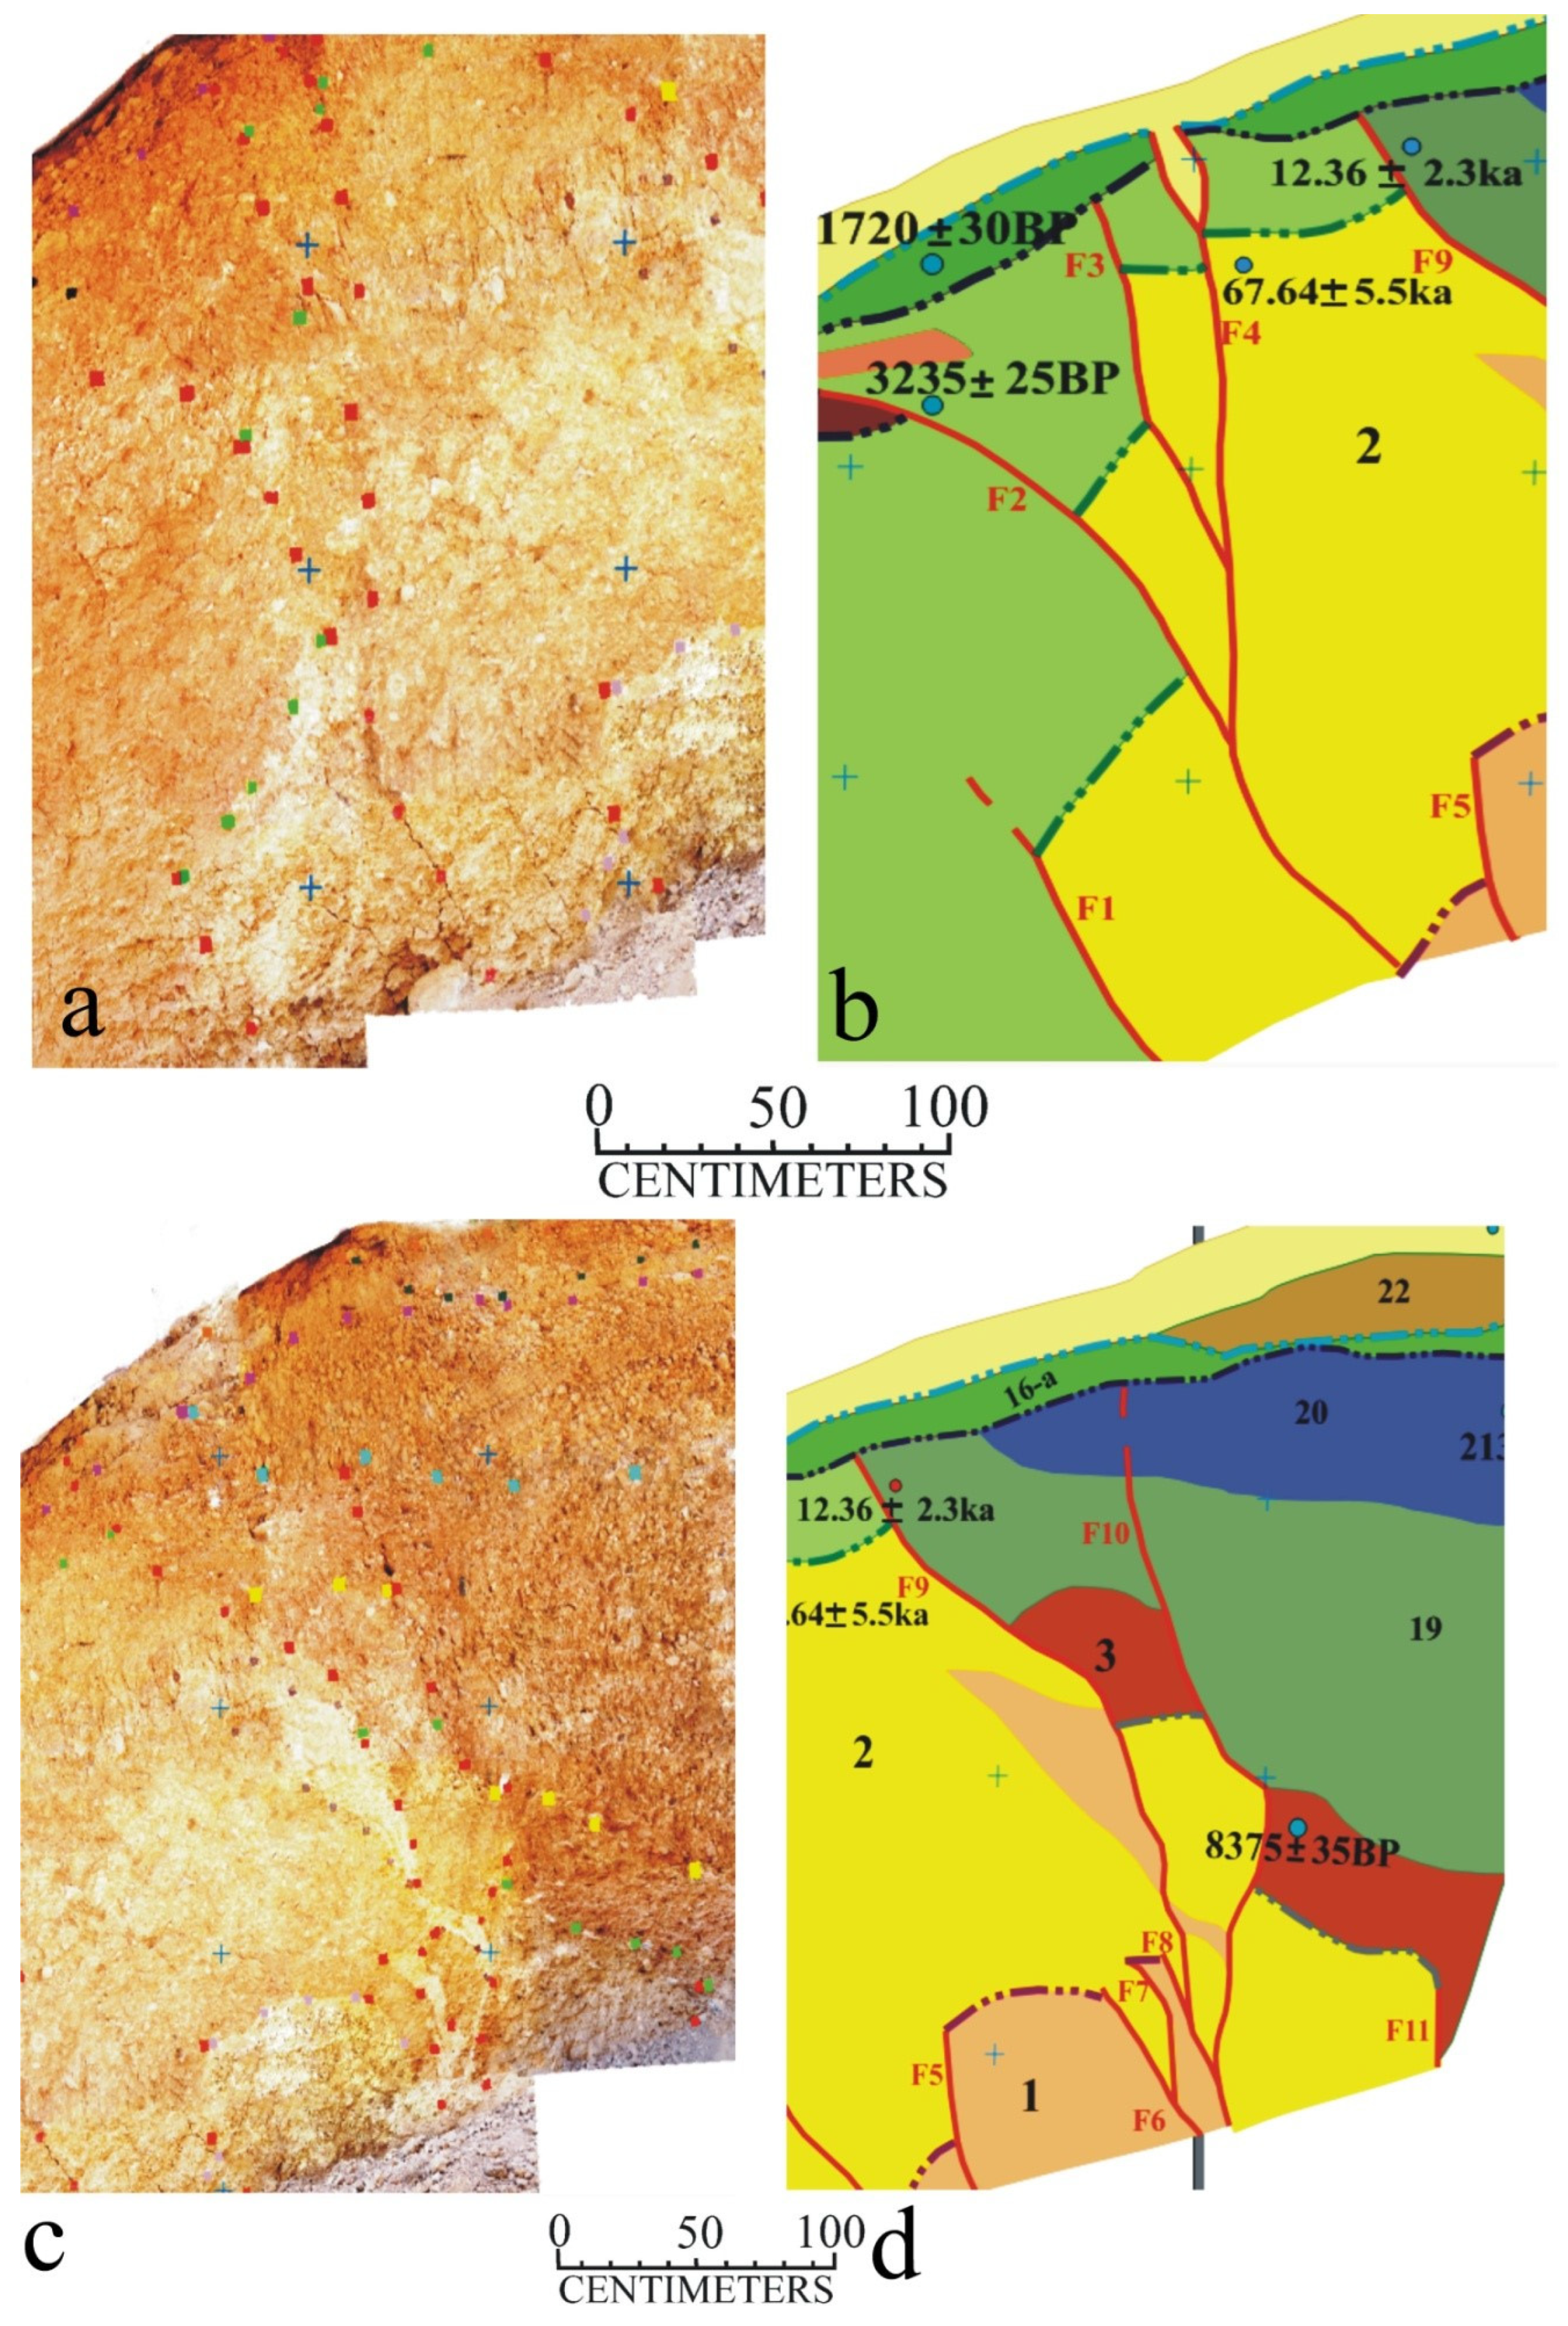
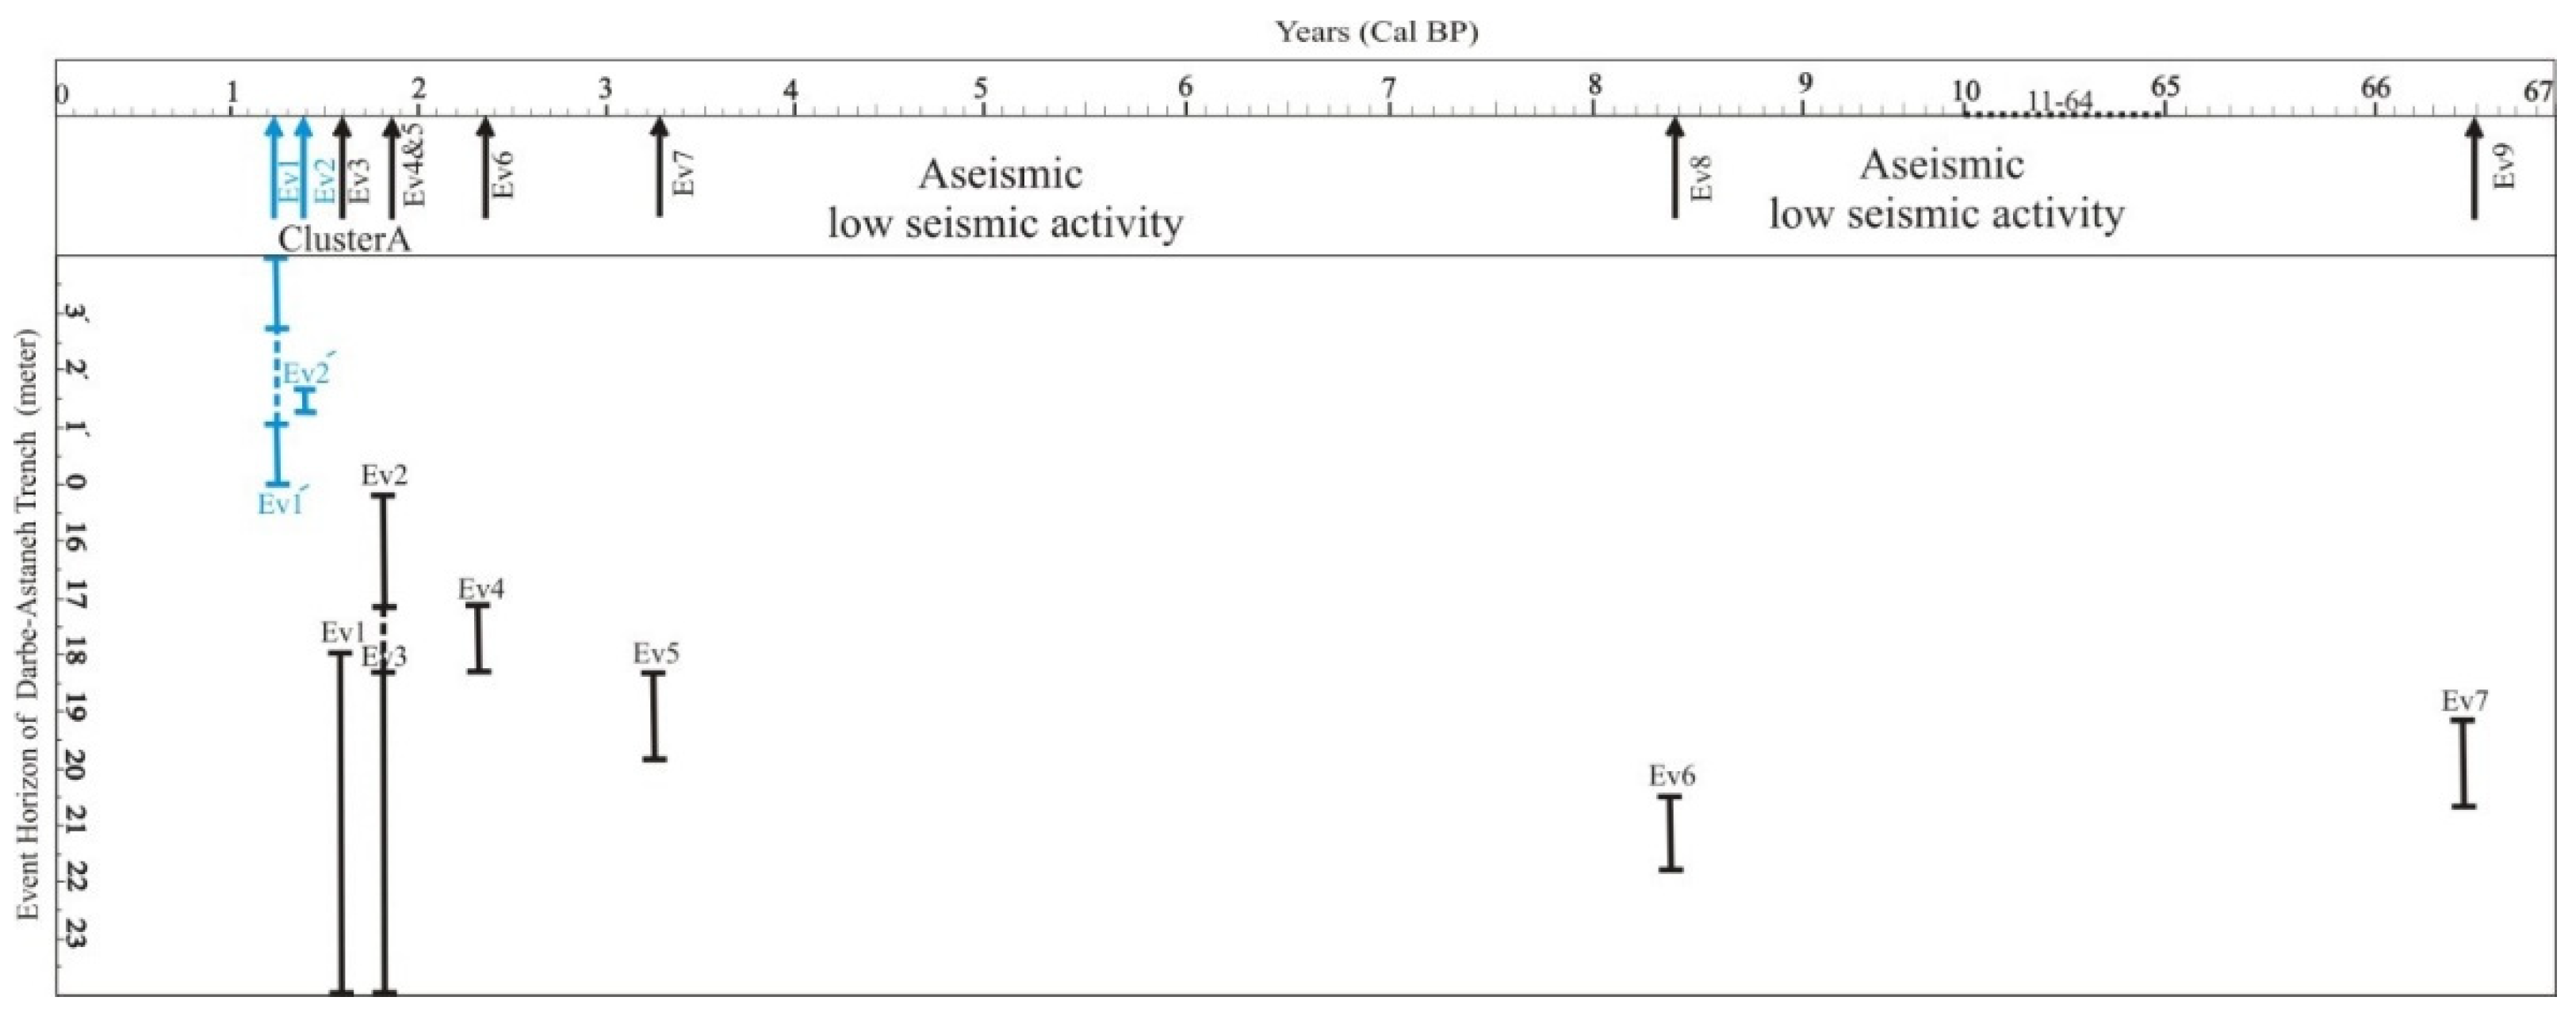
5. Palaeoseismic Trenching along the Doroud Fault

Previous studies related to the analysis of the seismic activity of the Doroud Fault have been carried out to investigate the pre-shocks and aftershocks of the two major earthquakes in 1909 (Ms 7.4) and 2006 (Ms 6.1) using Coulomb stress and InSAR data [49]. Investigating the fault ruptures and seismic gaps in the northern part of the fault [32] indicates the fault has the ability to have a magnitude 7.1 earthquake. Therefore, the Doroud plain (or Silakhor plain) is considered to be highly active in the duration of tectonic activity, according to seismic catalog data [59,60,61]. To retrieve the chronology of surface-rupturing paleoearthquakes, we conducted the first paleoseismological study along the Doroud Fault at a site called Darbe-Astaneh (Figure 4 and Figure 9). This site was selected based on geomorphological observations performed from a 3-D model obtained from the GPS (RTK) surveying and field surveys (Figure 9). The trench was excavated perpendicular to the general trend of the fault (Figure 9a,b), where our DEM map and topography profile show a fault scarp (Figure 9c–e).
The Darbe-Astaneh trench was excavated across the fault within the wet pond (Figure 9). The sag pond’s best depositional environments for preserving paleoearthquake evidence are relatively low-energy environments where sediments accumulate episodically in thin strata, separated by weathering profiles, organic soils, or peats. The stratigraphy in the sag pond is dominated by the continuous quiet-water deposition of finely laminated clayey silt with some interbeds of well-sorted sand. The depositional environment and the general absence of bioturbation because of the high groundwater conditions permit the cm-scale resolution of individual units [5]. The trench strikes N40° E and has a length of 30 m, a depth of 4.5–5 m, and a width of around 1.5 m. Once the trench was excavated, the walls were cleaned to remove trench smears and gouges created by the backhoe, and field photographs were shown at the same time as the excavation of the trench (Figure 9f,g). The excavation exposes a succession of fine-grained, well-bedded layers interbedded with a few gravelly units. The almost fine-grained deposits are primarily horizontal and composed of laminated silts, sands, and gravel. Based on the grain size and the location of trench excavation within the pond, 27 units are defined within the trench. Many potteries and other artifact fragments were found in the stratigraphic units after careful logging, including pieces of charcoal, which were collected for radiocarbon C14 analysis (Figure 10), and the place was determined with sediments containing quartz and feldspar for sampling and dating by the OSL method (collected from units 2 and top 19 and colluviums wedge C1) (Table 2). Several faults were highlighted in zones A and B of the trench (Figure 10 and Figure 11), between meters 1 to 4 and 18 to 22.
Paleoearthquakes are typically recognized in exposures of strike–slip faults from six general types of evidence: (1) upward termination of fault displacement, (2) abrupt changes in the vertical separation of strata as faults are traced upsection or downsection, (3) abrupt changes in the thickness of strata or of facies across a fault, (4) fissures and sand blows in the stratigraphic sequence, (5) angular unconformities produced by folding and tilting, and (6) colluvial wedges shed from small scarps [5]. To decipher the diverse paleoseismic events, we found evidence 1, 2, 3, and 6 to identify the events in the trench. In our paleoseismological investigation of the trench photomosaic and logs (Figure 11 and Figure 12), the main fault plane was easily identifiable because the sediments display distinctly different colors as the hanging wall appears, allowing us to propose at least nine paleo-earthquakes from the top to base of the trench in two fault zones (Figure 13 and Figure 14). They are named Ev1′ thought Ev9 from youngest to oldest, which can be identified as the event that occurred between about 1225 and 1275 years and 71 to 61 ka years, respectively (Table 3).
The parameters related to the activity of the fault on the surface and subsurface calculated applying empirical relationships (Equations (1)–(6)) for strike–slip faults are listed in Table 4.
Average displacement (m) [62]
M = 7.04 ± (0.05) + 0.89 ± (0.09) × log (AD)
Surface rupture length (km) [63]
Mw = a × log (L) + b, a = 1.67, b = 4.24
Rupture area (km2) [62,64]
M = 3.98 ± (0.07) + 1.02 ± (0.03) × log (RA)
Subsurface rupture length (km) [62]
M = 4.33 ± (0.06) + 1.49 ± (0.05) × log (RLD)
Subsurface rupture width (km) [62]
M = 3.8 ± (017) + 2.59 ± (0.18) × log (RW)
Maximum slip (m) [65]
Log (u) = 4.38 + 1.49 × log (Ls)
M: Magnitude, normally Mw or equivalent, Mw: Moment magnitude (Mw = 2/3 log M0 − 10.07), [66] L: Fault rupture length (km), a and b: Coefficients and standard error, RA: Rupture Area (km2), RLD: Subsurface rupture length (km), RW: Subsurface rupture width (km), u: Maximum slip, Ls: surface rupture length.
While our study focused on the transtenstive Doroud Fault in the Zagros region, we acknowledge that blind faulting may also play a role in the partitioning and accommodation of plate movement in the area. Blind faults are faults that do not reach the surface, and their existence and activity can be difficult to detect without direct geological or geophysical evidence. In some cases, blind faults can contribute significantly to the total slip rate and seismic hazard of a region.
In the Zagros region, blind faults have been identified and studied in some areas, and their potential impact on seismic hazard and tectonic deformation has been discussed in previous research. However, the exact extent and significance of blind faulting in our study area are not well-known, and further investigation would be necessary to fully understand its role in the tectonic evolution of the region.
While our study did not explicitly consider the impact of blind faulting, we acknowledge that it could be an interesting topic for further investigation, particularly in relation to the partitioning and accommodation of plate movement among different structures. We believe that this point should be discussed in our manuscript to provide a more comprehensive context for our study and to highlight the potential avenues for future research in the area.
The recognition of the most recent earthquake event (Ev1′) is based on three independent lines of evidence. First, we have the abrupt upward terminations of two fault strands (F1′ and F4′), capped by the most recent pond deposit, in Log fault zone A (latest event) (Figure 13a,b). These faults are younger than 25 ± 1250 Cal BP, the age obtained for sample DT1-C10 collected in Unit 2. However, note that the base of unit 2 is displaced 6 ± 180 cm along the faults (F1′ and F4′); it may be a cumulative clastic deposited by different events, hence the fault units 1-1′ and 1-2′ cutting and fault strands at the base of unit 1-2′. These two fault strands, one near 0′ meter and the other near 3′ meter, and the event horizon are at the base of unit 2. which is overlain by units 3 and 4 (Figure 15a,b). This event occurred after the deposition of units 1-2. Therefore, using the parameters of the fault plane (Table 3), the magnitude of the earthquake that caused this event (according to [51]) is obtained as Mw~7.4 (Table 4 and Table 5). In earthquake rupture, the average length of the surface rupture and the average subsurface length were 79.79 and 87.09 km, respectively; the average width of the subsurface rupture was 29.5 km, the average area of the rupture was 2137 km2, and the average slip was 0.74 m (according to [51]).
The recognition of a second paleoearthquake is located in Log fault zone A, a fissure fill localized at the base of units 1-2′, and shows the occurrence of an earthquake before the deposition of units 1-2′ (Figure 13c,d). This event is well-characterized by two faults F2′ and F3′, which are younger than 1360 ± 35 BP, which is the age obtained for sample DT1-C9 collected in unit 1-1′; therefore, this event postdates 1360 ± 35 BP and predates 3440 ± 25 Cal BP. The event horizon of this event is the base unit 1-2′ (Figure 15a,b); the earthquake magnitude of this event and other parameters related to the seismic activity of the fault is similar to the event Ev1′, which is given in Figure 10.
A third event, Log fault zone B, can be interpreted along the fault F2 ruptured unit 22. This event occurred after the deposition of unit 22, which affected the youngest-dating unit 22. Hence, it postdates 1560 ± 255 Cal BP. This fault is younger than 3976 ± 152 cal BP, the age obtained for sample number DT1-C4, collected from unit 22 (Figure 10). Therefore, the event horizon of this event is the base of units 22 and 21 (Figure 13e (post-event), f (pre-event) and Figure 15c,d). The calculated moment magnitude is Mw ~6.1 (Table 3).
The fourth event is identified with faults F4, F9, and F10, a tiny fracture in Log fault zone B. This event can be interpreted along fault F4 and the fissure filled with sedimentary deposits of unit 22 and the faults F10 and F9, the abrupt upward terminations of two fault strands sealed by the surface soil of this fissure with the maximum depth and width, which are 34 cm and 7.27 cm, respectively (Figure 13h). These faults and fractures are younger than 1720 ± 30 Cal BP, which is the age obtained for sample DT1-C7 collected in unit 16-a. The event horizon of this event is the base of the 16-a unit (Figure 15c,d). Moreover, this event indicates the occurrence of an earthquake after the time of the deposited unit 16-a (Figure 13g (post-event), h (pre-event)). The calculated moment magnitude is Mw ~6.1 (Table 3), and the average surface and average subsurface rupturing lengths were 12.88 and 14 km, respectively. The average subsurface rupture width was 7.9 km, the rupture area was 117 km2, and the average slip was 0.71 m (according to [51]) (Table 4).
The fifth event can be interpreted with the cutting units 4 and C1 and rupturing along F2 (Figure 14a (post-event), b (pre-event)) in Log fault zone B. The event horizon of this event is the base of unit 22. This event occurred after the deposition of unit C1. Hence, it postdates 2385 ± 35 Cal BP, the age obtained for sample DT1-C6 collected in unit C1, and predates 1720 ± 30 Cal BP, which is the age obtained for sample DT1-C7 collected in unit 16-a (Figure 10) (Figure 15c,d). Its calculated moment magnitude is Mw~6.6 (Table 3). Moreover, the average surface and average subsurface rupture lengths were 19.49 and 22 km, respectively, the average subsurface rupture width and average rupture area were 10.96 km and 234 km2, and the average slip was 0.72 m (according to [51,58,59] (Table 4).
The sixth event was identified with colluvial wedge unit C1 in Log fault zone B, which overlies and has eroded into the underlying units 1, 2, 3, and 4, as a colluvial wedge developed following a surface rupture in Event 6. Unit 4 is cut by fault F2. The colluvial wedge deposits resulting from the degradation of a fault scarp erosion which formed as a result of the normal component of the F2 fault (Figure 14c (post-event) and d (pre-event)); therefore, the deposits of wedge C1 are the result of the erosion and sedimentation of a mixture of units 4 and 16-a indicating the earthquake occurrence before the deposited unit C1 and after unit 4 (Figure 15c,d). We evaluated the maximum wedge thickness of 21.74 cm, which shows a vertical displacement of 19.43 cm at the top of unit 4 (Table 3). The event horizon of this event is the base of the C1 unit. This event occurred after the deposition of unit 4, which is a colluvial wedge sample DT1-C6, dated 2385 ± 35 Cal BP. Hence, it postdates 2385 ± 35 Cal BP (Figure 10). The seventh event is identified with faults F1, F2, F3, and F4 in Log fault zone B; the faults affect units younger than unit 4. These faults are younger than 3235 ± 25 Cal BP, which is the age obtained for sample DT1-C5 collected in unit 4 (Figure 14e (post-event) and f (pre-event)). This event occurred after the deposition of unit 4; hence, it postdates 3235 ± 25 Cal BP (Figure 10). Several distinct abruptly terminating upward fault strands, with the most demonstrative ones observed between 18 and 20 m, provide evidence for event Ev7 (Figure 16a,b). The faults F1, F2, F3, and F4 cut through unit 4 and abruptly terminate at the base of unit 16-a. Unit 4 is associated with average vertical displacements along the faults F1, F2, F3, and F4 with a range of 100 ± 4 cm (Table 3). The event horizon has therefore been set at the base of unit 4. The calculated moment magnitude is Mw ~7.2 (according to [51]) (Table 4 and Table 5), and other calculated seismic parameters are given in Table 4.
The eighth event is evidence of faults abruptly terminating upward and cutting units along the faults in Log fault zone B. This event was found only in the southwestern part of zone B and well-characterized by the abruptly terminating upward fault F11 at the base of units 3 and F10, cutting through the lower units 3, 2, and 1 (Figure 14g (post-event) and h (pre-event)). Unit 3 is associated with vertical displacements along the F10 that are about 60 ± 3 cm (at the base of unit 3) (Table 3). Therefore, the event horizon of the seven paleoearthquakes is set at the base of unit 3 (Figure 16c,d). This event occurred after the deposition of unit 3; hence, it was younger than 8375 ± 35 Cal BP, which is the age obtained for sample DT1-C20 collected in unit 3 (Figure 10). Using the fault plane parameters (Table 3) and the same equation linking them to the earthquake magnitude obtains Mw ~7, according to [51] (Table 4), and other calculated seismic parameters are given in Table 4.
The ninth event is indicated by unit 2 being offset by faulting in Log fault zone B. This event can be interpreted as a fault termination, with the fault F5 cutting through unit 2 and faults F6, F7, and F8 abruptly terminating upward at the base of unit 2. This event is associated with vertical displacements in unit 2 along the F5, which was calculated to be an average of 50 ± 0.1 cm (at the bottom of unit 2) (Table 3) (Figure 14i (post-event) and Figure 14j (pre-event)). Therefore, the event horizon is set at the base of unit 2 (Figure 15c,d). This event occurred after the deposition of unit 2. Hence, it is younger than 66.62 ± 5 ka, which is the age obtained for sample Dt1 IRSL 2 collected in the middle of unit 2 (Table 2). Using the fault plane parameter Table 4 and Table 5 and the same equation linking them to the earthquake magnitude obtains Mw~6.8 (according to [51]) (Table 3).

6. Discussion

The geomorphologic features of the strike–slip fault system along the MRF zone and their effects on the outcrop patterns of lithological units, rivers, and gullies show the recent right-lateral strike–slip motion and activity of the MRF. Active tectonics of this fault have also caused large earthquakes. Considering recent activities along the DF, as described above, it is important to conduct an accurate evaluation of the slip rate and offset on this active fault; regarding the geological markers, rivers, and gullies, the maximum offset on the DF is about 775 m, which may be observed as a right-lateral motion displacement of the river in south Bagh-Lotfian in the southern segment of DF. However, there is clear morphotectonic evidence related to the late Pleistocene–Holocene activity of the Doroud Fault on satellite images. So far, many studies have been carried out to estimate the slip rate on the Main Recent Fault: Talebian and Jackson [30] and Walpersdorf et al. [67] suggested 10–17 and 4–6 mm/yr, respectively; Bachmanov et al. [68] 10 mm/yr; Copley and Jackson [69] and Vernant et al. [25] 2–5 and 3 mm/yr slip rate, respectively; Authemayou et al. [70] 3.5–12.5 mm/yr; Nankali [71], using GPS velocities, expanded a three-dimensional mechanical model containing pre-existing faults with frictional properties and suggested a long-term slip rate for the MRF (~2.3 mm/yr); and Alipoor et al. [59] estimated 1.6–3.2 mm/yr. Our work is the first slip rate study along the Doroud Fault. To determine the slip rate in the middle segment of the Doroud Fault, GPS RTK data were utilized (discussed in Section 4). We conclude that the average cumulative dextral offset, horizontal and vertical, on the Doroud Fault are about 10.5 m and 5.7 m, respectively, leading to a slip rate, horizontal and vertical, of about 2.28 ± 0.42 mm/yr and 1.29 ± 0.23 mm/yr, respectively.
Our work is the first paleoseismological study along the Doroud Fault. The Darbe- Astaneh trench site is located near the epicenter of the 1909 earthquake with the mapped rupture (Figure 4). This site was selected based on remote sensing and field observations for its relatively high sedimentary potential. It delivered well-expressed surface deformation and adequate deposits for age determinations. This paleoseismic investigation along the Doroud Fault demonstrates the occurrence of several large, infrequent, and irregular earthquakes. Indeed, in our trench, nine paleoearthquakes were identified; the fault hosted at least eight large (Mw ~5.5) earthquakes within the last 8375 ± 35 Cal BP, and one older earthquake probably before some 66.62 ± 5 ka, and the youngest occurred at 1250 ± 25 Cal BP. Indeed, the fault hosted four earthquakes of more than Mw ~7 and four of more than Mw ~6 within the last 66.62 ± 5 ka. The occurrence of seven seismic events within a short time interval may indicate that the seismic behavior of the Doroud Fault can be characterized by the clustering of earthquakes. Figure 17 is a time diagram that summarizes the observations from our trenching studies. The occurrences of seven large earthquakes during the last ~3.3 ka, with a magnitude of more than an Mw which can be attributed to ~6, suggest that the Doroud Fault could be characterized by a clustering of events (A). The two oldest events of the nine events identified occurred at 8350 ± 35 to 66.62 ± 5 ka, respectively, in the absence of macroseismic activity in the time interval between 3260 Cal BP to 8350 Cal BP, and in the time interval between 8350 Cal BP and 66 ka, two seismic gaps are observed, which can be attributed to a high rate of erosion, sedimentation, or unconformity. In paleoseismology, the non-preservation of sedimentary records is a recognized issue that can affect the identification of seismic events. Seismic gaps identified in our study may be due to the non-preservation of sedimentary layers that would have recorded the event rather than the absence of seismic activity. However, our results still demonstrate a bimodal behavior of seismic activity in the area, as illustrated in Figure 17, which shows a higher frequency of seismic events during the recent interval and a lower frequency of events during the past interval.
To account for the potential impact of non-preservation on our results, we carefully examined the sedimentary records from the intervals we studied, and we found no evidence of seismic activity during those periods. While non-preservation may still bias our interpretation of the seismic gaps, our results remain significant as they demonstrate a clear difference in the frequency of seismic activity between the two intervals. We acknowledge the limitations of our study due to non-preservation and encourage future studies to account for this issue by carefully examining the sedimentary record and considering alternative methods of seismic event identification.
From the youngest paleoearthquake related to fault zone A with the age of 1250 ± 25 BP (calendar year BP) to the 1909 earthquake, which is about 700 ± 37 years old, according to paleoseismic results and historical earthquakes from the Berberian book [12], an earthquake with even Mw~5.5 has not been reported along the Doroud Fault, so in the 14th to 20th centuries, the Doroud Fault had no seismic activity, while other segments of the MRF had seen seismic activity. Therefore, seismic migration occurred from the southeast to the northwest. There is evidence of this migration of a cluster of events destroying Dinor in 913.08.07 and 1008.04.27: 34.61 N–47.50 E, Ms~7 and time: night/Sunday, and 1107.08.22, center: 34.60 N–47.50 N, leaving a twentieth-century seismic gap to the southeastern part of the Nahavand segment, which itself was ruptured during the 1316.01.05, center: 34.08 N–48.40 E and Ms~6.5 earthquake [62]. Then, during the twentieth century, the 1909.01.23, center: 33.38 N–49.28 E, UTC: 02:48, with Mw~7.4 Silakhor earthquake along the Doroud segment of the Zagros Main Recent Fault was followed by the 2006.03.31, Mw~6.1, UTC: 01:01cent: UTC: 33.58 N–48.79 E 23 January 1909 Mw 7.4 31 March 2006 Mw 6.1 Chalanchulan earthquake; the latter filled the gap left on the northwestern segment of the Doroud segment by the 1909 event. The two major events in 1909 and 2006 on the Doroud Fault in a time interval of approximately 100 years indicates the beginning of a new seismic cluster. According to the obtained results, the seismic behavior of the Doroud Fault is a cluster, and the recurrence interval of this behavior is about 700 ± 37 years obtained using historical and instrumental earthquakes (Figure 17). Using paleoseismic and seismic data can suggest an almost complete seismic catalog for events with a magnitude greater than 6 for the Doroud Fault (Figure 18 and Table 5). However, the geometrical, kinematical, and seismic behavior characteristics of the Doroud Fault show that this fault has the ability to create earthquakes with Mw~7.4 and surface ruptures.

7. Conclusions

Our analysis of the Doroud Fault in southwest Zagros has produced new insights into its activity; in general, the fault is a hidden strike–slip, which also provides the first estimate of the slip rate on the Doroud Fault and suggests that large earthquakes (6.6 ≥ Mw ≥ 7.4) have occurred along this fault in the past as a result of its activity. Minimum and maximum horizontal slip rates of 1.82 and 2.71 mm/yr and minimum and maximum vertical slip rates of 1.53 and 1.03 mm/yr for the past 4600 ± 900 BP are estimated. The fault’s relatively high slip rate indicates its significance in accommodating dextral displacement and crustal shortening. Trenching investigations along the Doroud Fault indicate approximately nine paleoearthquakes that may have occurred in the last 66.62 ± 5 ka years. We estimate that, from the results of paleoseismology, the average recurrence interval of earthquakes with a magnitude greater than 5.5 is ~104 ± 7 yr. Considering the earthquake that occurred in 2006, the next quake is expected to occur within the next ~90 years up to the first decades of the 22nd century AD. According to paleoseismology studies, the Doroud Fault has the seismic capability to cause earthquakes with a magnitude of more than 7.4 and a total slip rate of about 3.83 ± 0.1 m, and another earthquake magnitude and slip rate are listed in Table 3. An extensive surface rupture with an approximate length of 45 km has been predicted to result from large earthquakes on the Doroud Fault.

Author Contributions

Z.K.: formal analysis, methodology, fieldwork, investigation, and writing the first draft of the manuscript; H.N.: conceptualization and design of the study, supervision, review, and editing; A.R. and M.R.H.: resources; methodology, validation, visualization, writing, review, and editing; M.M.K. and R.D.: visualization, supervision, writing, review, and editing. All authors have read and agreed to the published version of the manuscript. All authors contributed to the research and preparation of the manuscript and approved the submitted version.

Funding

This research received no external funding.

Institutional Review Board Statement

Not applicable.

Informed Consent Statement

Not applicable.

Data Availability Statement

Not applicable.

Acknowledgments

This study was primarily supported by the Geological Survey of Iran (Lorestan Center) and the University of Birjand. The authors extend their gratitude to M. Fatahi (University of Tehran) for his assistance with OSL dating and to S. Esmaili and M.A. Shokri of the Geological Survey of Iran for their involvement in the fieldwork, productive discussions, and insightful comments.

Conflicts of Interest

The authors declare that the research was conducted in the absence of any commercial or financial relationships that could be construed as a potential conflict of interest.

References

  1. Nelson, C.; Gutiérrez Pastor, J.; Goldfinger, C.; Escutia, C. Great earthquakes along the Western United States continental margin: Implications for hazards, stratigraphy and turbidite lithology. Nat. Hazards Earth Syst. Sci. 2012, 12, 3191–3208. [Google Scholar] [CrossRef] [Green Version]
  2. Yeats, R.S.; Sieh, K.; Allen, C.R. The Geology of Earthquakes; Oxford University Press: Oxford, UK, 1997. [Google Scholar]
  3. Zhongyuan, Y.; Peizhen, Z.; Wei, M.; Qinghai, W.; Limei, W.; Bin, Z.; Shuang, L.; Jian, K. Late Cenozoic deformation of the Da’an-Dedu Fault Zone and its implications for the earthquake activities in the Songliao basin, NE China. J. Asian Earth Sci. 2015, 107, 83–95. [Google Scholar] [CrossRef]
  4. Yin, N.; Wang, C.; Deng, M.; Lan, W. Active tectonics, paleoseismology and seismic hazards of the piedmont Xizhoushan fault zone in the Shanxi graben system, North China Block. J. Asian Earth Sci. 2021, 205, 104590. [Google Scholar]
  5. Derakhshani, R.; Eslami, S. A new viewpoint for seismotectonic zoning. Am. J. Environ. Sci. 2011, 7, 212–218. [Google Scholar] [CrossRef]
  6. Rahbar, R.; Shafiei Bafti, S.; Derakhshani, R. Investigation of the tectonic activity of Bazargan Mountain in Iran. Sustain. Dev. Mt. Territ. 2017, 9, 380–386. [Google Scholar] [CrossRef]
  7. Kermani, A.F.; Derakhshani, R.; Bafti, S.S. Data on morphotectonic indices of Dashtekhak district, Iran. Data Brief 2017, 14, 782–788. [Google Scholar] [CrossRef]
  8. Wechsler, N.; Rockwell, T.K.; Klinger, Y.; Štěpančíková, P.; Kanari, M.; Marco, S.; Agnon, A. A paleoseismic record of earthquakes for the Dead Sea transform fault between the first and seventh centuries CE: Nonperiodic behavior of a plate boundary fault. Bull. Seismol. Soc. Am. 2014, 104, 1329–1347. [Google Scholar] [CrossRef] [Green Version]
  9. Meghraoui, M.; Aksoy, M.E.; Akyüz, H.S.; Ferry, M.; Dikbaş, A.; Altunel, E. Paleoseismology of the North Anatolian Fault at Güzelköy (Ganos segment, Turkey): Size and recurrence time of earthquake ruptures west of the Sea of Marmara. Geochem. Geophys. Geosyst. 2012, 13, 1–26. [Google Scholar] [CrossRef] [Green Version]
  10. Burbank, D.W.; Anderson, R.S. Tectonic Geomorphology; John Wiley & Sons: Hoboken, NJ, USA, 2011; 454p. [Google Scholar]
  11. McCalpin, J.P.; Nelson, A.R. Introduction to paleoseismology. Int. Geophys. 2009, 95, 1–27. [Google Scholar] [CrossRef]
  12. Stein, S.; Wysession, M. An Introduction to Seismology, Earthquakes, and Earth Structure; John Wiley & Sons: Hoboken, NJ, USA, 2009. [Google Scholar]
  13. Zielke, O.; Arrowsmith, J.R.; Ludwig, L.G.; Akçiz, S.O. Slip in the 1857 and earlier large earthquakes along the Carrizo Plain, San Andreas fault. Science 2010, 327, 1119–1122. [Google Scholar] [CrossRef] [Green Version]
  14. Berberian, M. Contribution to the seismotectonics of Iran. Geol. Surv. Iran 1976, 39, 518. [Google Scholar]
  15. Berberian, M. Active faulting and tectonics of Iran. Zagros Hindu Kush Himalaya Geodyn. Evol. 1981, 3, 33–69. [Google Scholar] [CrossRef]
  16. Berberian, M. Master blind thrust faults hidden under the Zagros folds: Active basement tectonics and surface morphotectonics. Tectonophysics 1995, 241, 193–224. [Google Scholar] [CrossRef]
  17. Berberian, M. The 2003 Bam urban earthquake: A predictable seismotectonic pattern along the western margin of the rigid Lut block, southeast Iran. Earthq. Spectra 2005, 21, 35–99. [Google Scholar] [CrossRef]
  18. Berberian, M. Eaethquakes and coseismic active faulting on the Iranian plateau. Dev. Earth Surf. Process. 2014, 17, 616. [Google Scholar]
  19. Berberian, M.; Yeats, R. Tehran: An earthquake time bomb. In Tectonic Evolution, Collision, and Seismicity of Southwest Asia: In Honor of Manuel Berberian’s Forty-Five Years of Research Contributions, Rasoul Sorkhabi; Geological Society of America: Boulder, CO, USA, 2016; Volume 525, pp. 87–170. [Google Scholar] [CrossRef]
  20. Berberian, M.; Yeats, R.S. Contribution of archaeological data to studies of earthquake history in the Iranian Plateau. J. Struct. Geol. 2001, 23, 563–584. [Google Scholar] [CrossRef]
  21. Mehrabi, A.; Pirasteh, S.; Rashidi, A.; Pourkhosravani, M.; Derakhshani, R.; Liu, G.; Mao, W.; Xiang, W. Incorporating Persistent Scatterer Interferometry and Radon Anomaly to Understand the Anar Fault Mechanism and Observing New Evidence of Intensified Activity. Remote Sens. 2021, 13, 2072. [Google Scholar] [CrossRef]
  22. Rashidi, A.; Kianimehr, H.; Shafieibafti, S.; Mehrabi, A.; Derakhshani, R. Active faults in the west of the Lut block (Central Iran). Geophys. Res. 2021, 22, 70–84. [Google Scholar] [CrossRef]
  23. NOAA. National Geophysical Data Center/World Data Service (NGDC/WDS): NCEI/WDS Global Significant Earthquake Database; NOAA: Washington, DC, USA, 2020. [CrossRef]
  24. Raeesi, M.; Zarifi, Z.; Nilfouroushan, F.; Boroujeni, S.A.; Tiampo, K. Quantitative analysis of seismicity in Iran. Pure Appl. Geophys. 2017, 174, 793–833. [Google Scholar] [CrossRef]
  25. Vernant, P.; Nilforoushan, F.; Hatzfeld, D.; Abbassi, M.; Vigny, C.; Masson, F.; Nankali, H.; Martinod, J.; Ashtiani, A.; Bayer, R. Present-day crustal deformation and plate kinematics in the Middle East constrained by GPS measurements in Iran and northern Oman. Geophys. J. Int. 2004, 157, 381–398. [Google Scholar] [CrossRef] [Green Version]
  26. Ghanbarian, M.A.; Derakhshani, R. Systematic Variations in the Deformation Intensity in the Zagros Hinterland Fold-and-Thrust Belt, Iran. Z. Der Dtsch. Ges. FÜR Geowiss. 2022, 173, 193–210. [Google Scholar] [CrossRef]
  27. Chu, D.; Gordon, R.G. Current plate motions across the Red Sea. Geophys. J. Int. 1998, 135, 313–328. [Google Scholar] [CrossRef]
  28. DeMets, C.; Gordon, R.G.; Argus, D.F.; Stein, S. Effect of recent revisions to the geomagnetic reversal time scale on estimates of current plate motions. Geophys. Res. Lett. 1994, 21, 2191–2194. [Google Scholar] [CrossRef]
  29. Jackson, J. Partitioning of strike-slip and convergent motion between Eurasia and Arabia in eastern Turkey and the Caucasus. J. Geophys. Res. Solid Earth 1992, 97, 12471–12479. [Google Scholar] [CrossRef]
  30. Talebian, M.; Jackson, J. Offset on the Main Recent Fault of NW Iran and implications for the late Cenozoic tectonics of the Arabia–Eurasia collision zone. Geophys. J. Int. 2002, 150, 422–439. [Google Scholar] [CrossRef] [Green Version]
  31. Ghanbarian, M.A.; Yassaghi, A.; Derakhshani, R. Detecting a sinistral transpressional deformation belt in the Zagros. Geosciences 2021, 11, 226. [Google Scholar] [CrossRef]
  32. Tchalenko, J.; Braud, J. Seismicity and structure of the Zagros (Iran): The Main Recent Fault between 33 and 35 N. Philos. Trans. R. Soc. Lond. Ser. A Math. Phys. Sci. 1974, 277, 1–25. [Google Scholar] [CrossRef]
  33. Campbell, G.; Walker, R.; Abdrakhmatov, K.; Schwenninger, J.; Jackson, J.; Elliott, J.; Copley, A. The Dzhungarian fault: Late Quaternary tectonics and slip rate of a major right-lateral strike-slip fault in the northern Tien Shan region. J. Geophys. Res. Solid Earth 2013, 118, 5681–5698. [Google Scholar] [CrossRef] [Green Version]
  34. Chevalier, M.-L.; Tapponnier, P.; Van der Woerd, J.; Ryerson, F.J.; Finkel, R.C.; Li, H. Spatially constant slip rate along the southern segment of the Karakorum fault since 200 ka. Tectonophysics 2012, 530, 152–179. [Google Scholar] [CrossRef]
  35. Ferry, M.; Meghraoui, M.; Abou Karaki, N.; Al-Taj, M.; Amoush, H.; Al-Dhaisat, S.; Barjous, M. A 48-kyr-long slip rate history for the Jordan Valley segment of the Dead Sea Fault. Earth Planet. Sci. Lett. 2007, 260, 394–406. [Google Scholar] [CrossRef]
  36. Fu, B.; Awata, Y.; Du, J.; He, W. Late Quaternary systematic stream offsets caused by repeated large seismic events along the Kunlun fault, northern Tibet. Geomorphology 2005, 71, 278–292. [Google Scholar] [CrossRef]
  37. Salisbury, J.; Rockwell, T.; Middleton, T.; Hudnut, K.W. LiDAR and field observations of slip distribution for the most recent surface ruptures along the central San Jacinto fault. Bull. Seismol. Soc. Am. 2012, 102, 598–619. [Google Scholar] [CrossRef]
  38. Rashidi, A.; Abbassi, M.-R.; Nilfouroushan, F.; Shafiei, S.; Derakhshani, R.; Nemati, M. Morphotectonic and earthquake data analysis of interactional faults in Sabzevaran Area, SE Iran. J. Struct. Geol. 2020, 139, 104147. [Google Scholar] [CrossRef]
  39. Wesnousky, S.G.; Prentice, C.S.; Sieh, K.E. An offset Holocene stream channel and the rate of slip along the northern reach of the San Jacinto fault zone, San Bernardino Valley, California. Geol. Soc. Am. Bull. 1991, 103, 700–709. [Google Scholar] [CrossRef]
  40. Hall, N.T.; Wright, R.H.; Clahan, K.B. Paleoseismic studies of the San Francisco Peninsula segment of the San Andreas fault zone near Woodside, California. J. Geophys. Res. Solid Earth 1999, 104, 23215–23236. [Google Scholar] [CrossRef]
  41. Lindvall, S.C.; Rockwell, T.K. Holocene activity of the Rose Canyon fault zone in San Diego, California. J. Geophys. Res. Solid Earth 1995, 100, 24121–24132. [Google Scholar] [CrossRef]
  42. Liu-Zeng, J.; Klinger, Y.; Sieh, K.; Rubin, C.; Seitz, G. Serial ruptures of the San Andreas fault, Carrizo Plain, California, revealed by three-dimensional excavations. J. Geophys. Res. Solid Earth 2006, 111, 1–33. [Google Scholar] [CrossRef] [Green Version]
  43. Marco, S.; Rockwell, T.K.; Heimann, A.; Frieslander, U.; Agnon, A. Late Holocene activity of the Dead Sea Transform revealed in 3D palaeoseismic trenches on the Jordan Gorge segment. Earth Planet. Sci. Lett. 2005, 234, 189–205. [Google Scholar] [CrossRef]
  44. Rittase, W.M.; Kirby, E.; McDonald, E.; Walker, J.D.; Gosse, J.; Spencer, J.Q.; Herrs, A. Temporal variations in Holocene slip rate along the central Garlock fault, Pilot Knob Valley, California. Lithosphere 2014, 6, 48–58. [Google Scholar] [CrossRef] [Green Version]
  45. Stocklin, J. Structural History and Tectonics of Iran: A Review. AAPG Bull. 1968, 52, 1229–1258. [Google Scholar] [CrossRef]
  46. Ghanbarian, M.A.; Derakhshani, R. The folds and faults kinematic association in Zagros. Sci. Rep. 2022, 12, 8350. [Google Scholar] [CrossRef] [PubMed]
  47. Alavi, M. Tectonics of the Zagros Orogenic Belt of Iran: New data and interpretations. Tectonophysics 1994, 229, 211–238. [Google Scholar] [CrossRef]
  48. Ambraseys, N.; Melville, C. A History of Persian Earthquakes; Cambridge University Press: London, UK, 1982; p. 219. [Google Scholar]
  49. Peyret, M.; Rolandone, F.; Dominguez, S.; Djamour, Y.; Meyer, B. Source model for the Mw 6.1, 31 March 2006, Chalan-Chulan earthquake (Iran) from InSAR. Terra Nova 2008, 20, 126–133. [Google Scholar] [CrossRef]
  50. Ezati, M.; Gholami, E.; Mousavi, S.M.; Rashidi, A.; Derakhshani, R. Active Deformation Patterns in the Northern Birjand Mountains of the Sistan Suture Zone, Iran. Appl. Sci. 2022, 12, 6625. [Google Scholar] [CrossRef]
  51. Rashidi, A.; Derakhshani, R. Strain and Moment- Rates from GPS and Seismological Data in Northern Iran: Implications for an Evaluation of Stress Trajectories and Probabilistic Fault Rupture Hazard. Remote Sens. 2022, 14, 2219. [Google Scholar] [CrossRef]
  52. Rashidi, A.; Khatib, M.M.; Derakhshani, R. Structural Characteristics and Formation Mechanism of the Earth Fissures as a Geohazard in Birjand, Iran. Appl. Sci. 2022, 12, 4144. [Google Scholar] [CrossRef]
  53. Cowgill, E. Impact of riser reconstructions on estimation of secular variation in rates of strike–slip faulting: Revisiting the Cherchen River site along the Altyn Tagh Fault, NW China. Earth Planet. Sci. Lett. 2007, 254, 239–255. [Google Scholar] [CrossRef]
  54. Peltzer, G.; Tapponnier, P.; Gaudemer, Y.; Meyer, B.; Guo, S.; Yin, K.; Chen, Z.; Dai, H. Offsets of late Quaternary morphology, rate of slip, and recurrence of large earthquakes on the Chang Ma fault (Gansu, China). J. Geophys. Res. Solid Earth 1988, 93, 7793–7812. [Google Scholar] [CrossRef]
  55. Sieh, K.E.; Jahns, R.H. Holocene activity of the San Andreas fault at Wallace creek, California. Geol. Soc. Am. Bull. 1984, 95, 883–896. [Google Scholar] [CrossRef]
  56. Weldon, R.J.; Sieh, K.E. Holocene rate of slip and tentative recurrence interval for large earthquakes on the San Andreas fault, Cajon Pass, southern California. Geol. Soc. Am. Bull. 1985, 96, 793–812. [Google Scholar] [CrossRef]
  57. Nazari, H. Analyse de la Tectonique Récente et Active dans l’Alborz Central et la Région de Téhéran: «Approche Morphotectonique et Paléoseismologique». Ph.D. Thesis, Tectonique Université Montpellier, Montpellier, France, 2006; 305p. [Google Scholar]
  58. Fattahi, M.; Walker, R.T. Luminescence dating of the last earthquake of the Sabzevar thrust fault, NE Iran. Quat. Geochronol. 2007, 2, 284–289. [Google Scholar] [CrossRef]
  59. Alipoor, R.; Zaré, M.; Ghassemi, M.R. Inception of activity and slip rate on the Main Recent Fault of Zagros Mountains, Iran. Geomorphology 2012, 175, 86–97. [Google Scholar] [CrossRef]
  60. Ghods, A.; Rezapour, M.; Bergman, E.; Mortezanejad, G.; Talebian, M. Relocation of the 2006 M w 6.1 Silakhour, Iran, earthquake sequence: Details of fault segmentation on the main recent fault. Bull. Seismol. Soc. Am. 2012, 102, 398–416. [Google Scholar] [CrossRef]
  61. Sepahvand, M.; Yaminifard, F.; Tatar, M.; Abbassi, M. Aftershocks study of the 2006 Silakhur earthquake (Zagros, Iran): Seismological evidences for a pull-apart basin along the Main Recent Fault, Doroud segments. J. Seismol. 2012, 16, 233–251. [Google Scholar] [CrossRef]
  62. Wells, D.L.; Coppersmith, K.J. New empirical relationships among magnitude, rupture length, rupture width, rupture area, and surface displacement. Bull. Seismol. Soc. Am. 1994, 84, 974–1002. [Google Scholar] [CrossRef]
  63. Leonard, M. Earthquake fault scaling: Self-consistent relating of rupture length, width, average displacement, and moment release. Bull. Seismol. Soc. Am. 2010, 100, 1971–1988. [Google Scholar] [CrossRef]
  64. Madeira, J.; Brum da Silveira, A.; Hipólito, A.; Carmo, R. Chapter 3 active tectonics in the central and eastern Azores islands along the Eurasia–Nubia boundary: A review. Geol. Soc. Lond. Mem. 2015, 44, 15–32. [Google Scholar] [CrossRef]
  65. Kim, Y.-S.; Sanderson, D.J. The relationship between displacement and length of faults: A review. Earth-Sci. Rev. 2005, 68, 317–334. [Google Scholar] [CrossRef]
  66. Hanks, T.C.; Kanamori, H. A moment magnitude scale. J. Geophys. Res. Solid Earth 1979, 84, 2348–2350. [Google Scholar] [CrossRef]
  67. Walpersdorf, A.; Hatzfeld, D.; Nankali, H.; Tavakoli, F.; Nilforoushan, F.; Tatar, M.; Vernant, P.; Chéry, J.; Masson, F. Difference in the GPS deformation pattern of North and Central Zagros (Iran). Geophys. J. Int. 2006, 167, 1077–1088. [Google Scholar] [CrossRef]
  68. Bachmanov, D.; Trifonov, V.; Hessami, K.T.; Kozhurin, A.; Ivanova, T.; Rogozhin, E.; Hademi, M.; Jamali, F. Active faults in the Zagros and central Iran. Tectonophysics 2004, 380, 221–241. [Google Scholar] [CrossRef]
  69. Copley, A.; Jackson, J. Active tectonics of the Turkish-Iranian plateau. Tectonics 2006, 25, 1–19. [Google Scholar] [CrossRef]
  70. Authemayou, C.; Bellier, O.; Chardon, D.; Benedetti, L.; Malekzade, Z.; Claude, C.; Angeletti, B.; Shabanian, E.; Abbassi, M.R. Quaternary slip-rates of the Kazerun and the Main Recent Faults: Active strike-slip partitioning in the Zagros fold-and-thrust belt. Geophys. J. Int. 2009, 178, 524–540. [Google Scholar] [CrossRef] [Green Version]
  71. Nankali, H. Slip rate of the Kazerun fault and Main Recent fault (Zagros, Iran) from 3D mechanical modeling. J. Asian Earth Sci. 2011, 41, 89–98. [Google Scholar] [CrossRef]
  72. Shirokova, E. Stresses effective in earthquake foci in the Caucasus and adjacent districts. Izv. Akad. Nauk. USSR Ser. Geophiz 1962, 10, 809–815. [Google Scholar]
  73. Ni, J.; Barazangi, M. Seismotectonics of the Zagros continental collision zone and a comparison with the Himalayas. J. Geophys. Res. Solid Earth 1986, 91, 8205–8218. [Google Scholar] [CrossRef]
Figure 1. Map of the main active faults of Iran [14,15,16,17,18,19,20,24]: (a) The position of major Iran’s structural zones among the Arabian and Eurasian plates. AZ = Azerbaijan; KP = Kopeh Dagh; TP = Turan plate; S = Sistan suture zone; M = Makran; arrows are GPS vectors. (b) Distribution of active faults throughout Iran. Zagros Main Recent Fault and Zagros Reverse Fault separate the Zagros mountain range from central Iran. The blue frame shows the location of the study area. Doroud Fault, as one of the main segments of the Main Recent Fault, is located in the study area. KB = Karehbas Fault; S = Sarvestan Fault; SP = SabzPushan Fault.
Applsci 13 03747 g001
Figure 2. The sources of earthquakes catalogue and geological map: (a) seismotectonic map of northeastern Lorestan; (b) northeastern Lorestan geology map overlaid on a shaded relief map of the 10 m digital elevation model with active fault traces resulting from the Landsat images and field observations.
Applsci 13 03747 g002
Figure 3. Seismicity and structure of the Zagros Main Recent Fault (MRF). The most recent and active structure (MRF) with its main segments is shown on the map. Five main segments of the MRF are DF, Doroud Fault; NF, Nahavand Fault; GF, Garun Fault; SF, Sahneh Fault; and MF, Morvarid Fault. Epicenters are for 1913–1972. Dates refer to instrumental epicenters and approximate regions of the greatest destruction of the biggest earthquake [32].
Applsci 13 03747 g003
Figure 4. The location of the excavated trench marked with a black circle along the Doroud Fault within the Quaternary deposits.
Applsci 13 03747 g004
Figure 5. Offset reconstruction and morpho-structural interpretation: (a) The 3D perspective diagram (vertical exaggeration = 2) of the SE area (see Figure 2 for the location). Digital elevation model extracted from Aster 15 m. In this area, the Doroud Fault trace located between Quaternary alluvial and Pliocene piedmont deposits. (b) The present-day situation with three drainages and fault. The red box indicates the location of the (c). (c) Google Earth image of the right-lateral horizontal offsets of three rivers. The blue and red arrows indicate the rivers and right-lateral fault mechanism, respectively. (d) Reconstruction of the rivers to their initial position after back-slip the fault on the SASPlanet image of ~775 m of the rivers (1 and 2) offsets along the fault trace.
Applsci 13 03747 g005
Figure 6. The Doroud Fault trace with offset reconstruction for drainages in the Quaternary sediments. The blue line and red arrows show rivers and fault traces, respectively. The red and blue arrows indicate fault trace and rivers, respectively. The dark box indicate the location of the (bd). (a) The topographic map of the central part of the area. Black lines delineate a topographic crest for calculating the ratio of vertical and horizontal displacement across the fault. (b) Field photograph of three offset rivers with fault trace within young alluvial. Offsets from left to right are 13 ± 2 m, 20 ± 3 m, and 23 ± 2 m, respectively. (c) SASPlanet image view of the reconstruction of the drainage to its initial position after back-slip (30 ± 2 m) along the fault trace. (d) Another field photograph of several offset drainage with fault traces.
Applsci 13 03747 g006
Figure 7. The detailed topographic and field photographs of the geomorphic features along the Doroud Fault: (a,b) Field photographs of the gullies S1, S2, and S3 (about them, read the text). The red triangles indicate fault trace. The yellow arrows indicate the location of the gullies. (c) Field photograph of the ideal gully offset along the Doroud Fault to determine fault slip rate and OSL sampling site (using GPS (RTK) surveying). The blue line indicates river. (d) The 3-D view of the digital elevation model (DEM) obtained from the GPS kinematics survey (red arrows are the fault trace, and green and yellow lines are shifted crest lines within the hanging wall and the footwall, respectively). (e) The diagram for the calculation of the slip rate of the Doroud Fault. Vertical profiles along the offset crests’ axes, with estimates of the cumulated vertical component, are shown on the diagram. The minimum value corresponds to the difference in height between the highest points in the violet footwall profiles and the lowest points in the orange hanging wall profiles. The maximum value corresponds to the vertical separations between the projections of the footwall and hanging wall profiles on the fault (consider a fault plane with a dip of 72°). Diagram defining the parameters for the calculation of the rake (R) of the slop. In order to calculate (c): H = horizontal component; V = vertical component; Vf = vertical component projected along the fault; α = dip of the fault plane (Cos c^ = d/v, c^ + p^ + b^ + 90° = 180°, b^ = 90° − c^ − p^, Vf = d/cos b^, R^ = arctgVf/H, h = cosp^xVf; α = arctg h/H). (f) Our RTK GPS systems provide digital elevation model (DEM), map, and fault slip rate.
Applsci 13 03747 g007
Figure 8. A schematic model of the measured horizontal and vertical offsets along the Doroud Fault.
Applsci 13 03747 g008
Figure 9. The location of the trench in the middle part of the Doroud Fault. Red triangles show the fault trace. The red triangles indicate fault trace. The red lines indicate the position of the cross-sections. (a) SASPlanet image of the fault trace and the excavated trench location for the paleoseismology studies. (b) Field photograph of the fault trace and the excavated trench location. (c) The 3-D model obtained of the GPS (RTK) surveying of the trench-digging area. (d) Topography map based on GPS measurements of the fault trace and excavated trench location (red line). (e) Note the component of apparent vertical movement (30.5 cm) ~4.5 m fault scarp obtained from the detailed topographical profiles. (f) Field photograph looking west along the fault, at the same time with excavation within the pond (red arrow), the fault trace marked by well-developed vegetation.
Applsci 13 03747 g009
Figure 10. Radiocarbon dates were calibrated by OxCal 4.3.2 calibration program (Bronk Ramsey 2017) using atmospheric IntCal13 calibration curve (Reimer et al. 2013) (DT1: trench one, C: sample carbon).
Applsci 13 03747 g010aApplsci 13 03747 g010b
Figure 11. (a) Photomosaic and (b) interpretative log of the western wall of (zones A and B) the re-occupied archeological trench in Darbe-Astaneh prehistoric site. Event horizons are shown by a colored dashed line in Logs. Colors allow following the correspondence of the different stratigraphic units between the 2 zones. Description of Zone A: U1-1′: Cream to light brown, 30% clast (2 mm to 2 cm), sub-rounded, sub-angular, clay and silt matrix, loose to medium compact, rootlet structures, non-stratify. U2-2′: Light brown, 40% clast (1 mm to 5 cm), rarely 10 cm, some part medium compact, subrounded, subangular, silt and clay matrix, organic material, non-stratified, non-rootlet structures. U3-3′: Brown, matrix-supported, non-laminated, 12% clast (2 mm to 10 cm), wet sediment, include spring in the bottom, include marl and clay lens, organic material, sub-rounded, rootlet structures, clay matrix. Units in Zone B: U1: This unit corresponds to an undifferentiated Neogene formation including yellow to green marl deposit, matrix-supported, about 30% clast (2 mm to 3 cm and rarely up to 7 cm); sub-angular to sub-rounded; poorly sorted; oligomictice; massive and medium compact; wet with root in some part. U2: Similar unit U1 includes light brown to brown deposit; matrix-supported; 30% clast (2 mm to 3 cm and rarely up to 23 cm); sub-angular to sub-rounded; poorly sorted; oligomictice; massive with cracks from losing water, compact matrix; clay and silt as a matrix with root structures. U3: Dark brown deposit; matrix-supported; 15% clast (2 mm to 2 cm and rarely up to 10 cm); sub-rounded; poorly sorted; compact matrix; clay and silt as a matrix with root structures; polymictice; massive; include cracks from losing water; some in unit 1 include organic material (C14) in some part. U4: Red to dark brown deposit; matrix-supported; 5% clast (2 mm to 2 cm and rarely up to 10 cm); sub-rounded; poorly sorted; compact matrix; clay and silt as a matrix with root structures; polymictice; massive; include organic material (C14) in some part. U5: Green to red deposit, 4% clast (2 mm to 3 cm and rarely up to 7 cm); similar to unit 4; include cracks from lost water; clay and silt matrix, sub-rounded; poorly sorted; compact; clay and silt as a matrix with root structures; polymictic; massive; some part include organic material (C14) in some part. U6: Green to light brown deposit; collapse caused to fault spring at the base unit; supported matrix; 2% clast (2 mm to 1 cm and rarely up to 4 cm to 12 cm on the top at the unit); medium compact; sub-angular; sub-rounded; poorly sorted. U7: Light brown deposit; massive; matrix-supported; 40% clast (2 mm to 3 cm and rarely up to 8 cm in some parts); sub-angular to sub-rounded; poorly sorted; some organic material; rootlet structure. U8: Cream to light brown deposit; massive; compact; matrix-supported; 40% clast (2 mm to 3 cm and rarely up to 40 cm); sub-angular to sub-rounded; poorly sorted; some organic material; rootlet structure; include gravel lines. U9: Gravely lines; green to brown deposit; massive; grain-supported; clast (2 mm to 4 cm); sub-rounded; sub-angular; medium compact; poorly sorted. U10: Light brown to green deposit; matrix-supported; clay and silt matrix; clast (2 mm to 1 cm and rarely up to 10 cm); organic material; rootlet structure; medium compact; sub-rounded. U11: Light brown deposit; grain support; medium compact; 60% clast (3 mm to 4 cm and rarely up to 10 cm); sub-rounded; sub-angular, organic material; rootlet structure; medium sort; clay and silt matrix; polymictice. U12: Light brown deposit; compact; 40% clast (2 mm to 3 cm); organic material; rootlet structure; sub-rounded; sub-angular. U13: Brown deposit; massive; 45% clast (2 mm to 3 cm); sub-rounded; sub-angular; clay and silt matrix; include organic material (C14); rootlet structure; oligomictice; poorly sorted. U14: Brown to green deposit; grain support; 70% clast (2 mm to 4 cm and rarely up to 18 cm); rootlet structure; medium compact; sub-rounded; sub-angular; organic material; erosion channel or slide. U15: Brown to green deposit; matrix-supported; massive; 15% to 20% clast (2 mm to 2 cm and rarely up to 8 cm); organic material; clay and silt matrix; sub-rounded; sub-angular; poorly sorted loose to medium compact at the end trench. U16: Brown to green deposit; grain support; 70% clast (2 mm to 4 cm and rarely up to 18 cm); oligomictice; rootlet structure; medium compact; sub-rounded; sub-angular; organic material; erosion channel or slide; erosion channel or slide or fluvial. U16-a: Gray to light brown deposit; grain-supported; 60% clast (2 mm to 5 cm); rootlet structure; sub-rounded; sub-angular; silt and clay matrix; loose to medium compact; poorly sorted. U17: Erosion channel or slide with a boulder to 40 cm; 60% clast (2 mm to 5 cm and rarely 8 cm to 40 cm); matrix-supported; silt and clay matrix; massive; loose to medium compact; sub-rounded. U18: Red to brown deposit; fluvial deposit? Or fan deposit; grain-supported; massive; 75% clast (1 cm to 6 cm); rootlet structure; sub-rounded; sub-angular; clay and silt matrix; medium compact; poorly sorted; organic material (include organic material (C14) in some part). U19: Red to brown deposit, and includes probable fluvial deposit or fan deposit; grain-supported; massive; 75% clast (1 cm to 6 cm); rootlet structure; sub-rounded; sub-angular; clay and silt matrix; medium compact; poorly sorted; organic material (include organic material (C14) in some part). U20: Gray to brown deposit, and composed of fan deposit; grain-supported; 80% clast (2 mm to 6 cm); rootlet structure; sub-rounded; sub-angular; silt and clay matrix; poorly sorted. U21: Lenses to color brown to gray deposit; 40% clast (2 mm to 3 cm); rootlet structure; sub-angular; silt and clay matrix; non-lamination; loose compacted; poorly sorted. U22: Light brown to brown deposit; and composed of fluvial channel deposits; non-clear stratified; grain-supported; grain-supported at the base; clast (2 mm to 6 cm); 40% clast at the base; sub-rounded; sub-angular; poorly sorted.
Applsci 13 03747 g011
Figure 12. Interpretive sketch and (a) a general orthophoto mosaic of the west and east walls, originally rendered at 1 mm resolution; (b) a detailed paleoseismic log of the wall of fault zone A and B.
Applsci 13 03747 g012
Figure 13. The back stripping scenario on the eastern wall of the trench (TC). The scenario confirms the seismic deformation of the events Ev1 to Ev4 by Doroud Fault activity. The red lines are faults. (a) Pre-event 1 and the after-deposit unit 2′. (b) Post-event 1 associated with cutting unit 2. (c) Pre-event 2. (d) Post-event 2 is associate with fissure-filled unit. (e) Pre-event 3. (f) Post-event 3 possibility associated with cutting unit 23. (g) Pre-event 4. (h) Post-event 4 associated with fissure-filled unit 23.
Applsci 13 03747 g013
Figure 14. The back-stripping scenario on the eastern wall of the trench (TC). The scenario confirms the seismic deformation of the events Ev5 to Ev9 by Doroud Fault activity. The red lines are faults. (a) Pre-event 5. (b) Post-event 5 with faulting and fault scarp formation. (c) Pre-event 6. (d) Post-event 6 cutting unit C1 (colluviums wedge). (e) Pre-event 7. (f) Post-event 6 associated with cutting unit 4. (g) Pre-event 8. (h) Post-event 8 associated with cutting unit 3. (i) Pre-event 9. (j) Post-event 9 associated with cutting unit 2. Read the text for details.
Applsci 13 03747 g014
Figure 15. Evidence for the Ev1 and Ev2 events from the fault zone A (a,b), and evidence for the Ev3, Ev4, Ev5, and Ev6 events from the fault zone B (c,d). (a,b) Close-ups showing photomosaic and interpretative sketch of the fault strands near meters 3′ and (1′-0′) offsetting units 1 and the fissure filled by unit 2, as well as the older event horizon (dashed lines gray and blue), which abruptly terminates upward at the base of the most recent undisturbed deposits (unit 2). (c,d) Close-ups showing photomosaic and interpretative sketch of the fault F2 probable cutoff unit 23, fissure-filled colluviums unit 22, cutting colluviums wedge by fault F2 and rupturing along F2, and scarp formation near meters 19–20, as well as the event horizons (dashed lines blue, light gray, and dark).
Applsci 13 03747 g015
Figure 16. The evidence for the Ev6 event (a,b) and the Ev8 and Ev9 events from the fault zone B (c,d). (a,b) Close-ups showing photomosaic and interpretative sketch of the fault F1 and F3 strands near meters 19 and offsetting units 4, as well as the event horizon (dashed line green), which abruptly terminates upward at the base of the most recent undisturbed deposits (units 16-a and 4). (c,d) Close-ups showing photomosaic and interpretative sketch faults F5, F6, F7, F8, F9, F10, and F11 strands near meters 20 and 21 and offsetting units 3 and 2, as well as the event horizons (dashed lines red and gray for base units 3 and 2) which abruptly terminate upward at the base of the most recent undisturbed deposits (units 3 and 2).
Applsci 13 03747 g016
Figure 17. Adaptation of the paleoearthquake evidence with each other, and clustering. Blue bracket of the events identified for fault zone A and the black bracket associated with fault zone B. The vertical axis indicates the location of the event horizon of each event along the trench, and the bracket indicates the temporal constraints on the timing of earthquakes based on trenching studies.
Applsci 13 03747 g017
Figure 18. (a) Meizoseismal areas of medium to large earthquakes along the Zagros Main Recent Fault. (b) Time–space diagram of the earthquakes along the Zagros Main Recent Fault. The 1957 and 1958 focal mechanisms are after [72]; the 1963 solution is after [73] with waveform modeling, which represents a centroid depth from 8 km; 1987 is the CMT solution from Harvard; the 2006 earthquake with a centroid depth of 6 km is from [49]. The early fault plane solutions were based on the in-print short-period polarities, and it is not probable to evaluate the consistency of these early solutions. The figure is modified after [19].
Applsci 13 03747 g018
Table 1. The mean of the displacements obtained in the gully area due to Doroud Fault activity. H(m) = cumulative horizontal displacement; Vmax (m) = cumulative displacement of the slope on the ground; Vf (m) = displacement of the slope collapse on the fault surface; R (Radian) = rake angle; NS (m) = cumulative displacement fault slip (net slip).
NumberH (m)Vmax (m)Vf (m)R (Radian)NS (m)
121.596.826.481722.58
213.9414.3413.484419.40
310.055.925.572911.49
Table 2. Values used to calculate luminescence ages (OSL).
Sample IDDe (Gy)±Total (Gy/ka)±Age (ka)
Dt1 Post IRSL river14.910422.743.230.084.61
Dt1 IRSL 2231.502516.553.480.0966.62
Table 3. Geometrical and seismic parameters of the Doroud Fault (obtained from TC studies).
U EventAge Cal BPEvent HorizonUnitsV (m)H (m)Ds (m)Ss (m)Net Slip (m)MW (AD) SSMW (MD) SSMW (AD) NMW (MD) NMW (AD) GL (Km)F (Km)A (Km2)M0g (dyne cm)MW
I’Before 1250–1360Base of Unit 223.83 ± 0.103.35 ± 0.11.76 ± 0.111.57 ± 0.13.83 ± 0.17.557.037.157.037.449157.35121.31277.4
II’Before 1360–3440Base of Unit 22Fissure size similar to Ev1′3.35 ± 0.11.76 ± 0.111.57 ± 0.13.83 ± 0.17.557.037.157.037.449157.35121.31277.4
IIIAfter 1560Base of Unit 22220.093 ± 0.10.140.08 ± 10.02 ± 0.10.19 ± 0.16.46.036.316.226.3349157.35121.81256.1
IV Before 1560–1720Base of Unit 2222Fissure size similar to Ev10.16 ± 0.10.08 ± 0.10.02 ± 0.10.19 ± 0.16.46.036.316.226.3349157.35121.81256.1
VBefore 1720–2385Base of Unit 16-a16-a0.194 ± 0.100.34 ± 0.10.18 ± 0.10.12 ± 0.10.4 ± 0.16.686.266.56.396.649157.35124.63256.6
VIBefore 2385–3235Base of C1C1-------????15???
VIIBefore 3235–8375Base of Unit 441.04 ± 0.101.87 ± 0.10.98 ± 0.13.61 ± 0.12.14 ± 0.17.336.846.996.857.249157.35121.31277.2
VIIIBefore8375–66620Base of Unit 330.63 ± 0.101.13 ± 0.10.59 ± 0.11.311.29 ± 0.17.136.686.856.717.0249157.35123.16267
IXBefore 66620Base of Unit 220.5 ± 0.100.9 ± 0.10.47 ± 0.10.84 ± 0.11.03 ± 0.17.056.66.786.596.9449157.35122.12266.9
The quantities derived from measurements on three trenches and their restored logs. V means vertical separation; Ds, dip slip = (V.Sin–1δ); Ss, strike slip; Sn, net slip = (Ds2 + Ss2)0.5; pitch or rake equals Arc Cos (Ss/Sn); L, rupture length; D, focal depth; A, rupture Area = L × F; Mw, energy magnitude or moment magnitude that equals 2/3 LogMog–10.7, where the seismic or geologic moment equals μ × A × Sn, and here is the shear or rigidity module = 3 × 10¹¹ (dyne/cm2). E.g.Mog = 3 × 10¹¹ (dyne/cm2) × (49 × 105 (cm) × 15 × 105 (cm) × 0.21× 10² (cm) = 4.63 × 1025 (dyne cm); Mw = 2/3Log4.63 × 1025–10.7 = 6.41.
Table 4. Parameter survey results for AD, SRL, RLD, RW, RA, and u using equations (Equations (1)–(6)).
EventMwAD (m) [59,60,61,62]SRL (km) RLD (km) RW (km) RA (km2) U (m)
I’, II’7.42.3570.79 ± 0.2195 ± 0.729.5 ± 0.352137 ± 100.74
III, IV6.10.08912.88 ± 0.2114 ± 0.77.9 ± 0.35117 ± 100.71
V, VI6.60.1919.49 ± 0.2122 ± 0.710.96 ± 0.35234 ± 100.72
VII7.21.6561.65 ± 0.2181 ± 0.725.7 ± 0.351479 ± 100.74
VIII70.8141.68 ± 0.2153 ± 0.719.05 ± 0.35870 ± 100.73
IX6.90.5433.88 ± 0.2141 ± 0.716.21 ± 0.35602 ± 100.73
Table 5. The seismic catalog of the Doroud Fault correlated by results of paleoseismology. Historical and instrumental data for earthquakes with magnitude more than MW > 5.5.
MwTimeNumber
6.12006.03.311
7.41909.01.232
7.4740 ± 37 AD3
7.4654 ± 9 AD4
6.1488 ± 42 AD5
6.6488 < EQ < 3158 AD6
-1497 ± 28 < EQ < 470 ± 53 BC7
7.27448 ± 57 BC < EQ < 1497 ± 28 BC8
7EQ > 7448 ± 57 BC9
?EQ > 16019 BC10
?20186 < EQ < 16019 BC11
6.8EQ > 66620 BC12
Disclaimer/Publisher’s Note: The statements, opinions and data contained in all publications are solely those of the individual author(s) and contributor(s) and not of MDPI and/or the editor(s). MDPI and/or the editor(s) disclaim responsibility for any injury to people or property resulting from any ideas, methods, instructions or products referred to in the content.

