1. Introduction
In the last decade, modern software systems have become an essential infrastructure indispensable to human life. Most of these software service systems are required to be able to provide 24/7 uninterrupted service. Any major failure, including system crashes, can cause serious economic loss and even threaten user safety, which shows that the reliability level of modern long-running systems is very important [
1].
However, as the complexity of software programs explodes with the increase in software functionality, software programs are also becoming increasingly difficult to test and validate. Traditional software engineering and software reliability engineering attempt to ensure the runtime dependability of software through validation and verification (V&V) activities [
2]. A study on software reliability issues, commissioned by the U.S. Department of Defense and conducted by the Software Engineering Institute at Carnegie Mellon University, revealed that there are nearly 20% of defects in software products remain undetected after integration testing is completed [
3].
Some residual defects may be difficult to detect during software verification and validation due to the complexity of their triggering and propagation conditions [
4]. These complex defects remain undetected until the software products go online and are triggered under specific conditions during operation, then leading to unexpected failures [
5]. This uncertainty poses a significant risk to the dependability of complex software systems and becomes a bottleneck that limits the level of software runtime reliability. In addition, the deployment and usage environment of modern software service systems require numerous configuration items, and their misconfiguration can also lead to unexpected failures of the software systems during their operation [
6].
To reduce the impact of residual defects on software runtime reliability, researchers propose data-driven-based software runtime anomaly detection methods for long-running software systems [
7]. These methods utilize previous runtime information to detect faults during software operation, enabling a series of subsequent measures to be taken to reduce the impact of faults detected by the anomaly detection methods.
Software anomaly detection refers to the process of finding partial failures that occur in software during operation. Partial failures denote the defects that are triggered and cause a partial loss of software functionality but have not yet caused a total loss of functionality [
8]. These partial failures lead to external failures along with a series of “side effects” that result in observable representations that can be used for fault detection and failure prediction [
9].
Existing methods can only detect performance issues since they mainly use external information for software anomaly detection. External information is most related to performance issues and cannot reveal functional anomalies proven to have strong relationships with internal execution trace information [
10].
There is rare research on utilizing multimodal software runtime data for runtime anomaly detection. To detect both functional failures and performance issues, we propose a contrastive learning-based multimodal software runtime anomaly detection (CL-MMAD) method using a combination of internal and external information, which uses contrastive learning to align data from different modalities, followed by representation learning to construct a unified feature space for anomaly detection, and then realizing the detection of anomalous behaviors during software operations.
The major contributions of this work are shown as follows:
Firstly, we made a combination of program internal and external information to achieve an anomaly detection task. Both functional failure and performance issues can be detected in the detection framework for multimodal data sources. The introduction of internal information can also boost the detection of performance issues.
A contrastive learning-based learning architecture is proposed in CL-MMAD. The detection task was realized under the pattern of self-supervised learning.
An empirical study was conducted in this work to evaluate the performance of CL-MMAD using runtime data collected from a widely used open-source database system named Cassandra, produced by Apache.org. The results demonstrate the efficacy of CL-MMAD in detecting both functional failures and performance issues. Specifically, CL-MMAD can achieve a 98% accuracy on the validation datasets constructed in this work and outperform two state-of-the-art models, which can only detect performance issues.
To facilitate and support further research in the fields of multimodal anomaly detection, we made the dataset constructed in this study publicly available (Multimodal Datasets of Cassandra Runtime Status are open at
https://data.mendeley.com/datasets/4jkf4npgw4/1 (accessed on 22 February 2023)), as with the implementation of CL-MMAD using PyTorch framework (Source code of CL-MMAD implemented using PyTorch framework can be downloaded at
https://gitee.com/theodorebj/cl-mmad (accessed on 22 February 2023)).
This work is organized as follows:
Section 2 introduces the related work in the literature, and
Section 3 introduces the fundamental assumptions of CL-MMAD and states the problem mathematically.
Section 4 theoretically describes the main methods of CL-MMAD.
Section 5 outlines the evaluation experiment configurations. In
Section 6, the evaluation results are discussed.
Section 7 makes the discussions of the empirical study. In
Section 8, we provide a summary of the entire work and indicate possible directions for the future.
2. Related Work
2.1. Indicators Used for Software Anomaly Detection
Runtime data utilized in existing software anomaly detection studies can be divided into two main categories:
First is the external performance information collected outside the program [
11]. These indicators can be obtained in a non-intrusive way and cause less impact on the software system under monitored [
12]. External performance indicators contain operating system metrics such as CPU usage, memory usage, and statistical metrics from I/O devices.
Second is the internal execution information collected inside the program. These indicators are collected via intrusive instrumentations and bring non-negligible performance overheads [
10].
It is obvious that external indicators are much more related to specific performance issues, such as resource exhaustion or network blockage. Functional logic failures such as becoming stuck in a dead loop, for example, tend not to result in significant changes in key performance indicators. Furthermore, this information is disorganized and not strongly correlated with failure, and has more noise [
13].
Excessive use of intrusive probes for gathering internal features can impede program responsiveness and limit its practical utility in a production environment [
14]. However, the inter-indicators have demonstrated stronger correlations with functional, logical errors [
15].
Moreover, external indicators are effective in predicting back-end performance problems, but it is a great challenge to detect faults in front-end programs that have no impact on back-end services, as the faults from third-party service provider services are invoked through APIs. Inspired by Zheng in [
16], we noticed that feedback information from the client side could also be used for anomaly detection.
2.2. Identification Models for Software Anomaly Detections
Identification models for information mining have evolved from statistical models to classical machine learning models to deep neural networks.
By using statistical methods based on historical data, a threshold is set according to previous experience and statistical results. Time series are used to forecast whether the peak values of the indicators exceed the threshold. Threshold-based models are commonly used in the present AIOps framework [
17].
Classical machine learning models are trained using historical data. Decision trees and support vector machines are typical algorithms of this type [
18]. Traditional machine learning methods have simpler architectures and can be more efficient in the training and inference phases. However, they require manually designed features.
Due to the explosion of runtime data, the advantages of deep learning models are becoming increasingly significant [
19]. For example, Qi [
20] used recurrent neural network (RNN)-based architecture, and Gao [
21] proposed an auto-encoder-based anomaly detection framework. Xia et al. reviewed generative adversarial network (GAN)-based anomaly detection-based methods in [
22]. OmniAnomaly is proposed for software anomaly detection using a reconstruction-based model based on VAE structures that adopt the stochastic variable connection and planar normalizing flow to reconstruct input data [
23]. DAEMON is an unsupervised anomaly detection framework composited by GAN networks and VAE networks [
24].
In recent research, contrastive learning has been proven to be a useful method for anomaly detection in many fields on multimodal data sources [
25].
We proposed CL-MMAD in this work to mine anomalous events in multimodalities using both internal and external runtime information, aiming to detect both functional failures and performance issues.
3. Preliminaries
In this section, we introduce the fundamental assumptions that underlie the CL-MMAD and provide a mathematical formulation of the associated problems. Additionally, we provide a concise introduction to the multimodal data utilized in this work.
3.1. Assumptions and Problem Formulation
The basic principle of the CL-MMAD model proposed in this work is attempting to maximize the likelihood probability of the normal samples in the training datasets inspired by prior work [
26]. The main objective of the CL-MMAD model is to learn an end-to-end scoring mechanism for detecting anomalies by directly pairing data segments from different modalities. In the subsequent sections, we provide a detailed explanation of the problem formulation in CL-MMAD.
Assumption 1: Anomalies and normal instances are, respectively, low- and high-probability events. Multimodal data of normal samples have stronger consistency across modalities compared to abnormal samples.
CL-MMAD learns an end-to-end scoring mechanism for anomaly detection by directly pairing the data segments from different modalities. Particularly, the problem is framed as:
where
is the probability of the event
with the parameters
to be learned. Event
denotes that data segments from different modalities of one sample are pairable. SoftMax function is used for easy optimization, as:
where
is a similarity measure used to validate if one multimodal sample is consistent across modalities and can also be used to capture the pairwise feature interactions during training phases:
where
denote different modalities, and
denote the weights added for the similarities between different modalities and are learnable parameters. The embedding
denotes the projection of the
th modal feature vector of the sample projected onto the representation space
. Since
is a normalization term, learning the likelihood function
is equivalent to directly optimizing the similarity
. The similarity
can be calculated using cosine similarity (commonly used in contrastive learning framework) or Euclidean distance (used in this work).
3.2. MultiModal Software Runtime Information Datasets
The datasets utilized in this work for multimodal software runtime anomaly detection were collected both inside and outside of the software program.
3.2.1. Internal Trace Information
We use software internal execution trace as the inside modality. Execution traces contain software method names and their durations. Since traces need to be collected using intrusive methods to eliminate the overheads, traces can be collected according to sampling strategies.
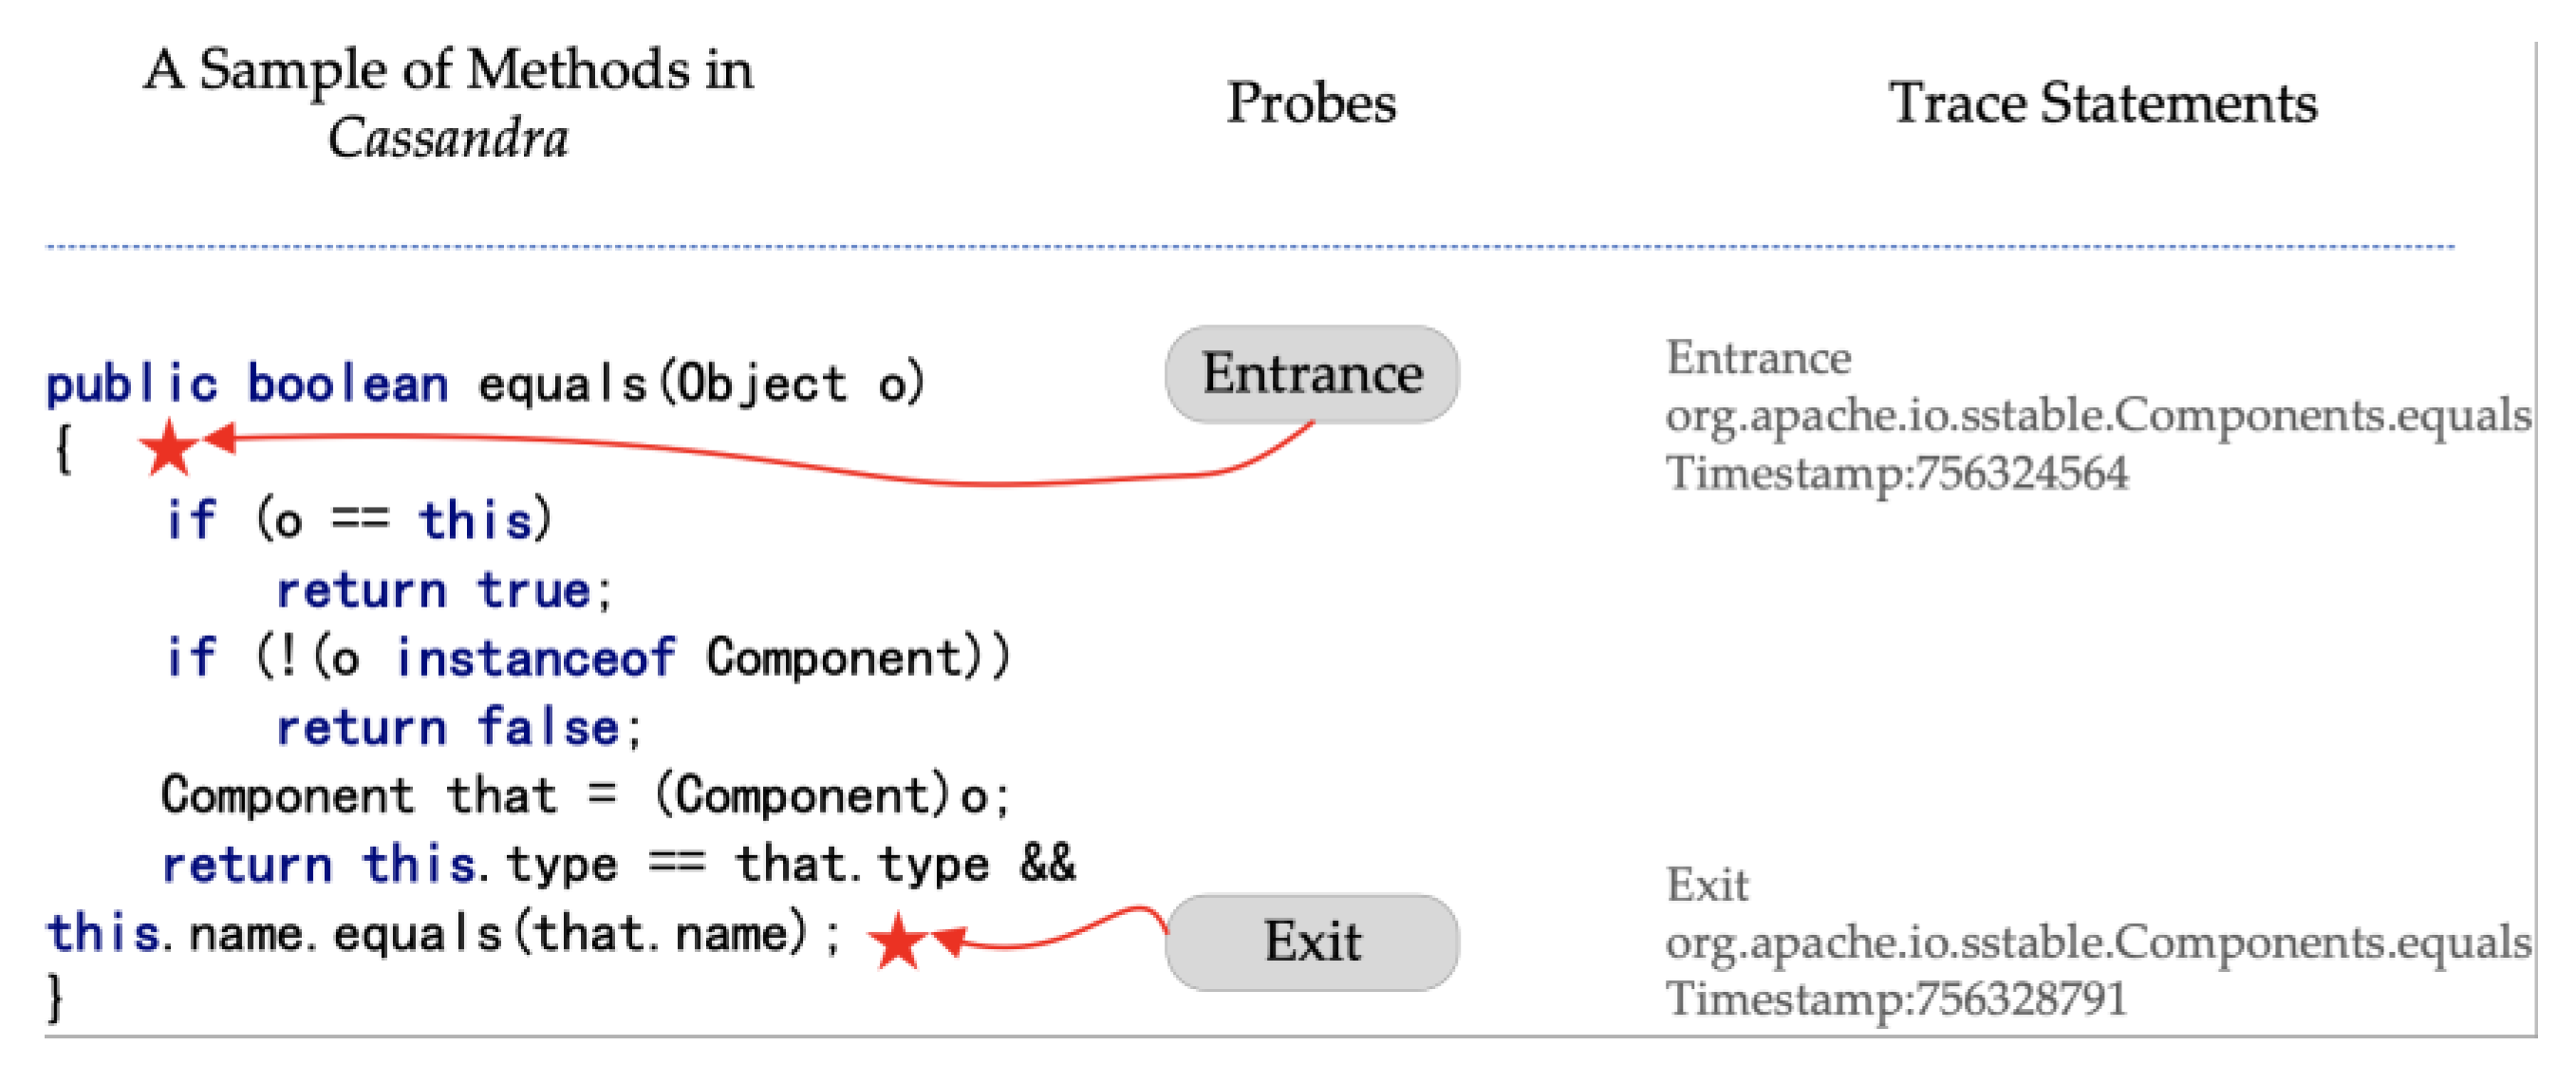
Figure 1 gives an example of how trace information can be collected. It is collected at the entrance and exit of a method during execution. Durations can be calculated according to the timestamps marked at the entrance and exit. Btrace tool (Btrace is available at:
https://github.com/btraceio/btrace (accessed on 22 February 2023)) is a safe, dynamic tracing tool for program tracing on the Java platform, which we used in the empirical study phases.
3.2.2. External Performance Information
External information used in CL-MMAD consists of indicators collected from the JVM environment, the operating system environment, and network devices.
Information from JVM environments: the information collected from JVM environments contains heap size and garbage-collection-related information such as frequency and thread counts.
Information from the operating system environment: operating system environment is also called system internal environment (SIE) [
4]. We use APIs provided by Linux systems to collect performance metrics from SIE, for example, usage information from CPU, memory, hard disk drive, etc.
Network device information: As the empirical study in this work focus on database systems, information gathering from network drives serves as a crucial performance evaluation indicator.
Considering the gradual evolution of software performance metrics and the non-intrusive nature of their collection, an appropriate collection frequency was established.
3.2.3. Feedbacks
Feedback from the client side is also important to help us under the service status. We paired the feedback with respective workload embeddings in this work. Feedback for the Cassandra database used in this work contains latency measures, throughput measures, operation processing speeds, and operation status.
3.2.4. Datasets Processing
Multimodal datasets are collected in different ways in different formats. We first transformed them into a unified structure for following learning models.
Data in the same columns (feature values in different time steps) are normalized using a normalized function such as:
There are some metrics in the form of percentages; in this situation, we leave them as they are.
Though the collection granularity may vary for different modalities, all modalities have a universal time dimension. Therefore, we partitioned data sequences from all modalities into segments within a periodic time with length . The data segments from each modality at the same time interval were considered pairwise.
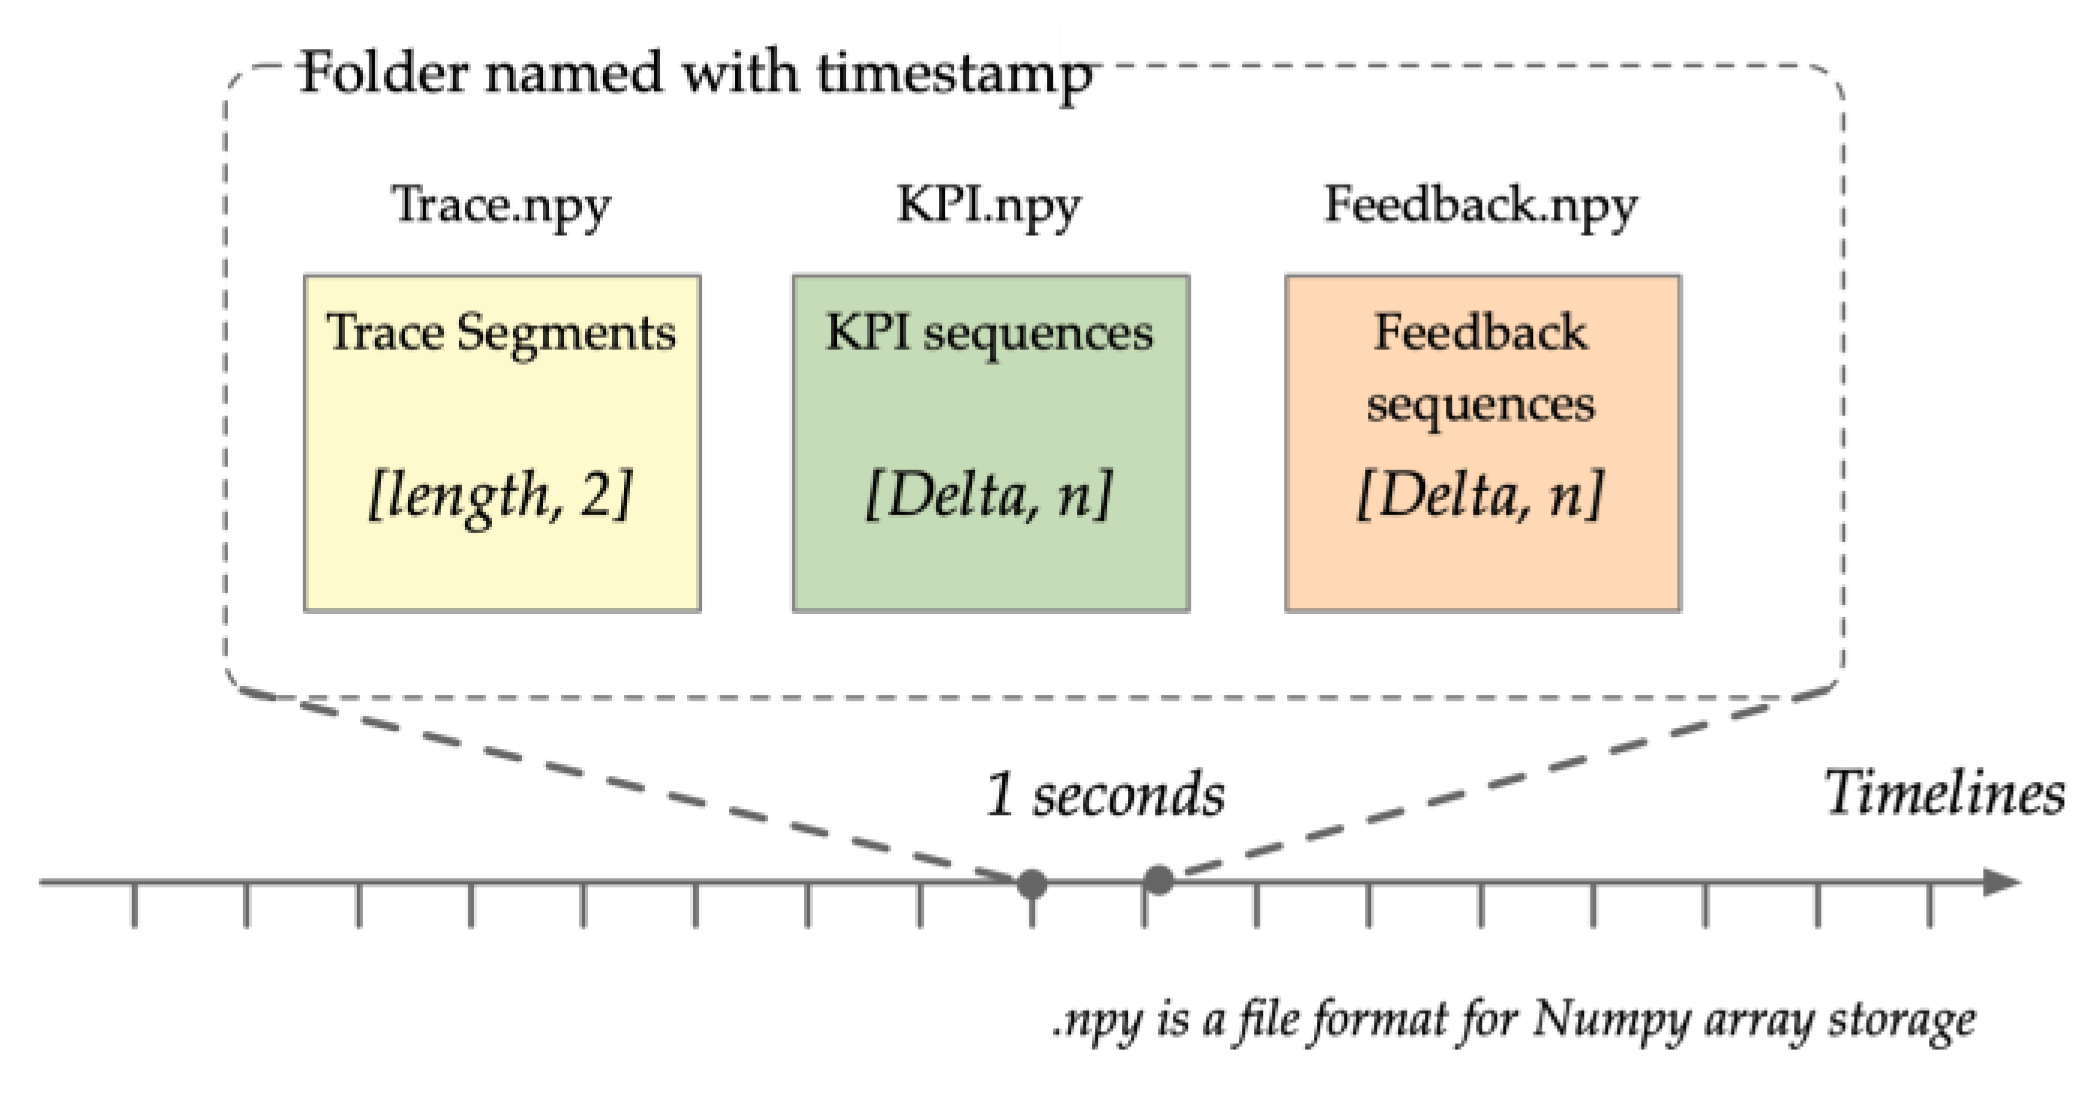
We saved the sliced data segments from the different modalities in the form of NumPy files in specific folders named according to the time interval . The multimodal data in one were taken as one sample, which is fed into the contrastive learning neural network architecture to be batch processed in GPU devices.
The structure of the datasets is as
Figure 2.
4. Methodology
In this section, we present the model framework of CL-MMAD that outlines the key components.
4.1. Overall Framework of CL-MMAD
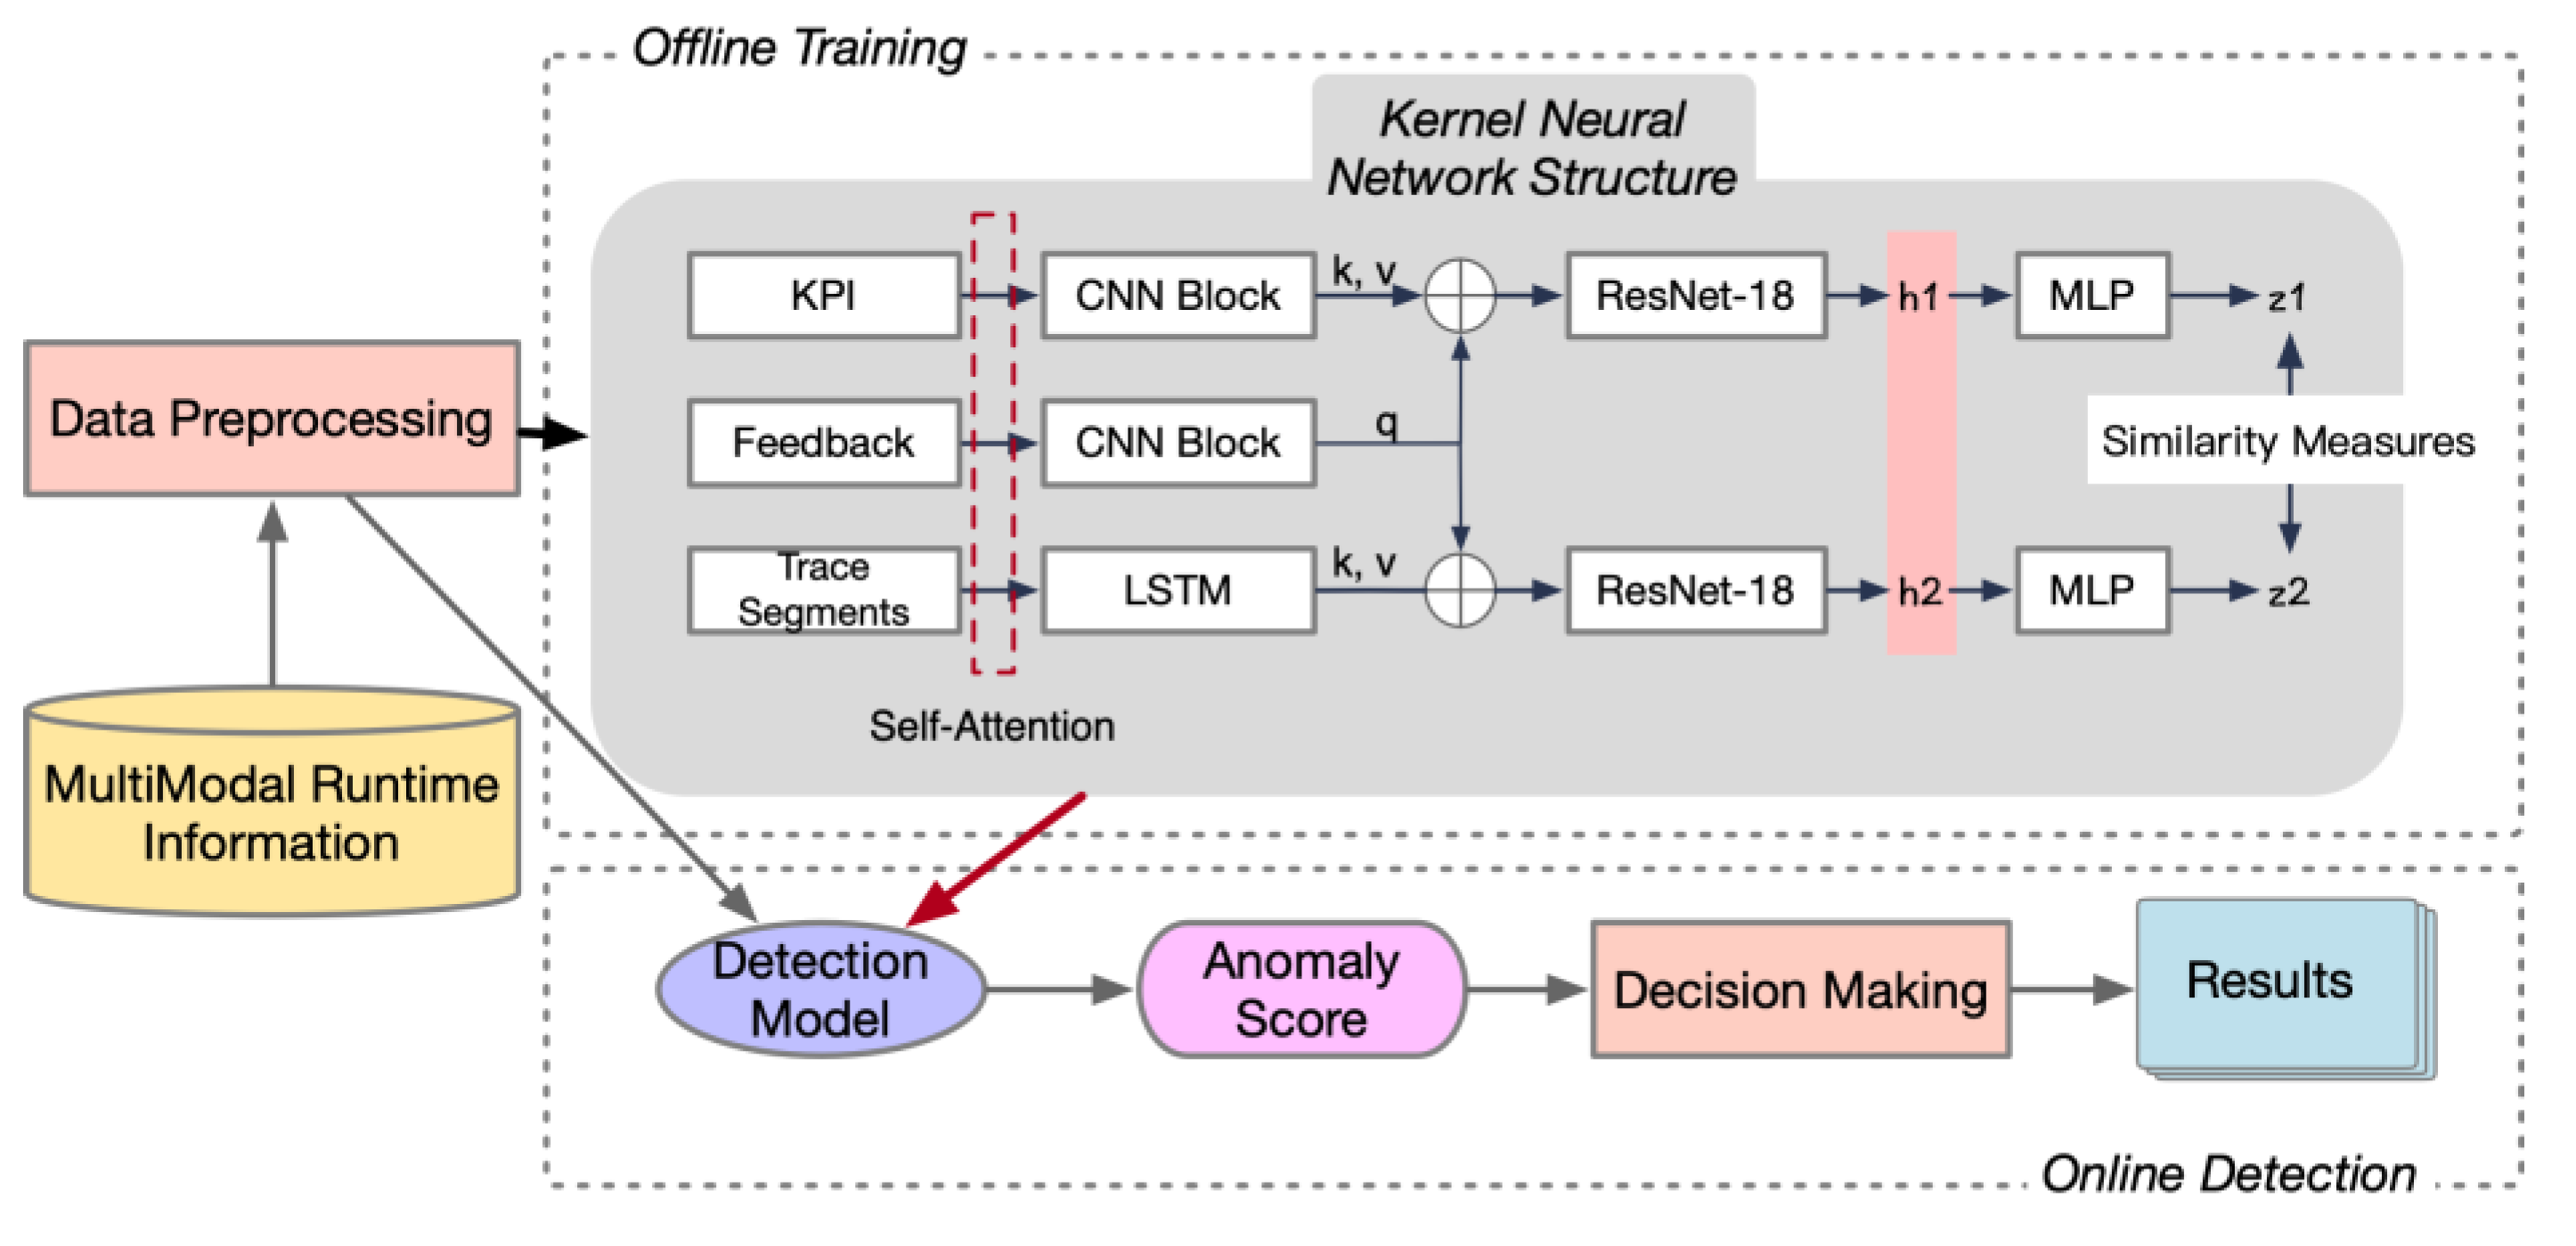
The overall framework of CL-MMAD is illustrated as
Figure 3.
First, multimodal runtime information is fed into the data preprocessing module to facilitate data transformation. After preprocessing, data segments are fed into the learning module in the form of batch files.
Separate modal data embedding: The process involves an initial step of embedding separate modal data, wherein data from different modalities are embedded using distinct architectures. In the case of trace sequences, which exhibit variable lengths over different Δ intervals, long short-term memory (LSTM) architecture is employed to process these sequences. Key performance indicators (KPIs) and feedbacks have the same length equal to , so we used a sequence of convolutional neural network (CNN) blocks for their embeddings, given the relatively faster processing speed of this architecture. Before being fed into the embedding architectures, all modal data sequences were transformed using self-attention architectures, which are designed to augment the model’s attention to local positions in the sequences.
Fusion using Cross-Attention: Feedback was integrated into trace embeddings and KPIs embeddings individually, using crossing attention mechanisms.
ResNet-18 for hidden space construction: The ResNet-18 architecture [
27], known for its efficacy in latent space learning, was employed for hidden space construction. Residual connections in ResNet-18 can boost the learning process and avoid the disappearance of gradients. Within the context of CL-MMAD, two distinct ResNet-18 networks were utilized for KPI and trace embeddings, respectively.
MLP layers for nonlinear projection: Finally, we used simple multilayer perceptron (MLP) blocks consisting of several full connection layers and rectified linear unit (ReLU) activation functions for the nonlinear projection of two vectors into the same feature space . A similar measurement was used as the objective to guide the training process and taken as the anomaly score.
Online detection phases: When CL-MMAD was used for online training, we fed samples into the model, whereby the anomaly scores were generated as the outputs. A threshold was set for anomaly detection tasks.
4.2. Details on Neural Components in CL-MMAD
4.2.1. Input Embeddings
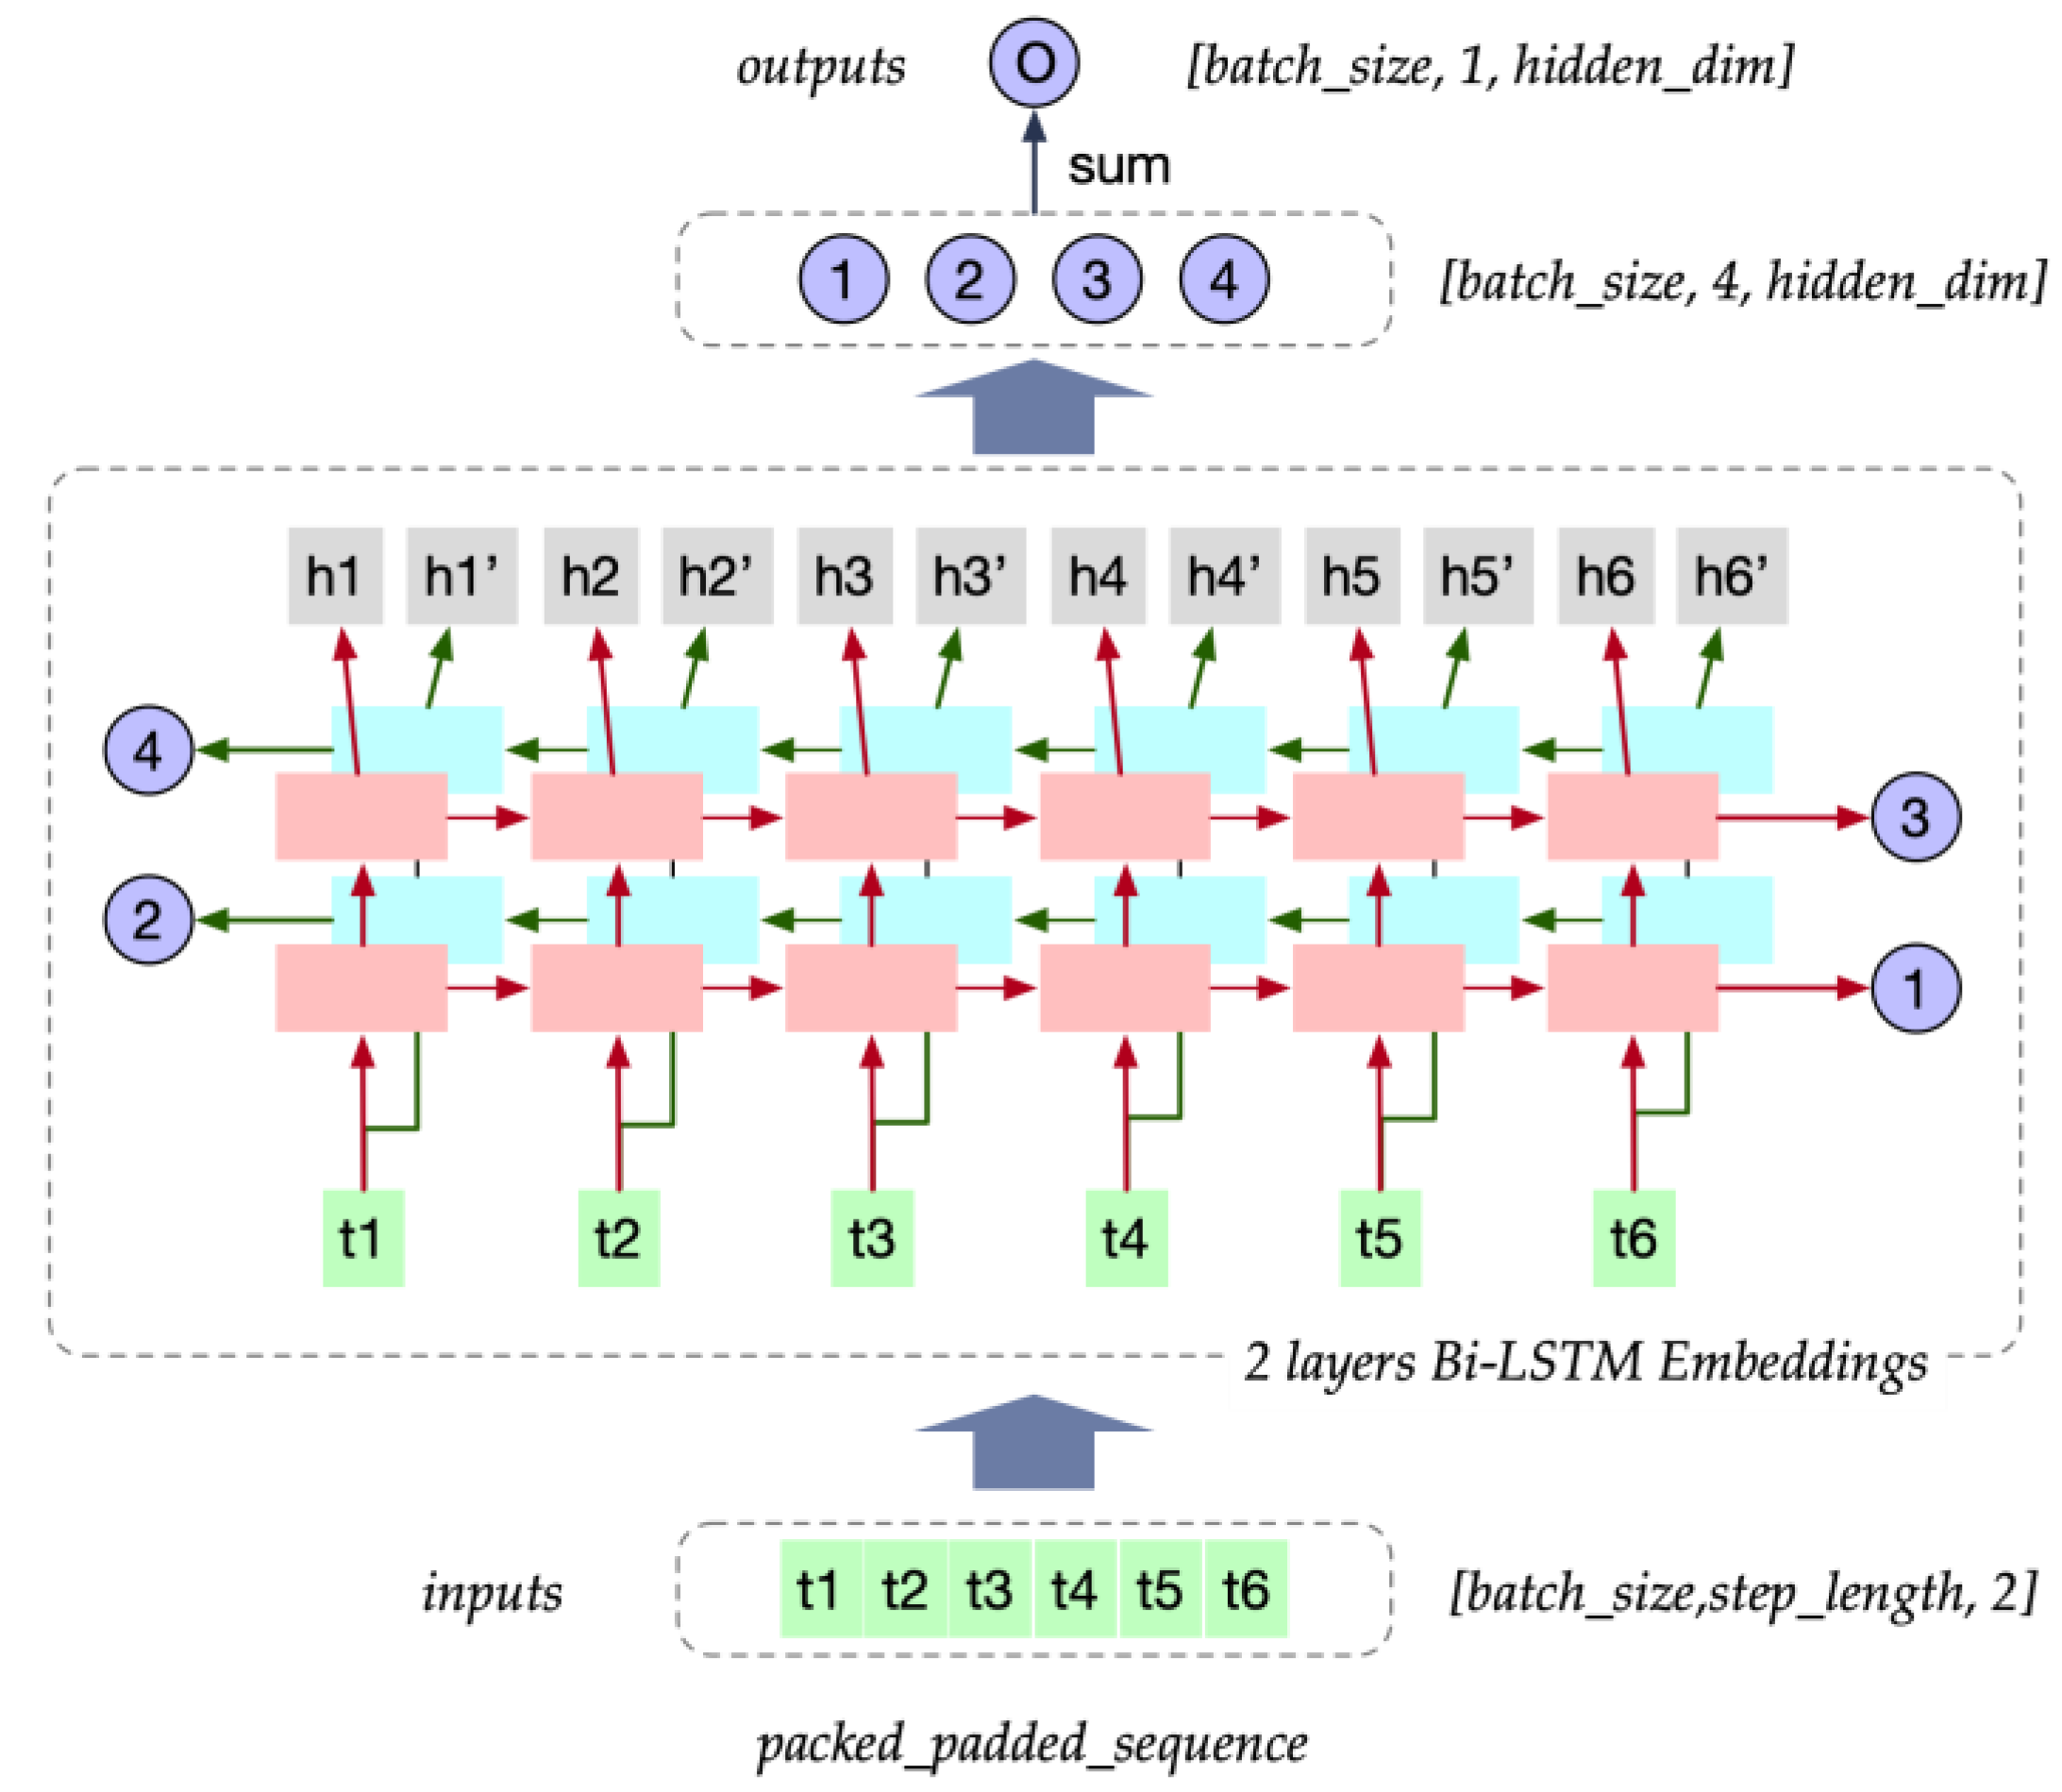
Trace sequences embedding: The trace sequences were embedded using LSTM components with a two-layer bi-direction LSTM architecture, as depicted in
Figure 4.
As trace sequences in various time intervals may differ in length, it is necessary to standardize the length of the sequences within each batch. This is achieved by padding the sequences to a common length. To prepare the input for the model, we utilized PyTorch’s Packed Sequence data structure. This data structure allows for the efficient handling of sequences with variable lengths by padding them to a uniform length while preserving the original lengths for subsequent processing.
Then the sequence goes through a multi-head self-attention mechanism, as proposed in [
28].
After the standardization of trace sequence lengths, trace sequences are fed into Bi-LSTM. We collected outputs of each layer and both directions and calculated their mean values at which summarizes the relevant information extracted from the trace sequences.
The entire process of this can be illustrated as follows:
where
denotes the Bi-LSTM structures, and
denotes the multi-head self-attention process.
KPIs and feedback information embedding: We concatenated the KPIs from JVM, operating system environment, and network device together because they share the same time steps within each time interval with length and thus can be meaningfully combined.
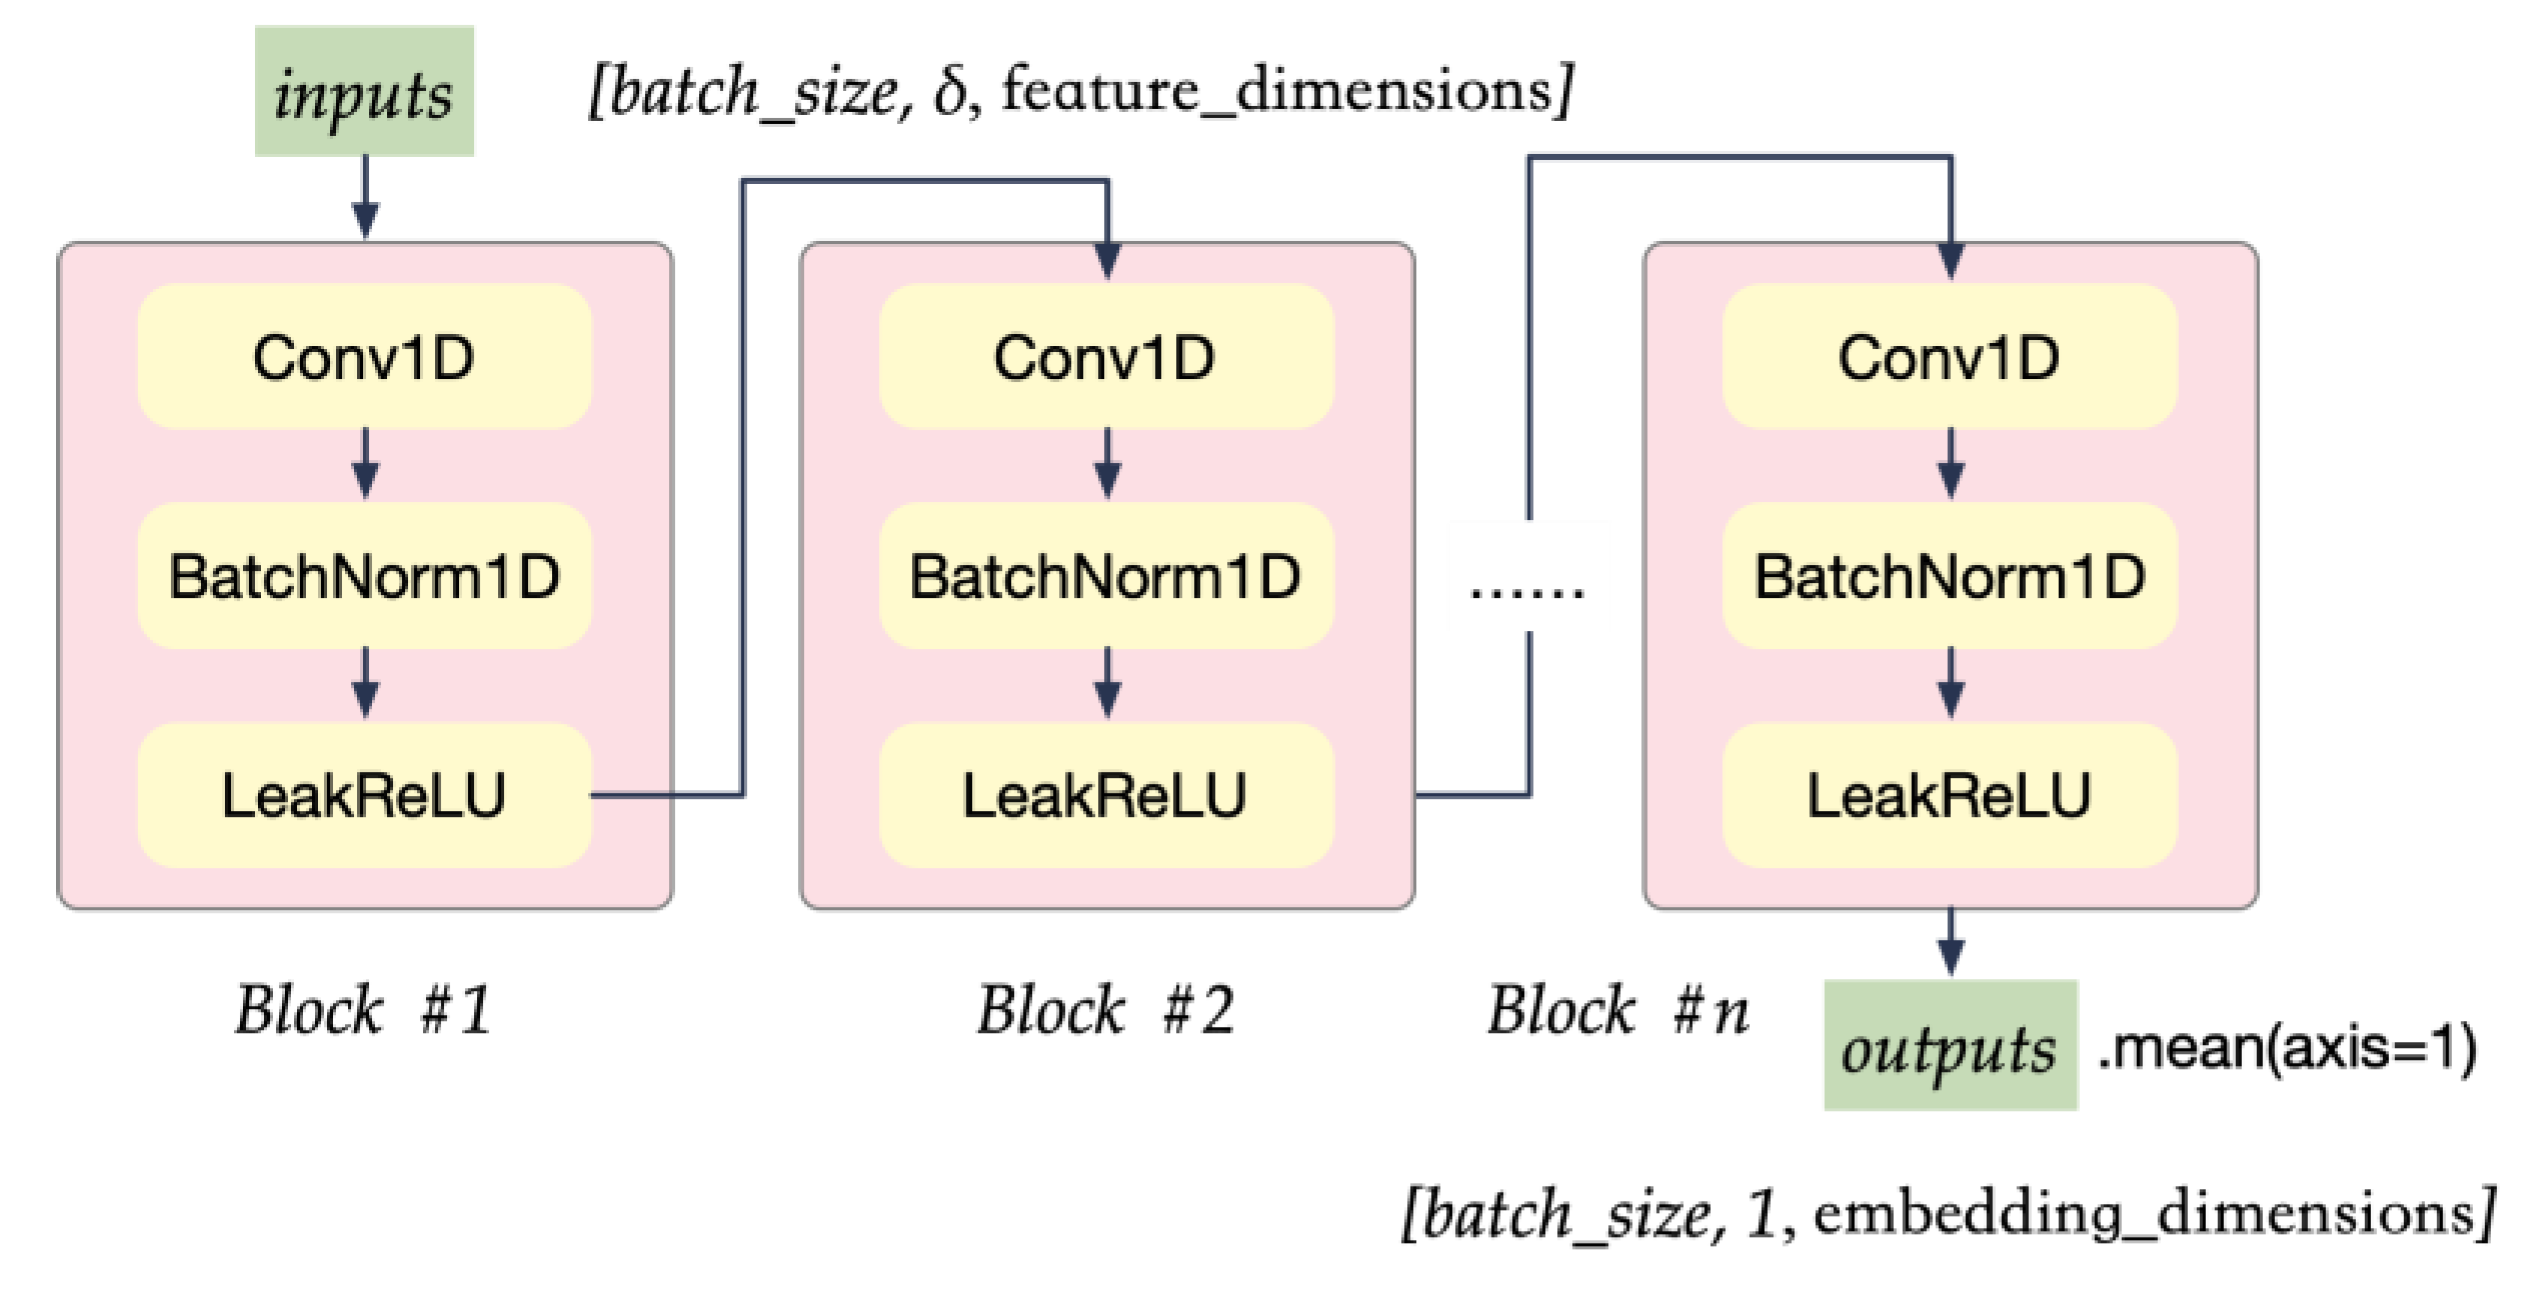
Since the length is fixed of KPIs sequences among batches, we used CNN architecture to extract the embeddings for these data sources, as depicted in
Figure 5.
Figure 5.
CNN blocks for KPIs sequences. Each block contains 1D convolutional neural network layers followed by batch normalization layers and LeakReLU as the activation functions.
Figure 5.
CNN blocks for KPIs sequences. Each block contains 1D convolutional neural network layers followed by batch normalization layers and LeakReLU as the activation functions.
The block structure achieves a nonlinear projection as Equation (8), in which denotes the convolution operations, and is the kernel function. The CNN blocks contain a 1D convolutional neural network followed by batch normalization layers, with a LeakReLU as the activation function.
Feedback information is in the same structure and can be processed using the same network structures with different parameters.
4.2.2. Cross-Attentions
After the embedding process, we employed cross-attention mechanisms to integrate the feedback embeddings with trace and KPIs embeddings separately. This step will enable the model to effectively leverage both the information in feedback embeddings and the relevant context from trace and performance embeddings.
Queries in the cross-attention structures are obtained from the liner projections from feedback embeddings, with the key and values generated by linear projections from trace embeddings or KPIs, are as follows:
The cross-attention step can align the information between feedback embeddings and trace and performance embeddings separately, aiming to leverage the relevant information from different modalities.
After the cross-attention unit, we obtained two main streams that were subsequently used in the double tower structure for contrastive learning.
4.2.3. ResNet-18 Structures
The ResNet architecture was used in CL-MMAD for learning latent feature space necessary for software anomaly detection. ResNet-18 has a deep architecture with 18 layers that enables it to learn hierarchical features from embeddings; these hierarchical features are essential for the following anomaly detection tasks, as they enable the model to identify the complex patterns in the multimodalities. ResNet-18 also uses residual connections, which helps to prevent the vanishing gradient problem, as it facilitates better gradient flow through the network and supports more effective training.
By using ResNet-18 in the double tower structure of contrastive learning, it is possible to learn highly discriminative features that can be used for downstream software anomaly detection tasks. The advantages of ResNet-18 help to improve the performance of contrastive learning, enabling it to learn more accurate and robust feature representations of the input data. To adapt ResNet for sequence learning, we modified the convolution layers into one-dimensional convolution.
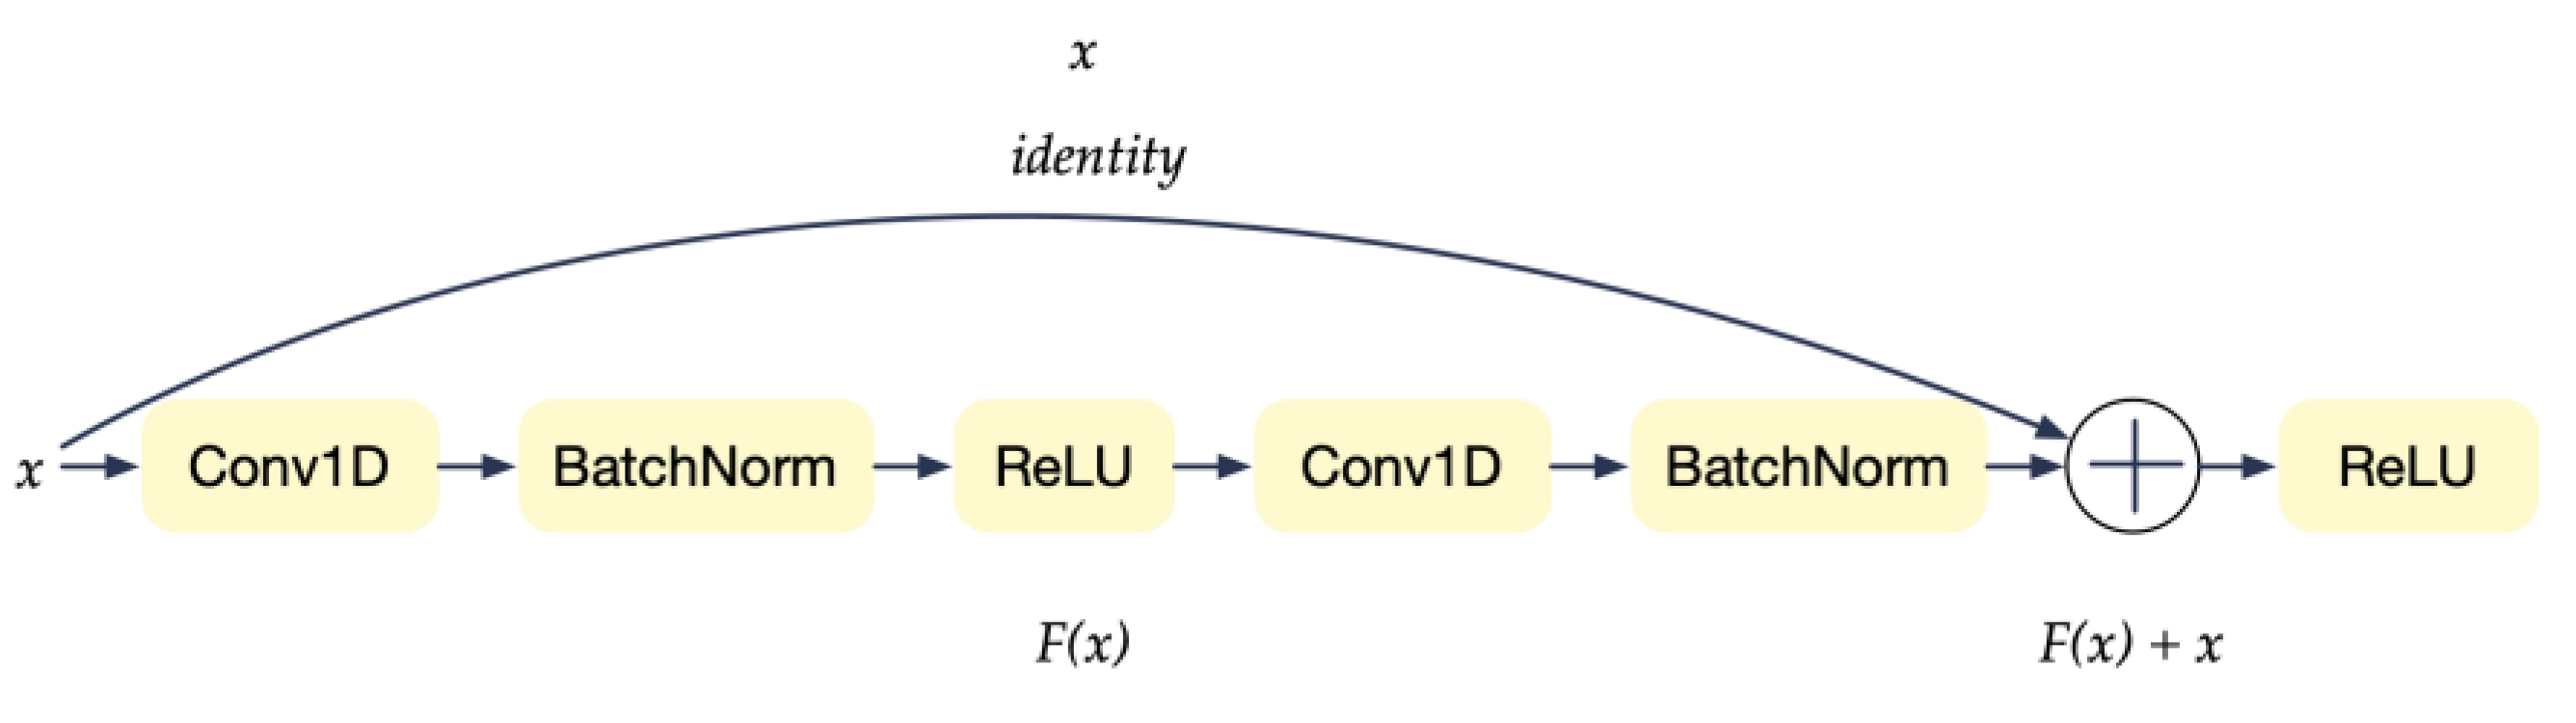
The residual block in ResNet-18 is as
Figure 6. Which achieves a transformation as follows:
ResNet-18 outputs the hidden vector of trace, and KPIs are then fed into a nonlinear projection for similarity measures.
4.2.4. MLP Projections
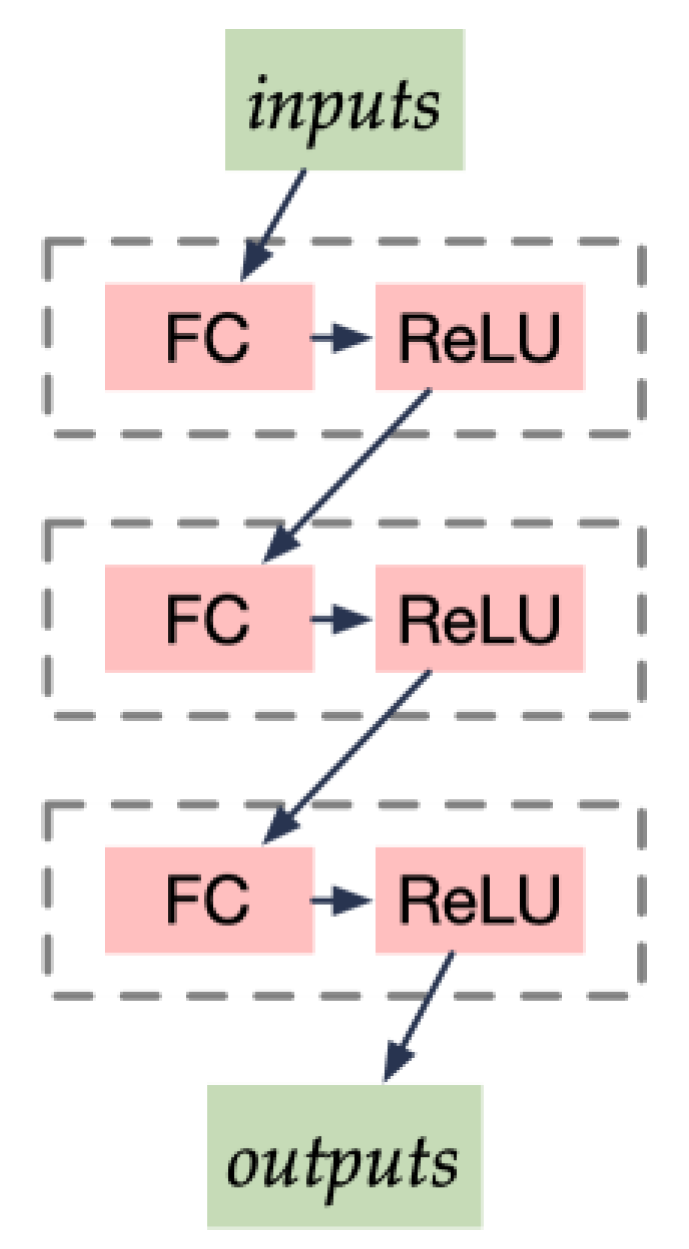
The MLP structure in CL-MMAD is relatively shallow compared with ResNet components, as depicted in following
Figure 7.
We use three full connection layers, each followed by a ReLU activation function in MLP units, such as the following:
The unit can be seen as the downstream tasks which project embeddings from two different spaces generated by the double-tower structure into a unified feature space for software anomaly detection. It is assumed that in the latter space , the embeddings derived from different modalities are pairwise and own the max value of the similarity measures.
4.3. Design of the Objectives
The objectives are used to guide CL-MMAD to produce the maximum similarities between pairwise modal inputs from the same time interval and minimize the measures between two unrelated data segments. To achieve this, during the training process, the objective function should shrink the distance between pairs of data as much as possible and, at the same time, increase the distance between unpaired data.
The information neural contrastive estimation (InfoNCE) loss is a loss function that is commonly used in self-supervised learning tasks, particularly for contrastive learning. It was first introduced by Oord et al. [
29]. In contrastive learning, the goal is to learn a representation of each input example that captures the important features of that example while also ensuring that similar examples are mapped to similar representations and dissimilar examples are mapped to dissimilar representations. The InfoNCE loss measures the similarity between two representations by comparing the likelihood of predicting one representation from the other. The equation of InfoNCE loss used in this work is as follows:
where
is a similarity measure function such as dot production or cosine similarity.
is a pairwise multimodal data sample, and
is the unpair one.
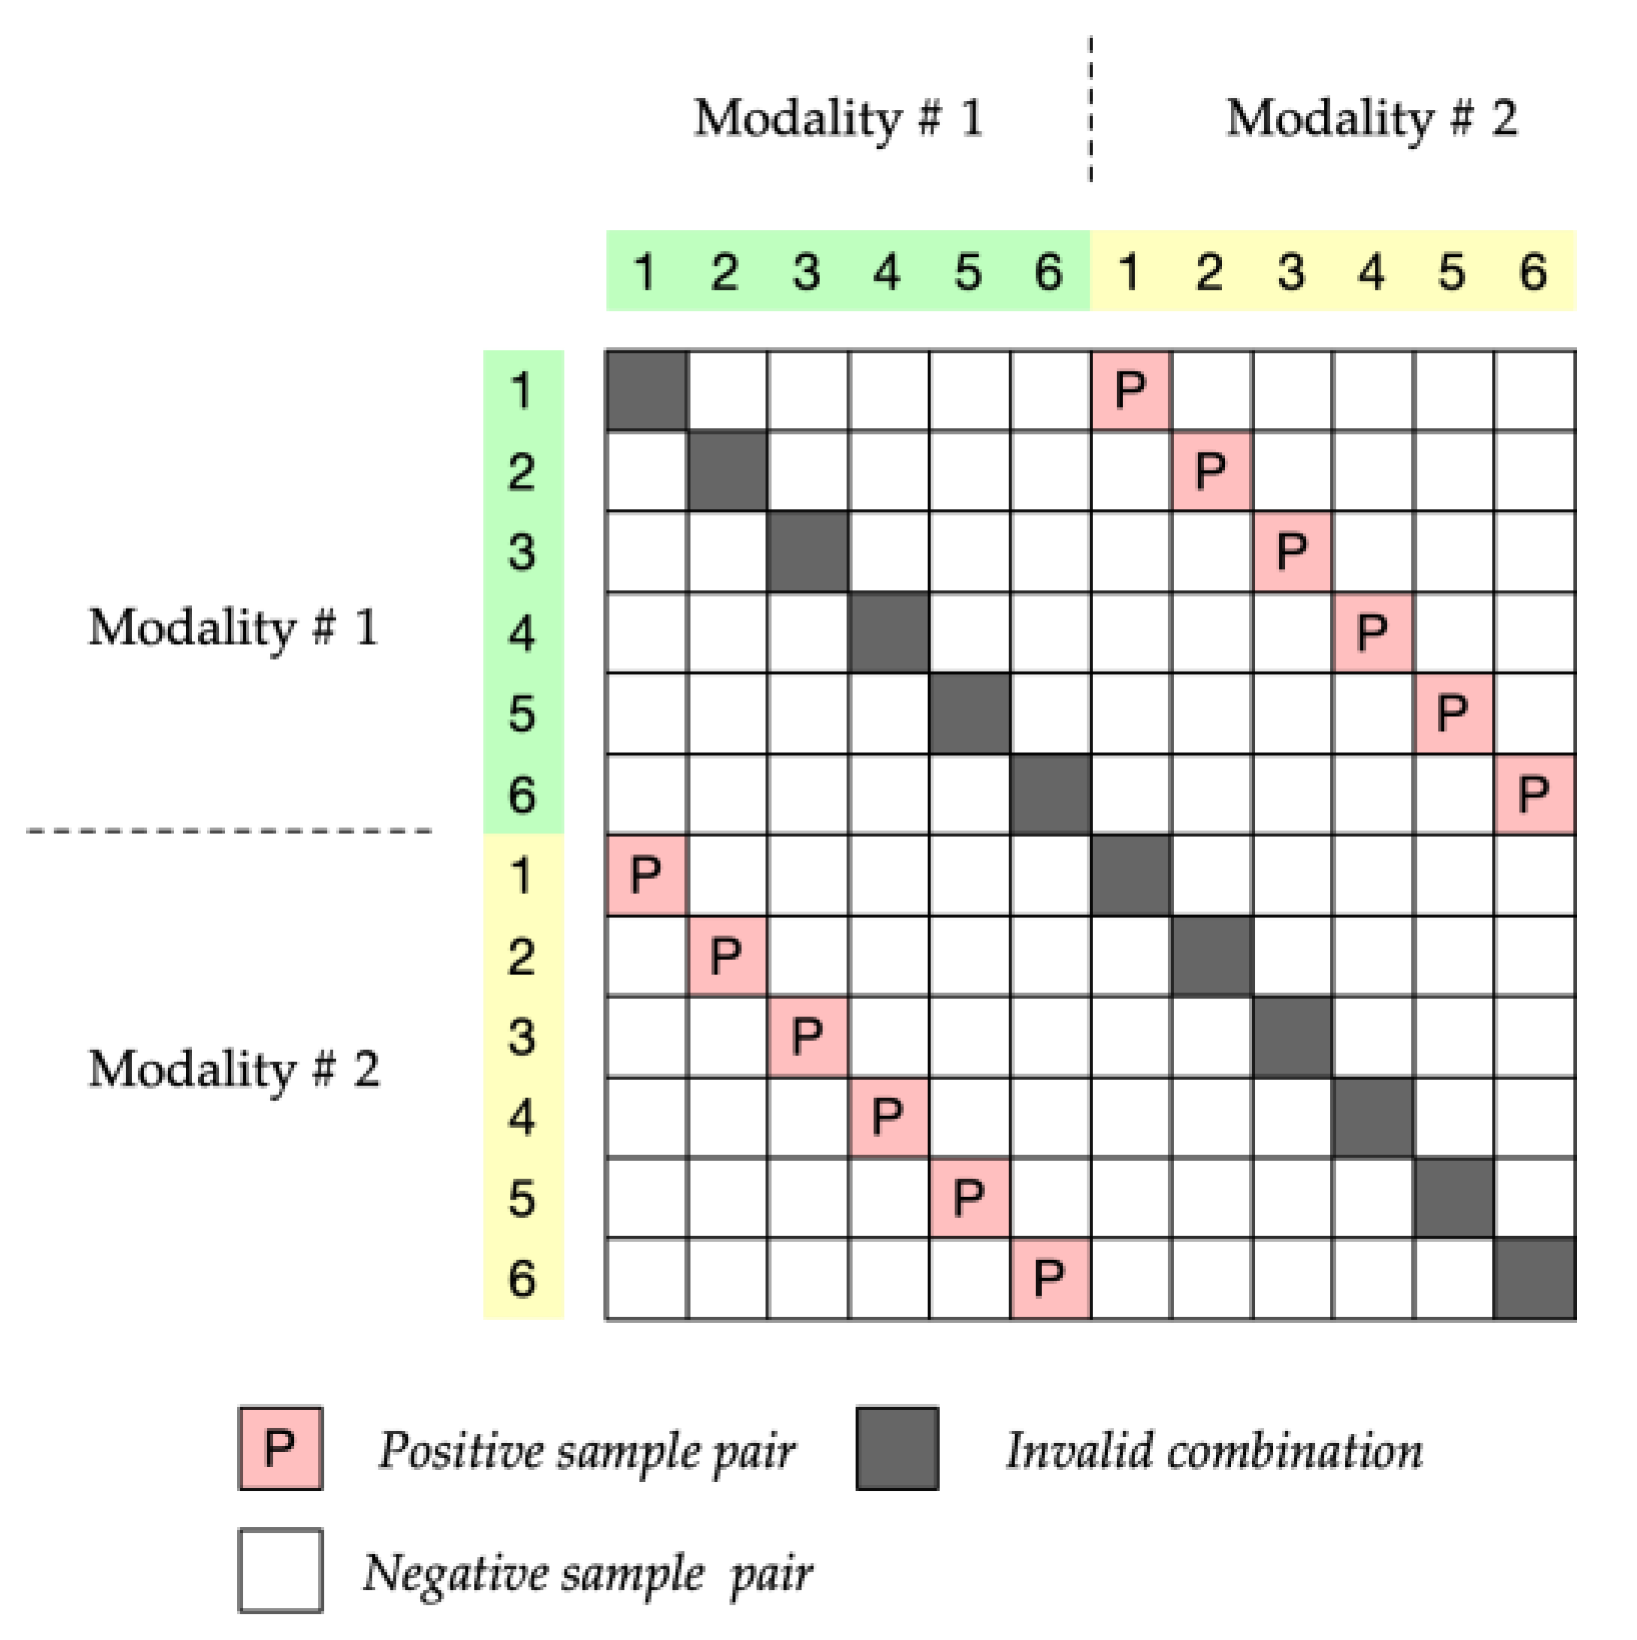
Since InfoNCE needs to guide the model to distinguish the paired samples and unpaired samples, the model needs a large number of negative samples. By improving this, researchers usually fully combine the data of each modality within a batch to maximize the number of negative samples, such as follows:
where
is the batch size. We illustrated the pairing method in
Figure 8.
However, the training of a contrastive learning model needs a huge dataset and well-defined hyperparameters. Large batch size and long-term training are necessary for a pretrain contrastive learning model. The batch size also limited by the memory size that GPU devices can provide.
Since we have a clear and specific downstream task and runtime anomaly detection, we do not need the model to learn a comprehensive feature space on software runtime status. Therefore, we performed the InfoNCE loss by using Mean Square Errors (MSE) to measure the Euclidean distance between data segments from different modalities. This can be used as a simplified solution considering cost effectiveness.
4.4. Labels Adjustment
Anomalies in software systems usually do not appear in a single time window segment. In real applications, the human operators generally do not care about the point wised metrics. It is acceptable for an algorithm to trigger an alert for any point in several contiguous anomaly segments [
30].
The label-adjusting strategy is proposed in [
30], as illustrated in
Figure 9. If any point in an anomaly segment in the ground truth could be detected by a chosen threshold, we concluded that this segment was detected correctly, and all points in this segment were treated as if they could be detected by this threshold. We employed sliding windows to split the label sequences; if in the time window
there were more abnormal points than a fixed proportion (we set α = 0.99 in this work), all the elements in the time window were set to anomalous.
5. Experiments
To evaluate the performance of CL-MMAD on software anomaly detection, we conducted a series of experiments, which are introduced in this section.
5.1. Datasets
We deployed Cassandra in a laboratory environment. YCSB, a benchmark tool for performance testing [
31], was used to apply workloads to Cassandra to mimic the general normal usage scenarios. Six standard workloads provided by the YCSB website were used [
32], which can ensure that Cassandra is working at normal status. In each workload, the total operation counts vary from 1000 to 1,000,000. Multimodal datasets for training and testing are collected from the normal status.
Since Cassandra was implemented using the JAVA programming language, a tracing tool named BTrace was used for instrumentation and collecting runtime execution trace [
33].
JVM status was monitored using a tool named JSTAT, and Linux operating system performance indicators were monitored using the command “sar”, provided by the Linux kernel. Feedback information can be collected from the YCSB tool in its log files.
For model training, we ran each workload 500 times as a cycle, 100 cycles in total. The raw dataset size was nearly 300 GB. Then we preprocessed the datasets, normalized them in columns, and split them into time intervals with length .
The model training stage is a self-supervised process; only runtime information collected from normal states was needed.
In addition, for model evaluation, we needed labeled datasets. We injected some faults into Cassandra’s source code and triggered them to construct a labeled dataset consisting of both normal samples and anomalies. The faults injected into the source code are listed in
Table 1. It is worth noting that CL-MMAD does not aim to find the specific fault types, so we mixed all the failure runs together to make the data balance between normal and abnormal samples. They are all called abnormal datasets in validation datasets.
The volume of the datasets is listed as the following
Table 2.
We split the training datasets using the random split function provided by PyTorch. The ratio was set to 8:2, which means 80% of the training data was used for building the model, while 20% data was used for model testing.
5.2. Model Training Phases
InfoNCE loss and MSE loss were used to guide the model training process separately. In this section, we introduced both the training details.
The model CL-MMAD is implemented using PyTorch v1.13.1, Python 3.9.13 on an Ubuntu 20.04 Workstation with 128 GB memory, and three Nvidia A6000 GPUs.
5.2.1. MSE Loss Training Phases
We first used the MSE loss to guide the training process of the two-tower model in CLMMAD. When training uses MSE loss, we set the hyperparameters in
Table 3:
In all of our experiments, we set the random seeds to 42. Given that the mean squared error (MSE) loss computation does not require significant memory consumption, we utilized a relatively large batch size of 30. The learning rate for this experiment was set to . Setting a relatively large learning rate at the beginning of training can expedite the model’s convergence toward the optimal solution. However, as the training proceeds, the learning rate becomes too large, which can impede convergence. To address this, we implemented learning rate scheduler measures to reduce the learning rate in the later stages of training, thus facilitating the model’s smooth convergence toward the optimal solution. Adam optimizer provided by PyTorch was used with a learning rates scheduler named “ReduceLROnPlateau” that monitors the testing loss; when the results are not improved, it changes the learning rates.
Figure 10 displays the train and test loss of the CL-MMAD model under the mean squared error (MSE) loss. The model exhibits rapid convergence after only 10 epochs, indicating that data from different modalities can be efficiently translated from the feature space of comparative learning to a unified feature space. It is plausible to suggest that the latent space formed by the ResNet-18 structures has learned the interactions between multiple modalities, thereby establishing a framework for detecting consistency in multimodal data.
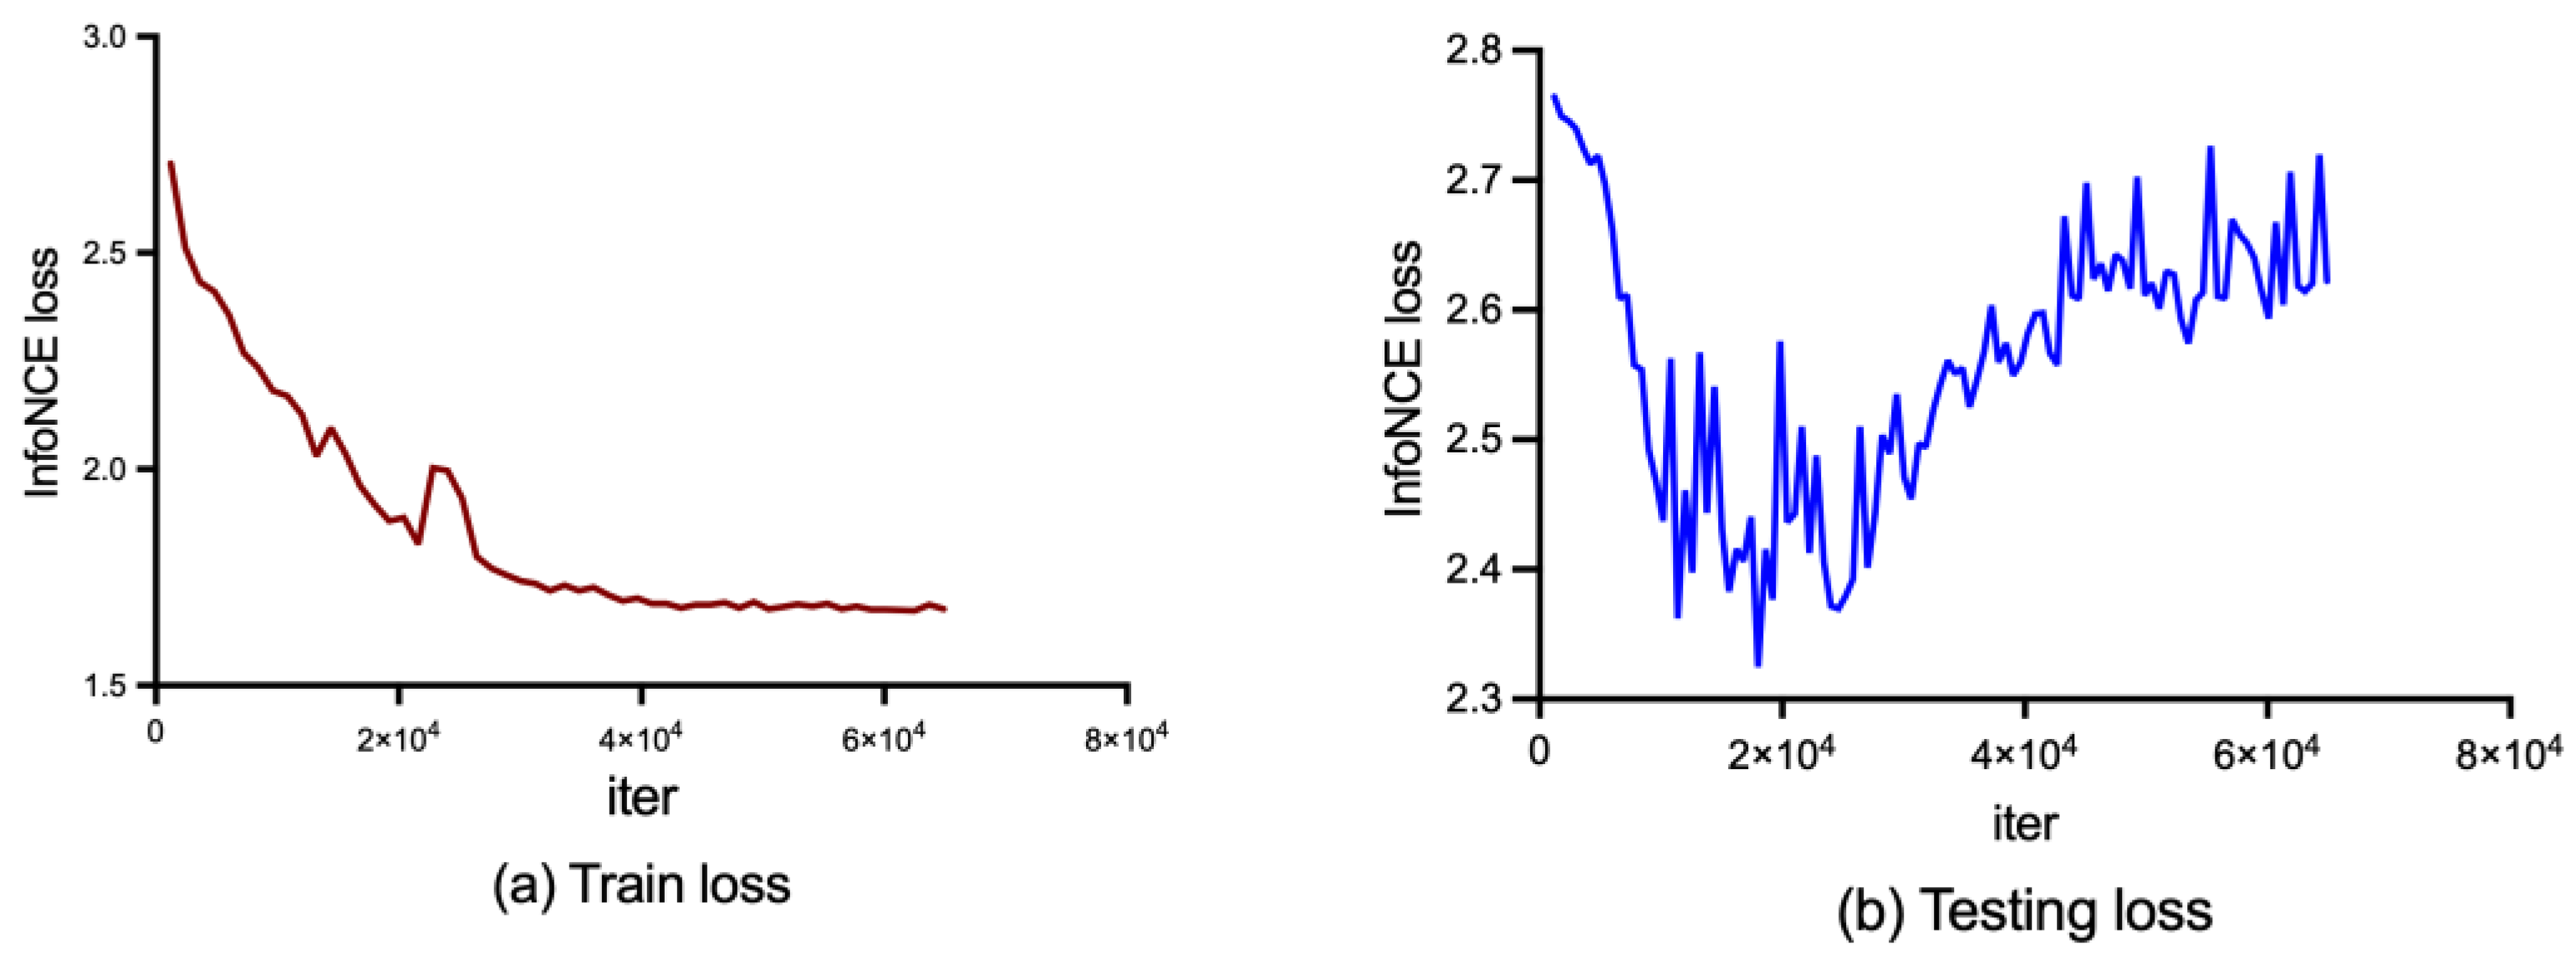
5.2.2. InfoNCE Loss Training Phases
The situation becomes more complicated when using InfoNCE loss for training. InfoNCE performs a lot of similarity calculations within different batch data, causing much more memory space usage compared with MSE. We could not set the batch size so large using MSE loss. After several failed experiences, we determined that the maximum value of batch size is 20. However, it is rather small for negative samples of contrastive learning. For comparison, the most popular recent CLIP model has a 16 k to 64 k batch size causing 2500 TPU days to train. Fortunately, we do not require the model to learn the complete runtime behaviors of the software. The purpose of using contrastive learning is to check whether the data behave consistently across all modalities. We consider this task to be relatively straightforward and can be achieved by simply setting reasonable thresholds for anomaly detection after the model has converged. Instead, the model is not required to converge strictly to the lowest point.
When training uses InfoNCE loss, we set the hyperparameters as
Table 4 after numerous failed attempts. We selected two sets of hyperparameters that performed relatively well. The train and test loss of the two groups are shown in
Figure 11 and
Figure 12.
6. Results Analysis
6.1. Research Questions
In this section, we answered the following research questions:
Do MSE-loss outperform the InfoNCE-loss when taken as the anomaly score?
Can CL-MMAD detect both functional failures and performance issues?
Do CL-MMAD outperform existing state-of-the-art baseline models?
6.2. Performance Evaluations of CL-MMAD, MSE Loss vs. InfoNCE Loss
We evaluated the performance of CL-MMAD using MSE-loss and InfoNCE-loss as anomaly scores separately.
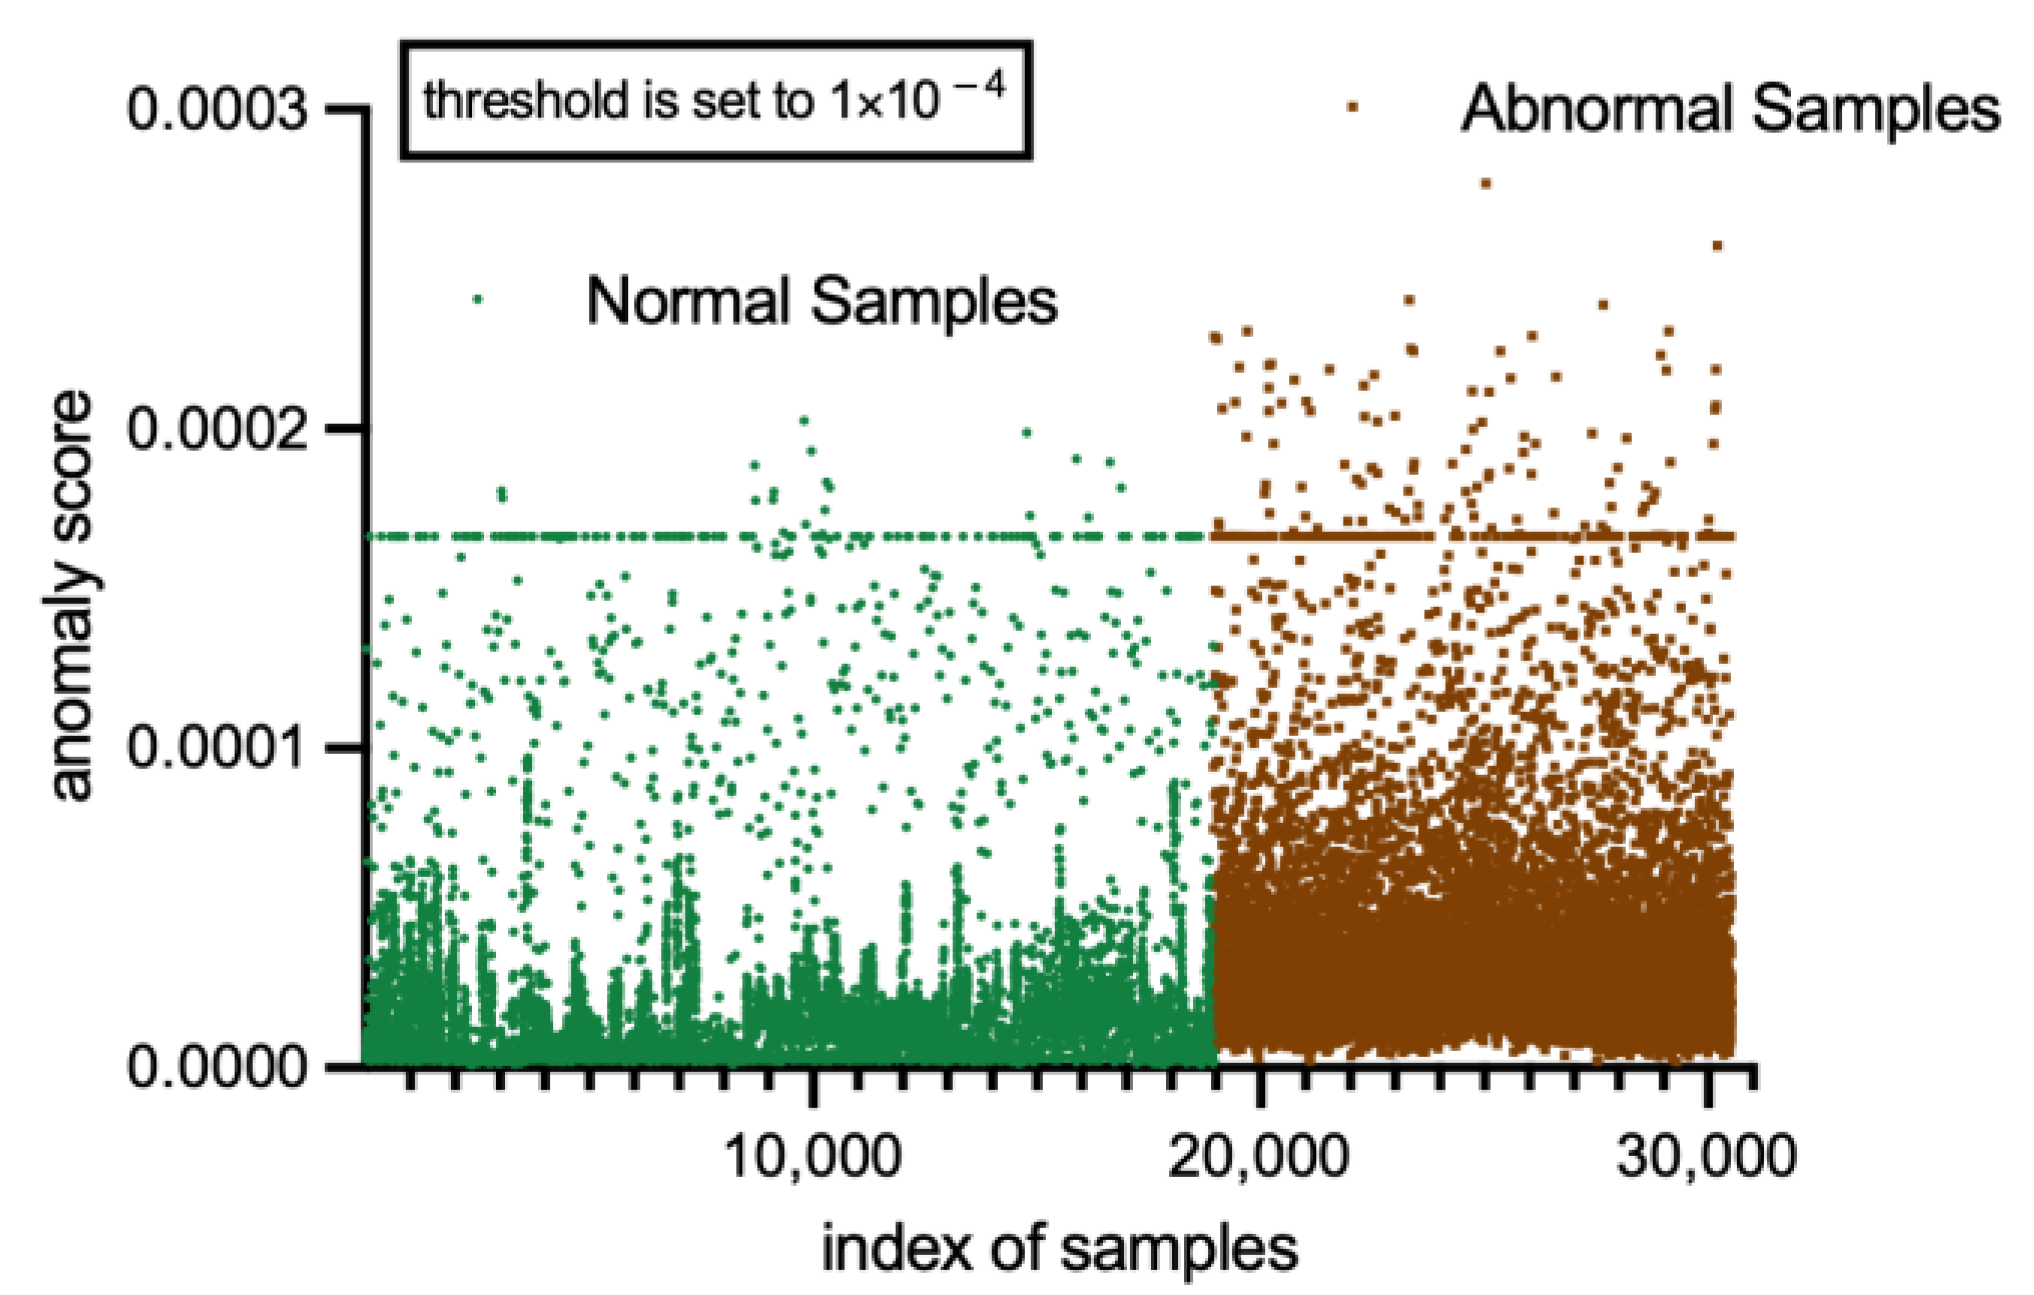
Anomaly scores produced by CL-MMAD using MSE measures are shown in
Figure 13.
The findings presented in
Figure 13 demonstrate that the CL-MMAD model trained under the mean squared error (MSE) loss can effectively distinguish between normal and abnormal samples, yielding a satisfactory performance.
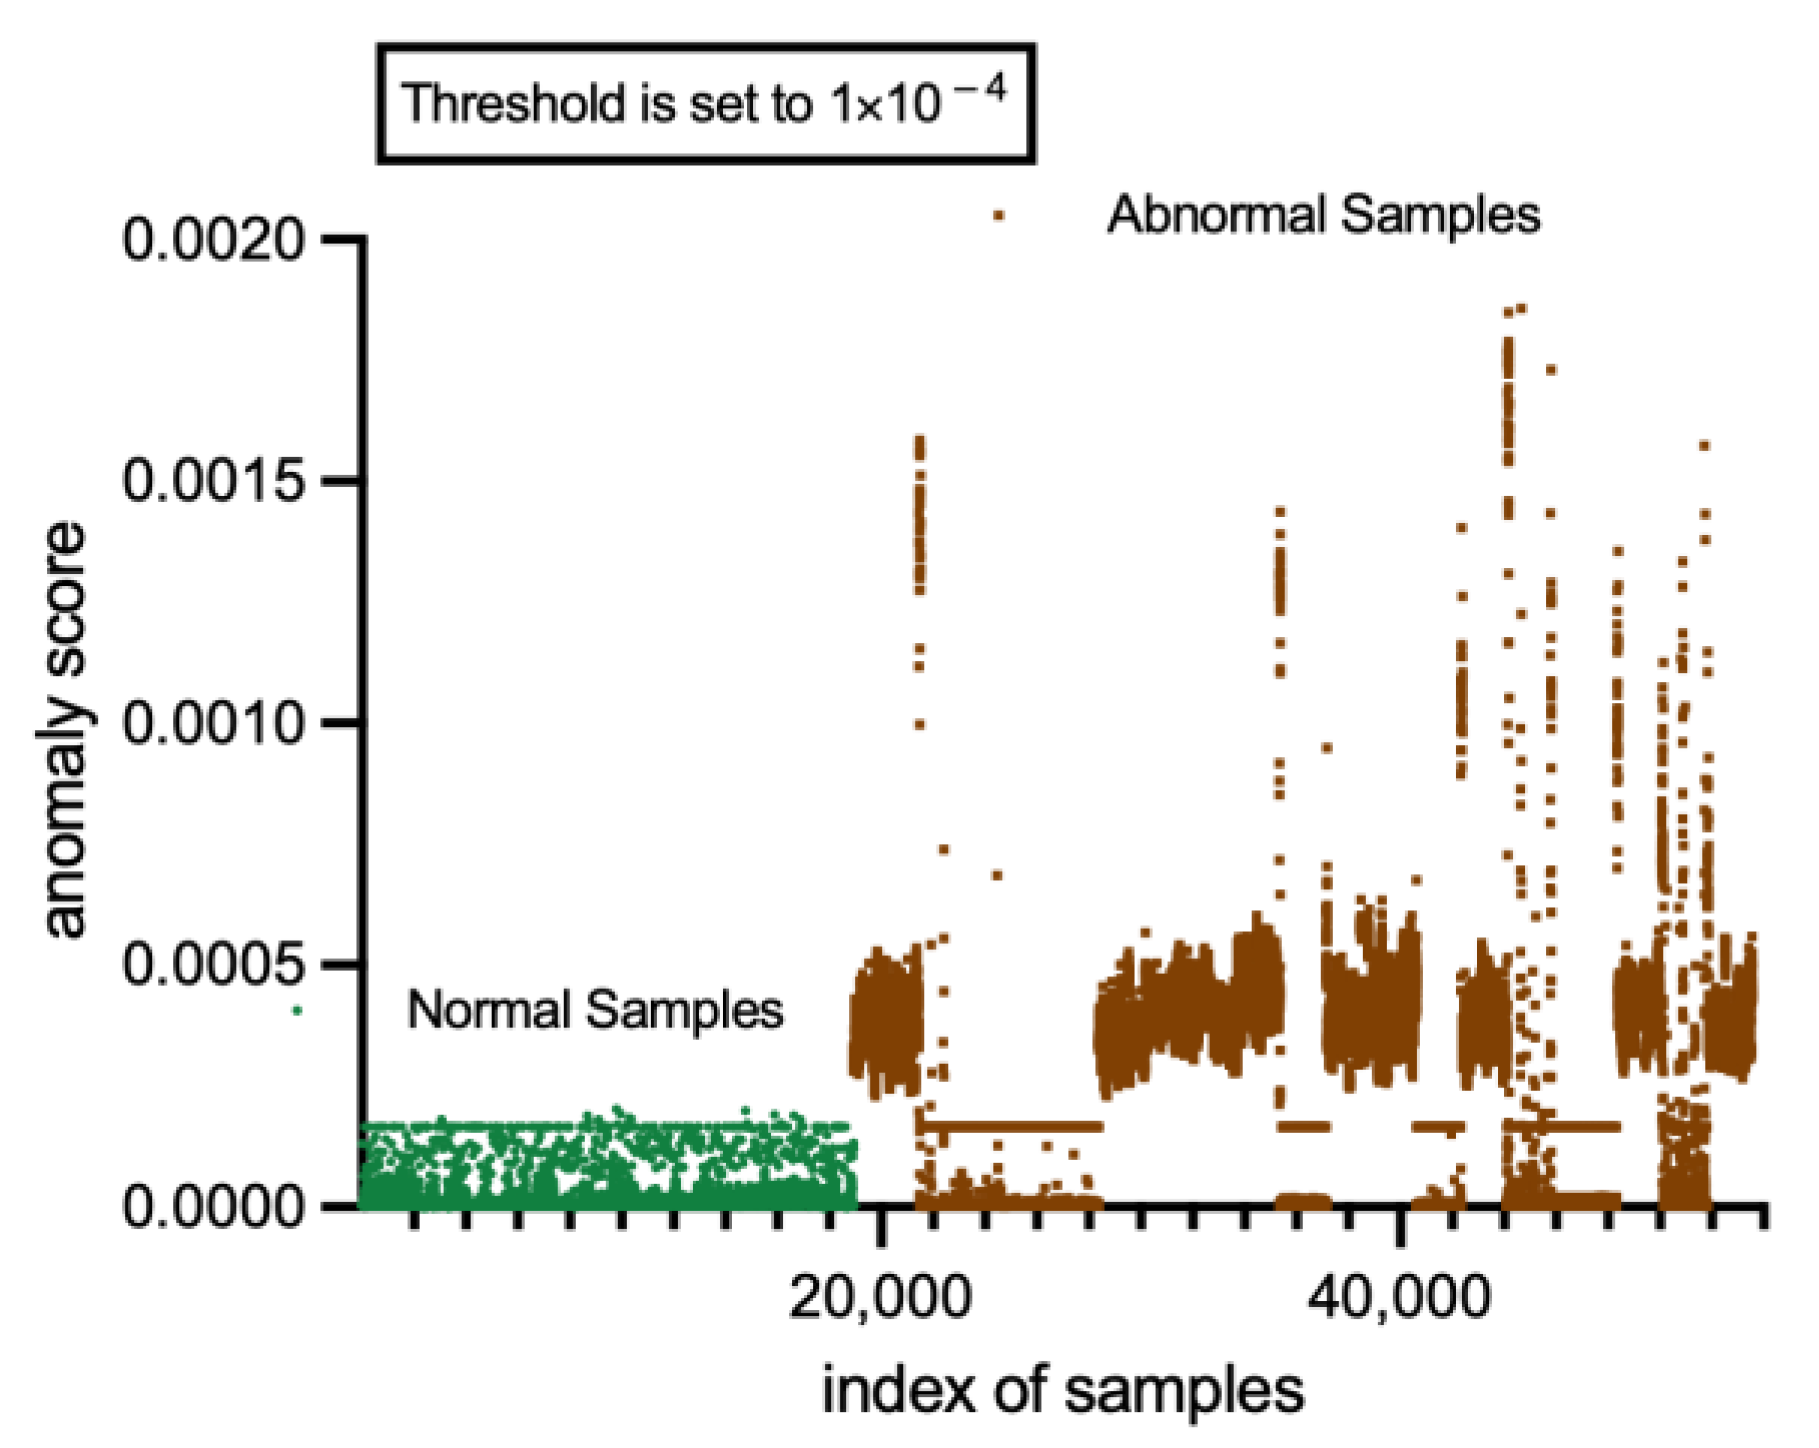
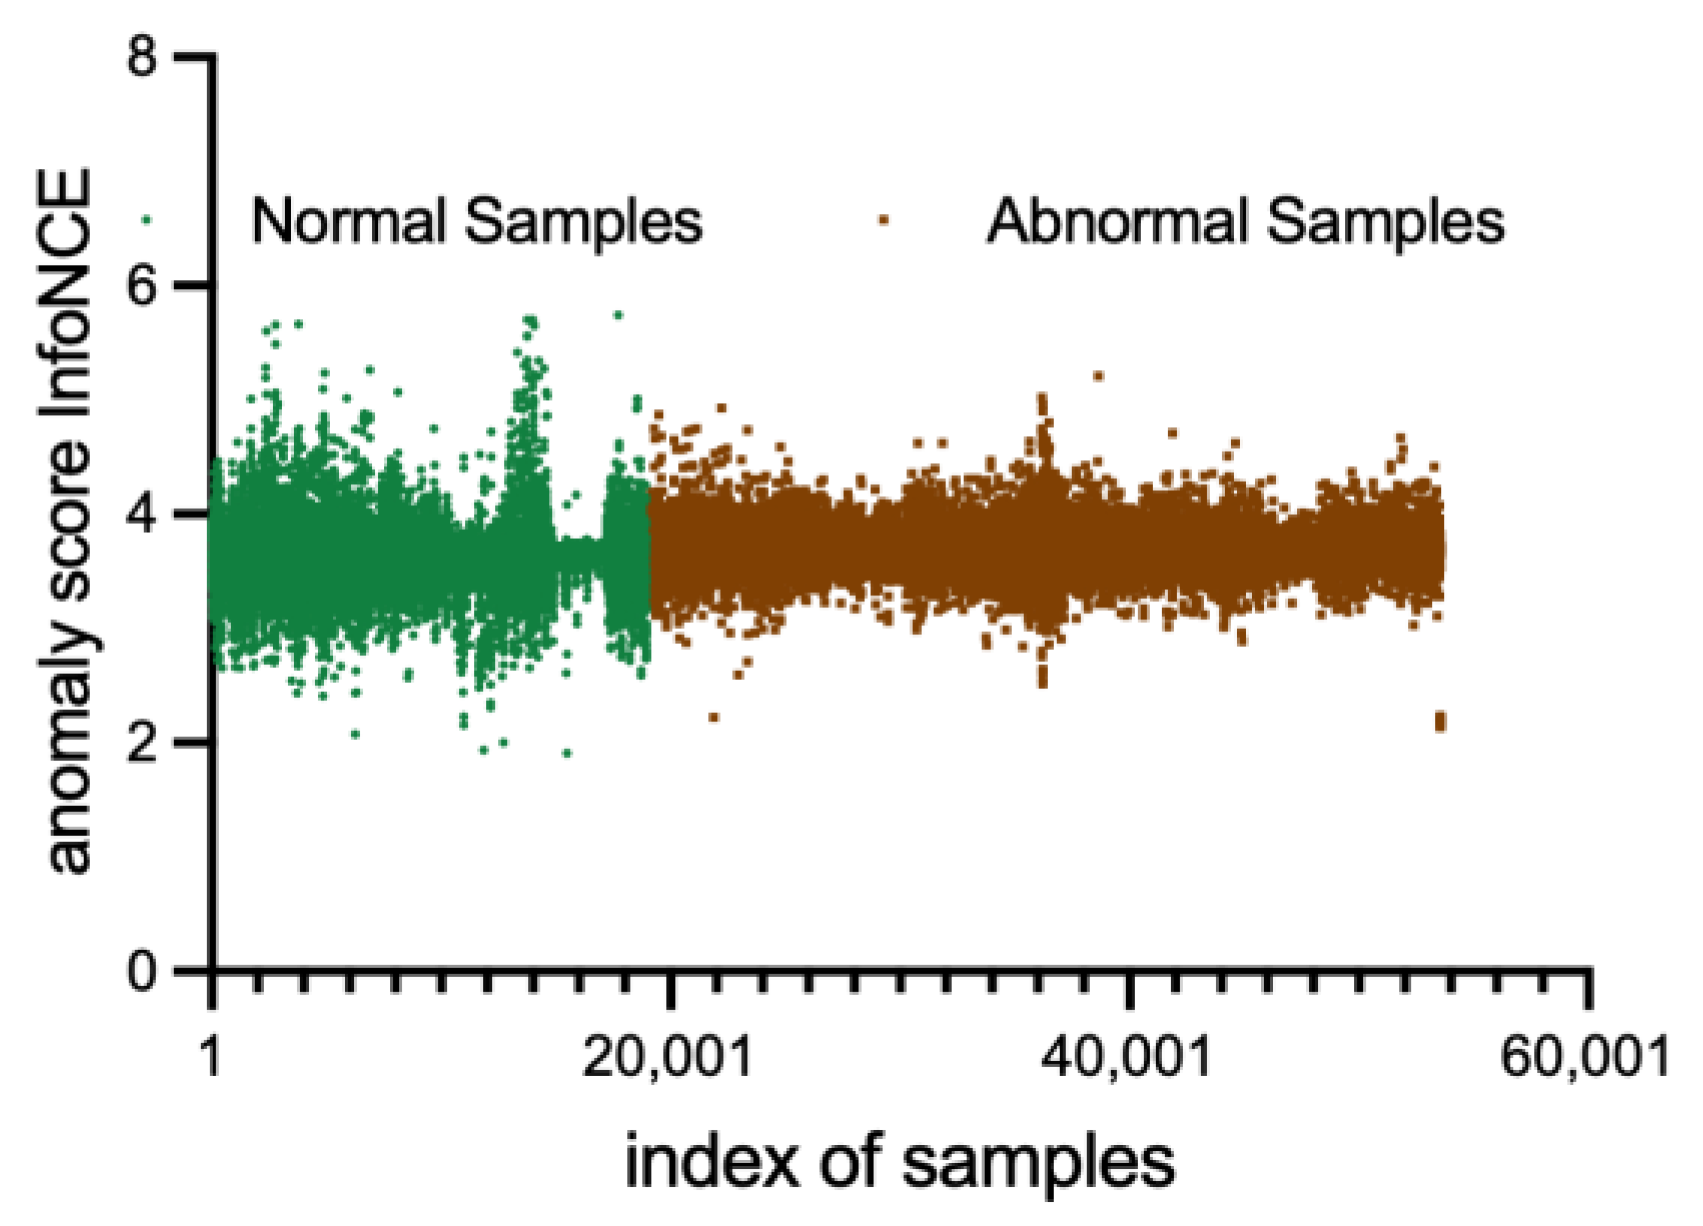
Figure 14 and
Figure 15 present the anomaly scores of normal and abnormal samples utilizing the InfoNCE loss. The abnormal scores of both normal and abnormal samples are intertwined, making it challenging to differentiate them distinctly. Moreover, neither the lowest nor the most stable group of hyperparameters can achieve a desirable anomaly detection performance. The results highlight the importance of having sufficient negative samples for contrastive learning to capture pairwise information between modalities, thereby necessitating a relatively large batch size and more advanced GPU devices. The latent space learns hierarchical features of the software runtime statuses, most of which are irrelevant for anomaly detection. Consequently, difficulties in converging at global optimal points and the presence of excessive unrelated information make the InfoNCE loss unsuitable for software anomaly detection.
The results shown in
Table 5 have revealed that InfoNCE is not a good choice for anomaly detection tasks. Not only is it difficult to train with InfoNCE loss, but it is also difficult to obtain better results when performing an anomaly detection task.
MSE loss as the anomaly score can achieve a rather high accuracy after applying the label-adjusting strategies.
6.3. Achievements on Functional Failures and Performance Issues
Because CL-MMAD is an anomaly detection method using multimodal datasets. It should have the ability to detect both functional and performance failures. In this section, we conducted a series of experiments to evaluate the model performance on functional failures only and performance failures only, separately.
Table 6 shows the model performance on datasets of functional failures and performance failures.
Figure 16 and
Figure 17 show the anomaly score on functional failure detection and performance issue detection, respectively. MSE loss is the anomaly score. The results show that CL_MMAD is more sensitive to changes in performance indicators. The model can achieve high performance on performance issues detection. This may be because the functional logic faults that we inject do not cause large-scale changes in the values in the trace, thus causing the model to be less sensitive to functional logic fault detection.
6.4. Comparisons with Existing Baseline Methods
To our knowledge, this study presents the first software anomaly detection model that utilized internal execution information, external performance metrics, and feedback information for multimodal learning. Furthermore, most existing methods use performance indicators, while rare research uses internal trace information. As a result, we chose to compare CL-MMAD in the paper with existing baseline models using performance information only. The comparison experiments were performed on the Cassandra dataset built in this paper. For our baseline models, we selected two approaches in anomaly detection, namely OmniAnomaly and DAEMON, both models are fully open source with their code implementations.
OmniAnomaly is a reconstruction-based model based on VAE structures that adopts the stochastic variable connection and planar normalizing flow to reconstruct input data [
23]. OmniAnomaly works well for various devices by capturing the normal patterns of multivariate time series.
DAEMON is an unsupervised anomaly detection framework composited by GAN networks and VAE networks [
24], which uses two discriminators to train an autoencoder and learn the normal pattern of multivariate time series.
The results are shown in
Table 7. CL-MMAD outperforms the other two models on all four metrics on the Cassandra datasets. The results indicate that data consistency between different models is a critical aspect of runtime anomaly detection tasks.
7. Discussion
CL-MMAD, a software runtime anomaly detection framework for both functional failure and performance issues, is proposed in this work. To our knowledge, this is the first time multimodal datasets have been used for software anomaly detection.
There are several main findings in this work.
Finding 1: Data consistency between different modalities can be used for anomaly detection.
CL-MMAD is based on the contrastive learning framework and uses the double tower structure to capture the features of trace indicators and performance indicators separately. MSE loss is used to guide the model to construct the projection from different source modal spaces into a uniform space. When inconsistent data are passed through the model, the differences are magnified, which is expressed in the final feature space as a larger Euclidean distance.
Finding 2: The commonly used InfoNCE loss in contrastive learning framework is not well-suited for software anomaly detection tasks; MSE is simpler and better.
In this study, we compared the performance of the CL-MMAD model trained using the InfoNCE and mean squared error (MSE) losses. Our findings indicate that training the model under the InfoNCE loss requires significantly more negative samples per batch, necessitating a larger batch size. However, due to device limitations, the maximum batch size was set to 20, which falls short of optimal requirements. In contrast, the MSE loss promotes faster model convergence, with performance surpassing that of the InfoNCE loss within a mere 10 epochs. As such, utilizing the MSE loss may prove to be a more cost-effective and practical approach to software anomaly detection.
Finding 3: The CL-MMAD model demonstrates greater sensitivity to changes in performance indicators, highlighting the need for closer consideration of the trace indicator embedding learning process.
Notably, while the current model employs an approximately symmetric architecture, our results indicate reduced sensitivity to trace changes compared with performance indicator changes. Consequently, the model may fail to detect faults that produce only minor deviations in the trace data. Given that performance data typically changes relatively slowly over time, with a collection interval of 1 s, trace data may generate a vast amount of information during that time. Therefore, the use of more sophisticated representation learning structures for trace data may improve the detection performance of functional failure detection. Furthermore, we implemented timed sampling during trace data collection to minimize performance overhead on the original system, but this also resulted in a trade-off with prediction accuracy.
Finding 4: Compared with DAEMON and OmniAnomaly, the combination of internal trace information and external performance information can achieve better results when performing anomaly detection on performance issues.
Empirical results show that, compared with baseline models, CL-MMAD achieves better performance on performance issues detection, which may be due to the introduction of internal trace information. CL-MMAD can integrate more information from multi-sources, such as internal trace, external performance indicators, and client-side feedback information, which can lead to more accurate detection of anomalies. Multimodal detection systems can be much more robust than unimodal frameworks. By integrating multi-sources, they can reduce the impact of noise and errors.
Possible future work directions: At the end of this section, we pose two possible avenues for future research: (1) An asymmetric two-tower structure that may capture trace information more effectively since trace information changes rapidly over time and has a large range of variation; it needs to be characterized and learned using a more complex neural network structure compared to KPI information. (2) The introduction of more kinds of multimodal data sources may increase the diversity of the failure types detectable by the model.
8. Conclusions
CL-MMAD, a contrastive learning-based software runtime anomaly detection method using multimodal datasets, is proposed in this work. Our approach utilizes the ResNet-18 architecture in a double tower structure to learn comprehensive latent representations, which are then projected into a uniform feature space. MSE loss is used to guide the training process, which has demonstrated superior performance in terms of faster convergence and higher accuracy than InfoNCE loss in the software anomaly detection task. The empirical study results show that CL-MMAD can outperform the other two baseline models in performance issues detection while exhibiting the ability to detect functional faults. In addition, we observed that CL-MMAD is more sensitive to performance indicators than to internal trace indicators, resulting in a relatively poorer ability to detect functional failures.
In future work, asymmetric double-tower may be able to improve the weakness of functional failure detection. Additionally, we recommend mining additional indicators related to functional failures to enhance the performance of functional fault detection tasks.


