Abstract
Laser joining of polymers to metals is a rising research subject due to the potential of considerably reducing the weight of structures. This article deals with the laser joining process between polypropylene and aluminum. Without pre-treatment, laser joining of these materials is not feasible, and the method applied in this study to circumvent this issue is a surface modification of aluminum with a pulsed laser to create mechanical interlocking for the heat conduction laser joining technique. Different patterns and various laser parameters are analyzed with the design of experiments to best understand the effects of each parameter along with microscopic observations. It is found that engraving weakens the mechanical properties of the aluminum samples. The compromise between the engraving depth and the mechanical properties of the samples is optimized, and the engraving process with a 0.28 mm line width, 27.3% density and 150 mm/s speed provides the highest mechanical performance of the assembly with minimum degradation of aluminum samples. Moreover, by adjusting the laser power and using power modulation below 300 W, the decomposition of polypropylene occurring at high temperatures is reduced to a minimum. After the final optimization, the joined samples reliably withstand a maximum force of 1500 N, which is, approximately, a shear strength of 20 MPa.
1. Introduction
The reduction in CO2 emissions is an important goal in research as it is one main cause of global warming threatening life on earth. An effective way to reduce weight is by switching to lighter materials, building thinner, or reducing the number of parts. For instance, a common strategy to reduce fuel consumption is the substitution of aluminum for steel in the automotive industry [1,2]. Another interesting alternative to reduce the weight in vehicle applications is to implement new structural designs such as honeycombs instead of comparatively heavy conventional aluminum parts [3]. A recent approach is to employ the miscellaneous properties of metals and polymers in light-weight hybrid structures, hence advanced joining methods must be considered. Compared to traditional metal polymer joining methods such as mechanical fastening or adhesive bonding, Laser Assisted Metal-Plastic (LAMP) joining [4] has the advantage of not requiring other parts or substances (screws, glue, etc.) that can be harmful to the environment and require extra production steps [5].
The choice of polypropylene (PP) can be very interesting as it is a low-density, high-corrosion, and humidity-resistant material [6]. However, due to its non-polar characteristics and bad adhesion properties, natural PP cannot join aluminum without a pre-treatment for LAMP joining. It is due to this reason that no chemical bonding occurs between molten PP and the Al surface. Therefore, to address the poor adhesion of polypropylene surfaces, some processes such as plasma or flame treatments have been implemented [7,8]. However, some limitations should be addressed such as the lack of durability in the plasma treatment of polymers due to the hydrophobic recovery [9].
Even though the LAMP joining of PP to aluminum (Al) requires an additional step, it still has a high automatization potential and can be faster than traditional methods, considering that the joint is liquid and gas sealed [10].
Promoting mechanical interlocking has been introduced as an effective way to improve the mechanical properties of metal-polymer laser-joined assemblies [11]. Laser-based surface treatments of the metal with a pulsed wave (PW) or continuous wave (CW) laser have been also investigated in this regard for different material combinations [12,13]. However, the polymeric materials used in these studies are polar. In the case of LAMP joining for polar polymeric materials such as polyamide promoting, physicochemical bonding is also reported [14,15]. Consequently, increasing the surface roughness or creating grooves on the metal surface to develop mechanical interlocking also contributes to physicochemical bonding thanks to the higher surface available for bonding between the materials. It might be a reason for the contradiction of the surface roughness effect as the significance of mechanical interlocking and physicochemical bonding is not defined, while they both contribute to the mechanical performance of such assemblies. Some reported the positive effect of surface roughness [16] and others found no correlation between surface roughness and shear strength [17].
Additionally, because of the geometry and properties of the metal samples used in these studies, the degradation of the metallic partner due to surface structuring is not addressed, except for a relatively deep laser structuring for the fiction press joining process [18] or the failure of protrusions due to low cross-section [19]. Therefore, it is interesting to evaluate the effect of the laser engraving process on the LAMP joining of a non-polar polymer, i.e., PP via promoting the mechanical interlocking with a minimized effect of physicochemical bonding. Another issue is the thermal degradation of the polymer at a high temperature, which is addressed by the optimization of laser joining parameters for the laser joining of Al to polyamide [15,20]. Hence, thermal degradation needs to be evaluated for PP during the laser joining process.
There are few studies available on the laser joining of Al and PP, for example, [21] reports on the application of a polar insert material between Al and PP, and [22] uses a polyester resin to coat Al before laser joining to PP for applications in food and drug packaging. In another study, the mindset of using PP in the laser joining process is merely to eliminate the physicochemical interaction with the Al surface and study the melting layer of PP during the joining process [8]. Therefore, a systematic study on the LAMP joining of Al and PP is required to provide the robustness of such a process for different applications without using an interlayer.
In this paper, the decisive factors in choosing an appropriate pre-treatment process are robustness, simplicity, and production rate. A laser-based engraving treatment to promote the mechanical interlocking between the materials can be a good candidate. However, several process parameters need to be optimized with the mindset of promoting the filling capacity of the Al grooves by PP with minimizing the mechanical degradation of Al during the engraving and prohibiting the thermal degradation of PP during the joining process. Therefore, the optimization of engraving density, speed, and width of the engraved lines are evaluated for the engraving process, and the optimization of the modulated power is considered for the given power modulation and beam trajectory during the laser joining process.
2. Materials and Methods
Table 1 shows the different properties of the Al and PP samples used in the study. As observers, there is a significant difference between the melting points of the two materials; even the evaporation temperature of PP is much less than the melting point of Al. this challenge will be addressed in the next sections.

Table 1.
Materials properties.
2.1. Surface Engraving of Al
As molten PP does not form chemical bonds to the metallic partner during the laser joining process, laser joining without any surface treatment is not feasible. Therefore, before implementing the joining for Al-PP, the surface of either one must be modified to provide a reliable mechanical performance of the assembly. In this paper, the surface engraving of Al by laser is analyzed and optimized. Laser engraving allows the creation of grooves in the aluminum, where the polypropylene melts into, creating interlocking upon solidification. This means the polypropylene must reach the melting temperature but not exceed the thermal degradation temperature. The width of the engraved area is 3 mm, which is constant for all samples. This value is the max width of the PP reaching a melting point under the defined laser joining process. It is achieved via a heat simulation in Inventor Nastran 2022 and confirmed by preliminary experimental tests. Figure 1 shows an overview of the engraving parameters and the equation to present the definition of density used in this paper.
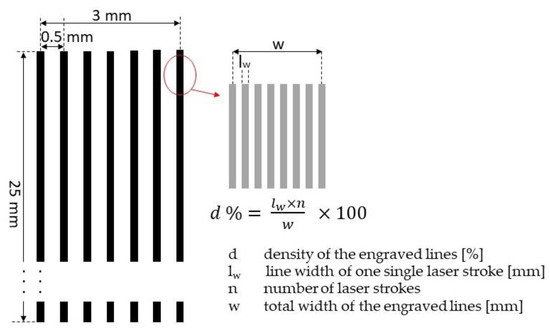
Figure 1.
Overview of laser engraving area and lines for Al samples including the corresponding parameters regarding the density of engraved lines.
To achieve the engraving, a PW Trumark 6130 laser machine (Trumpf, Ditzingen, Germany) was used. Parameters influencing the joint were the depth of the grooves, the dimensions of the engraving, and the shape of the grooves. These were influenced by the laser speed, the laser path, and the density of the engraved lines.
2.2. Joining Process
The joining process was realized by the laser conduction joining, which can be used by applying the laser on the Al surface and having the heat dissipate to the PP. The laser should hit the back side of the engravement leading to the molten PP filling the grooves. For the joining process, different factors were important to be optimized such as temporal and spatial modulations of the laser beam that define the temperature of the PP surface and the occurrence of thermal degradation.
For the joining process, a TruFiber 400 equipped with Scanlab HS20 2D f-ϴ scanner head is used. Figure 2 shows the details of the overlap configuration between Al and PP before the joining process, in addition to the modeled interlocking. An overlap of 25 mm was selected, following ASTM D5868-01 (2014) [23]. The clamping force was kept constant for all samples, and the focal point of the laser beam was fixed on the surface of Al samples.
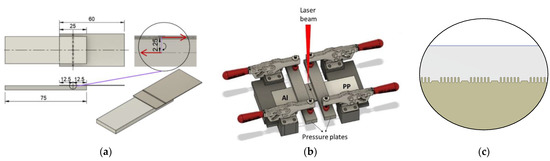
Figure 2.
Setup and dimensions of the joined samples (a,b); zoom on the joint and modeled interlocking (c).
Wobbling in a forward-moving circular motion (as described by Equation (1)) was selected (see Figure 3) for the beam’s trajectory. Unlike a simple linear path, this allows for a wider weld while guaranteeing a uniform heat transfer from Al to the PP surface to examine the effect of mechanical interlocking.
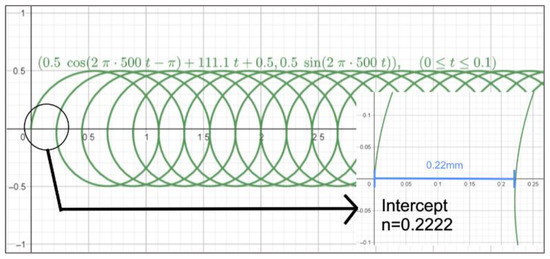
Figure 3.
Selected beam trajectory for the joining process.
- a amplitude of the circular movement (radius) (mm)
- f repetition frequency (Hz) (fixed 500 Hz)
- v feed rate in x (horizontal) direction (mm/s).
Based on [24], the circular wobbling was optimized when the overlap (as described by Equation (2)) was 0.75. This overlap led to the feed rate of 111.1 mm/s for the laser beam in the x (horizontal) direction.
- n overlap giving a ratio of the covered area by the wobbling.
- a amplitude of the circular movement (radius) (mm)
- f repetition frequency (Hz) (fixed 500 Hz)
- v feed rate in x (horizontal) direction (mm/s).
To minimize heat accumulation, reduce the output intensity, and avoid degradation of PP, power modulation was used. Therefore, a more uniform heat transmission along the joining area was achieved. Equation (3) represents the power modulation. Preliminary experiments showed that approximately 290 W of power was appropriate for the joining process. Thus, to optimize the engraving parameters, the power of 290 W was considered for the experiments. In Section 3.3.2, the effect of modulated power on the joint quality will be addressed separately.
- Pmod modulated power obtained by pulsing a CW (W)
- tmod duration of the pulse (s)
- fmod frequency of the pulses (Hz)
- Pp max power of the CW (W)
Evaluation of the mechanical performance of the joints was implemented by a tensile-shear test with a fixture to avoid the bending of the samples due to the offset (see Figure 2a) between the PP and Al. This fixture was made of a low-friction carbon fiber composite and only applies a pure tensile shear force on the sample. The tests were all executed at an equal speed of 2 mm/min. Figure 4 shows the tensile-shear tests with and without the designed clamp.
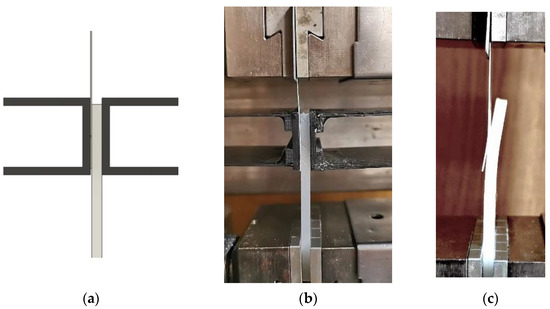
Figure 4.
3D modeled tensile test (a); tensile test with clamp (b); tensile test without clamp (c).
2.3. Optimization of the Process
Before optimizing the process, the pattern of engravement needs to be fixed. Two different engraving patterns were analyzed, called the dot pattern and the line pattern, as seen in Figure 5. For this, a Finite Element Analysis (FEA) with Inventor Nastran 2022 (software) was applied on the Al surface to both patterns under the same conditions (load, pattern dimensions, etc.). The pattern with the better stress distribution was then chosen for the DoE, and these results were verified by testing. The mindset is to minimize the weakening of Al for the mechanical test.
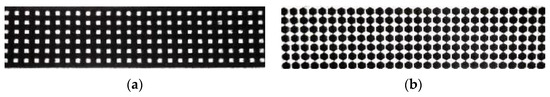
Figure 5.
Line pattern (a); dot pattern (b).
Optimization for engraving was performed by a Design of Experiment (DoE), using the Design Expert 13 software and optical microscopic observation, to understand the influence of the engraving speed, density, and width of the engraved lines. The input parameters for DoE are presented in Table 2.
Table 2.
Input Parameters of the DoE.
2.4. Mechanical Testing
To evaluate the strength of the joint, a tensile-shear test was performed for each setup and given back to the DoE software (Design Expert 13). All the values of Table 2 were used by the software to create a regression model, giving a good visual representation of the influence of each parameter for laser engraving of Al. Finally, to find the optimal laser power for joining, several tensile-shear tests with microscopic observation, and modifying the parameters of the power modulation were implemented. Avoiding thermal degradation, but, also, melting enough PP, is thus possible. It should be noted that the reported values for tensile-shear tests are the average of at least five independent measurements for each sample.
3. Results and Discussions
3.1. Mechanical Simulation
As discussed in Section 2, the tensile-shear test is implemented by using a fixture to confine the bending of samples during the test. Figure 6 shows the comparison of the tensile-shear test simulation with and without the fixture.
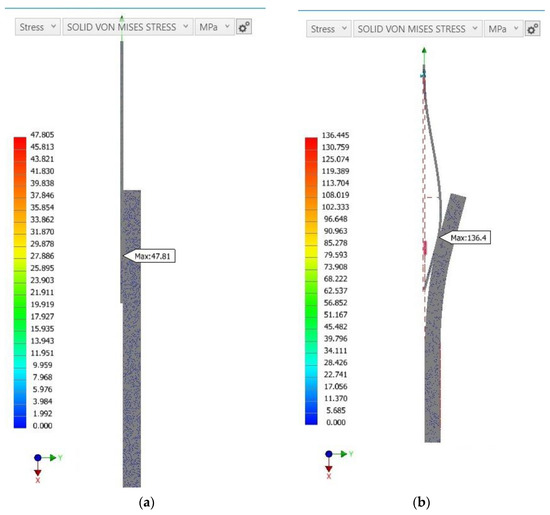
Figure 6.
Comparison of tensile test with fixture (a); and without fixture (b), regarding Von Mises stress (MPa) distribution.
In the practical part, the simulation also shows a clear bending when doing the tensile-shear test. The stresses in the teeth are not as important as they will redistribute once deformed; however, the stress also clearly increases in the cross-section due to the bending moment. Consequently, the aluminum breaks at lower forces.
In the absence of the fixture, it can be observed that the Al reaches critical stress in the cross-section propagating from the engraving, which is likely where failure will occur (see Figure 7). Figure 8 shows the simulation of stress distribution for dot and line patterns. Comparing both engravement patterns, a difference in stress distribution can be observed. The dot pattern has a better stress distribution and lower peak stress leading to the decision to keep the dot pattern for the DoE.
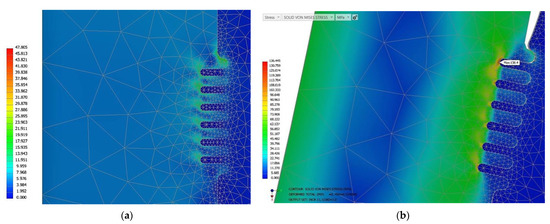
Figure 7.
Zoomed comparison between: with fixture (a) and without fixture (b), regarding Von Mises stress (MPa) distribution.
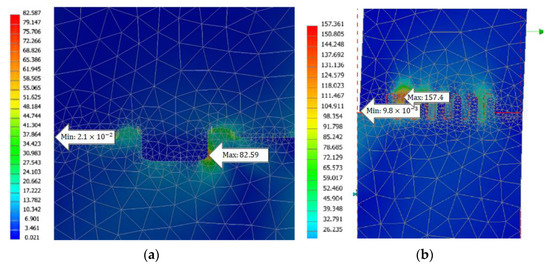
Figure 8.
Simulation of two patterns under the same load and constraints; the example with the dot pattern (a); and the other with the line pattern (b), regarding Von Mises stress (MPa) distribution.
3.2. Design of Experiment
Table 3 is used as an input for the DoE based on the Box–Behnken method. A total number of 17 tests were performed for the DoE to find a regression model for the shear load or breaking force followed by optimization of the laser-engraving process concerning the given parameters. The parameters and the corresponding levels (introduced in Table 2) were chosen based on the preliminary experiments and screening tests.
Table 3.
Test runs are to be performed in addition to the corresponding results.
Table 4 presents the ANOVA (Analysis of Variance) of the model. A quadratic regression after backward elimination of the high-order interactions and linear terms presents a good model to fit the data.
Table 4.
ANOVA for the reduced quadratic model of the shear load.
For the given ANOVA table, R2 is 0.8779, adjusted R2 is 0.8046, and predicted R2 is 0.6900. Equation (4) describes the actual regression equation of the model for the shear load. As observed, based on the p-values, speed, width of engraved lines, linear interaction of density and speed, and square terms of density and width are significant parameters. However, density is insignificant. Nevertheless, to respect the hierarchy in the model, density cannot be eliminated. Equation (4) shows the regression equation for the shear load based on the presented DoE.
Figure 9 shows the normal plot of the residuals and the desirability ramp for the optimum parameters. As observed, the optimum condition that maximizes the shear load or breaking force is achieved at 27.3% density, 0.28 width, and 60 mm/s speed of the laser-engraving process. For the best combination of the parameters in DoE, a shear load of above 1400 N will be achieved.
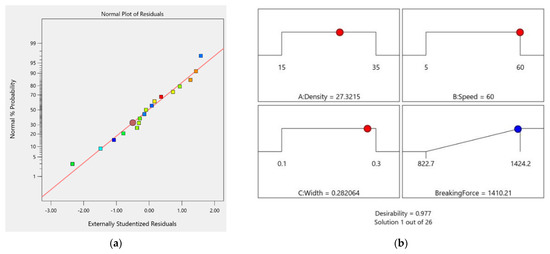
Figure 9.
The normal plot of residuals (a); desirability ramp for the optimum parameters of the DoE (b).
Table 5 shows the confirmation test for three runs at 25% density, 32.5 mm/s speed, and 0.2 mm width of the engraved lines. The three different runs with the given process parameters of laser engraving resulted in 1250.6, 1285, and 1176.2, which present a mean value of 1237.27.
Table 5.
Confirmation test of the DoE. Two-sided Confidence = 95%.
To sum up, considering miscellaneous parameters, including the p-values, R2, the difference between predicted and adjusted R2, normal distribution of the residuals, and a confirmation test, the model is confirmed.
Figure 10 shows contour and 3D surface plots for shear load versus different combinations of the parameters presenting optimum conditions. It can be seen that the domain of the speed could benefit from being expanded upwards as the best-expected result given by the software is at the max speed.
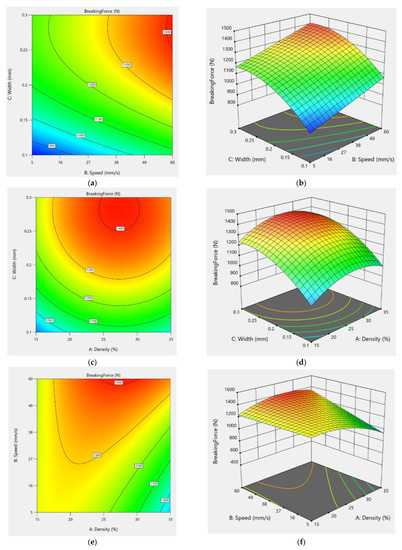
Figure 10.
Contour graph based on DoE for the speed and line width with the density of 27.3% (a); the corresponding 3D surface plot (b), contour graph of the density and the line width at a high speed (60 mm/s) (c); the corresponding 3D surface plot (d); contour graph of the density and the speed with a line width of 0.28 mm (e); the corresponding 3D surface plot (f).
This can be due to the fact that the laser penetrates too deeply into the material at low speeds, creating unreachable cavities for the PP. Therefore, it is necessary to evaluate higher speeds after the optimization of the laser power for the joining process (it will be discussed in Section 3.3.3).
3.3. Testing
3.3.1. Microscopic Observation
The results found from the DoE and the simulations must be observed under the microscope to confirm the approximations. Figure 11 shows the cross-sections of the laser-engraved Al samples with different parameters.
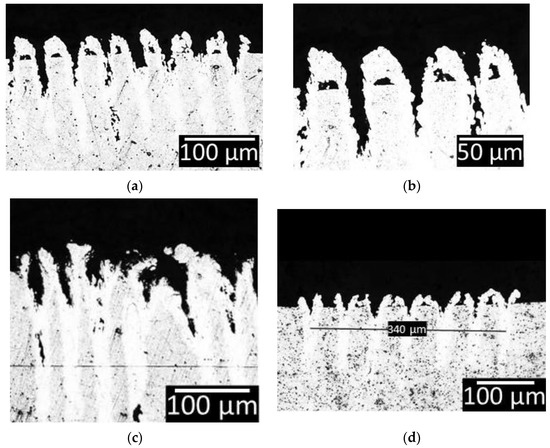
Figure 11.
Microscopic observation of the engravement at the density of 25% and a speed of 100 mm/s (a); zoom on the teeth (b); at a higher density of 35% and a low speed of 5 mm/s (c); high-speed 200 mm/s and low density of 15% (d).
Comparing different parameters presented in Figure 11 shows the influence of each one. While Figure 11a,b shows uniform teeth with 100 mm/s speed, and 25% engraving density, Figure 11c depicts a much more chaotic appearance where the molten PP will be hindered from properly flowing into. The low speed leads to promoting melting during the ablation process. Considering the evaporation of the material during the ablation process, deep grooves are achieved. However, melting is dominant; hence, cavities are formed by interfering with the molten material. A similar observation is present at the high density of the engraved lines (see Figure 12). The intersection between consecutive dot patterns results in processing the surface of Al several times at the overlapped locations. Consequently, in addition to deep grooves, cavities are formed, which are not open to the surface and, therefore, cannot be reached by the molten PP during the joining process.
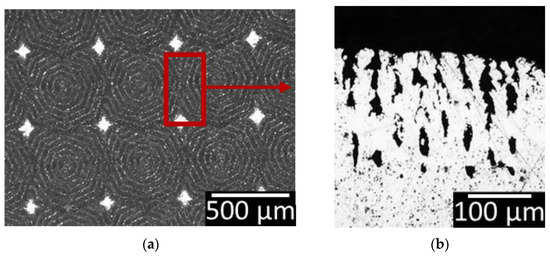
Figure 12.
Observations of intersections top view (a); and cross-section of the selected area (b).
In contrast, Figure 11d presents a sample with 200 mm/s speed and 15% laser engraving density. As observed, the combination of high speed and low engraving density results in a lower depth of engraving which reduces the mechanical interlocking and thus the shear load after the laser joining process.
The depth of the cavities is almost double compared to that of the grooves, but they do not contribute to the joining process. As a consequence, Al is further weakened without any added benefit to the joined assembly and thus should be avoided.
3.3.2. Power Optimization
The preliminary experiments and simulations with Nastran showed that approximately 290 W of power is appropriate for the joining process. Using Equation (3) and considering the pulse duration as the parameter, the power can be optimized, while the max power and frequency of the pulses are fixed.
The joints at different power levels were observed under the optical microscope. Figure 13 shows the common defects at the cross-sections of Al-PP joints. Figure 13a shows the grooves at the peripheral of the joint area which is not completely filled with PP. Such defects are also reported in [25]. It is due to the lack of wettability of the PP caused by the low temperature in that area. Therefore, there is not enough molten PP to completely fill the grooves, unlike the middle of the joints. This kind of defect is visible at power modulation below 300 W.
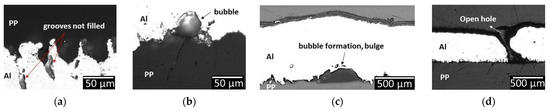
Figure 13.
Different cross sections of defects: hole (a); bubble (b); lack of wettability or unreachable cavities (c); and an open hole in Al due to excessive thermal decomposition of PP (d).
By increasing the modulated power to 290 and 300 W, the first indications of PP thermal decomposition appear in the form of a few small, separated bubbles with a diameter below 25 µm. The effect of these bubbles is to be further analyzed as the bubble formation can cause a pressure increase and thus improve the groove filling capability; however, at the same time, they will reduce the contact area and compromise the permeability of the joint (see Figure 13b).
At 310 W, the grooves at the peripherals are filled completely; however, some deformations in the form of bulges start to show up on the Al surface. The observation of cross sections shows underneath the bulge as there is no adhesion occurring due to the decomposition of PP, resulting in bubble formation (see Figure 13c).
Finally, at 320 W of modulated power and above, PP thermal degradation is more severe, based on Figure 13d. Due to the high power implemented for the laser joining process, the molten pool of Al reaches the interface of Al-PP, and the volume of the gaseous product of PP thermal decomposition is high enough to push out the Al melt pool. In other words, the bulge explodes, leading to an open hole in the surface of Al.
At a power modulation of 280 W, an ideal uniform, joint cross-section without PP degradation is observed as shown in Figure 14a,b. However, as mentioned earlier, the whole potential of the engravement is not used as the outer grooves are barely filled. Figure 14c shows the cross section corresponding to 310 W and above. It is worth mentioning that the samples in Figure 14 were etched with Keller’s reagent (5 mL Nitric acid, 3 mL Hydrochloric acid, 2 mL Hydrofluoric acid, 190 mL distilled water) to distinguish the size of the Al melt pool.
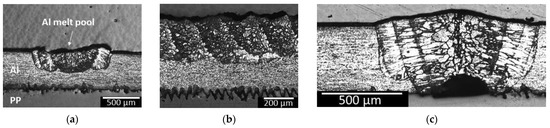
Figure 14.
Cross-section of the weld area in transversal direction (a); and longitudinal direction (b); at the modulated power of 280 W; cross-section of the weld area in transversal direction at the modulated power of 310 W (c).
3.3.3. Tensile-Shear Test
Figure 15 shows the result of the tensile-shear test for laser-joined samples with different modulated powers. It should be noted that the results of the tests are reported in max shear load; therefore, by increasing the power, the joints show higher loads due to the increase in the joint area until a certain point where the extensive degradation of the materials shows a negative effect that cannot be compensated for by increasing the joint area anymore. Therefore, in the case of small, separated bubbles, which were reported for 290 and 300 W modulated power, the shear load of the joints was not significantly affected, and an increasing trend was observed as a result of increasing the joint area. However, by the escalation of PP thermal decomposition in the form of bulges or through holes (310 W and above), the shear load of the joint decreased. Such a trend was also observed in the case of Al-to-polyamide laser joining [15]. More evaluations on the presence of small bubbles need to be performed in order to identify their effect on the performance of the joints. In general, the max shear strength achieved between Al and PP is approximately 20 MPa. Table 6 presents different types of failure during the tensile-shear tests.
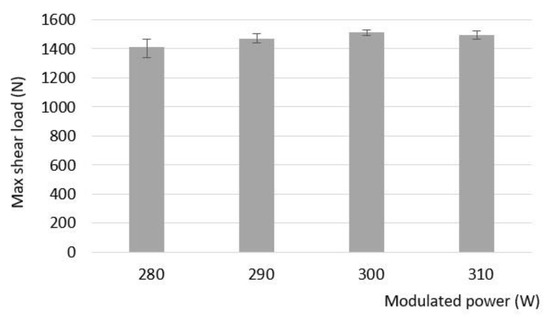
Figure 15.
The result of tensile-shear tests measuring the maximum force in the function of the modulated power.
Table 6.
Different failure modes of the PP-Al joint.
In addition to the modulated power, the mentioned failures are tightly linked with the engraving speed, as seen in Figure 16. As already discussed in Section 3.2, a higher range of speed needs to be evaluated together with the optimized laser power for the joining process. In other words, the ultimate optimum point should be achieved where the weakening of Al due to the laser engraving process is minimized while the engraves are effectively filled with PP with minimum thermal decomposition.
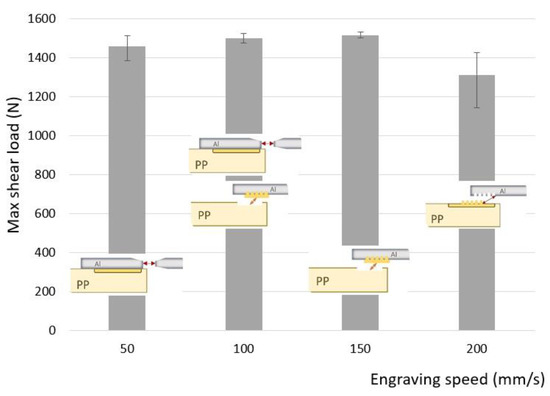
Figure 16.
Maximum shear load in the function of the engraving speed (mm/s) with the different failure modes.
For the experiments resulting in Figure 16, the modulated power of 300 W is implemented as it showed the highest shear load (see Figure 15).
At the low engraving speed of 50 mm/s, losing the Al cross section is quite considerable due to the presence of deep grooves or cavities discussed in Section 3.3.1. At the range of 100 to 150 mm/s, the optimum range is achieved, which is compensated for between weakening the Al and promoting the mechanical interlocking between Al and PP. Finally, from 200 mm/s onward, the damage on the Al is significantly reduced, however, at the expense of mechanical interlocking.
4. Conclusions
Based on this study on the laser joining of aluminum to polypropylene, several conclusions can be made:
- Laser joining of Al to PP is not feasible without pre-treatment processes. Laser engraving a pattern on the Al surface greatly increases the joining capacity by mechanical interlocking for the tensile-shear configuration.
- Several factors influence joint strength. They can be categorized into laser engraving and laser joining parameters. For engraving, line width, density, and speed influence the pattern and tooth dimensions for the purpose of mechanical interlocking. While for joining, an optimized combination of spatial and temporal modulations of the beam improves the weld quality by minimizing the PP thermal degradation.
- Modulated power presents a direct relationship with the depth of the Al melt pool and, consequently, PP thermal degradation. With the setup and configuration used for this study, 280 W of modulated power is the threshold of PP not being thermally decomposed. At 290 and 300 W, PP degrades in the form of small, separated bubbles with less than 25 µm in diameter, and the degradation of PP is escalated at 310 W and above, which significantly challenged the permeability and mechanical performance of the joints.
- The optimum engraving line width and density are 0.28 mm and 27.3%, respectively, to promote the mechanical interlocking between PP and Al. At a higher density, Al is damaged in the form of deep cavities that do not contribute to the joining process.
- The optimum engraving speed is 150 mm/s. Low speeds act similarly to high density and make Al prone to failure due to losing the cross-section.
- Finally, with the optimum setup for this study, a load of 1500 N, which corresponds to a strength of 20 MPa, is achieved for laser joining of 0.5 mm thick Al to natural PP. This optimum setup addresses the minimum weakening of the Al, regarding the mechanical performance, due to the laser engraving process, while the engraves are filled with PP in the presence of minimum thermal degradation.
- Achieving such a mechanical performance in LAMP joining via the development of mechanical interlocking for PP as a non-polar polymer can provide different applications in the automotive and packaging industries. It is worth mentioning that laser-based surface engraving with PW lasers is a fast, robust, and reliable process for such applications. However, the mechanical degradation of the metallic partner due to the loss of cross section should be addressed with some solutions such as using high-strength alloys.
Author Contributions
Methodology, M.A.E.; Software, A.M.; Validation, M.A.E. and A.M.; Formal analysis, A.M.; Investigation, A.M.; Resources, P.P.; Writing—original draft, M.A.E. and A.M.; Writing—review & editing, M.A.E.; Visualization, A.M.; Supervision, M.A.E. and P.P.; Project administration, M.A.E. All authors have read and agreed to the published version of the manuscript.
Funding
This research received no external funding.
Institutional Review Board Statement
Not applicable.
Informed Consent Statement
Not applicable.
Data Availability Statement
Data is contained within the article.
Conflicts of Interest
The authors declare no conflict of interest.
References
- Gibson, P.C.; Matope, S. The Lighter the Better: Weight Reduction in the Automotive Industry and its Impact on Fuel Consumption and Climate. In Proceedings of the 2nd African International Conference on Industrial Engineering and Operations Management, Harare, Zimbabwe, 7–10 December 2020. [Google Scholar]
- Palazzo, J.; Geyer, R. Consequential life cycle assessment of automotive material substitution: Replacing steel with aluminum in production of north American vehicles. Environ. Impact Assess. Rev. 2019, 75, 47–58. [Google Scholar] [CrossRef]
- Krishna, G.V.; De, T.N.; Burman, R.K.; Sekhar, B.V.; Rao, V.G. Numerical and experimental comparative study of Aluminum and hybrid mounting interfaces of launch vehicle avionics for weight reduction. Procedia Struct. Integr. 2019, 14, 820–829. [Google Scholar] [CrossRef]
- Katayama, S.; Kawahito, Y. Laser direct joining of metal and plastic. Scr. Mater. 2008, 59, 1247–1250. [Google Scholar] [CrossRef]
- Magnus, C. Feasibility Study of Metal to Polymer Hybrid Joining. Master’s Thesis, Lappeenranta University of Technology, Lappeenranta, Finland, 2012. [Google Scholar]
- Tripathi, D. A Practical Guide to Polypropylene; Rapra Technology Limited: Shropshire, UK, 2002; pp. 1–5. [Google Scholar]
- Sato, T.; Ise, S.; Horiuchi, S.; Akiyama, H.; Miyamae, T. Influences of low-temperature ambient pressure N2 plasma and flame treatments on polypropylene surfaces. Int. J. Adhes. Adhes. 2019, 93, 102322. [Google Scholar] [CrossRef]
- Schricker, K.; Bergmann, J.P. Temperature- and Time-Dependent Penetration of Surface Structures in Thermal Joining of Plastics to Metals. Key Eng. Mater. 2019, 809, 378–385. [Google Scholar] [CrossRef]
- Mortazavi, M.; Nosonovsky, M. A model for diffusion-driven hydrophobic recovery in plasma treated polymers. Appl. Surf. Sci. 2012, 258, 6876–6883. [Google Scholar] [CrossRef]
- Lambiase, F.; Genna, S. Experimental analysis of laser assisted joining of Al-Mg aluminium alloy with Polyetheretherketone (PEEK). Int. J. Adhes. Adhes. 2018, 84, 265–274. [Google Scholar] [CrossRef]
- Engelmann, C.; Eckstaedt, J.; Olowinsky, A.; Aden, M.; Mamuschkin, V. Experimental and simulative investigations of laser assisted plastic-metal-joints considering different load directions. Phys. Procedia 2016, 83, 1118–1129. [Google Scholar] [CrossRef]
- Rodríguez-Vidal, E.; Sanz, C.; Lambarri, J.; Quintana, I. Experimental investigation into metal micro-patterning by laser on polymer-metal hybrid joining. Opt. Laser Technol. 2018, 104, 73–82. [Google Scholar] [CrossRef]
- Elahi, M.A.; Plapper, P. The durability of stainless steel-polyamide laser joined assemblies. Procedia CIRP 2022, 111, 475–478. [Google Scholar] [CrossRef]
- Heckert, A.; Zaeh, M.F. Laser Surface Pre-treatment of Aluminium for Hybrid Joints with Glass Fibre Reinforced Thermoplastics. Phys. Procedia 2016, 56, 1171–1181. [Google Scholar] [CrossRef]
- Elahi, M.A.; Koch, M.; Heck, M.; Plapper, P. Pre and post-treatments to improve weldability and mechanical properties of aluminum-polyamide laser welded specimens. Procedia CIRP 2020, 94, 537–541. [Google Scholar] [CrossRef]
- Bauernhuber, A.; Markovits, T. Laser assisted joining of metal pins and thin plastic sheets. Phys. Procedia 2012, 39, 108–116. [Google Scholar] [CrossRef]
- Bergmann, J.P.; Stambke, M. Potential of laser-manufactured polymer-metal hybrid joints. Phys. Procedia 2012, 39, 84–91. [Google Scholar] [CrossRef]
- Fuchs, A.N.; Wirth, F.X.; Rinck, P.; Zaeh, M.F. Laser-generated macroscopic and microscopic surface structures for the joining of aluminum and thermoplastics using friction press joining. Phys. Procedia 2014, 56, 801–810. [Google Scholar] [CrossRef]
- Zhang, Z.; Shan, J.; Tan, X.; Zhang, J. Improvement of the laser joining of CFRP and aluminum via laser pre-treatment. Int. J. Adv. Manuf. Technol. 2016, 90, 3465–3472. [Google Scholar] [CrossRef]
- Elahi, M.A.; Hennico, M.; Plapper, P. The effect of temperature and joining speed on the joining quality for conduction laser joining of metals to polymers. In Proceedings of the Lasers in Manufacturing (LiM) Conference, Munich, Germany, 21–24 June 2021. [Google Scholar]
- Hino, M.; Mitooka, Y.; Murakami, K.; Urakami, K.; Nagase, H.; Kanadani, T. Effect of Aluminum Surface State on Laser Joining between 1050 Aluminum Sheet and Polypropylene Resin Sheet Using Insert Materials. Mater. Trans. 2011, 52, 1041–1047. [Google Scholar] [CrossRef]
- Gisario, A.; Aversa, C.; Barletta, M.; Natali, S.; Veniali, F. Laser transmission welding of aluminum film coated with heat sealable co-polyester resin with polypropylene films for applications in food and drug packaging. Int. J. Adv. Manuf. Technol. 2022, 120, 2291–2309. [Google Scholar] [CrossRef]
- ASTM D5868; Standard Test Method for Lap Shear Adhesion for Fiber Reinforced Plastic (FRP) Bonding. ASTM International: West Conshohocken, PA, USA, 2014.
- Solchenbach, T. Laserbasiertes Schweißlöten von Artungleichen Aluminium-Kupfer-Verbindungen. Ph.D. Thesis, University of Luxembourg, Esch-sur-Alzette, Luxembourg, 2014. [Google Scholar]
- Amend, P.; Pfindel, S.; Schmidt, M. Thermal joining of thermoplastic metal hybrids by means of mono- and polychromatic radiation. Phys. Procedia 2013, 41, 98–105. [Google Scholar] [CrossRef]


Disclaimer/Publisher’s Note: The statements, opinions and data contained in all publications are solely those of the individual author(s) and contributor(s) and not of MDPI and/or the editor(s). MDPI and/or the editor(s) disclaim responsibility for any injury to people or property resulting from any ideas, methods, instructions or products referred to in the content. |
© 2023 by the authors. Licensee MDPI, Basel, Switzerland. This article is an open access article distributed under the terms and conditions of the Creative Commons Attribution (CC BY) license (https://creativecommons.org/licenses/by/4.0/).