Abstract
Defects in different positions and degrees in pile foundations will affect the building structure’s safety and the foundation’s bearing capacity. The efficiency and accuracy of using traditional methods to identify multi-defect types of pile foundations are very low, so finding suitable methods to improve their related indicators for pile foundation safety and engineering applications is necessary. In this paper, under the condition of secondary development of finite element software ABAQUS to obtain the time-domain signal database of six kinds of multi-defect pile foundations, a multi-defect type identification method of pile foundations based on two-channel convolutional neural network (TC-CNN) and low-strain pile integrity test (LSPIT) is proposed. Firstly, simulated time-domain signals of the dynamic measurements that match the experimental results performed wavelet packet denoising. Secondly, the 1D time-domain signals before and after denoising and the corresponding 2D wavelet time–frequency maps are inputs to retain more data information and prevent overfitting. Finally, TC-CNN achieved the multi-defect type identification of concrete piles. Compared with the single-channel convolutional neural network, this method can effectively fuse 1D and 2D features, extract more potential features, and make the classification accuracy reach 99.17%.
1. Introduction
Pile foundations are widely used in essential structures of highways, ports, bridges, and buildings because of their high load-bearing capacity, wide applications, and ability to adapt to various complex engineering address conditions. However, the influence of the construction process, geological conditions, and human factors lead to different types and degrees of defects in some pile foundations, which affects the bearing capacity of pile foundations. Currently, most of the research is about single-defect piles, and there are few studies on identifying multi-defect piles. Therefore, it is of guiding significance for formulating a pile foundation repair plan to accurately identify the type of multi-defect pile and complete the integrity test of the pile foundation. At present, Nerma Caluk et al. summarized various non-destructive testing methods, their advantages and disadvantages, and the latest progress, which is very enlightening for researchers who study and improve non-destructive testing technology [1]. LSPIT is widely accepted and used to evaluate the integrity of piles because of its simplicity, reliability, speed, and non-destructive characteristics [2]. The integrity test of more than 1800 bored piles was completed by a pile foundation non-destructive testing method at the light rail construction site in Nursultan city, of which LSPIT tested 55% [3]. The test using this method requires the application of an excitation force to the top of the pile, which generates an elastic wave propagating downward along the pile body. The presence of defects in the pile body causes a change in the cross-sectional impedance and generates a reflected wave. The velocity–time domain curve reflecting the pile defects can be obtained from the sensor placed on top of the pile [4]. However, when there are multiple defects in the pile foundation, the elastic wave will generate multiple reflections. It is more challenging to identify the type of multi-defect pile only by the velocity–time domain curve than the single-defect pile.
Lin Zhiyong has successfully applied deep learning technology to identify cast-in-place piles, effectively reducing the human and material resources required for monitoring [5]. However, there are still some limitations in some aspects. Pan Zidong et al. extracted features from the wavelet transform components of the time-domain signal as the input to an artificial neural network, which enabled the diagnosis of the location and extent of foundation pile defects [6]. However, the signal data were not denoised, and there was feature loss. Mou Shiminglin used wavelet analysis to denoise the signal, extracted features from the wavelet-packet-transformed components of the foundation pile dynamic measurement signal, and finally input these features into the artificial neural network for training and classification [7]. However, losting features during data processing leads to a long training time. Zhang Jianlin et al. proposed an artificial neural network model for pile foundation fault diagnosis using the response records of actual piles [8]. However, the training data set is too small to generalize. Cai Qiying extracted the power spectrum features of the time-domain signal using the fast Fourier transform (FFT), which was then fed into a BP neural network for defect-type detection [9]. Natalia Koteleva et al. proposed to use the signal spectrum feature points as input to an artificial neural network classifier to automatically interpret the results obtained from low-strain integrity tests [10].
Regarding the differentiation of defective features, it is vital to corroborate each other in the time and frequency domains [11]. However, the input data set of these methods only considers the time domain or frequency domain characteristics in a single way, which cannot fully reflect the defective characteristics of the pile for the multi-defective pile where the data set is already tiny. The joint time–frequency analysis method is better than the traditional single-domain analysis in explaining pile integrity [12]. As a time–frequency analysis method, wavelet transform can extract both time–frequency and frequency features using its multi-resolution analysis. It can portray the local features of the signal and provide more feature information for pattern recognition [13]. Refs. [14,15] compared the simulation results of the time-domain signal of pile foundation dynamic measurement with the actual measurement results to demonstrate the feasibility of processing the test signal with wavelet transform. Yu-Xiang Wu demonstrated that using wavelet transform to analyze the local features of the time–frequency domain signal could improve the interpretation accuracy of the abnormal segment of the pile foundation [16].
The field of signal recognition applied the superior feature extraction ability of the convolutional neural network (CNN). The traditional 2D-CNN is better at processing image-like 2D data [17]. LIU Weiping et al. trained CNN models using velocity time-domain images of pile foundations to achieve integrity classification of single-defect piles [18]. Chuan-Sheng Wu recombined 400 × 1 one-dimensional velocity signals of pile foundations and wavelet-transformed signals into 20 × 20 × 1 two-dimensional data as the input of 2D-CNN, which improves the performance and robustness of the CNN classifier [19]. The 1D-CNN is capable of one-dimensional processing data of time series class. Ref. [20] proposed a 1D-CNN model for raw environmental vibration signals, which can automatically extract the best damage-sensitive features from the raw acceleration signals for structural damage detection. Ref. [21] used a compact 1D-CNN to achieve online condition monitoring and severity identification of ball bearings. Xin Zhe Yuan used a 1D-CNN model to evaluate the comprehensive damage assessment after an earthquake [22].
Recently, other types of signal recognition have well used TC-CNN’s powerful and flexible feature extraction capability. However, the multi-defect identification of piles has not applied this feature extraction technology. Yufeng Qin input the rolling bearing vibration spectrum signal and the corresponding generalized S transform time–frequency diagram into 1D-CNN and 2D-CNN, respectively. Then the future fusion layer spliced feature vectors output by the two CNN models. Finally, under the data imbalance condition, the model obtained a better fault diagnosis effect and robustness [23]. Jianfeng Zheng takes the 1D time-domain features of the local discharge pulse and the corresponding wavelet time–frequency map as the input of TC-CNN, and then sends them to the classifier for classification. Finally, a model capable of identifying fault information is obtained [24].
This paper proposes a new method for identifying multi-defect types of concrete piles based on TC-CNN and LSPIT signals. After solving the problem of adaptive meshing of the multi-defect pile–soil model, the secondary development of finite element software can quickly obtain the time domain signals of multi-defect piles with different defect degrees. The time-domain signal is processed using the wavelet packet denoising technique. The 1D time-domain signal, before and after denoising, and the corresponding 2D wavelet time-frequency map are input to TC-CNN to retain more data information and prevent overfitting. This data processing operation taps more potential multi-defective pile features and improves classification accuracy.
2. Methods
2.1. Low-Strain Pile Integrity Test
LSPIT, a nondestructive testing technique with the advantages of simple operation, lightweight equipment, and low cost, has rapidly developed since the 1980s [25]. Sonic Echo (SE) and Impulse Response (IR) testing are two of LSPIT’s testing methodologies, and one-dimensional wave theory is the theoretical basis for their damage detection [26].
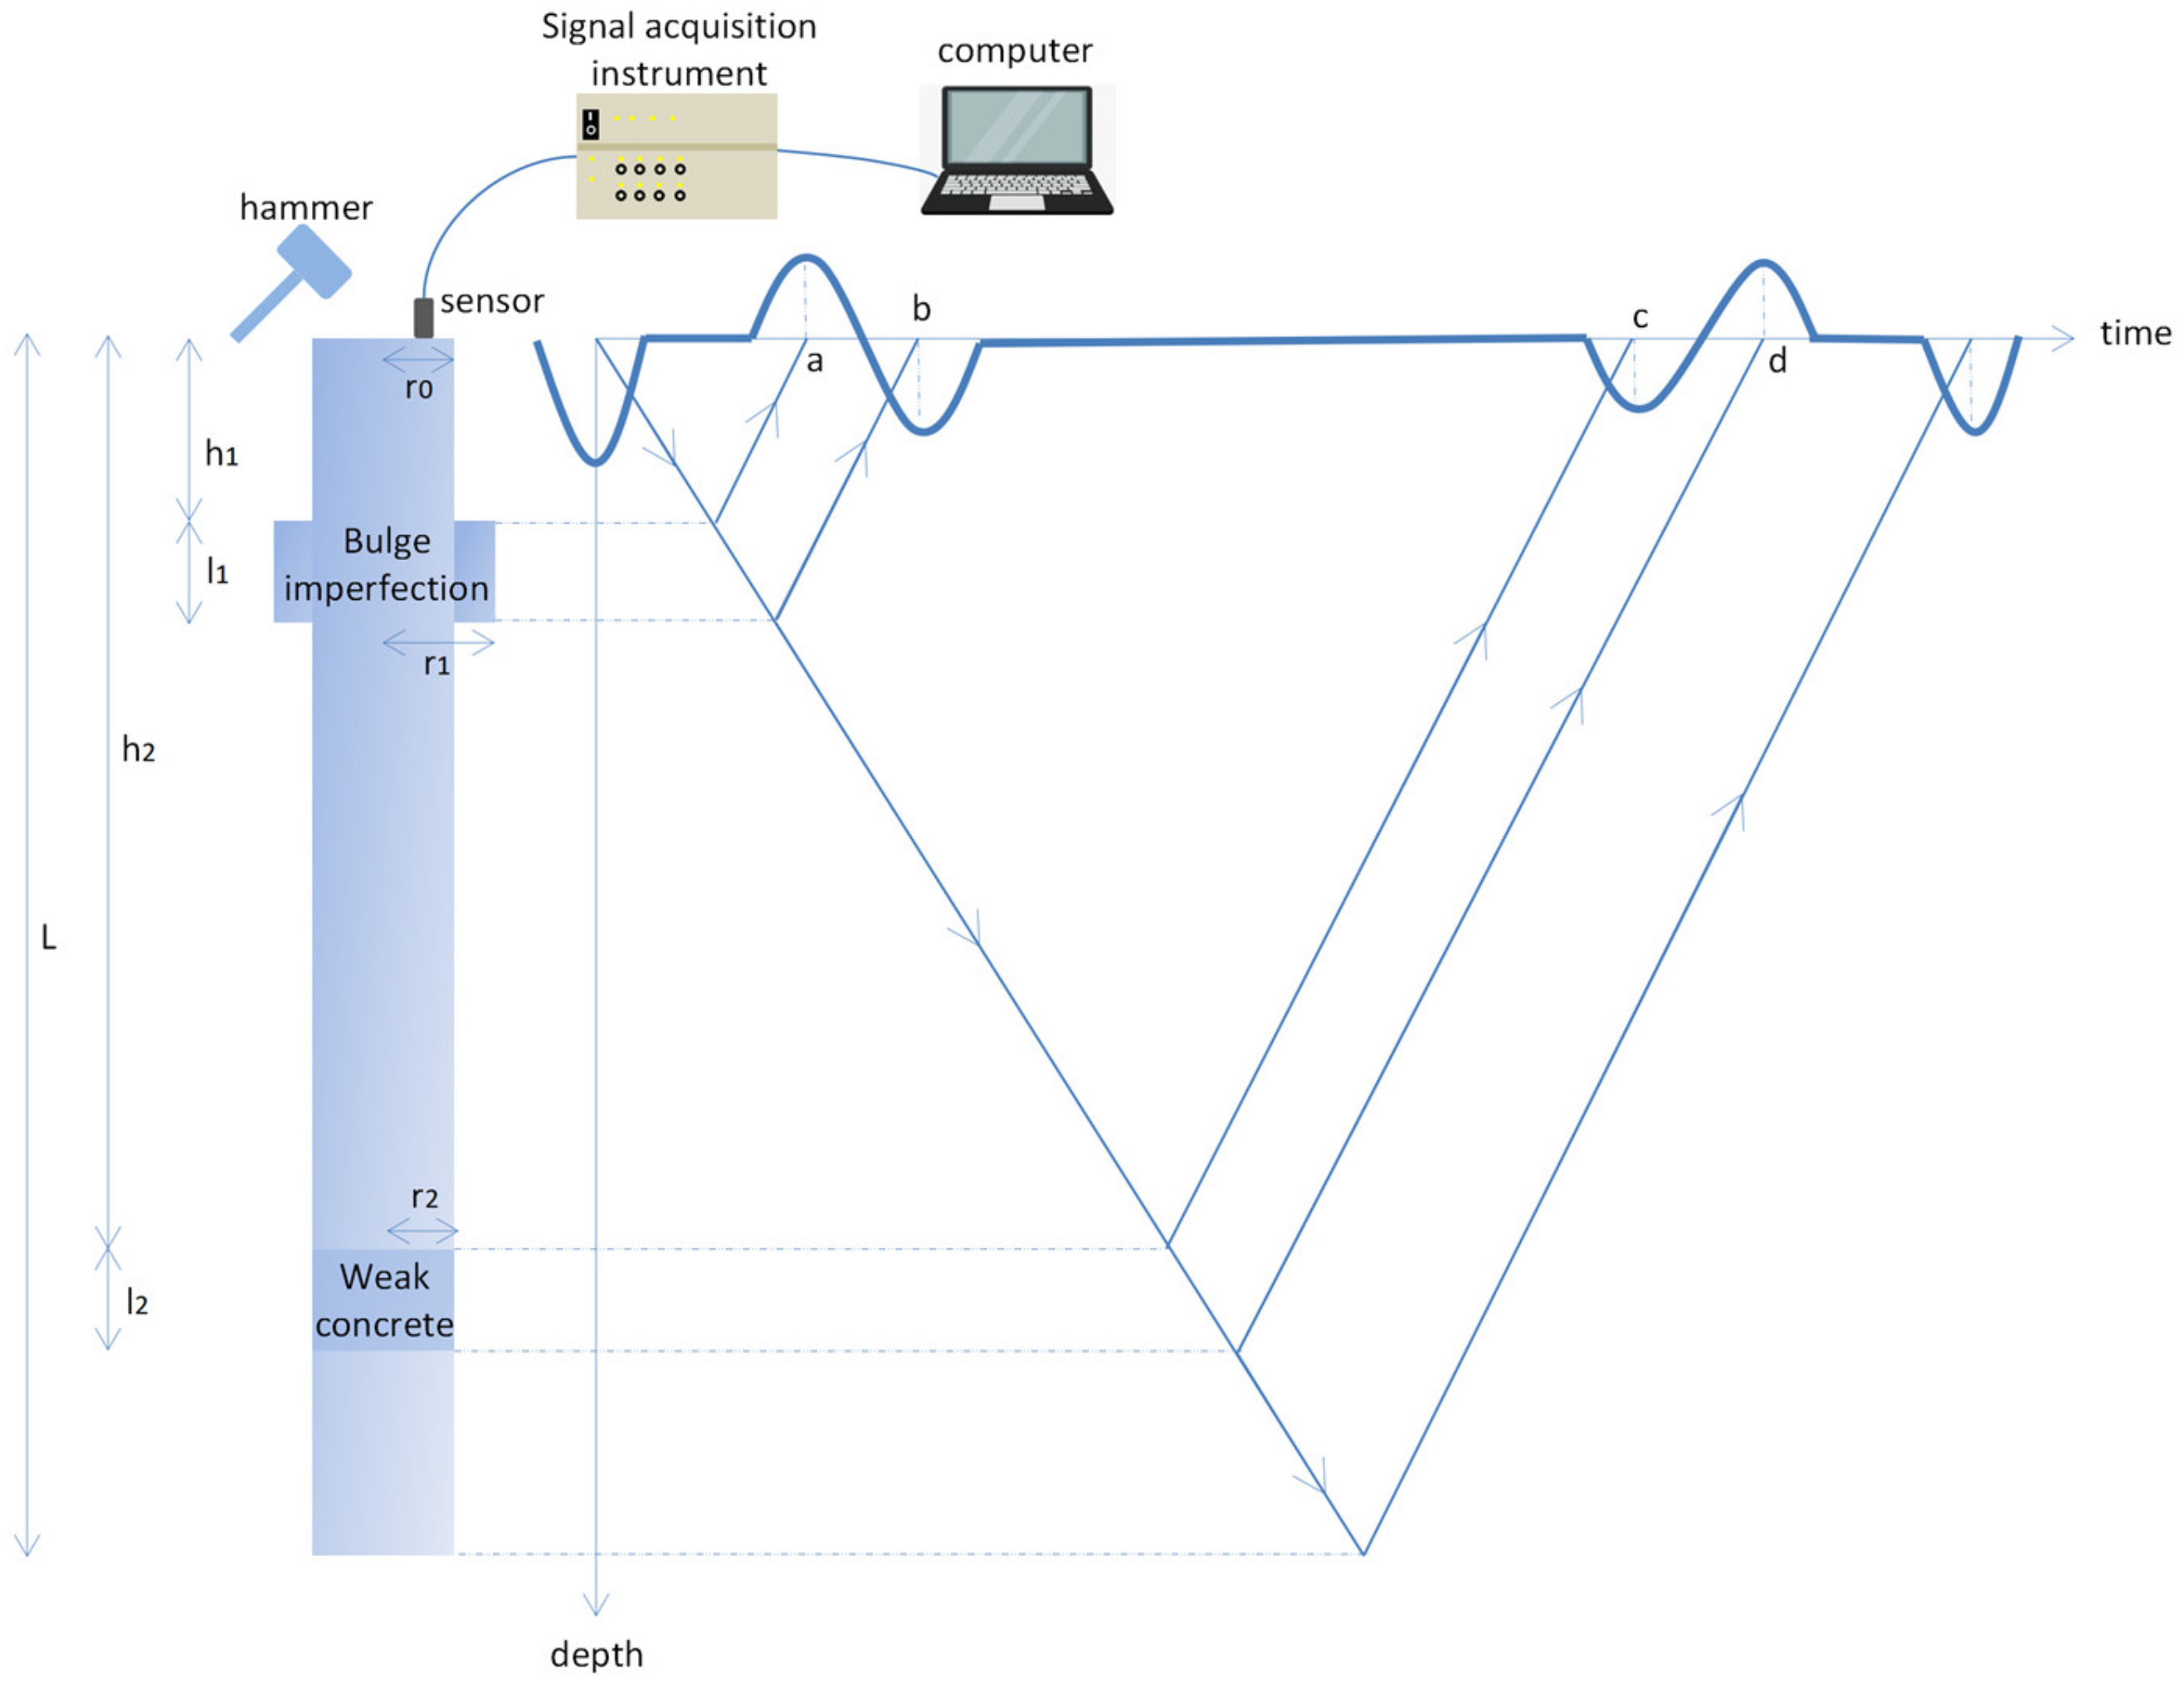
This study used the impulse response method. The hammer hits the pile head, causing the stress wave to propagate along the pile. When some defects in the pile body change the pile cross-sectional impedance, the stress wave reflects. Figure 1 shows the principle of LSPIT. A sensor placed at the top of the pile receives and collects the stress wave signal inside the pile, and analyzing this signal identifies pile defects (where r0: radius of the model pile, r1: radius of the first defect, r2: radius of the second defect, h1: distance of the first defect location from the top of the pile, h2: distance of the second defect location from the top of the pile, l1: length of the first defect, l2: length of the second defect, and L: pile length).
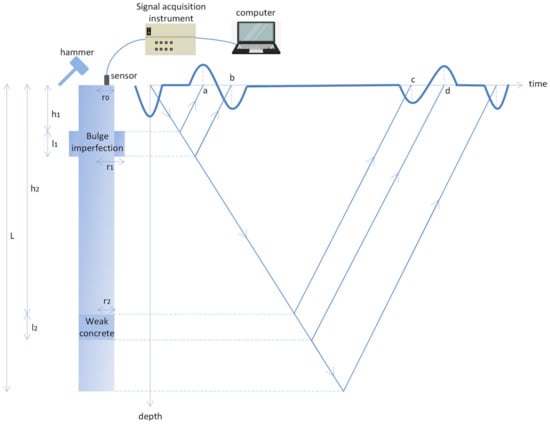
Figure 1.
Low-strain pile integrity test principle.
The pile can be reduced to a one-dimensional elastomer, presuming it is formed of a homogeneous material and has a length-to-slenderness ratio larger than or equal to 5 [27]. Consequently, the one-dimensional wave propagation equation can represent the stress wave propagation process (1).
where is the axial displacement of the mass point at depth and time . signifies the wave’s propagation velocity, obtained from Equation (2), with and standing for the pile material’s Young’s modulus and mass density, respectively.
If the pile met assumptions, the specified beginning circumstances [2] are introduced into Equation (1) to apply the one-dimensional wave propagation equation to examine the dynamic properties of the foundation pile. Following is the result of using the one-dimensional elastic rod equation of motion to derive the time domain curve of the base pile vibration velocity.
The pile defect is idealized as a break in the wave impedance, and the wave impedance Z is calculated as Z = EA/C, where A is the pile’s cross-sectional area. Impedance is a measure of how pile resistance changes with velocity; changes in both A and E cause impedance changes or discontinuities. When a stress wave encounters such a discontinuity, some of the stress waves are reflected, and some are transmitted. Z1 denotes the wave impedance of the entire section of the pile, and Z2 denotes the wave impedance of the defective section. Equation (4) is the relationship between the mass velocity of the reflected wave and the mass velocity of the incident wave [28].
2.2. Test Finite Element Analysis
2.2.1. Basic Theory and Modeling Parameters
Multi-defect identification of concrete piles required many defect pile signals for classifier training. However, it is impossible to obtain enough signal samples, even after spending a lot of time and effort in the experiment. Therefore, in this study, the ABAQUS 2020 version/explicit method was used to solve the dynamic response of piles under high-speed dynamic loading [29] and to build the multi-defective pile database required for TC-CNN.
Since the pile deformation by the excitation force during the LSPIT is small, the material parameters, Young’s modulus, and density changes are also small. Therefore, the time-domain curve of foundation pile vibration velocity is directly related to the pile geometry [30]. Typical pile foundation defects are weak concrete, neck defect, bulge imperfection, crack, and broken piles. With multiple defect combinations in various forms, LSPIT quickly identifies broken piles and challenges to identifying tiny cracks [31,32]. The situation of a double defect combination of weak concrete, a neck defect, and a bulge imperfection in a pile is the only one considered in this paper, which is the case where the original linear elastic structure remains linear after damage [30].
Cooke R. W., a person who has made outstanding contributions to the field of pile–soil research through the analysis of the experimental data of London clay soil, concluded that the size of shear displacement is almost negligible when the pile perimeter soil radius is about 10r0; for the actual project, the pile perimeter soil radius can meet the requirements when set to 5r0–6r0 [33], so the model size of this paper is following: the pile length L is 1.2 m, the pile radius r0 is 0.05 m, the pile perimeter soil size is 10r0 (0.5 m), and the soil at the bottom of the pile is 10r0 (0.5 m) along the axial depth of the pile. The material parameters of the model will affect the simulation effect of the velocity response curve, including the amplitude difference, the apparent degree of pile bottom reflection, and the accuracy of pile length measurement. Referring to relevant data [34], we made minor adjustments. The parameter settings of the model materials in this paper are shown in Table 1.

Table 1.
Material parameters of pile–soil model.
The sensor replaced the historical output history in ABAQUS, and the sensor position was placed at 2/3r0 to reduce the 3D effect [35]. The ascending cosine pulse shown in Equation (5) simulated the excitation force [36].
where Td = 0.2 ms, I = 0.0001 N·s, t = 0.1 ms, achieving the simulation of the experimental excitation force in Section 2.3.2.
Analysis step duration: The reflected wave must include the incident to the wave reflected from the pile bottom, and the length of the time recorded in the time-domain signal should continue not less than 5 ms after the 2L/ moment [37], and the preliminary estimate of the analysis step time is 2L/ = 0.68 ms, and the analysis step time is 1.2 ms. If the analysis step is too short, the simulation of the velocity response curve will be incomplete, affecting the data set’s quality.
The boundary conditions are: the soil around the pile is fixed in X and Y directions (U1 = U2 = 0), the bottom of the pile is fixed in X, Y, and Z directions (U1 = U2 = U3 = 0), and the top of the pile is not constrained.
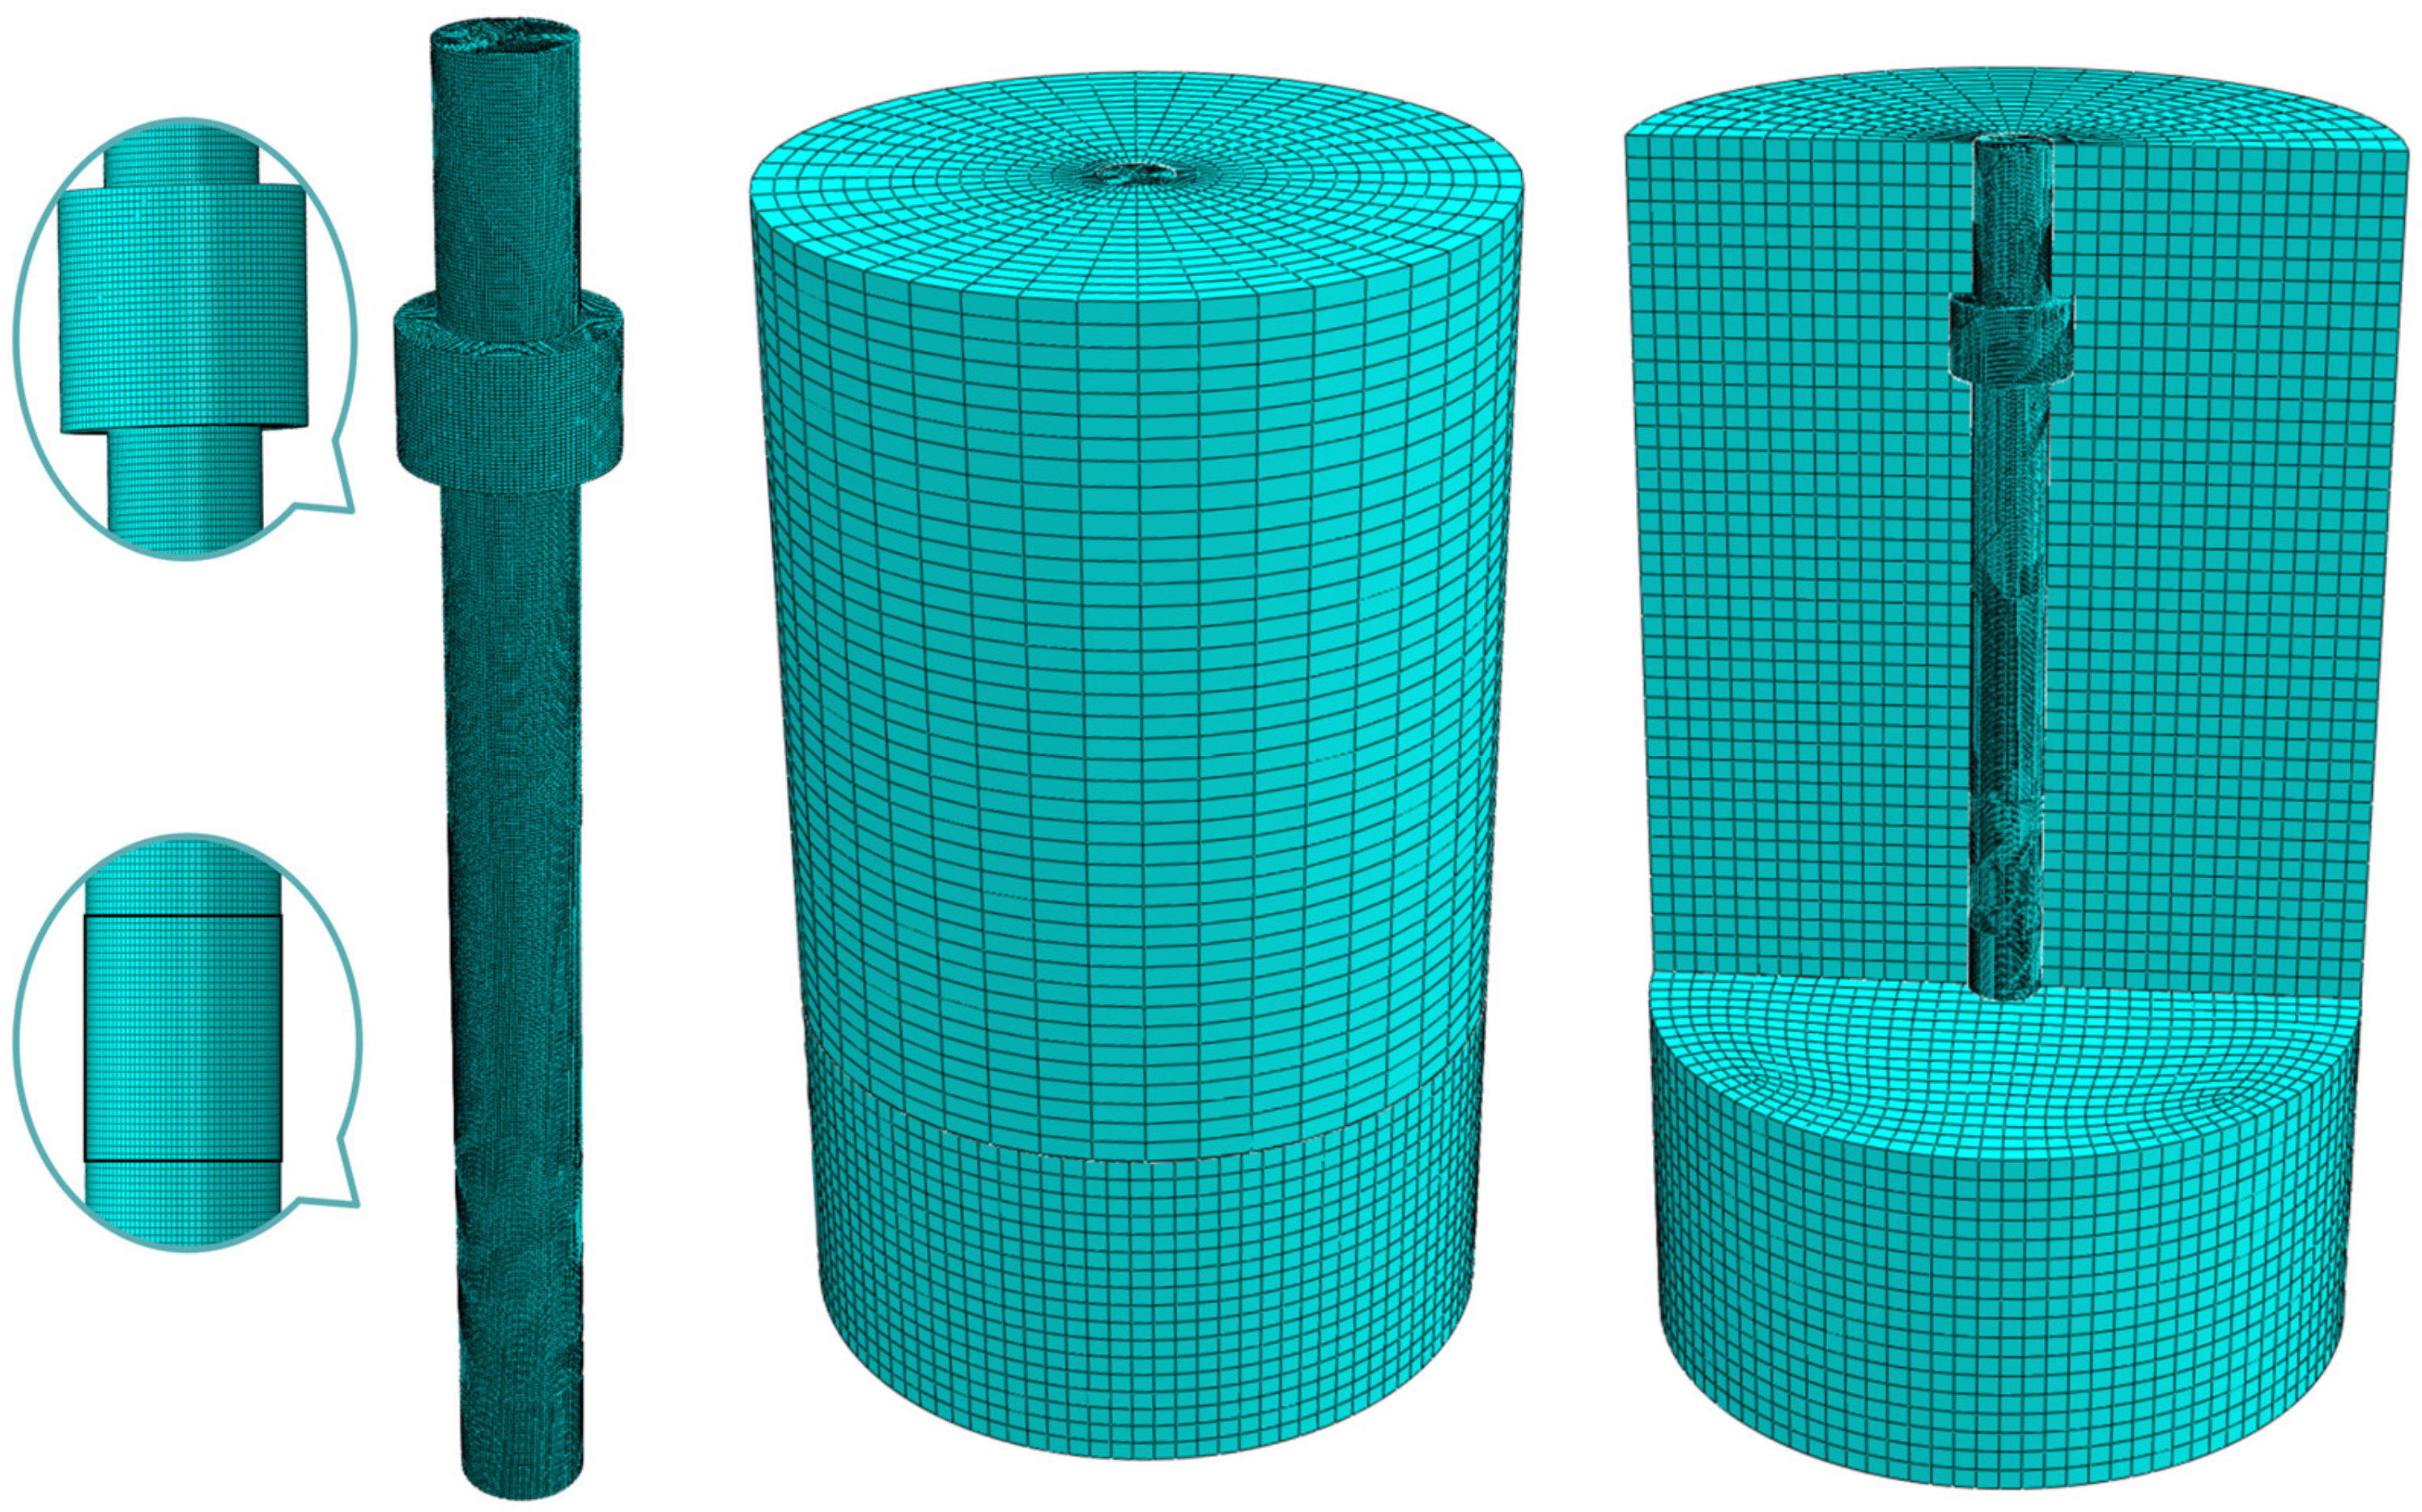
Grid division; since the model is only concerned with the displacement of the cell, the advantage of C3D8R (three-dimensional eight-node simplified integral cell) is that the results of the solution for the displacement are more accurate. According to the velocity of wave estimating grid size, bringing the pile–soil parameters into Equation (2) yields a wave velocity of 3535 m/s. The span of the impact load is more reasonable within ten cells. As (Td × )/10 = 0.07 m, the cell division is 0.03 m [36]. However, to overcome the sand leakage problem, the grid needs to become finer. Therefore, the pile cell size is encrypted and divided to 0.003 to meet the demand, and the finite element mesh model is shown in Figure 2 (take bulge imperfection–weak concrete defects as an example).
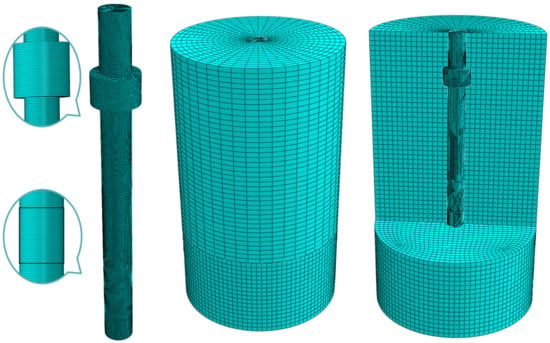
Figure 2.
Finite element mesh of pile and soil.
2.2.2. Obtaining Python Scripts for Batch Modeling by Recording Macro Files
In this paper, using a secondary development of ABAQUS based on the python language, an extensive database of defect piles can be quickly obtained from the finite element software. The ABAQUS software uses the Python script recording tool (Macro Manager) to record any section of the operation step code. Repeated steps in the operation can directly run this part of the code. After quickly obtaining most of the script code, the operator can add, delete, modify, and reorganize the obtained script. The final script that meets the production needs is obtained [38].
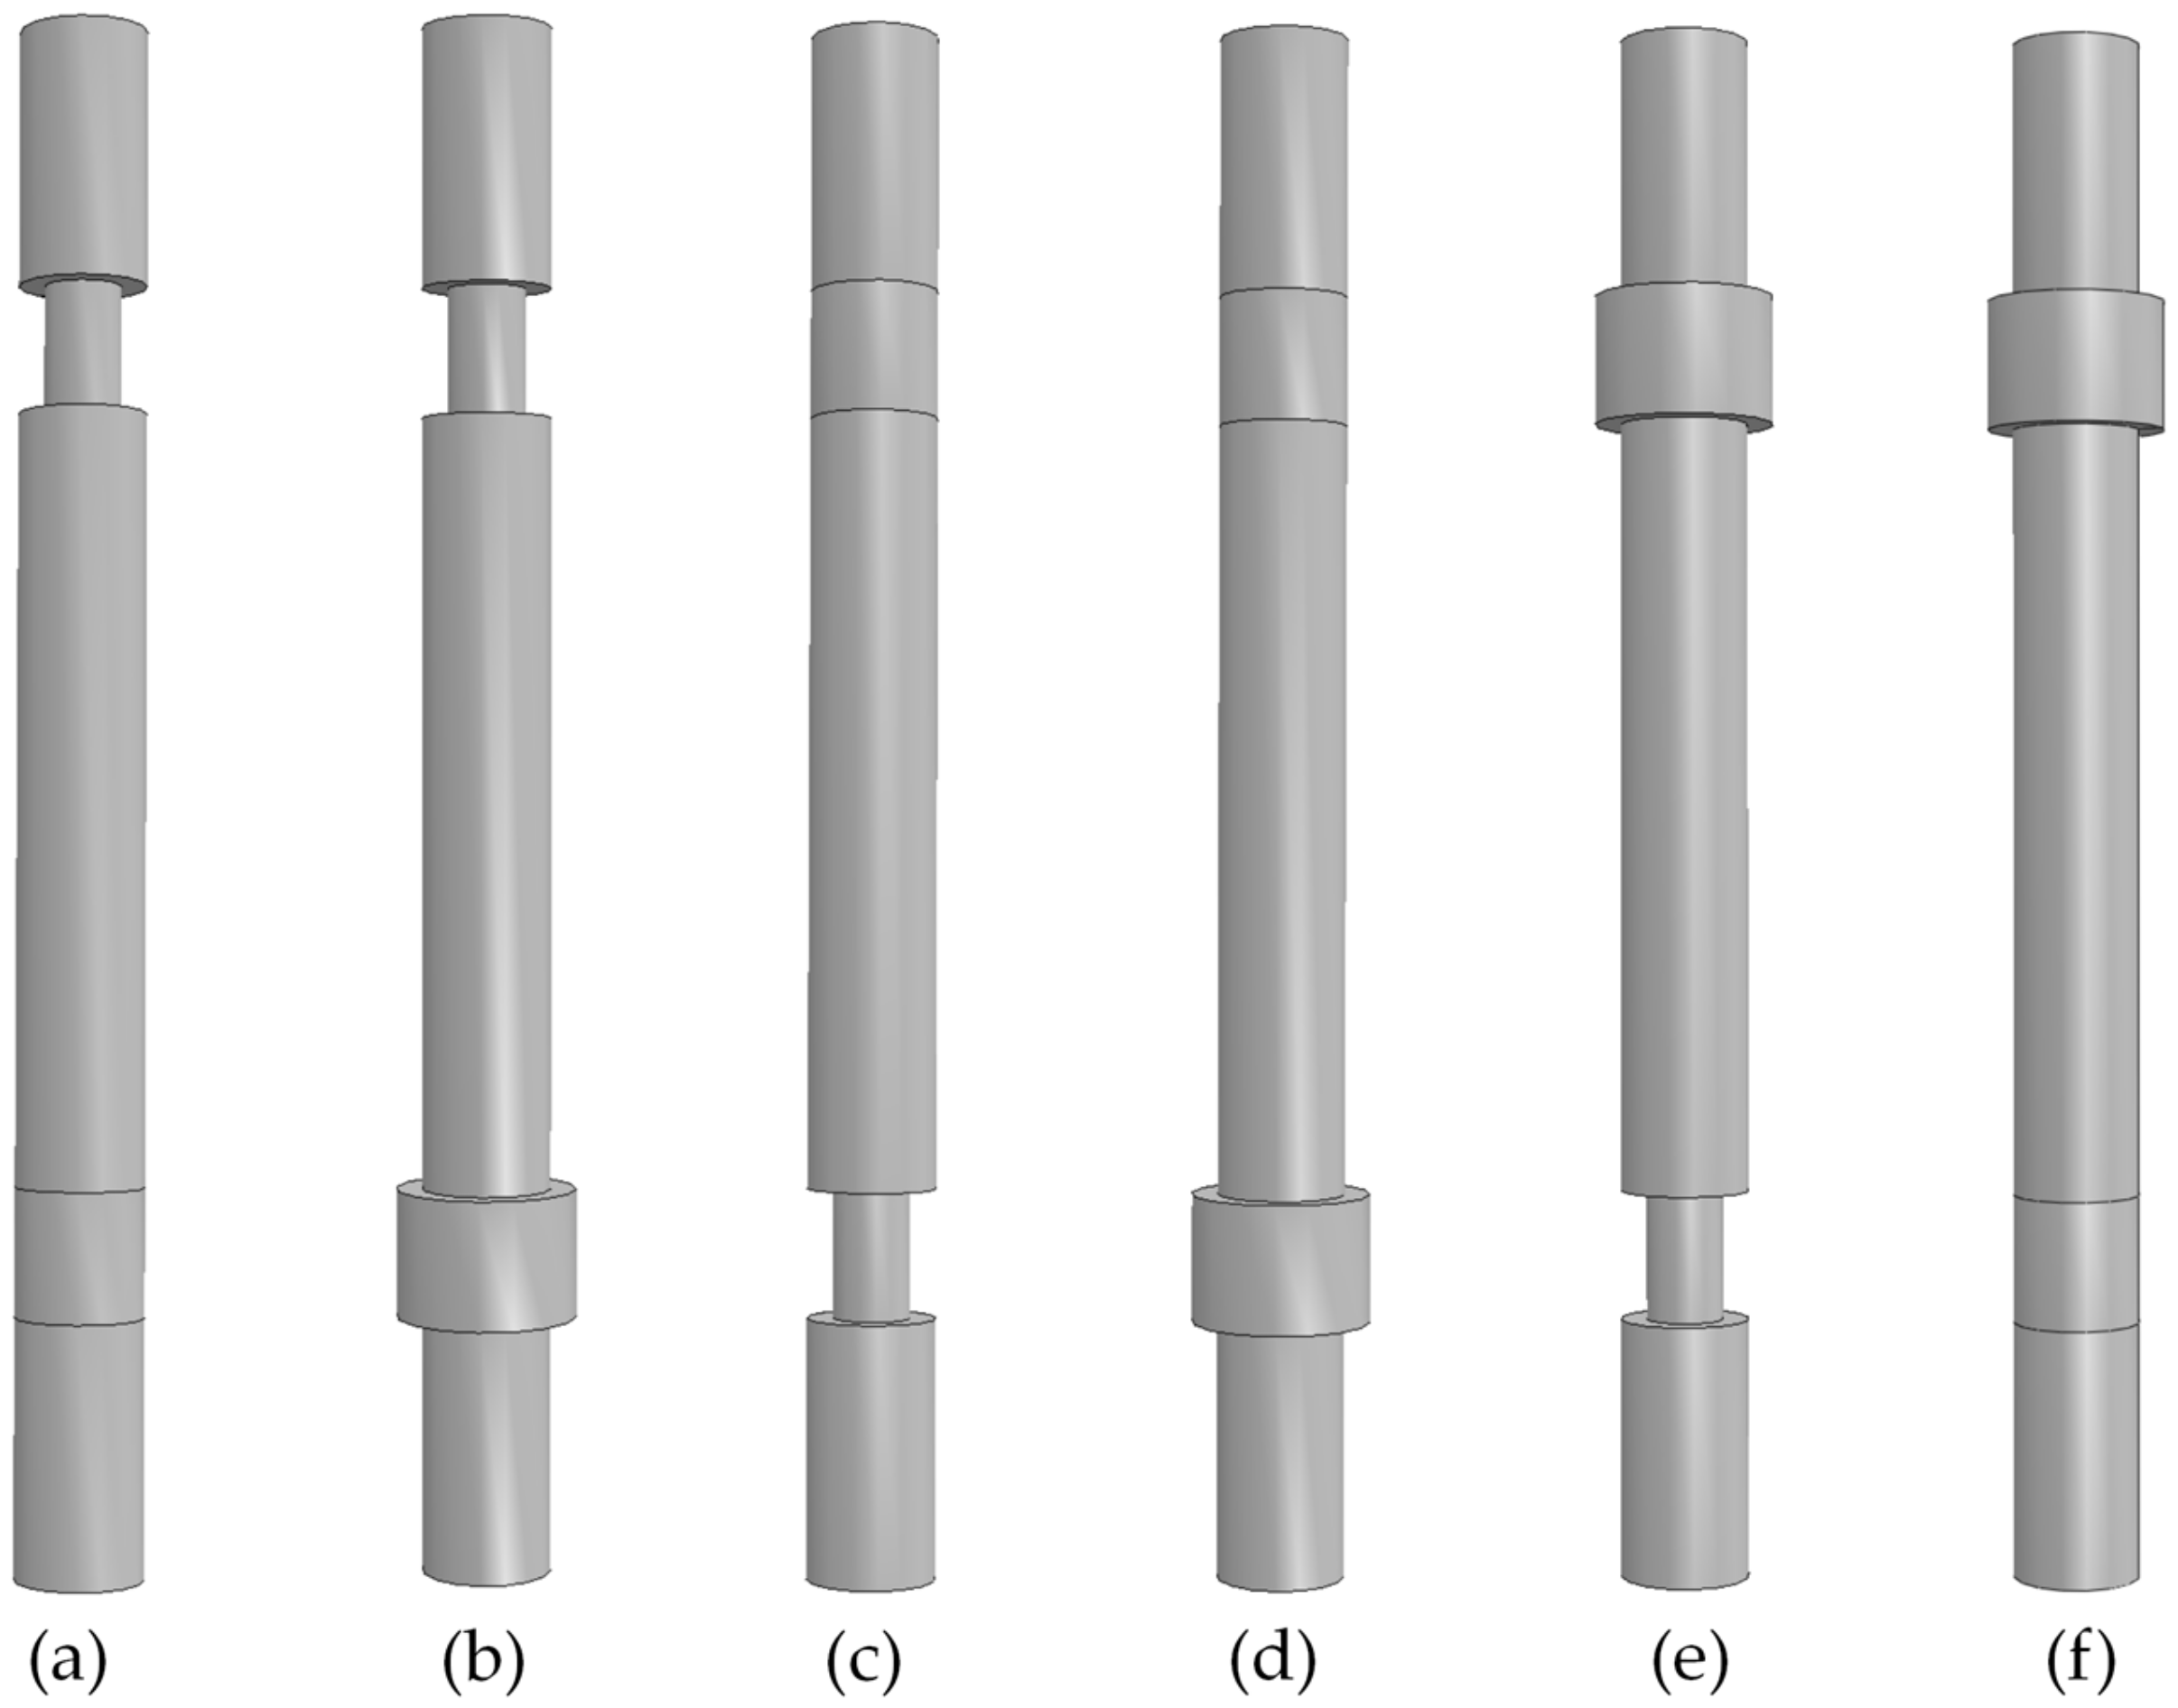
The script record section of the macro file includes (1) part, (2) property, (3) assembly, (4) analysis steps, (5) interaction, (6) load, (7) mesh, (8) optimization, and (9) post-processing. The primary function of the Python script in this paper is to control the position and size of the defects. Furthermore, it can perform adaptive meshing with the change of defect position to perform model parameterization and adaptive meshing on the multi-defect piles. After completing the whole modeling process and obtaining the script record file with the macro manager, the parts that need to edit the script (model parameterization and adaptive meshing) are (1), (2), and (7). After obtaining the pile–soil model, modifying the relevant parameters of the python scripts can obtain the corresponding velocity–time domain curve. Figure 3 shows the six types of multi-defect model piles that this paper needs to simulate.
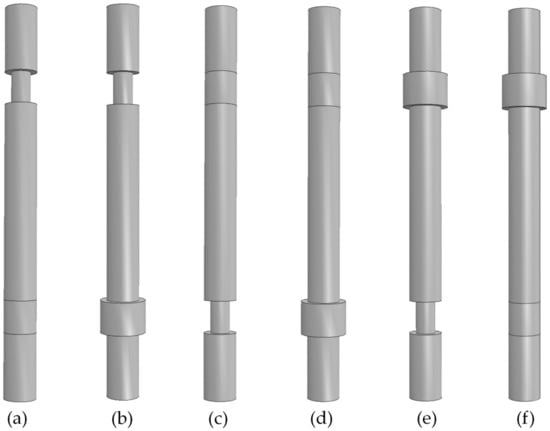
Figure 3.
Finite element model of 6 types of multi-defect piles. (a) Defect type 1: neck defect–weak concrete; (b) Defect type 2: neck defect–bulge imperfection; (c) Defect type 3: weak concrete–neck defect; (d) Defect type 4: weak concrete–bulge imperfection; (e) Defect type 5: bulge imperfection–neck defect; (f) Defect type 6: bulge imperfection–weak concrete.
- 1.
- Model parameterization
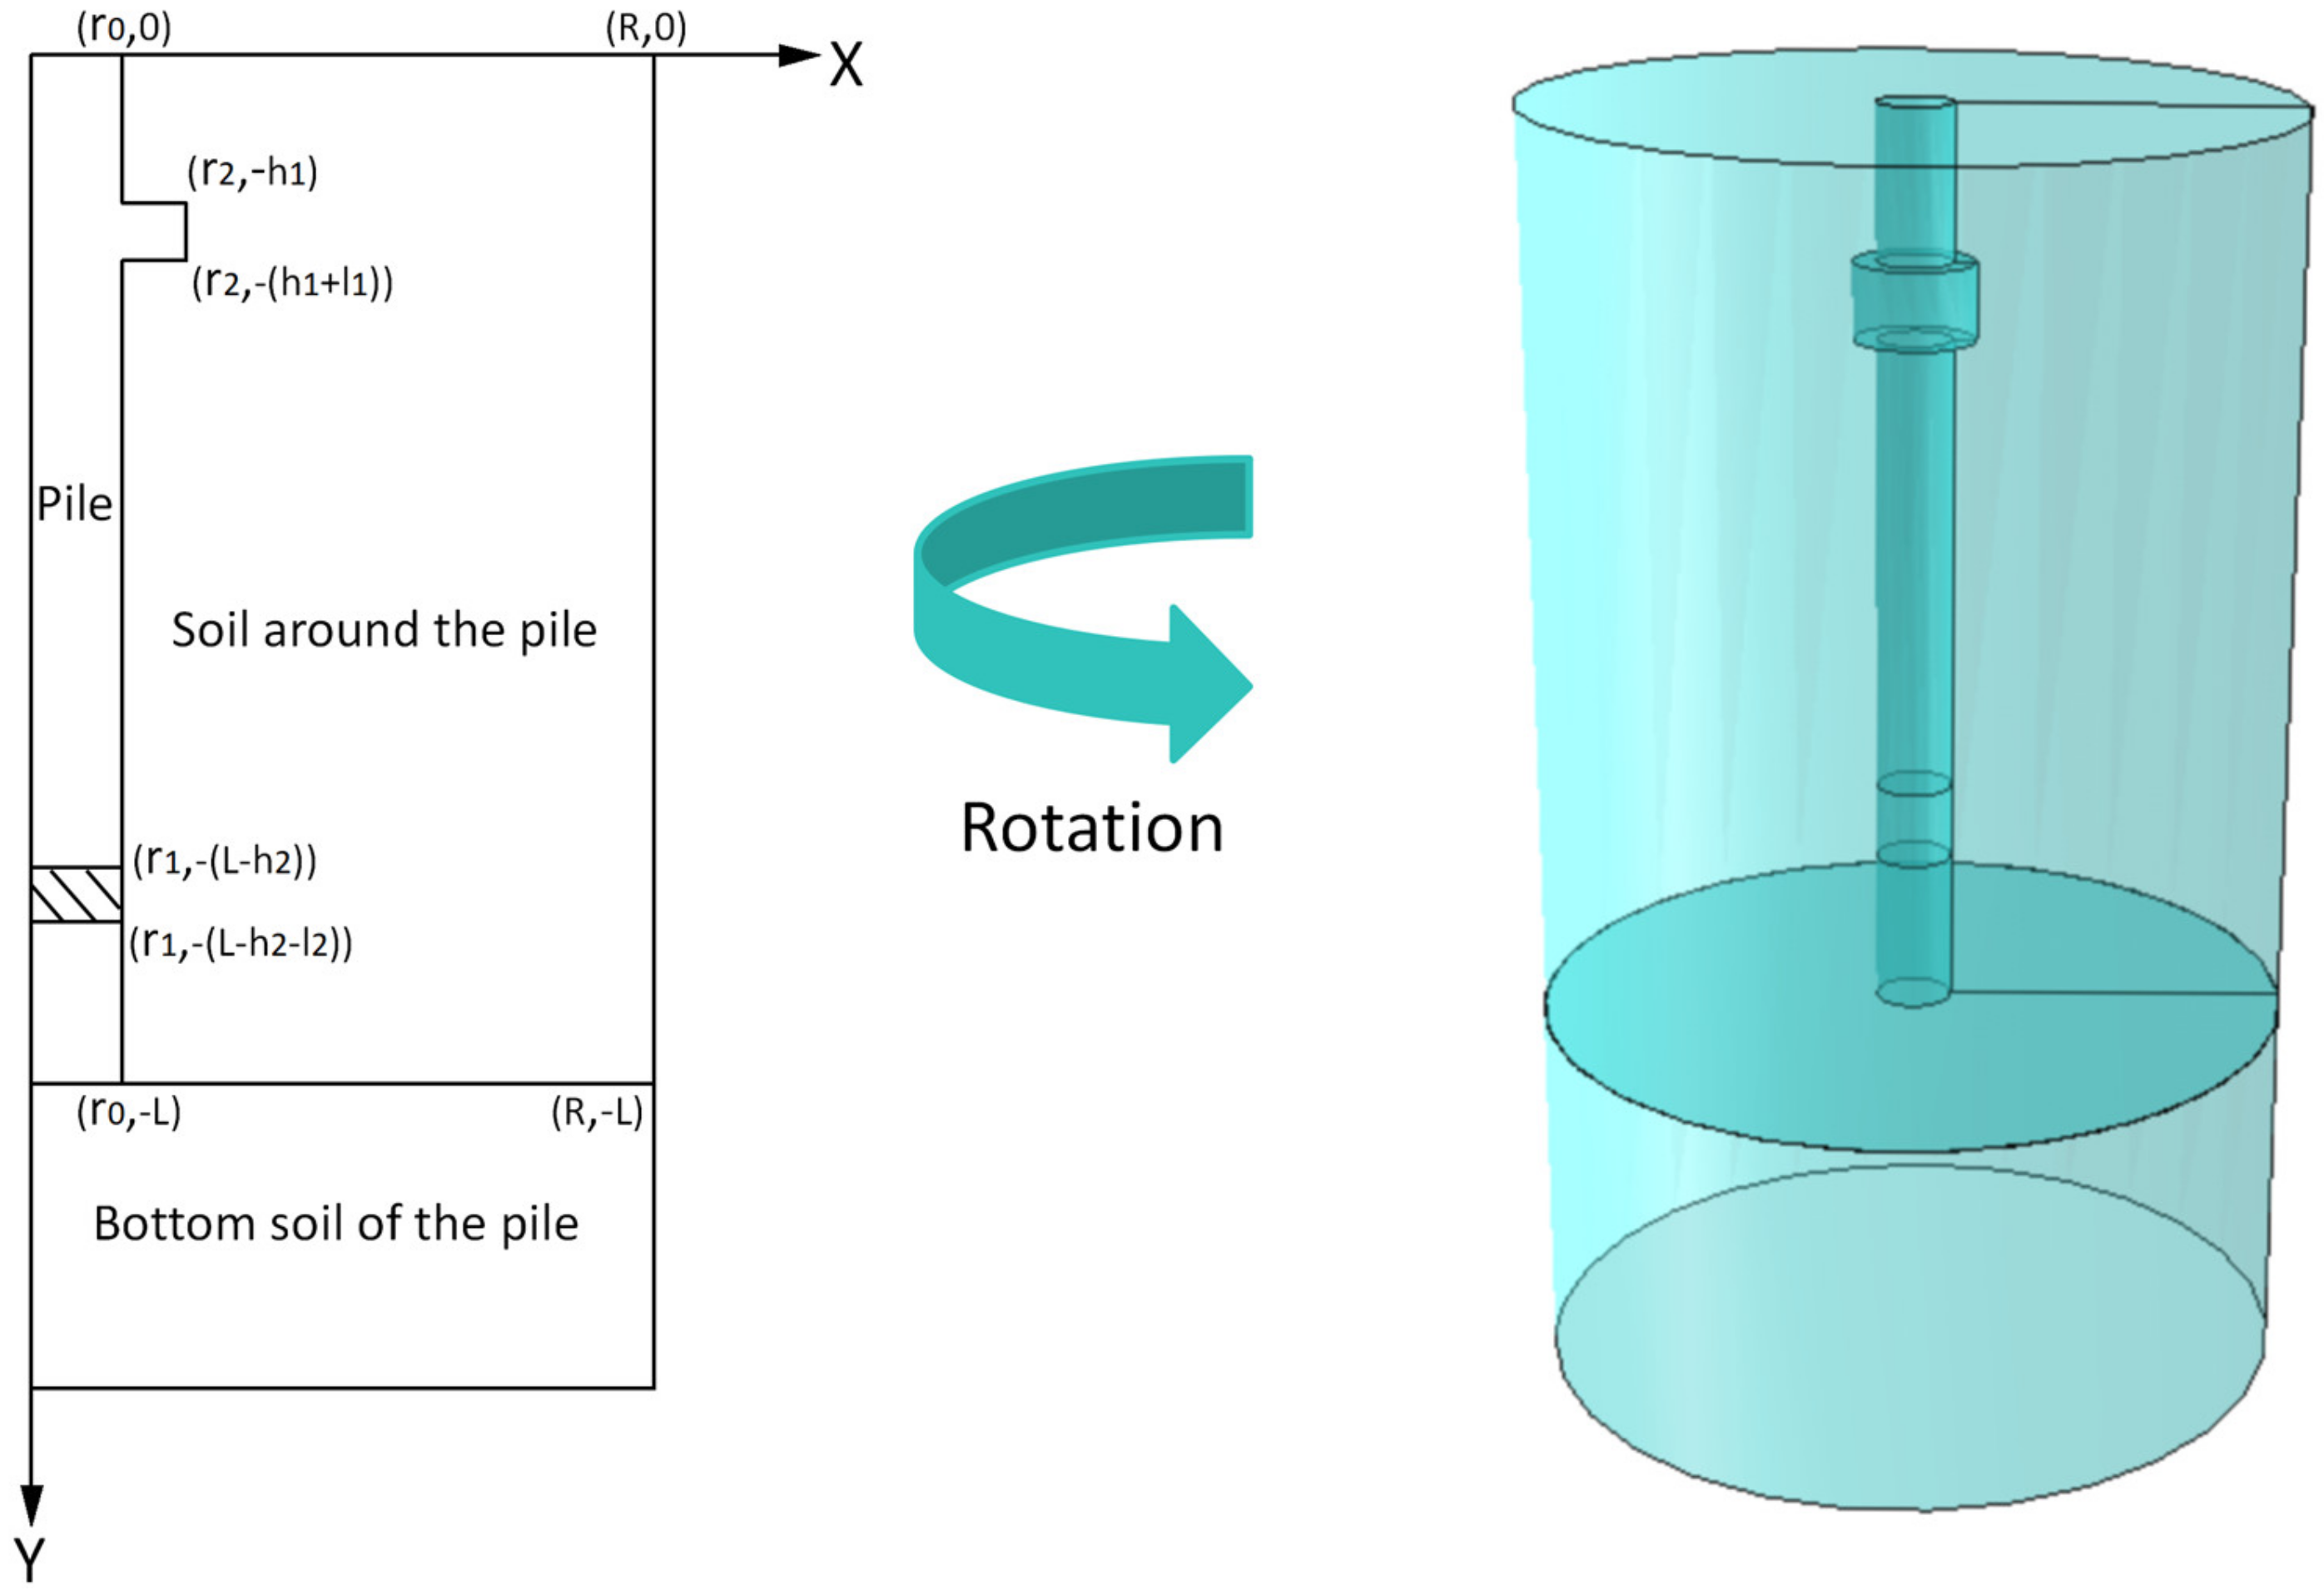
The rotation command in ABAQUS generates this paper’s finite element pile–soil model. In the ABAQUS sketch, the parameters in Figure 1 are set and recorded into a macro file using f(x) in the left command. Finally, modifying the parameters in the script can quickly obtain the pile–soil model and achieve the dimension-driven model parameterization. The parameterization process is shown in Figure 4 (the script logic for other defective piles is similar to this example, and the modeling parameters are shown in Table 2).
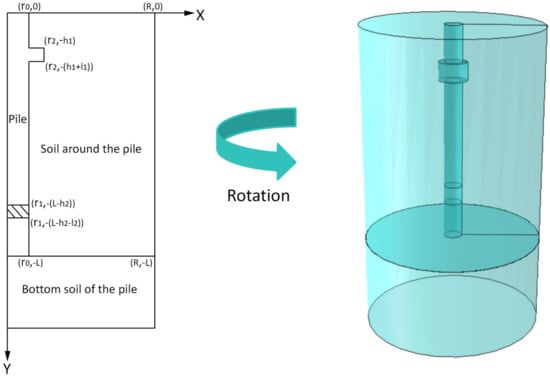
Figure 4.
The process of model parameterization.

Table 2.
Defect conditions of model pile.
- 2.
- Adaptive meshing
In finite element calculations, the way and sparsity of the mesh partitioning affect the accuracy of the results [39]. Since this pile–soil model is not a simple geometry that can be automatically meshed, it is necessary to partition the complex area. However, as the size and location of the defects in Table 2 change, the cutting position will also change. In order to improve the efficiency of meshing and the accuracy of the calculation, this paper proposes a new method to dynamically correlate the boundary conditions that control the sizes of defects with the cutting position of the mesh by using parameters set on the lines to create partitions to achieve adaptive model meshing.
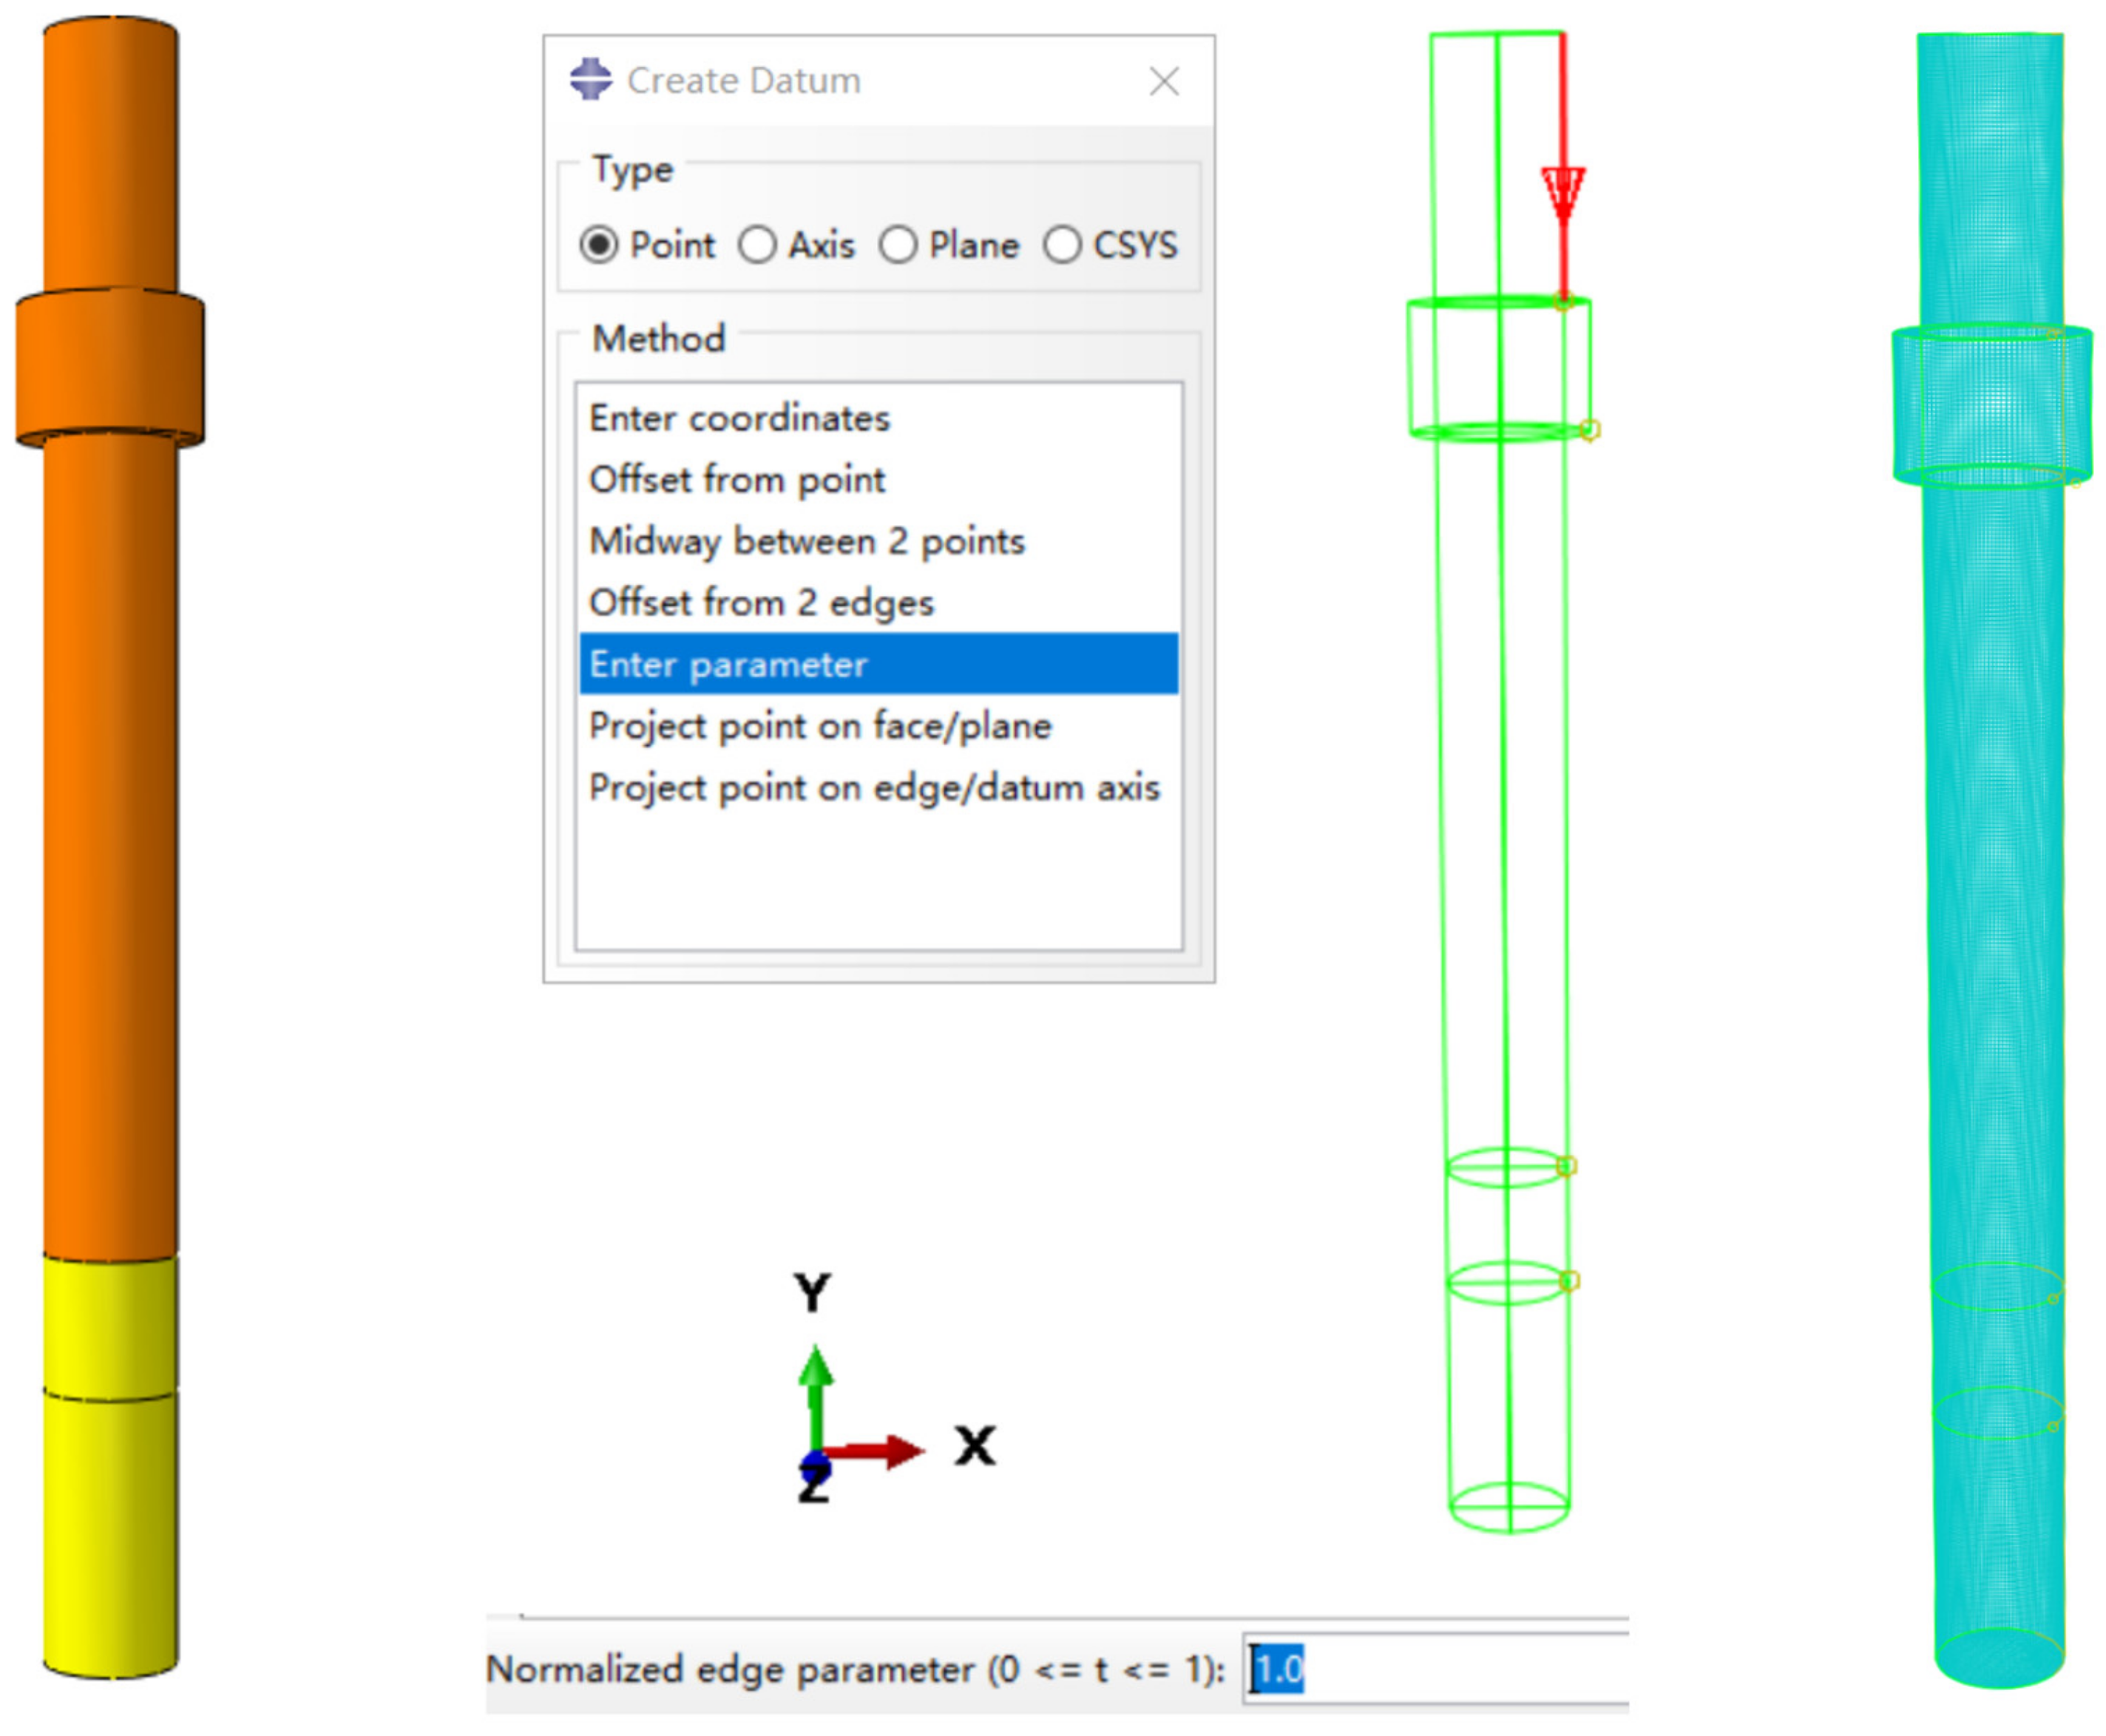
Firstly, select “Tools,” “Partition,” “Edge,” and “Input Parameters” in the upper toolbar of the grid module. Select command; then select the relevant edge that controls the model parameterization, set the parameter t to 0 or 1 to obtain the mesh partitioning locus, and cut the non-dividable (orange) model to a divisible (green) state. All these steps need to be entered into the macro file simultaneously. The process is shown in Figure 5. Other operation steps that do not affect the degree of defects nor require setting parameters are recorded into the macro file together according to the logical order of modeling. The model and parameters can be modified multiple times in the final generated python script to achieve complete process script control modeling.
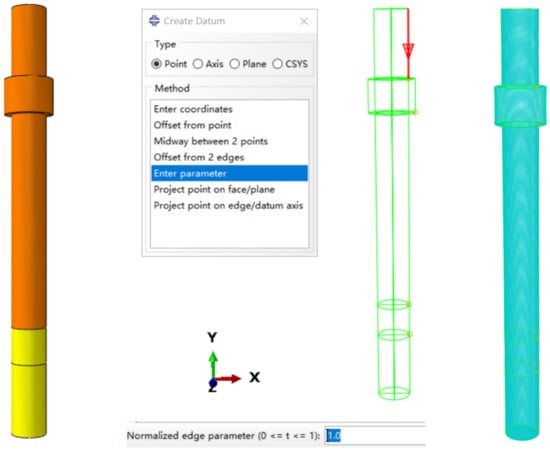
Figure 5.
The process of adaptive mesh division.
2.3. Experimental Validation
2.3.1. Experiment Introduction
This experiment aims to verify the applicability of the dynamic measurement data in the foundation pile multi-defect model database to facilitate the construction of a valuable data set. The experimental model is one complete model pile and three multi-defect model piles. The model pile is 0.1 m in diameter and 1.2 m in length. The first defect is 0.2 m from the top. The second defect is 0.2 m from the bottom, the radius at the reduction is 0.025 m, the radius at the expansion is 0.065 m, and the depth of each defect is 0.1 m. The diameter of the soil pit is 1 m, and the depth is 1.2 m. The pile integrity part used the design grade strength C30, and the pile segregation part used the design grade strength C15. The soil around the pile and the soil at the bottom of the pile are mollisols, and the specific parameters of the six multi-defective pile models are shown in Table 3.

Table 3.
Parameters of defective pile for experiment.
This experimental data acquisition system comprises sensors, signal acquisition equipment, and a computer. The sensor adopts a TEPE piezoelectric acceleration sensor, and the data acquisition equipment adopts the DH5927N dynamic signal test and analysis system and DHDAS software(version: 6.8.15, HP, Chongqing, China.) from Jiangsu Donghua Test. The computer adopts Intel(R) Core(TM) i7-7700HQ CPU @ 2.80GHz, NVIDIA GeForce GTX1050 GPU, and there are 8G RAM on the Windows system. And the computer is produced by HP in Chongqing, China.
2.3.2. Experimental Steps
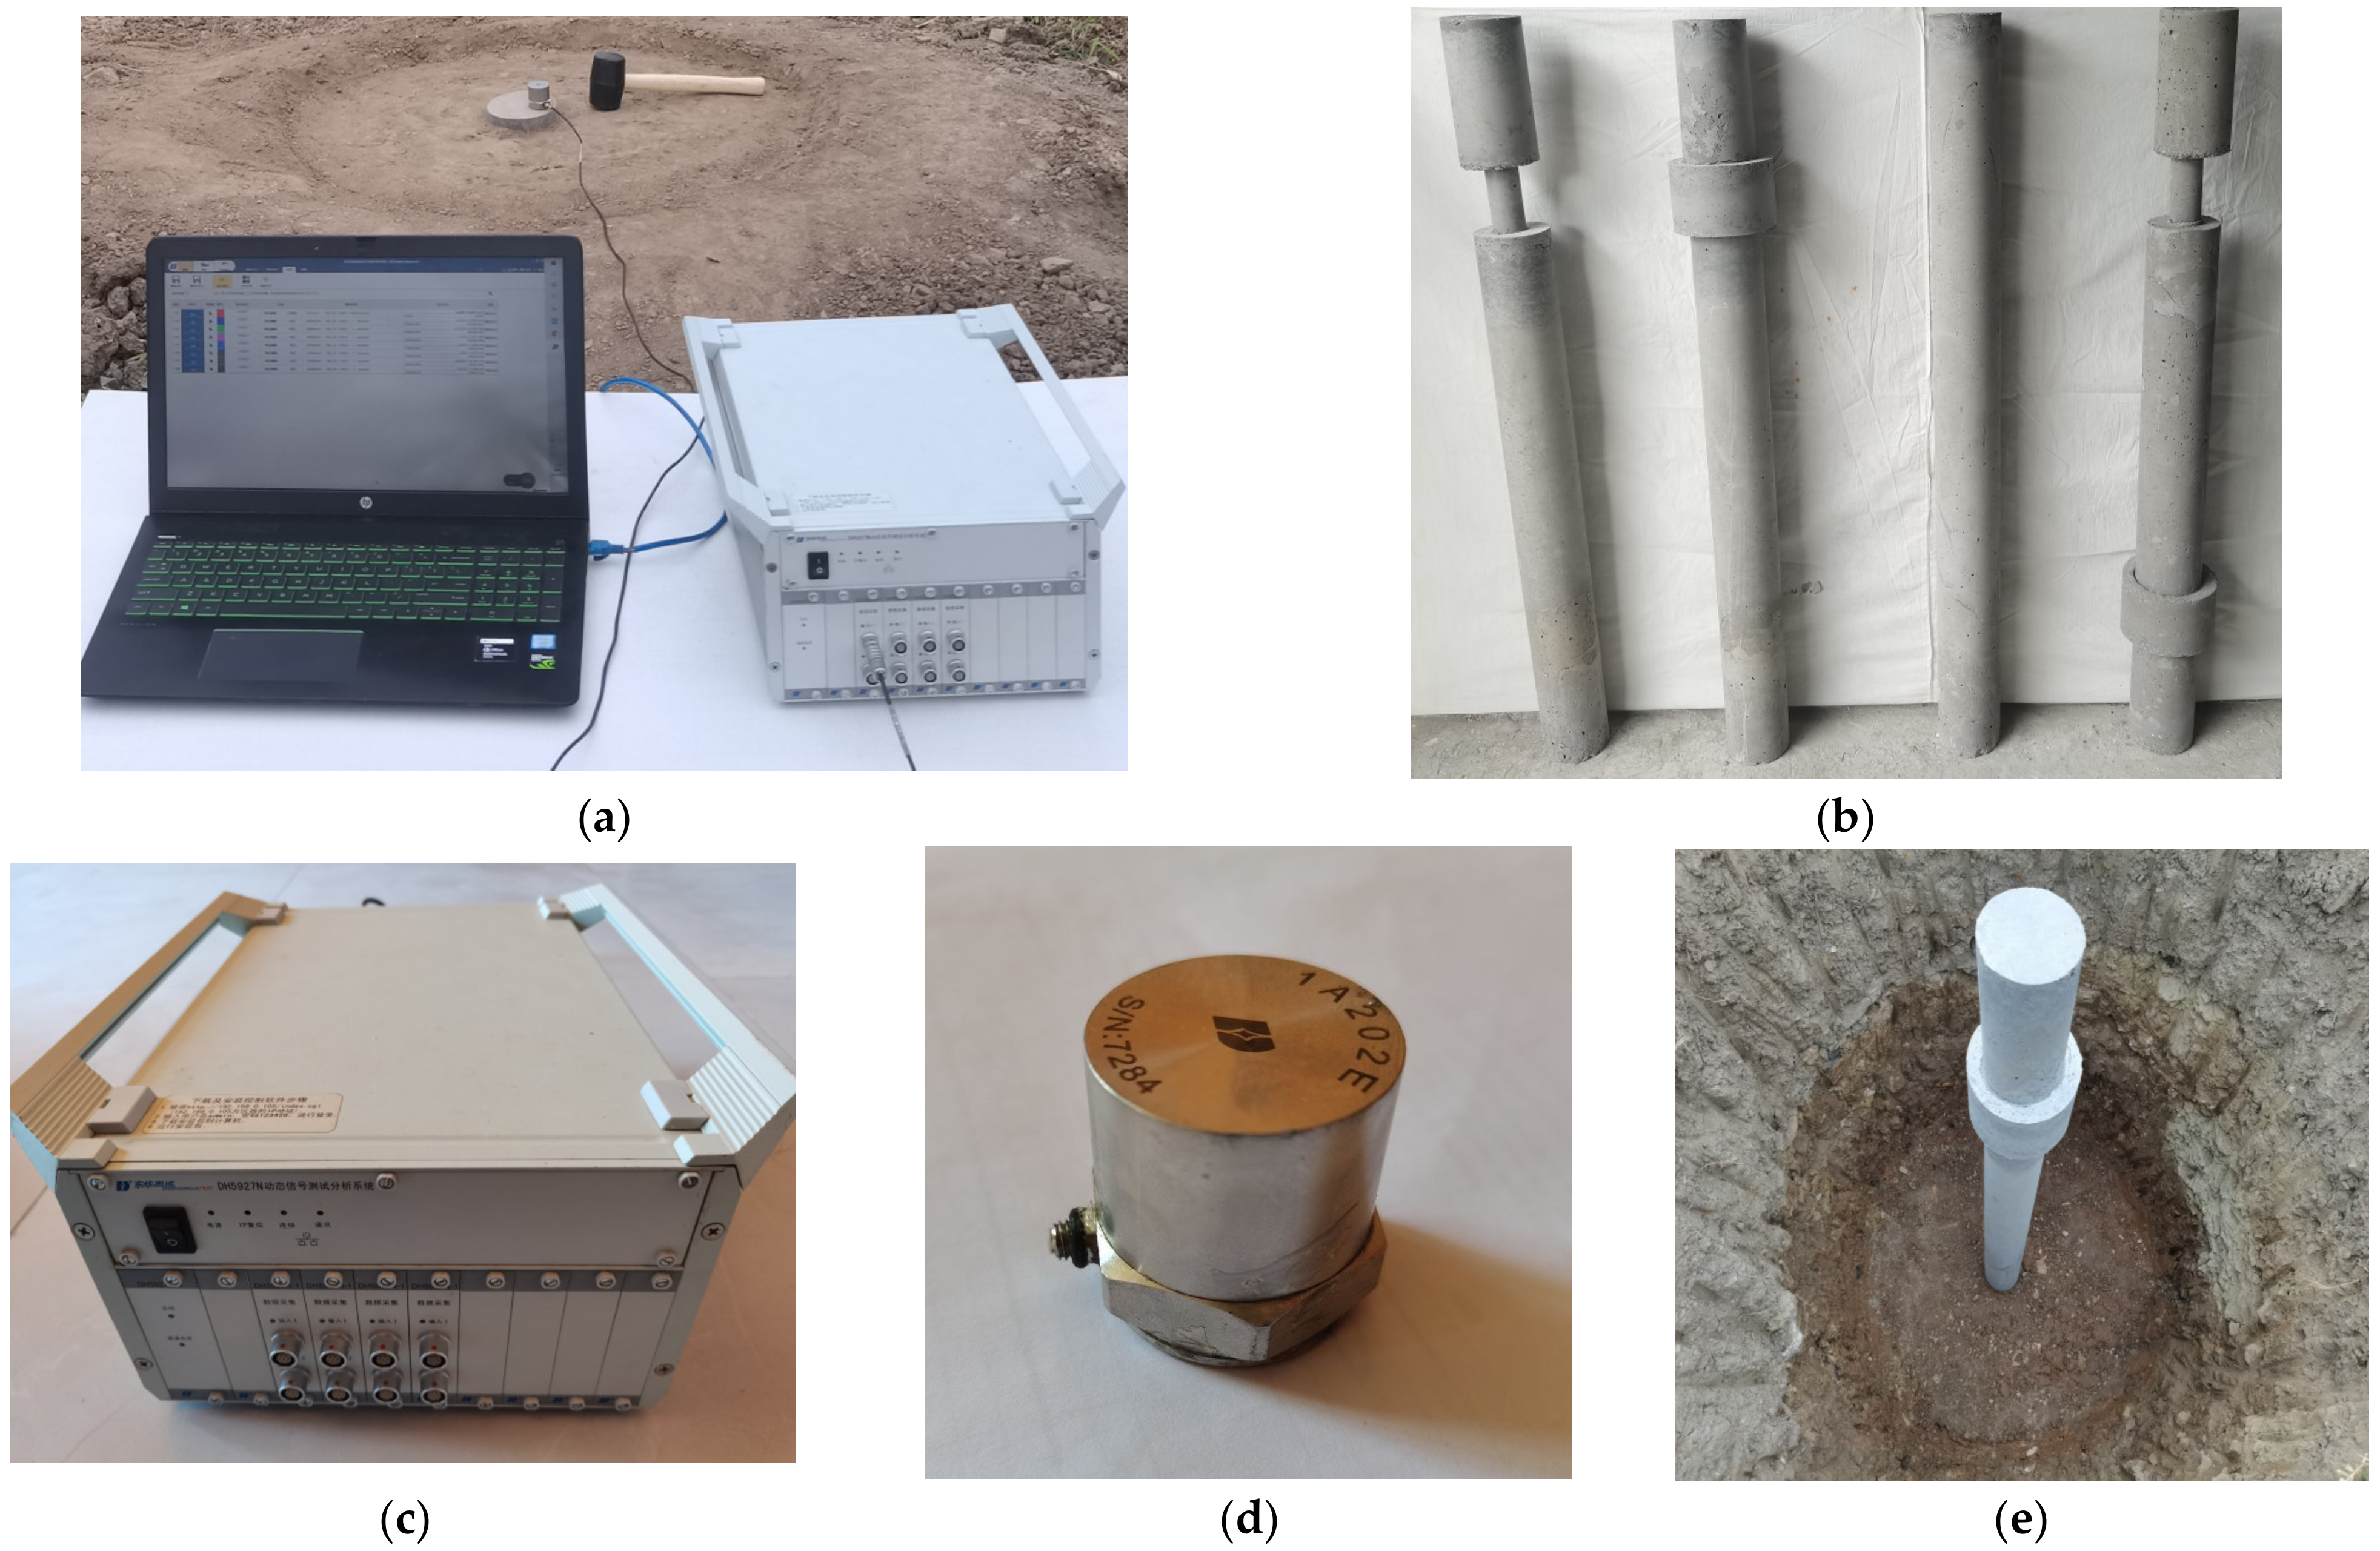
This study will explain the practical steps to facilitate subsequent operability and repeatability. First, it is necessary to make the multi-defect model pile shown in Figure 3 and put it into the soil pit backfill. That is, making different molds removes the mold after 28 days of maintenance. The position of the first and second defects is changed by changing the model pile top and pile bottom embedding method. It uses the complete pile in Figure 6b to verify other multi-defect piles’ bottom reflection positions. The model pile is placed in the center of the soil pit and backfilled with compacted, undisturbed soil. Then, the device needs to set the parameters. Clearing the original signal in the channel and setting the sampling frequency to 20,000 Hz, the sensor sensitivity is set to 1006 mV/g and the channel measurement gear is set to 0–0.099. Finally, complete the signal acquisition. After the computer, signal acquisition equipment, and sensor are connected, the sensor is connected to the top surface of the pile with a coupling agent. The distance between the sensor detection point and the pile center is 2/3 of the pile radius. Replace the placement of the sensor, and perform ten signal acquisitions for each model pile. Then the collected acceleration signal is integrated to obtain the velocity signal. Finally, the experimental result is the average value of the ten times speed signal. The experimental model and test system are shown in Figure 6.
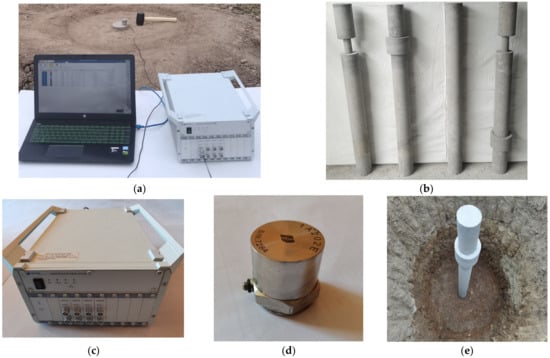
Figure 6.
Experiments and models. (a) Test system; (b) Experimental model; (c) Signal acquisition equipment; (d) Sensor; (e) Example of defect pile placement.
2.3.3. Comparative Verification
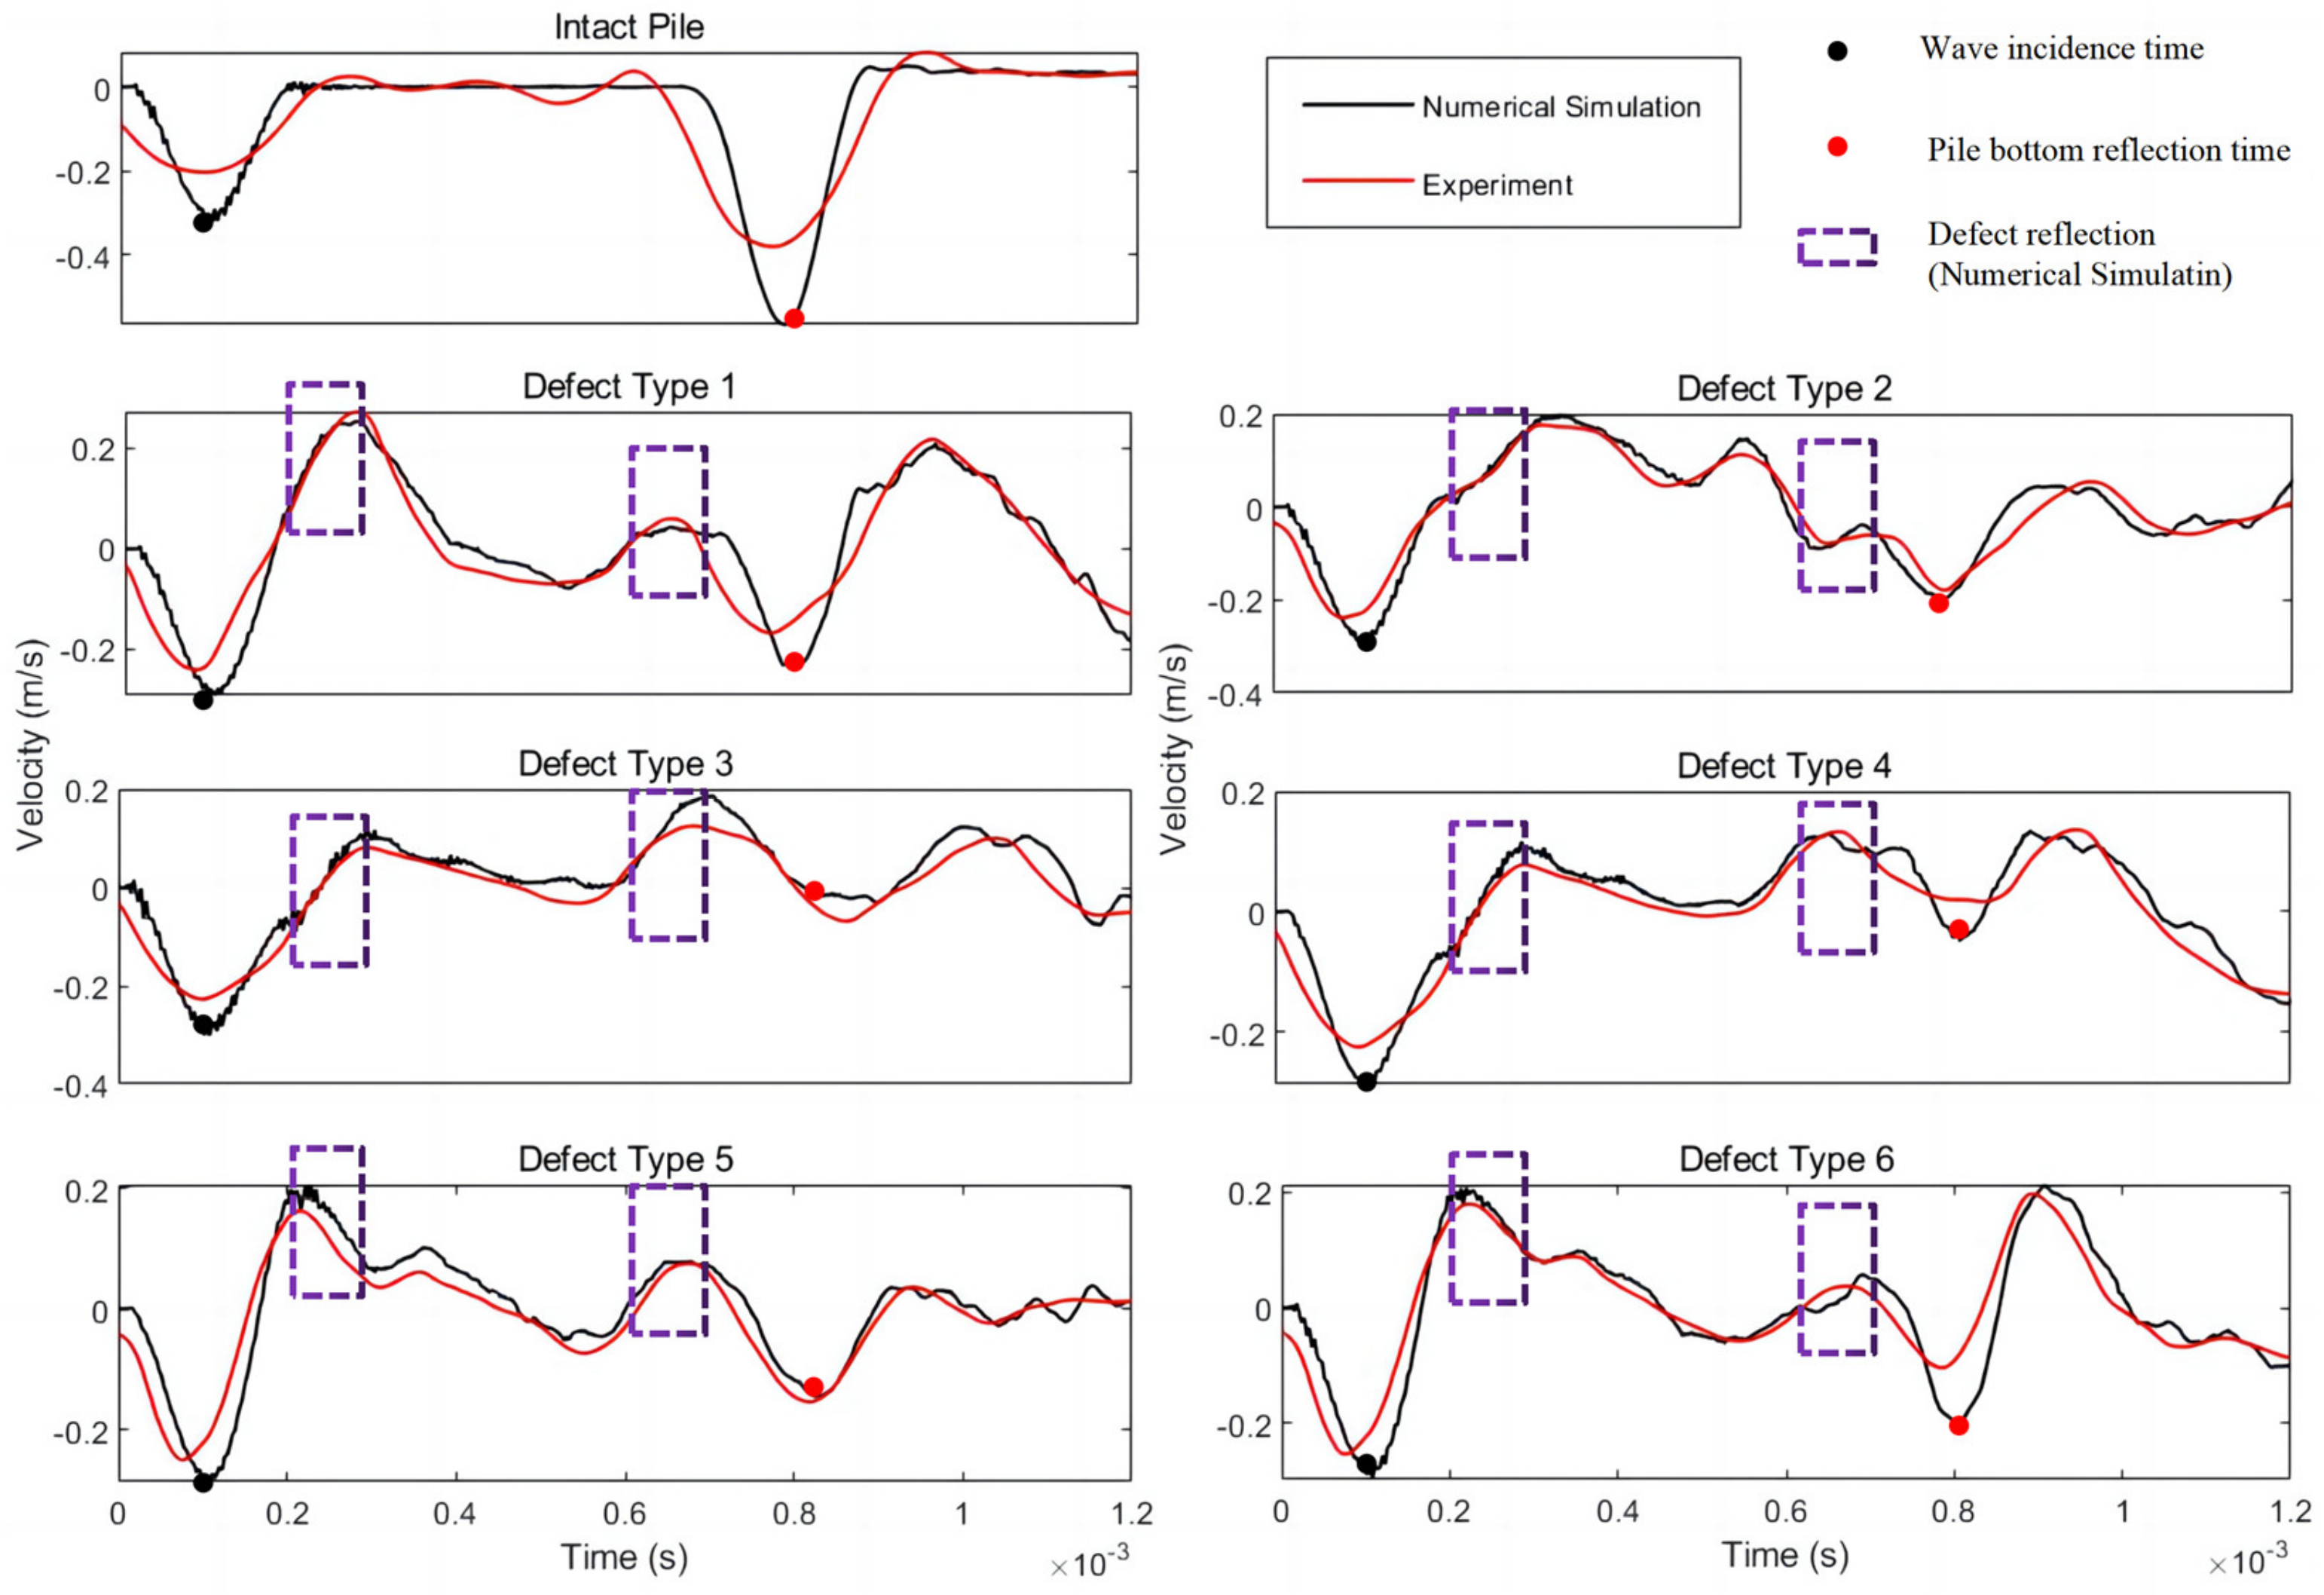
Figure 7 shows the comparison between finite element simulation and experimental results. Different types of multi-defects of the pile foundation will show different amplitude differences and reflection signal characteristics on the velocity response curve [40]. The following phenomena are according to the principle of LSPIT in Figure 1 and the specific defect type in Figure 3: defect types 2 and 4 have the first defect position impedance decreases (weak concrete or neck defect), and the second defect position impedance increases (bulge imperfection). Therefore, the velocity–time curve of their first defect position will appear similar to the cd curve in Figure 1, and the second defect position is similar to the ab curve in Figure 1. Similarly, the 2 defect positions of defect types 1 and 3 are similar to the cd curve; the first defect position of defect types 5 and 6 is similar to the ab curve, and the second defect position is similar to the cd curve. The finite element model curves and the field test curves match the amplitude and reflection time of the pile bottom reflections, but there are some differences in the smoothness of the curves. Because of the limited vibration pickup conditions of the field experimental sensors, the curves cannot accurately represent the pile reflection waveform [41]. Overall, the simulated data matched well with the experimental data, verifying the numerical simulation’s validity.
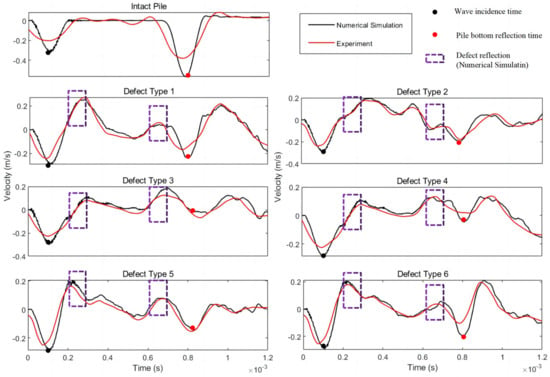
Figure 7.
Comparison of numerical simulation and experimental data.
2.4. Data Processing
2.4.1. Removal of Digital Noise from Analog Signals Using Wavelet Packet Transform
Due to limited sampling accuracy, finite element simulated LSPIT data will generate quantization noise in the digitization process. The simulated time domain signal needs to be denoised. Coifman and Wickerhauser proposed the WPT based on the wavelet transform [42]. Thus, wavelet packet transform is localized in both the time and frequency domains. For non-smooth signal denoising, wavelet packet denoising is better than wavelet transform [43,44]. The reason is that WPT gives a balanced binomial tree structure that can decompose both the low-frequency and high-frequency parts of the upper layer, making the denoised signal closer to the original signal.
Mathematically, the wavelet packet transform as a function of the time–frequency is defined as [45]:
where p is the scale, k is the translation parameter, and i is the number of decomposition layers. P = k = 0 wavelet packet function is the scaling function and the mother wavelet function. The expressions are as follows.
The following equations represent other wavelet packet functions.
where h(k) is a low-pass filter associated with a predefined scaling function and a mother wavelet function, and g(k) is a high-pass filter. Using the inner product of the signal can calculate the wavelet packet coefficients, and each wavelet packet function has the following form.
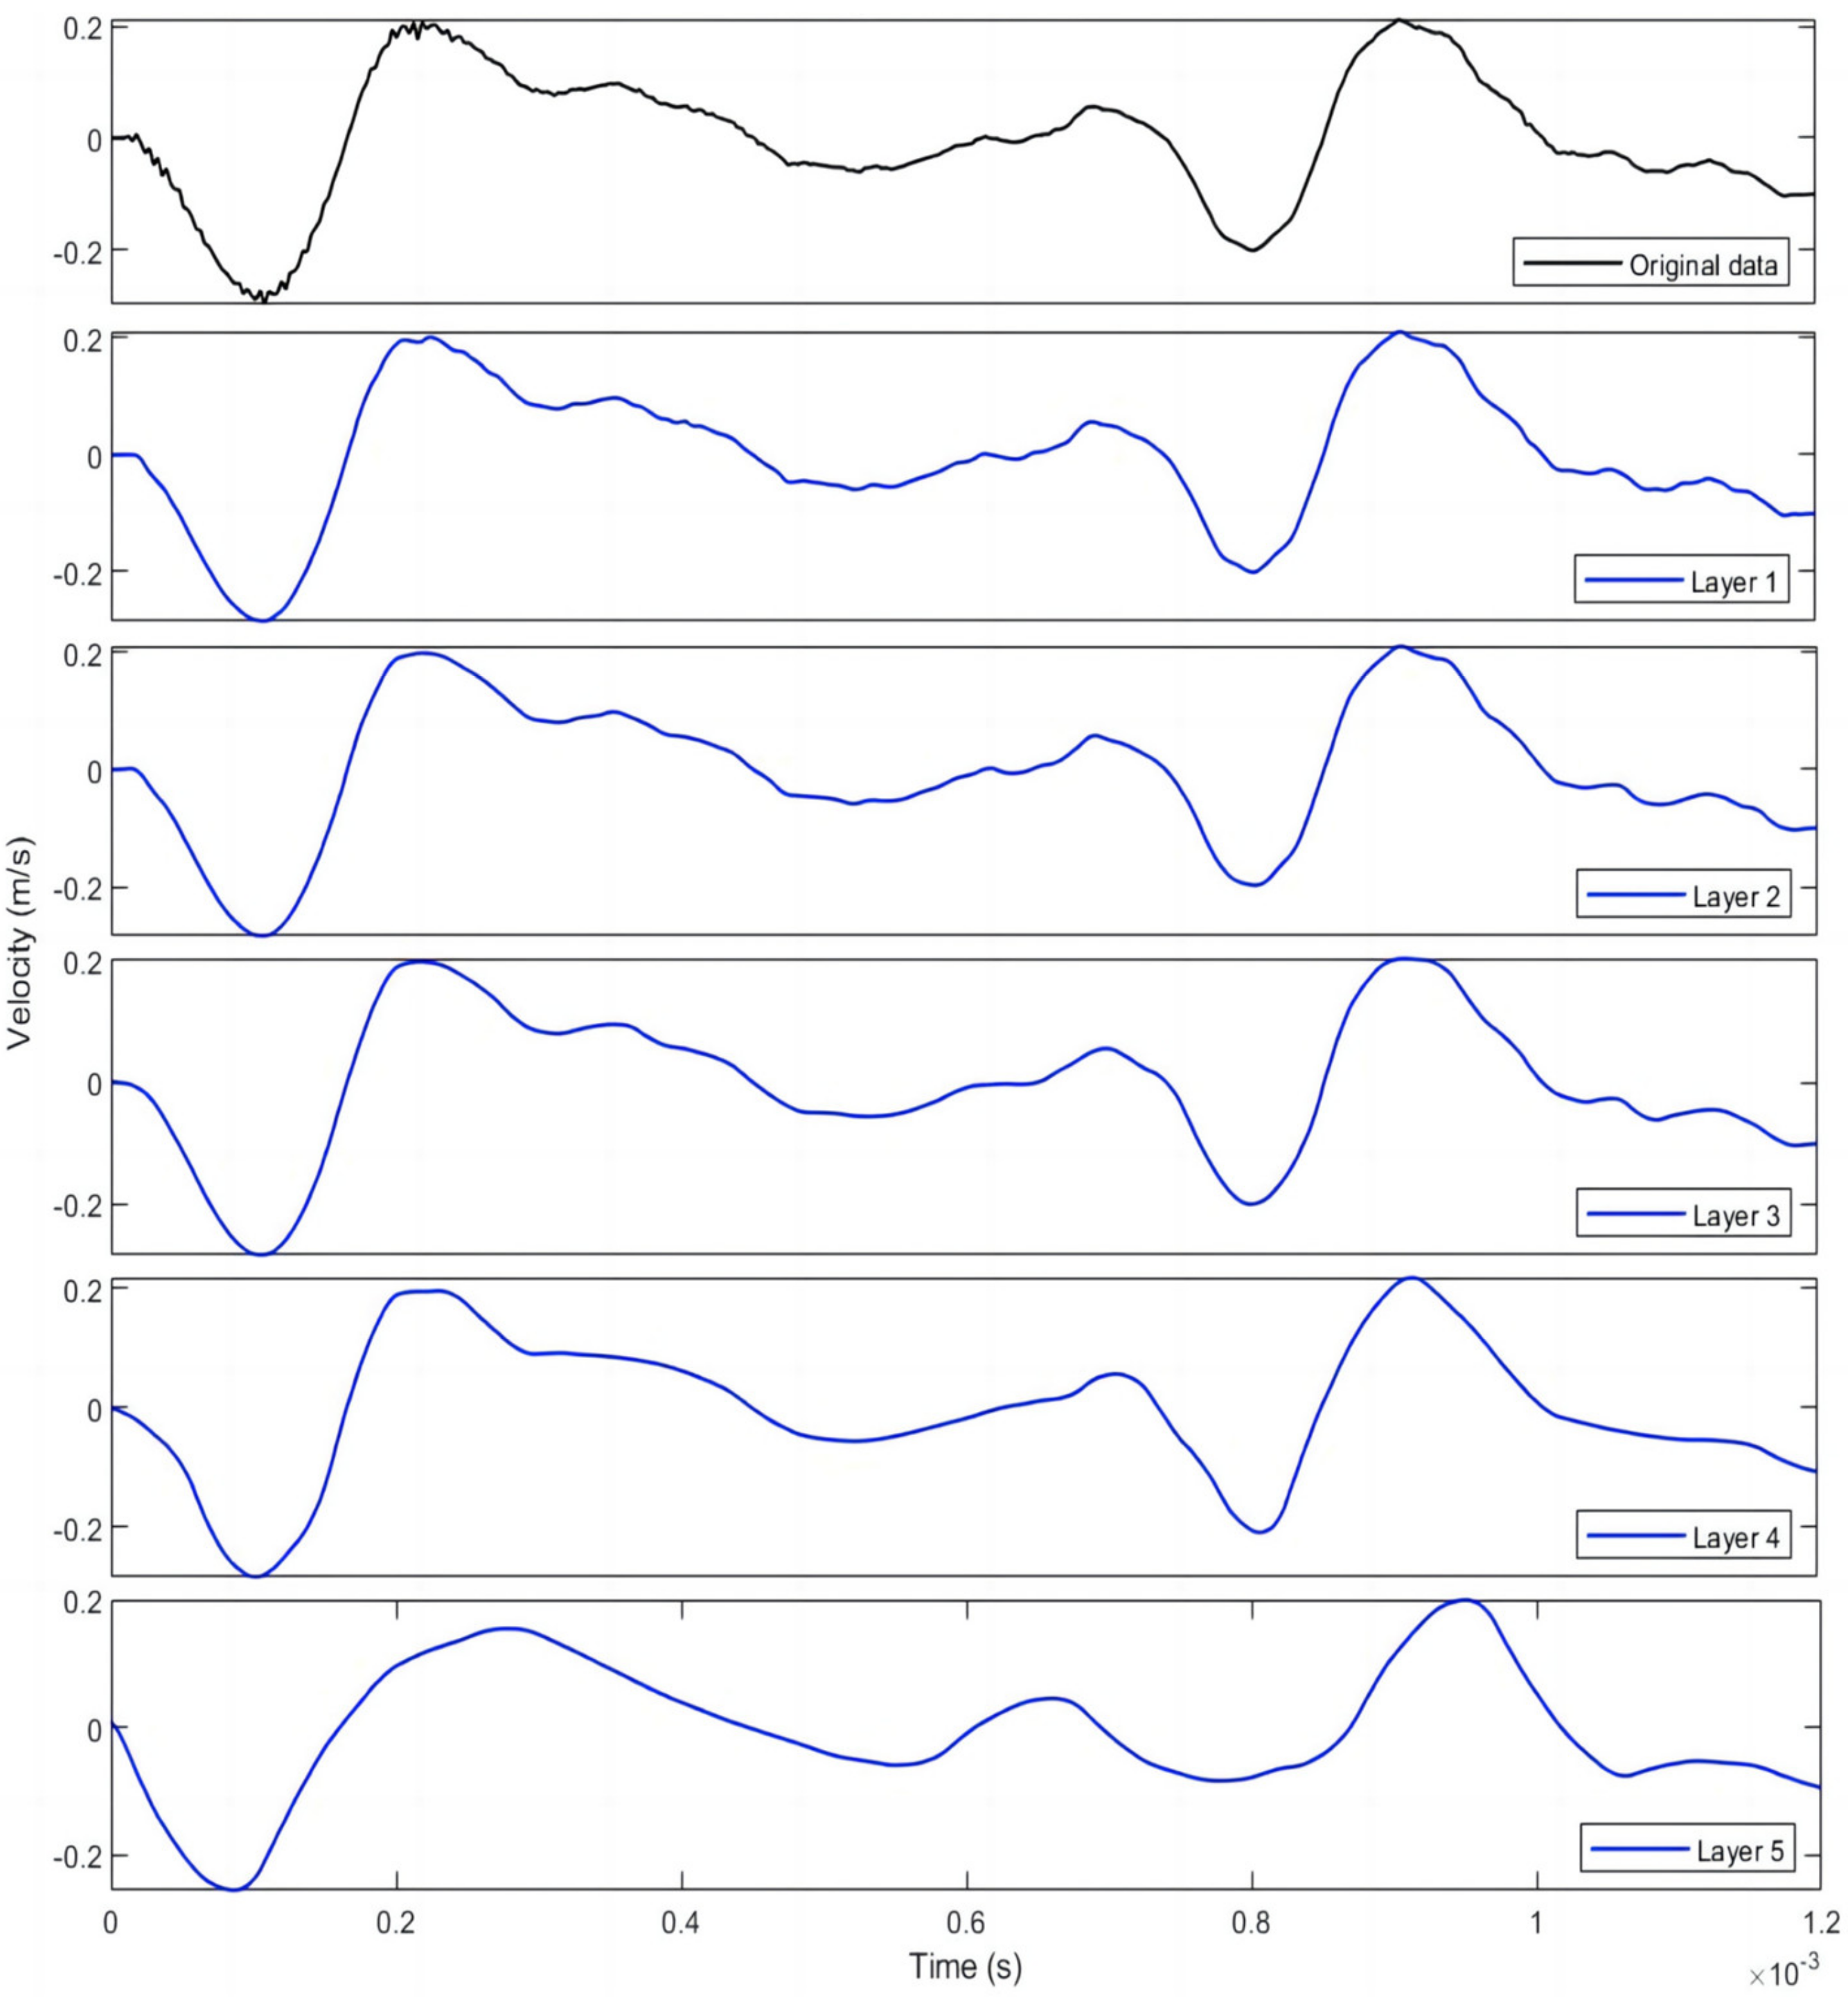
Selecting the corresponding wavelet basis according to the actual situation is necessary. This paper selects sym5, which is similar to the transient vibration waveform of the simulated data, as the wavelet basis function of this paper. The smaller the root mean square error, the better the denoising effect; the more significant the signal-to-noise ratio, the better the noise suppression effect. Therefore, calculating the root means square error (RMSE) and signal-to-noise ratio (SNR) and observing the denoised waveform can determine the optimal decomposition level [46,47]. Taking bulge imperfection–weak concrete pile as an example, Table 4 shows the SNR and RMSE of its wavelet packet denoising; Figure 8 shows the denoising effect at different levels.

Table 4.
Wavelet packet transform different decomposition denoising effect.
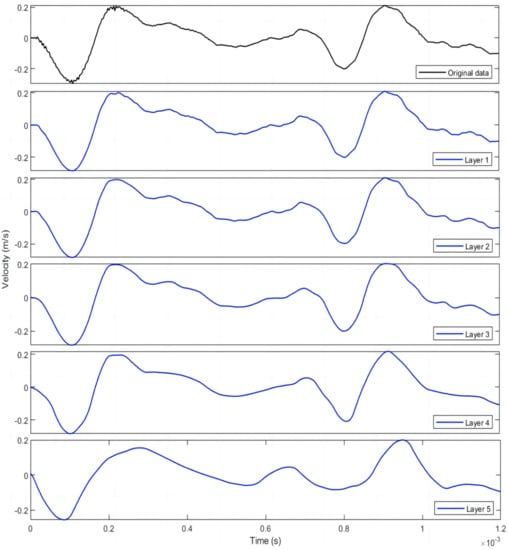
Figure 8.
Denoising effect of different levels.
For Layer 1 and Layer 2 decomposition with smaller RMSE and larger SNR, the data has good matching with the defined standard. However, according to the denoising waveform of Figure 8, there is still slight noise after Layer 1 and 2 of denoising. After Layer 4 and 5 of denoising, the waveform has been deformed compared with the original waveform. Therefore, the optimal decomposition level should choose the Layer 3 decomposition with a smooth denoising waveform, high SNR, and small RMSE.
2.4.2. Time–Frequency Analysis
Convolutional neural networks are good at processing the input data of two-dimensional images. The one-dimensional time-domain signal provides a single feature, which needs to be analyzed in time–frequency to enhance the dimensionality of the data. The commonly used time–frequency analyses are short-time Fourier transform (STFT) [48], S-transform [49], and wavelet transform. The rest of the methods are deficient compared to the wavelet transform. The short-time Fourier transform has a fixed window size, which cannot balance the frequency and time resolution needs. Due to the kernel function property of the S-transform, the time–frequency window is long and thin in the high-frequency band, which makes the frequency domain resolution error in the high-frequency range smaller [50]. The wavelet transform has good time–frequency localization performance, which solves the window fixation problem and improves the flexibility of the resolution. Therefore, we chose the wavelet transform for time–frequency analysis in this paper.
For ∈ L2(R), its continuous wavelet transform can be expressed as follows:
where the basis function of the wavelet transform is:
is the wavelet function, a is the scale factor, and b is the translation factor. The result of scaling and shifting the wavelet function is and normalized with . Changing the wavelet’s frequency and stretching the wavelet’s length allows us to obtain wavelet coefficients at different frequencies.
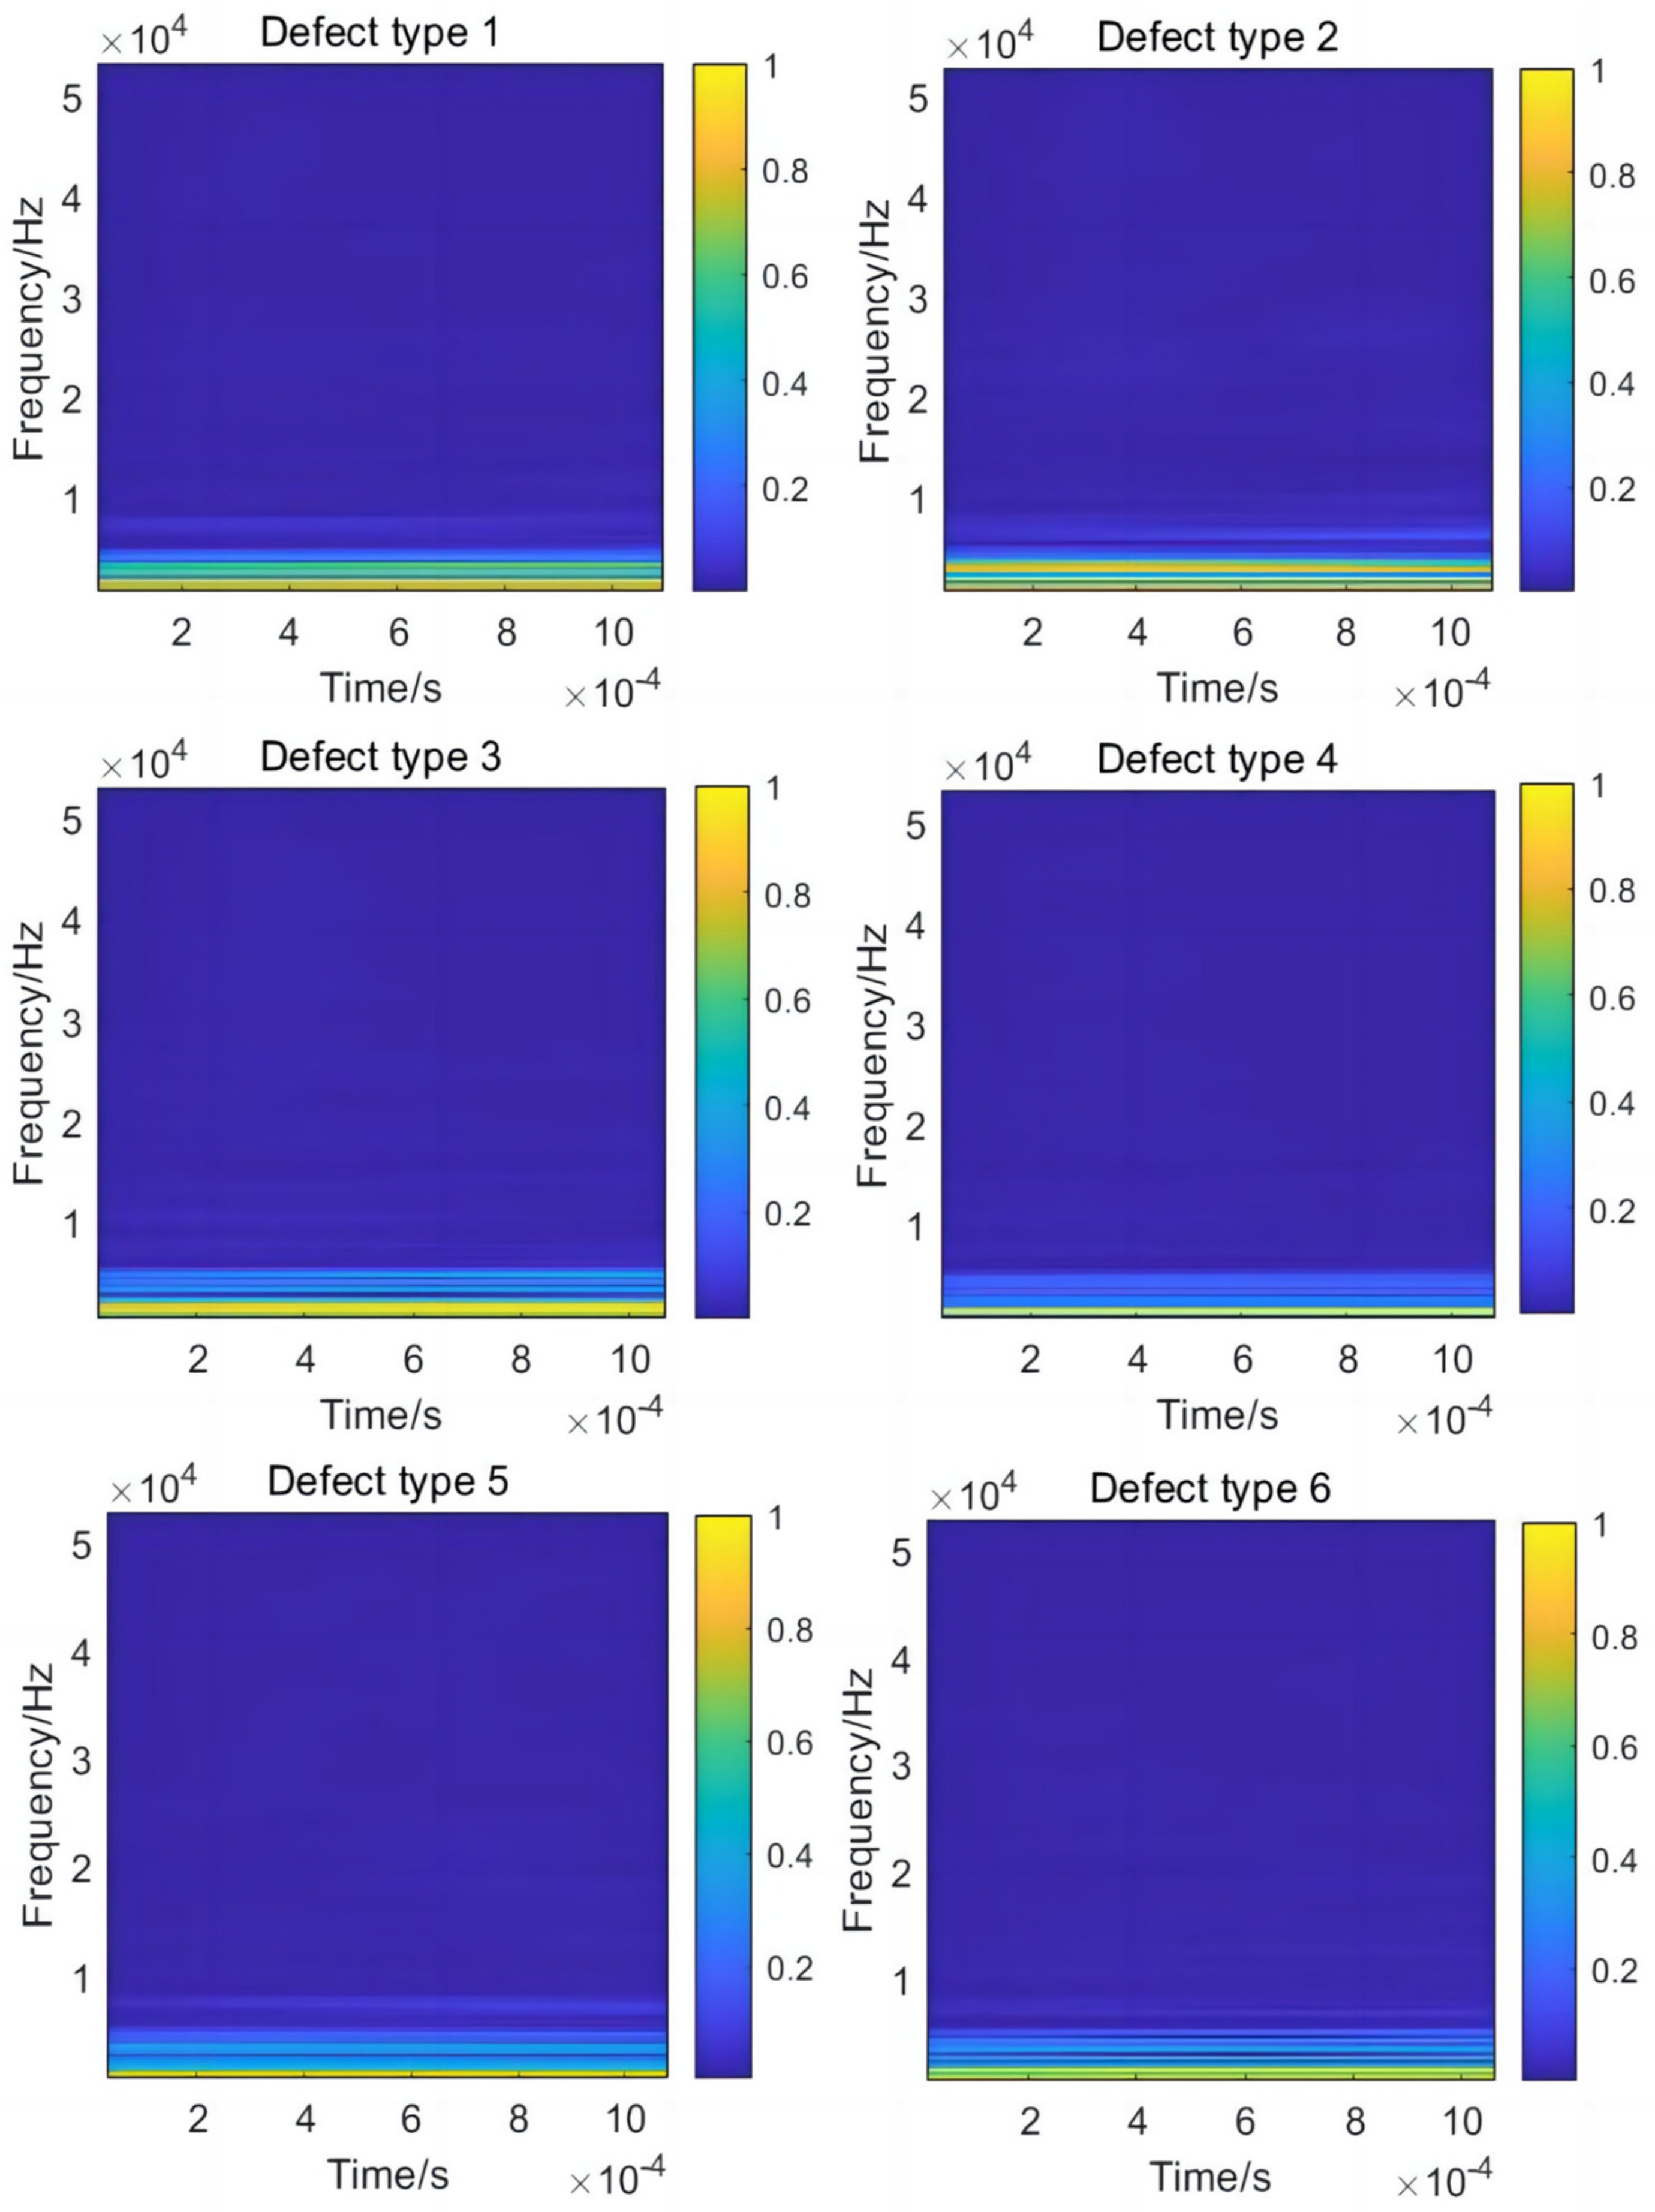
The original 1 × 400-dimensional time-domain signal is compressed by wavelet transform into a 64 × 64 × 3 time–frequency image. Using the complex Morlet wavelet close to the original signal as the wavelet function performs the wavelet transform of the LSPIT signal of the multi-defective piles [51]. Figure 9 is the wavelet time–frequency image of 6 multi-defect piles. The rightmost small histogram is a legend, and the color represents the numerical value. For example, the first figure in Figure 9 shows that the main frequency component of the defect type 1 signal is less than 1 × 10⁴ Hz. The lowest frequency is yellow, and the specific frequency corresponds to its ordinate. The value of this frequency is about 0.75. Therefore, the size and color of the frequency components can judge the differences and characteristics of the six multi-defect piles.
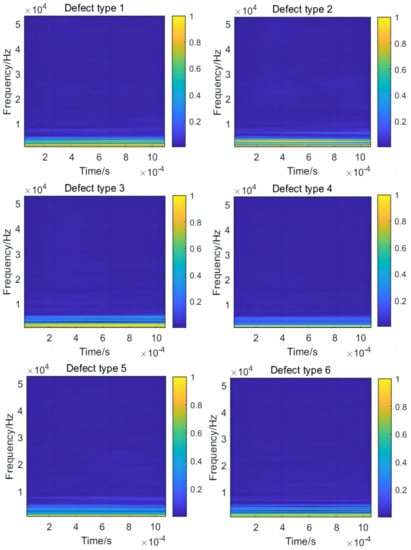
Figure 9.
Wavelet time–frequency diagram of 6 kinds of multi-defect piles.
2.5. TC-CNN Model for Multi-Defect Identification of Concrete Piles
2.5.1. CNN
The research on CNN began in the 1980s and 1990s. CNN consists of alternating convolutional and maximum pool sampling layers. The role of the fully connected layer and the output layer is to classify the features. The network components are the input, convolutional, pooling, fully connected, and output layers [52]. The convolution layer convolves the input layer’s feature vector or feature map with the convolution kernel, which implements the convolution operation as follows.
where f(x) and ω(t − x) are the convolution objects, and the output features can be obtained using a nonlinear activation function to prevent gradient dispersion or gradient explosion. After filtering the features in the pooling layer, reducing the dimensionality can refine the output feature information. Finally, the learned feature information of the network is mapped to the labels of the samples through the fully connected layer and the output layer to complete the classification.
2.5.2. TC-CNN
The TC-CNN model improves the traditional CNN model to extract more features in a limited dataset. A convolutional structure with 1D-CNN and 2D-CNN dual-channel parallelism extracts the input features. Medical image analysis, denoising, image classification, and fault diagnosis have applied this method [53,54,55]. This paper uses the TC-CNN model, which combines the LSPIT signal, wavelet transform, and CNN to identify multiple defects in concrete piles. The network parameters are shown in Table 5.

Table 5.
TC-CNN parameters for defect classification. Referring to other TC-CNN models, * is to distinguish layers with the same name that have appeared before.
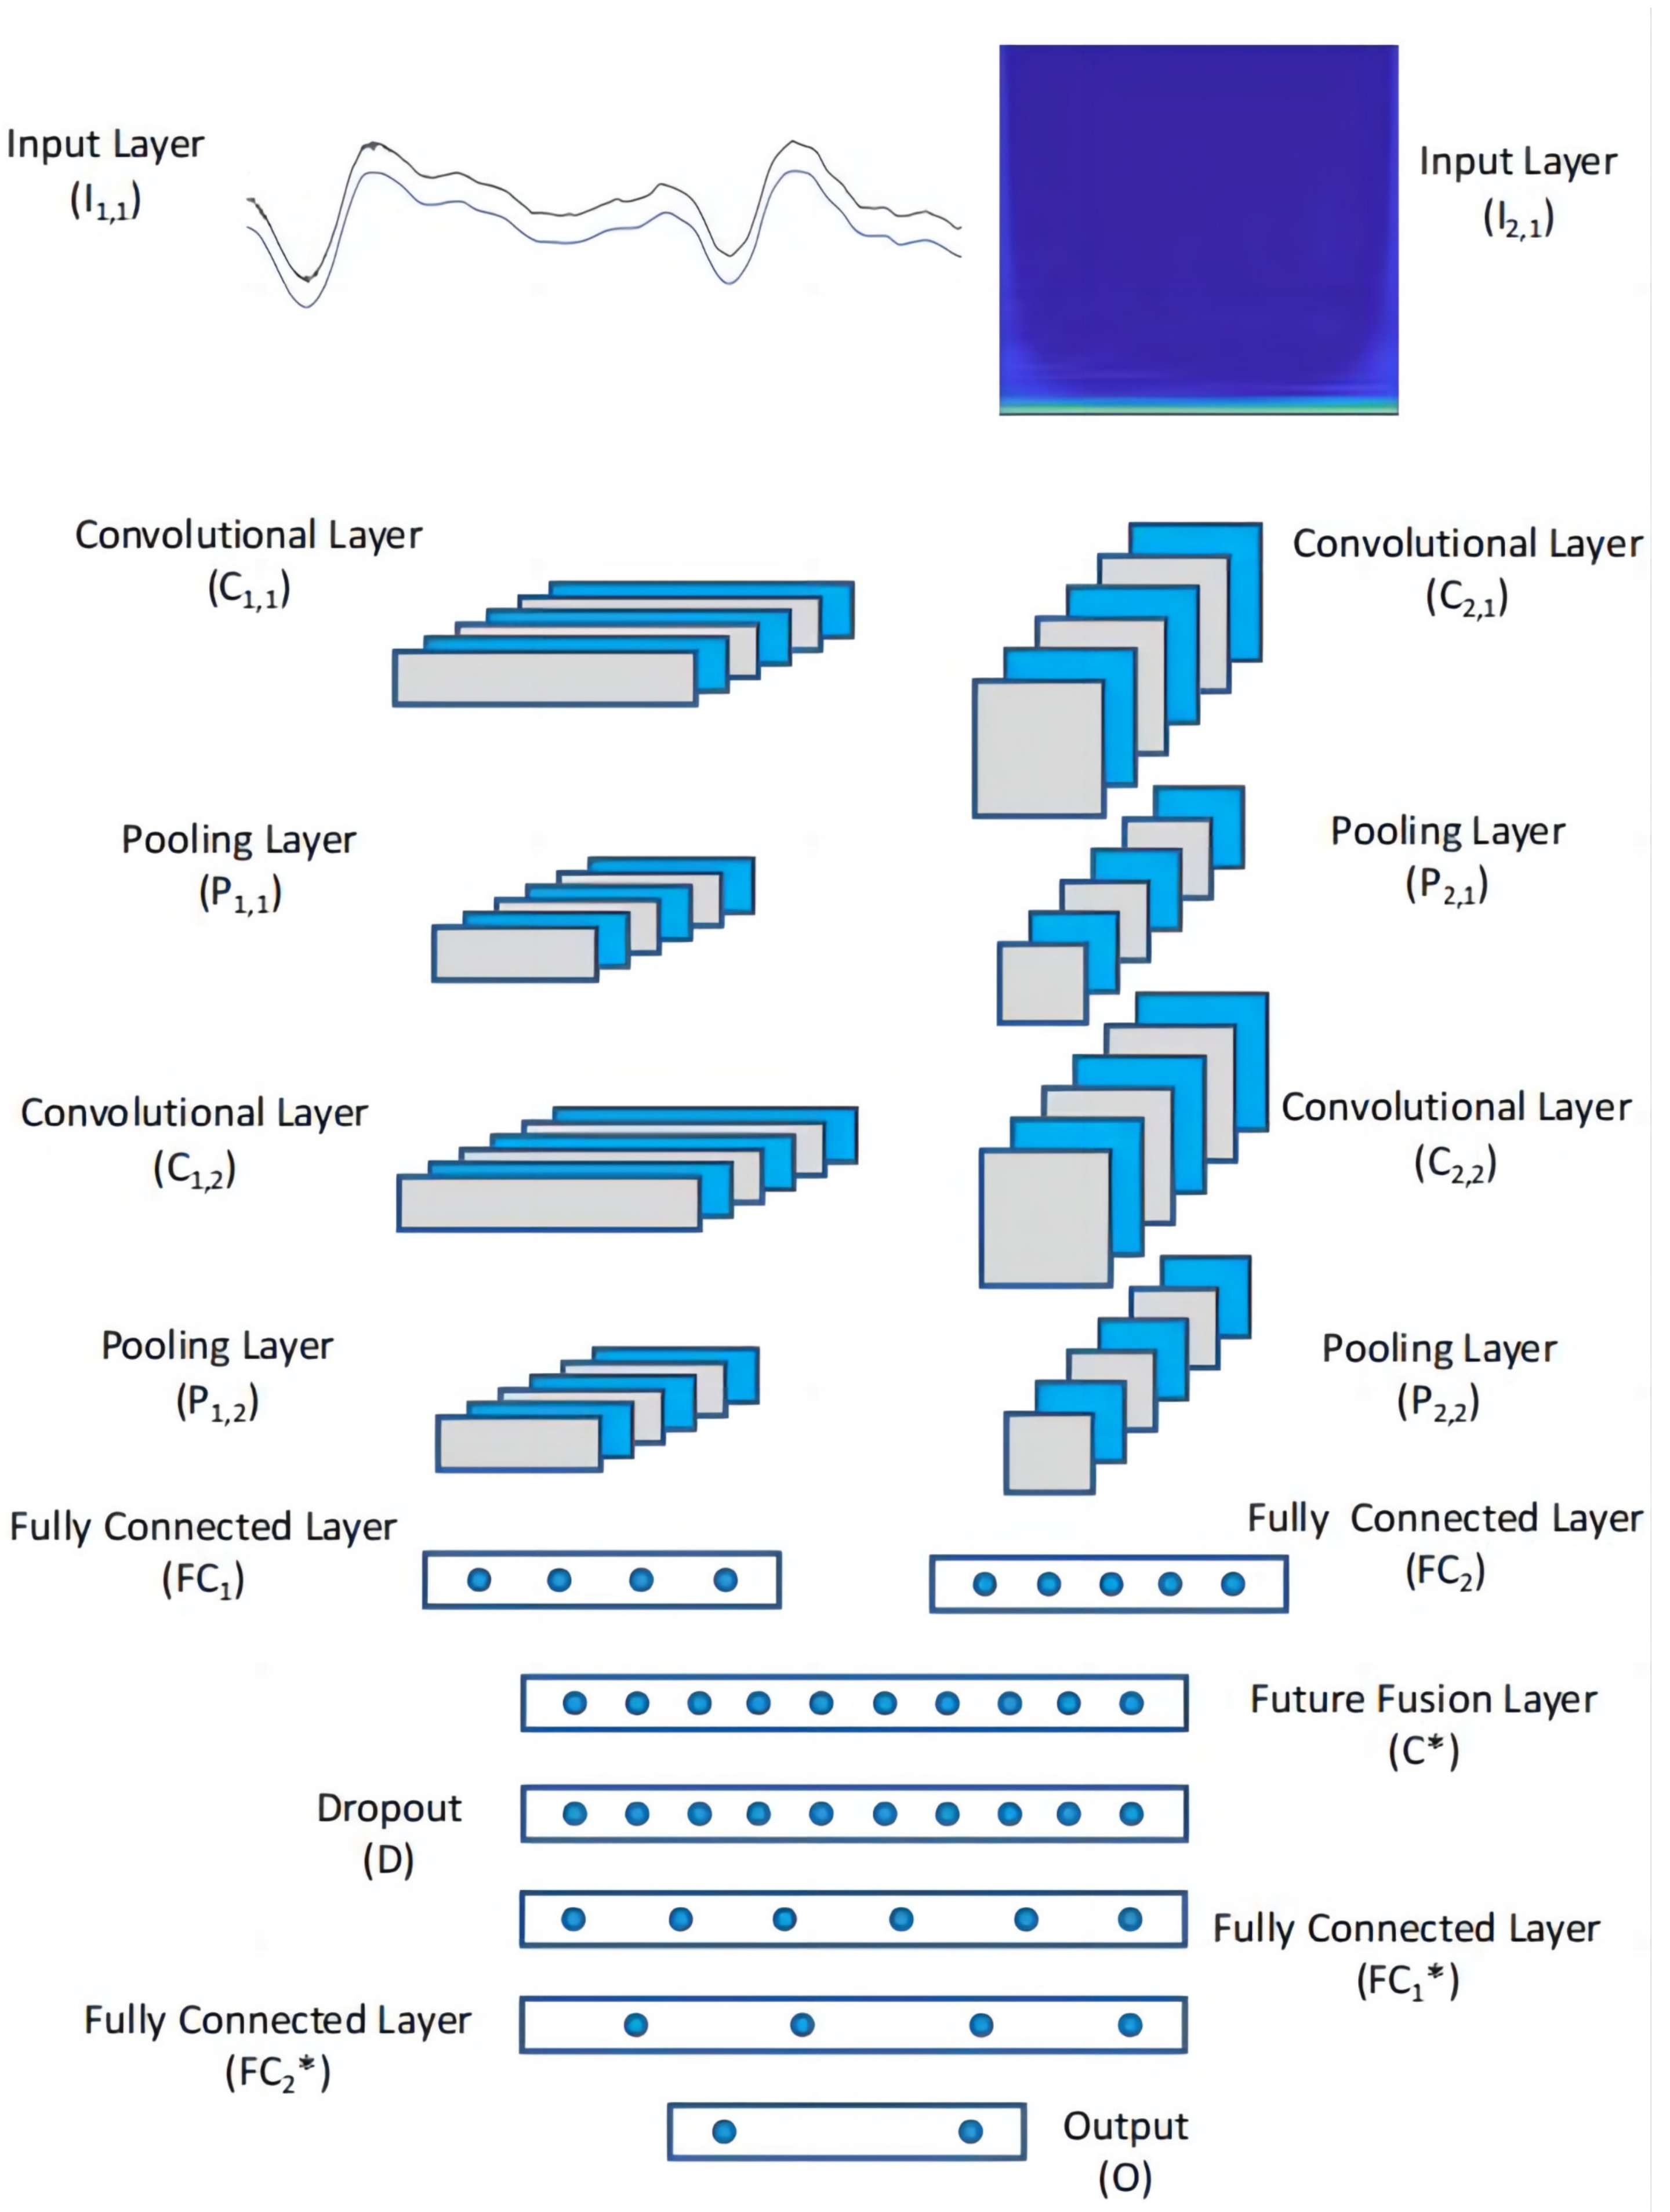
Wavelet packet denoising may remove important information in high-frequency noise. To prevent the data from losing too much information and overfitting after wavelet packet denoising reconstruction, this paper uses the 1D time-domain signals before and after denoising and the corresponding 2D wavelet time–frequency maps as the input data set. Then the models are trained by 1D-CNN of pileup time-domain signals and 2D-CNN of wavelet time–frequency images. Finally, save the trained models, and the test set is classified. This method can fully use the pile defect information to complement each other in different dimensions. Each channel includes two convolutional layers, two pooling layers, and a fully connected layer. The feature fusion layer splices the extracted ones of the two channels, and the dropout is 0.5. SGD [56] is the optimizer, and RELU [57] is the activation function. The learning rate is 0.005, and the network is set to 200 training cycles with a batch size of 64. Figure 10 shows the flow chart of this network structure.
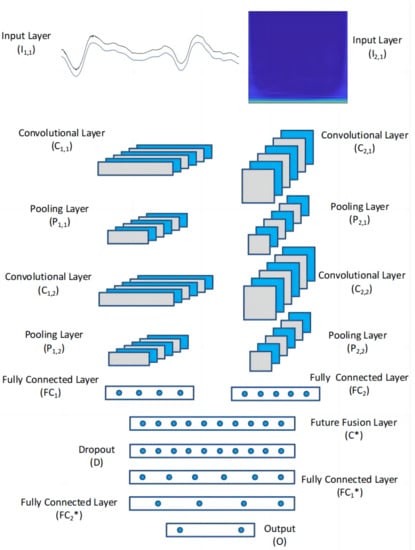
Figure 10.
Structure of TC-CNN classifier. Referring to other TC-CNN models, * is to distinguish layers with the same name that have appeared before.
3. Results
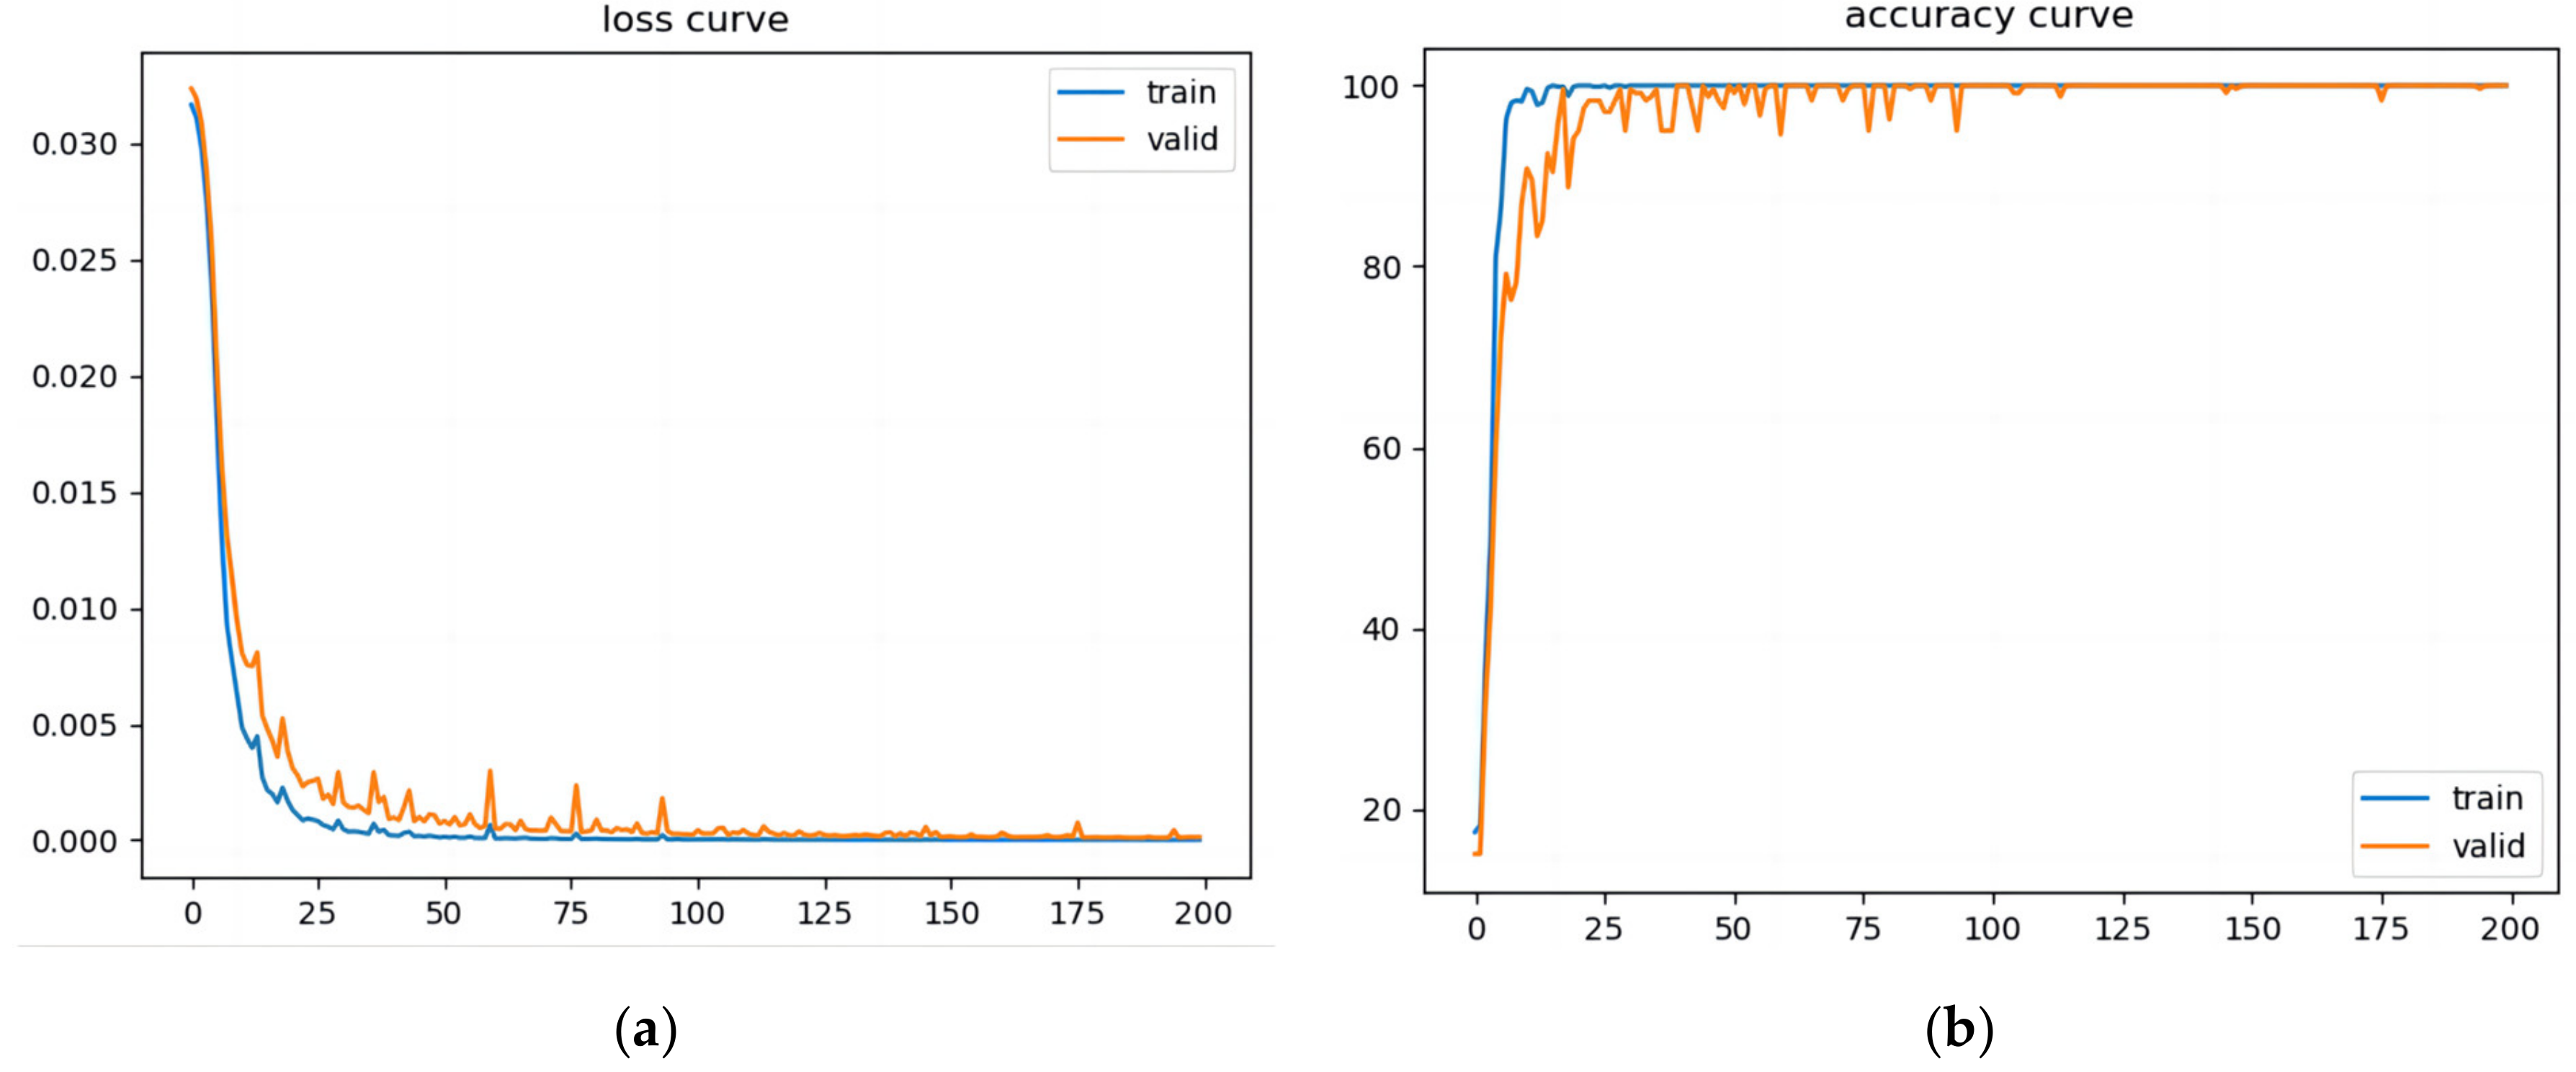
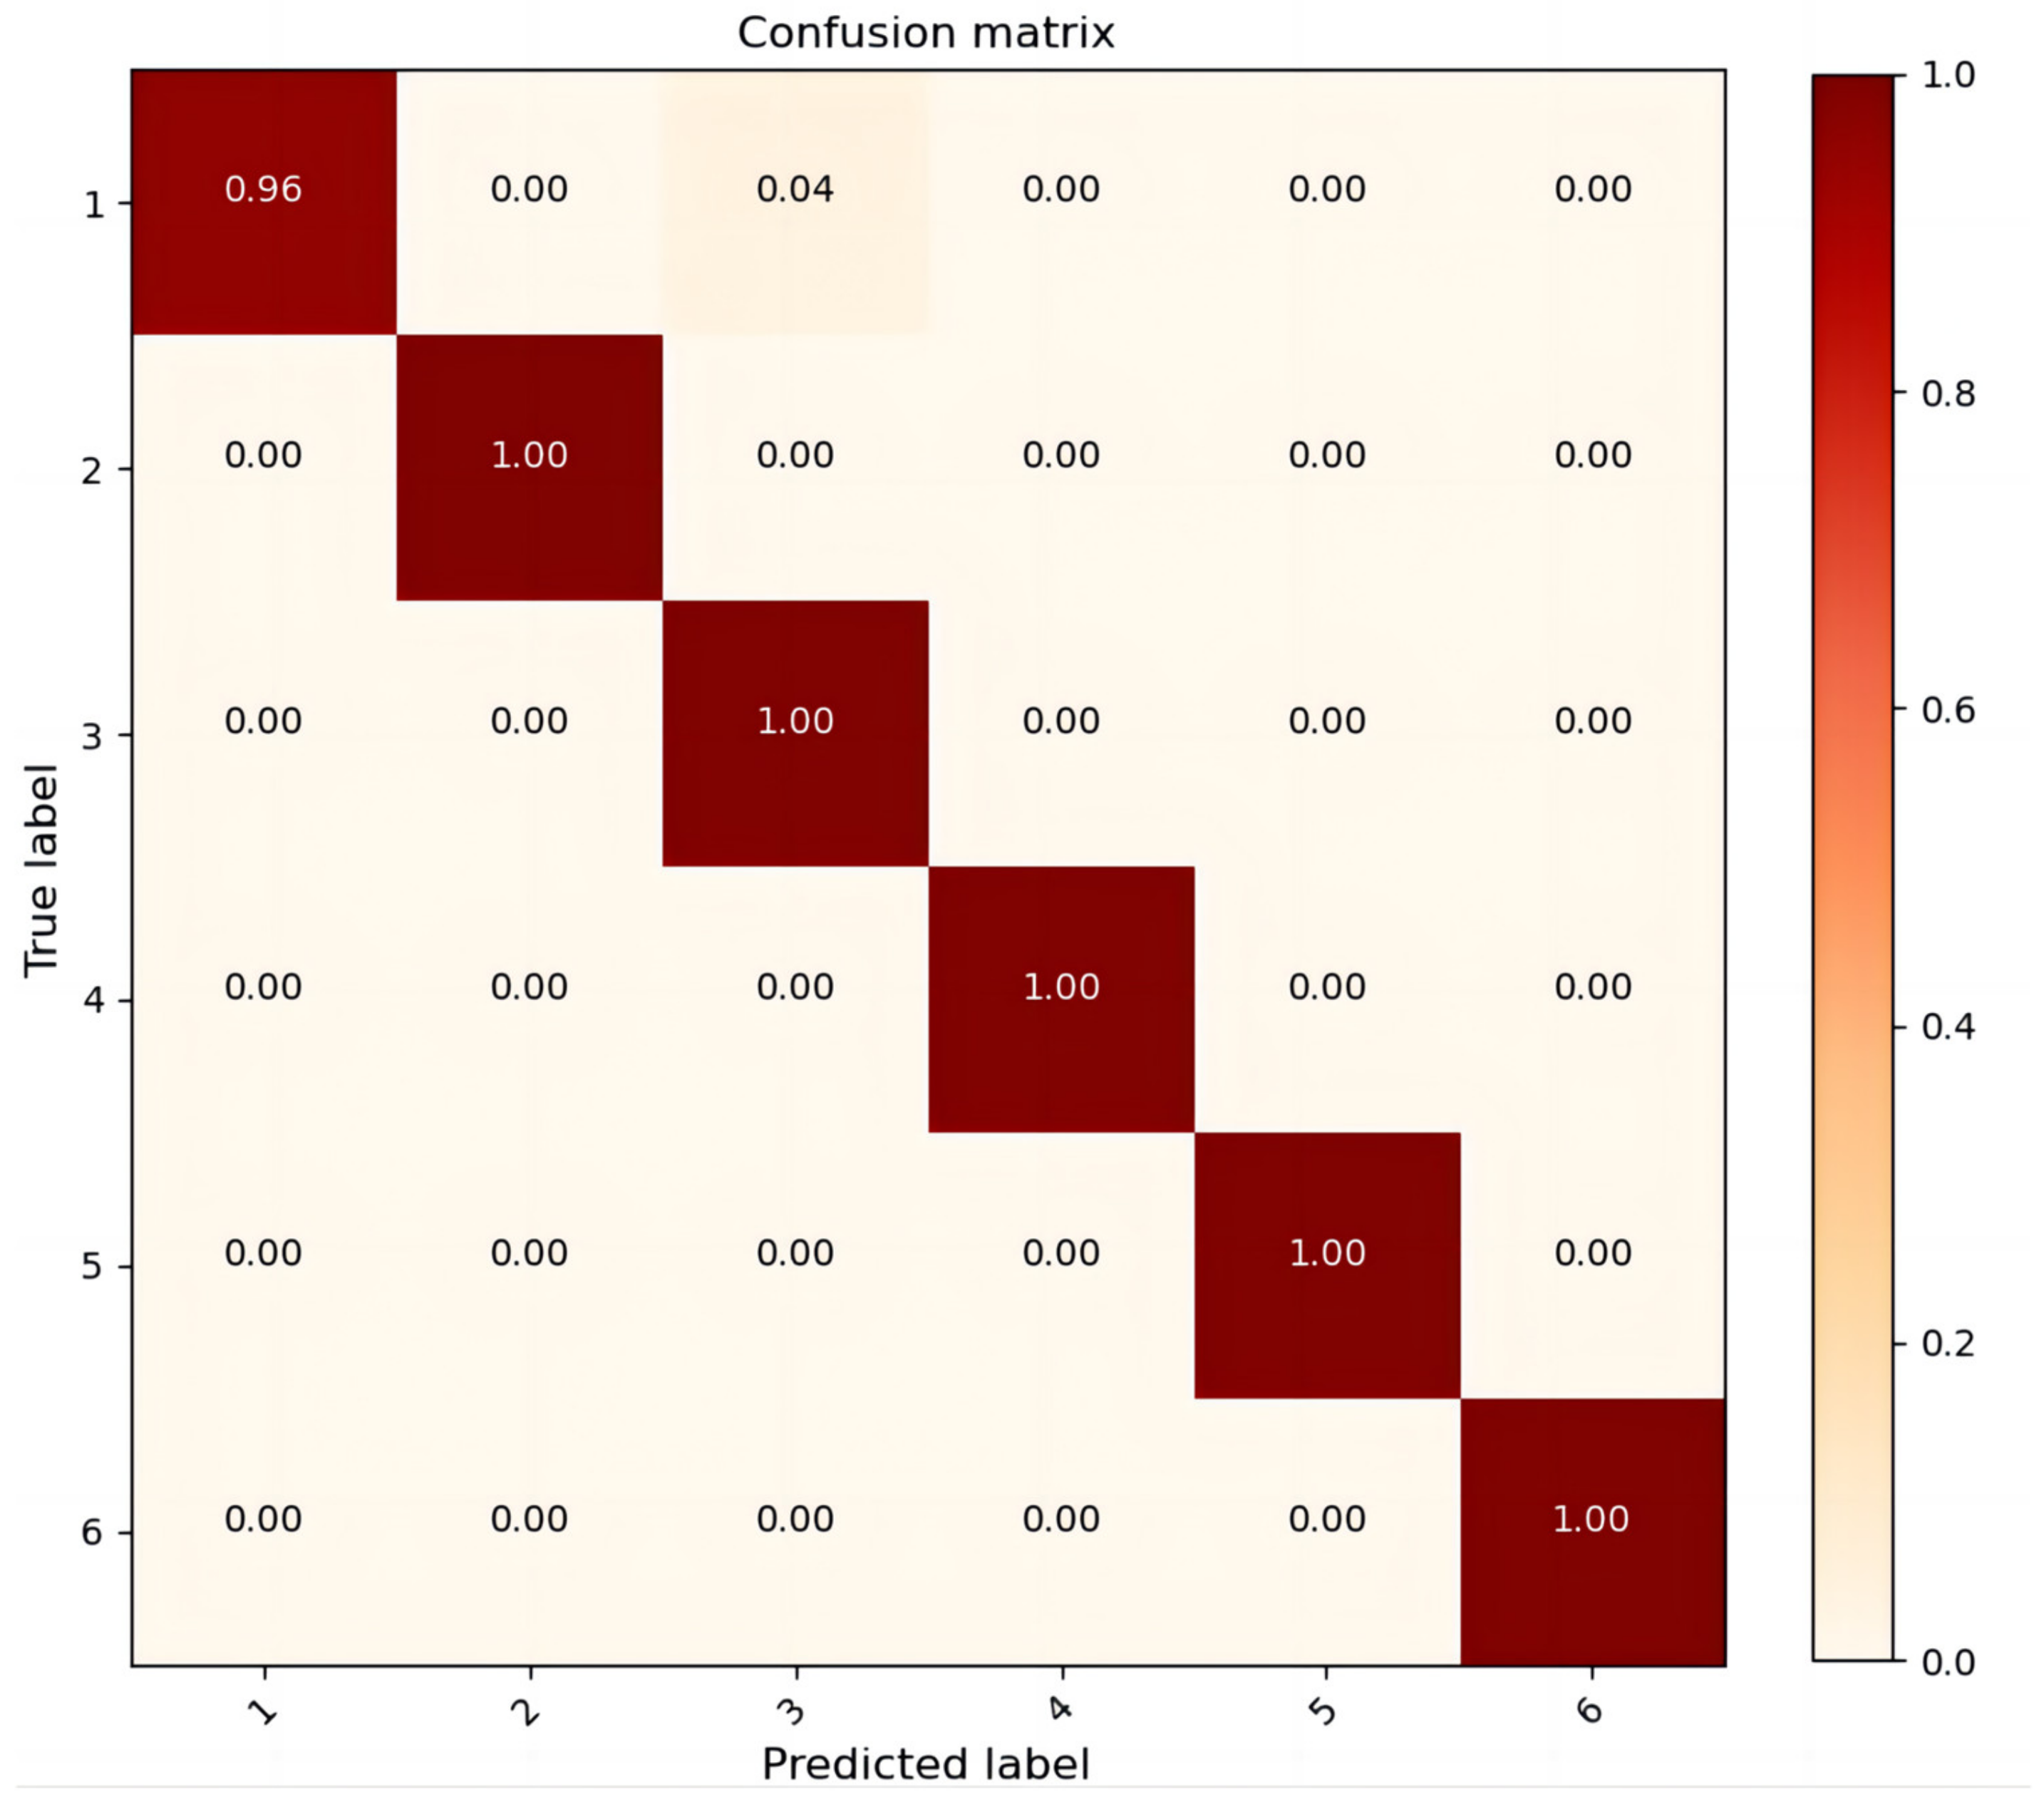
The one-dimensional time-domain signal and two-dimensional wavelet time–frequency map are input to TC-CNN, and Figure 11 and Figure 12 show the resulting training results. The accuracy of the training and validation sets is about 100%, and the accuracy of the test set is about 99.17%. The loss function curves show the training results of the training and validation sets, the accuracy curves, and the confusion matrix of the test set: the accuracy graph shows the improvement of accuracy in the 200 epochs of training, and the confusion matrix shows the correct recognition rate and specific error recognition of the six types of defects. Almost all types of defects are correctly recognized, and only 4% of the first type of defects were mistakenly entered into the third type of defect category.
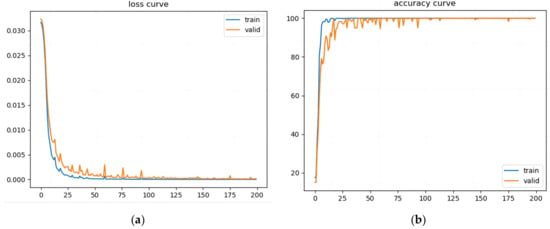
Figure 11.
TC-CNN ‘s overall training of 200 epochs. (a) Loss function curve; (b) Accuracy curve.
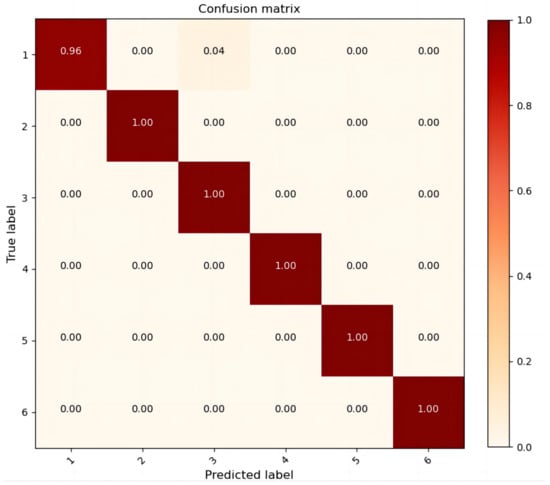
Figure 12.
Confusion matrix.
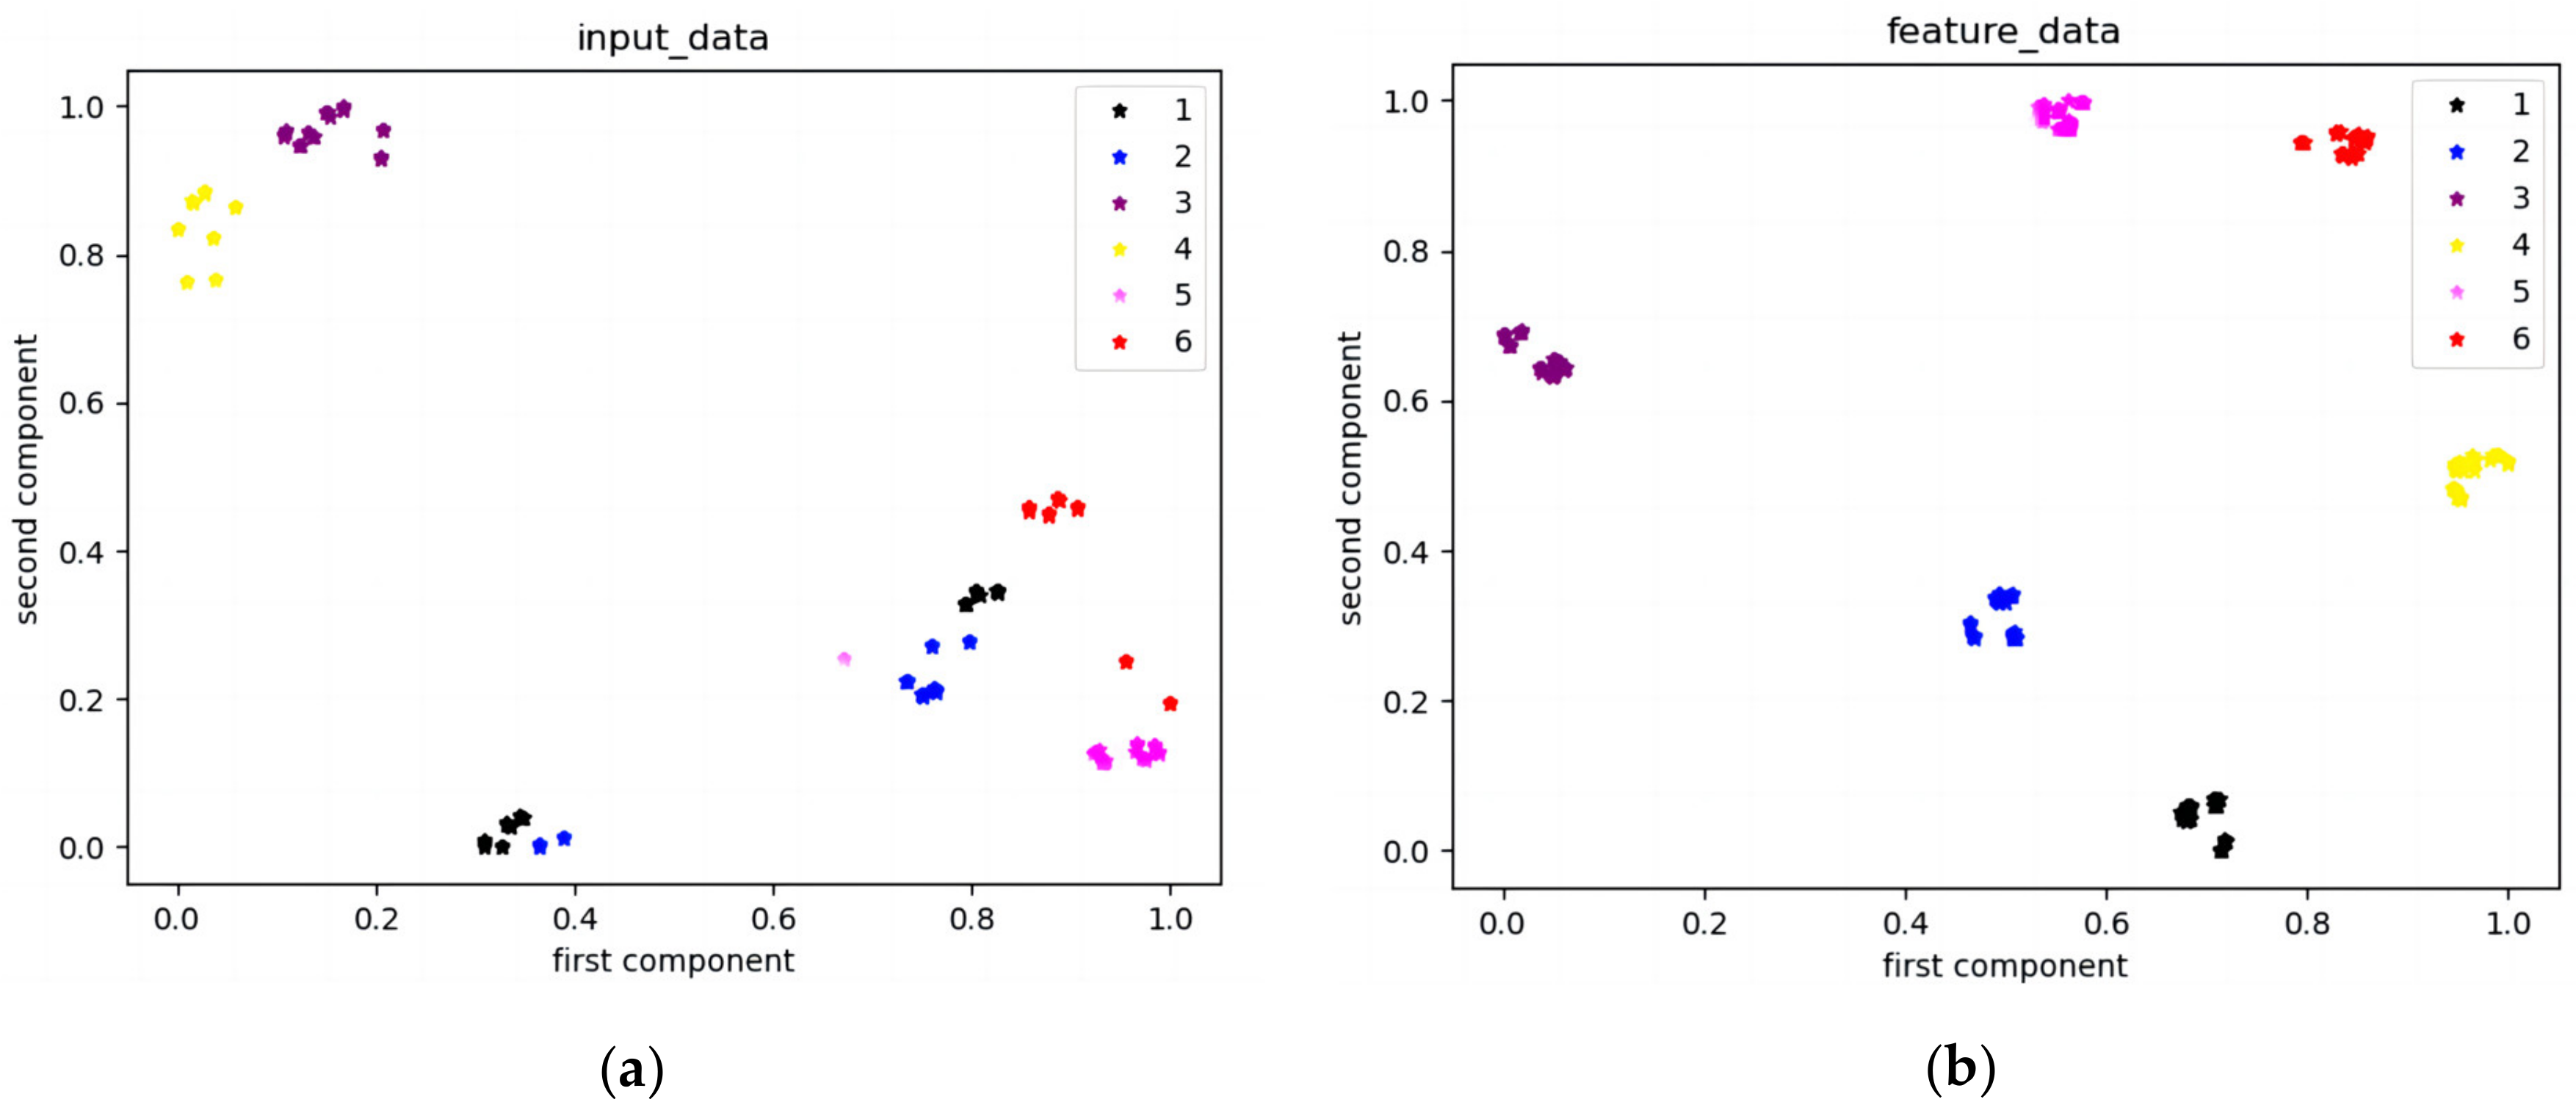
Figure 13 shows the mapping characteristics of the input data and output results. Using the T-distributed random neighbor embedding (T-SNE) method, we visualized the hierarchical feature learning process of TC-CNN. The learning features of the input data and output results of the test set are mapped to two dimensions. It shows the change in feature mapping of different classes during the model learning process. The input data features are relatively scattered and difficult to distinguish. After convolution, pooling, feature fusion, and other operations, the characteristics of the same class are very concentrated. Figure 13b shows good classification results.
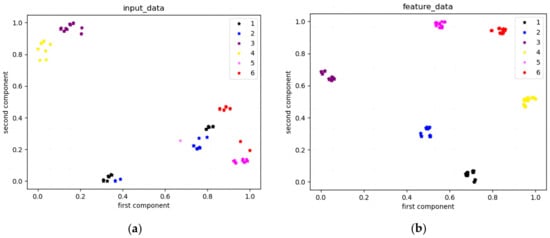
Figure 13.
The mapping characteristics of input data and output results. (a) Input data; (b) Output results.
In addition, to verify the method’s effectiveness for multi-defect pile feature extraction and classification, the 1D time-domain signal and 2D wavelet time–frequency map are input into the exact specification of conventional CNN for comparison experiments. Furthermore, using the same dataset compared the recognition accuracy. The recognition results of different methods are shown in Table 6.

Table 6.
The comparison of defect recognition accuracy.
From the data in Table 6: the defect recognition accuracies of the three methods on the training set are very close. However, there is a significant difference in recognition accuracy between the validation and test sets. TC-CNN is higher than 2D-CNN, while 2D-CNN is higher than 1D-CNN. Overall, TC-CNN outperforms single-channel CNN.
4. Conclusions
The data set for the results of this paper consists of a large number of numerical simulations. Although not as convincing as the actual experimental data, the method of this study is equally applicable in the future when a sufficient database of pile foundation defects is available.
This paper uses Python script to develop the finite element software, and the multi-defect pile foundation model realized adaptive meshing. The script can quickly simulate six multi-defect pile foundations’ velocity–time-domain curves. The velocity–time domain curve of the pile foundation is also a critical database source for the TC-CNN model. The LSPIT signal is a crucial feature source for the TC-CNN model. Therefore, firstly, the LSPIT signal needs to be denoised by a wavelet packet and then used as the input signal for the 1D-CNN model and wavelet transform, together with the original signal. Secondly, feature extraction and feature fusion are performed on the LSPIT signal and wavelet time–frequency map, respectively, by using two-channel CNN. Finally, this model used the softmax layer to classify multi-defective piles. The data set is 200 signal samples for each defective pile, totaling 1200. The training set (840), validation set (240), and test set (120) were divided into 7:2:1, and the TC-CNN model correctly classified 359 signals in 360 validation and test sets. The conclusions are as follows.
(1) Due to the influence of environmental noise and rebound waves, the LSPIT signal waveforms of multi-defect pile foundations are more complex than those of single-defect pile foundations. The accuracy of identifying the defect types only manually and from experience is low. Therefore, denoising the signal and then using computer techniques for feature extraction will help eliminate these factors’ effects.
(2) Using the time–frequency analysis method can convert the one-dimensional time-domain data, which CNN is not good at processing, into two-dimensional image data, which increases the diversity of features and complements the defect information.
(3) Compared with the recognition effect of the traditional single-channel CNN model, the dual-channel CNN model shows good robustness and stability by fusing the features of a single channel, which also improves the accuracy of defect recognition.
(4) This study only denoises the original time-domain signal. Theoretically, if the input 2D-CNN image is also denoised, the feature differences between various multi-defect piles may be more prominent. It can reduce the training time of the TC-CNN model while maintaining high recognition accuracy. Therefore, researchers can combine advanced image-denoising technology in subsequent research to achieve further improvement.
Author Contributions
Conceptualization, C.-S.W.; data curation, C.-S.W. and J.-Q.Z.; formal analysis, C.-S.W.; funding acquisition, D.-B.Z.; investigation, M.G.; methodology, M.G.; project administration, C.-S.W.; resources, D.-B.Z.; software, T.-Q.H.; supervision, L.-L.Q. and Y.-X.P.; validation, J.-Q.Z., D.-B.Z.; visualization, T.-Q.H.; writing—original draft, C.-S.W.; writing—review and editing, L.-L.Q. All authors have read and agreed to the published version of the manuscript.
Funding
This research was supported by the Fund of National-local Joint Engineering Laboratory for Road Engineering and Disaster Prevention and Mitigation Technology in Mountainous Areas (No. 2018Road002), the Open Fund of Key Laboratory of Geological Hazards Mitigation for Mountainous Highway and Waterway, Chongqing Municipal Education Commission Chongging Jiaotong University (kfxm2018-05), the Postdoctoral Fund Project of the Chongqing Natural Science Foundation (Cstc2019jcyj-bshx0113) and China Postdoctoral Science Foundation (2019M653346).
Institutional Review Board Statement
Not applicable.
Informed Consent Statement
Not applicable.
Data Availability Statement
Not applicable.
Conflicts of Interest
The authors declare no conflict of interest.
References
- Khedmatgozar Dolati, S.S.; Caluk, N.; Mehrabi, A.; Khedmatgozar Dolati, S.S. Non-Destructive Testing Applications for Steel Bridges. Appl. Sci. 2021, 11, 9757. [Google Scholar] [CrossRef]
- Liu, J.L.; Wang, S.F.; Zheng, J.Y.; Chang, C.M. Time–Frequency Signal Processing for Integrity Assessment and Damage Localization of Concrete Piles. Int. J. Struct. Stab. Dyn. 2019, 20, 2050020. [Google Scholar] [CrossRef]
- Zhussupbekov, A.; Shakirova, N. Detection of Defects in Bored Piles by Non-Destructive Methods on LRT Construction Site. IOP Conf. Ser. Earth Environ. Sci. 2021, 727, 012026. [Google Scholar] [CrossRef]
- Dai, Y.W. Research on Damage Identification Reliability Method of the Solid Concrete Pile Based on Low Strain Reflected Wave Method. Ph.D. Thesis, South China University of Technology, Guangzhou, China, 2018. [Google Scholar]
- Lin, Z.Y.; Gu, Y.; Guo, W.; Wang, Y.Q. Pile recognition method and system based on deep learning. Pat. Qizhidao 2020, 1, 0717. [Google Scholar]
- Pan, Z.D.; Cheng, S.M.; Tang, Y.D. Application of Wavelet and Neural Network to Defect Diagnosing of Piles. J. Vibr. Meas. Diagn. 2006, 26, 203–207. [Google Scholar]
- Mou, L.L. Study on Wavelet Analysis and Neural Network Method for Dynamic Inversion of Pile Foundation. Master’s Thesis, Wuhan University of Technology, Hubei, China, 2007. [Google Scholar]
- Borst, R.D.; Yuan, Y.; Cu, J.Z. Computational Structural Engineering. In Proceedings of the International Symposium on Computational Structural Engineering, Shanghai, China, 22–24 June 2009. [Google Scholar]
- Cai, Q.Y.; Lin, J.H. Pile Defect Diagnosis Based on Wavelet Analysis and Neural Network. J. Vibr. Shock 2002, 21, 13–17. [Google Scholar]
- Koteleva, N.; Loseva, E. Development of an Algorithm for Determining Defects in Cast-in-Place Piles Based on the Data Analysis of Low Strain Integrity Testing. Appl. Sci. 2022, 12, 10636. [Google Scholar] [CrossRef]
- Yu, Z.Y.; Zhang, L. Judge the Integrality of Pile by Low Strain Dynamic Test Frenquency Analysis. J. G. Communic. Polyt. 2005, 4, 57–59. [Google Scholar]
- Ni, S.H.; Lehmann, L.; Charng, J.J.; Lo, K.F. Low-strain integrity testing of drilled piles with high slenderness ratio. Comput. Geotech. 2006, 33, 283–293. [Google Scholar] [CrossRef]
- Li, P.; Tian, Q.S.; Huo, M. Recognition Method of Partial Discharge Type of Transformer Based on Wavelet Transform and Hog Feature. Electric Drive 2021, 51, 52–56+62. [Google Scholar]
- Ni, S.H.; Lo, K.F.; Lehmann, L.; Huang, Y.H. Time–frequency analyses of pile-integrity testing using wavelet transform. Comput. Geotech. 2008, 35, 600–607. [Google Scholar] [CrossRef]
- Peng, Z.H. The Integrity Testing Methods Research on the Working Piles of High-piled Wharf. Master’s Thesis, Tianjin University, Tianjin, China, 2009. [Google Scholar]
- Wu, Y.X. Research on the Application of Wavelet Transform in the Integrity Detection of Pile Foundation. Urban. Arch. 2020, 17, 122–123. [Google Scholar]
- Avci, O.; Abdeljaber, O.; Kiranyaz, S.; Hussein, M.; Gabbouj, M.; Inman, D.J. A review of vibration-based damage detection in civil structures: From traditional methods to Machine Learning and Deep Learning applications. Mech. Syst. Signal. Process. 2021, 147, 107077. [Google Scholar] [CrossRef]
- Liu, W.P.; Tian, S.W. Classification of pile integrity using convolutional neural network. J. Nanchang Univ. Eng. Technol. 2021, 43, 263–268. [Google Scholar]
- Wu, C.S.; Zhang, J.Q.; Qi, L.L.; Zhuo, D.B. Defect Identification of Concrete Piles Based on Numerical Simulation and Convolutional Neural Network. Buildings 2022, 12, 664. [Google Scholar] [CrossRef]
- Abdeljaber, O.; Avci, O.; Kiranyaz, S.; Gabbouj, M.; Inman, D.J. Real-time vibration-based structural damage detection using one-dimensional convolutional neural networks. J. Sound Vib. 2017, 388, 154–170. [Google Scholar] [CrossRef]
- Abdeljaber, O.; Sassi, S.; Avci, O.; Kiranyaz, S.; Ibrahim, A.A.; Gabbouj, M. Fault Detection and Severity Identification of Ball Bearings by Online Condition Monitoring. IEEE Trans. Ind. Electron. 2019, 66, 8136–8147. [Google Scholar] [CrossRef]
- Yuan, X.; Tanksley, D.; Li, L.; Zhang, H.; Chen, G.; Wunsch, D. Faster Post-Earthquake Damage Assessment Based on 1D Convolutional Neural Networks. Appl. Sci. 2021, 11, 9844. [Google Scholar] [CrossRef]
- Qin, Y.; Shi, X. Fault Diagnosis Method for Rolling Bearings Based on Two-Channel CNN under Unbalanced Datasets. Appl. Sci. 2022, 12, 8474. [Google Scholar] [CrossRef]
- Zheng, J.; Chen, Z.; Wang, Q.; Qiang, H.; Xu, W. GIS Partial Discharge Pattern Recognition Based on Time-Frequency Features and Improved Convolutional Neural Network. Energies 2022, 15, 7372. [Google Scholar] [CrossRef]
- Bi, Z.W. The Existing Problems and Solutions of the Pile Foundation Measurement. Master’s Thesis, Jilin University, Jilin, China, 2015. [Google Scholar]
- Ni, S.H.; Yang, Y.Z.; Tsai, P.H.; Chou, W.H. Evaluation of pile defects using complex continuous wavelet transform analysis. NDT E Int. 2017, 87, 50–59. [Google Scholar] [CrossRef]
- Finno, R.J.; Gassman, S.L. Impulse Response Evaluation of Drilled Shafts. J. Geotech. Geoenviron. Eng. 1998, 124, 965–975. [Google Scholar] [CrossRef]
- Messina, A. Refinements of damage detection methods based on wavelet analysis of dynamical shapes. Int. J. Solids Struct. 2008, 45, 4068–4097. [Google Scholar] [CrossRef]
- Chen, H.Y.; Zhang, L.L. ABAQUS Finite Element Analysis from Introduction to Mastery, 2nd ed.; Electronic Industry Press: Beijing, China, 2015; pp. 876–882. [Google Scholar]
- Protopapadakis, E.; Schauer, M.; Pierri, E.; Doulamis, A.D.; Stavroulakis, G.E.; Böhrnsen, J.U.; Langer, S. A genetically optimized neural classifier applied to numerical pile integrity tests considering concrete piles. Comput. Struct. 2016, 162, 68–79. [Google Scholar] [CrossRef]
- Huang, C.H. Application of pile foundation dynamic test method to test pile quality. Jiangxi Coal Technol. 2001, 23, 23–25. [Google Scholar]
- Hou, H.L. Experimental and Numerical Simulation Study on Low Strain Reflected Wave Method for Detecting Integrity of Freezing Pipe. Master’s Thesis, China University of Mining and Technology, Jiangsu, China, 2021. [Google Scholar]
- Cooke, R.W.; Price, G.; Tarr, K. Jacked piles in London clay: Interaction and group behaviour under working conditions. Geotechnique 1980, 30, 97–136. [Google Scholar] [CrossRef]
- Li, J.B. Bridge Foundation Pile Detection by Elastic Wave Method for Intercity Railway in South Sichuan. Master’s Thesis, Southwest Jiaotong University, Sichuan, China, 2020. [Google Scholar]
- ASTM D5882-07; Standard Test Method for Low Strain Impact Integrity Testing of Deep Foundations. ASTM International: West Conshohocken, PA, USA, 2007.
- Li, H.B.; He, H.J.; Xu, W.Q.; Yang, C.S. Application and ABAQUS numerical simulation for the curves of dynamic pile testing based on entity model. Geotech. Investig. Surv. 2011, 39, 87–90. [Google Scholar]
- Chen, Y.; Chen, H.; Tan, J.; Ying, H.Q. Application of reflection wave method in pile foundation detection. In Proceedings of the 21st National Conference on High Technology and Application of Vibration and Noise, Hefei, China, 31 October 2008; pp. 581–586. [Google Scholar]
- Hou, S.Z. Secondary Development of White Sandstone Damage Constitutive Model Based on ABAQUS. Master’s Thesis, Qingdao University of Science and Technology, Shandong, China, 2022. [Google Scholar]
- Xu, Y.F.; Xiao, Y.X.; Wu, Y.H. Implementation and application of adaptive grid repartitioning algorithm based on Python-Abaqus. Chin. J. Comput. Mech. 2022, 6, 1–8. [Google Scholar]
- Zhong, M.; Meng, K. Theoretical Analysis of Dynamic Response of Pipe Pile with Multi-Defects. J. Mar. Sci. Eng. 2023, 11, 83. [Google Scholar] [CrossRef]
- Xiao, S.; Wang, K.H.; Zhang, R.H.; Wang, M.B. Field test and numerical simulation of low strain dynamic response of static drill rooted pile. J. Shanghai Jiaotong Univ. 2020, 54, 406–412. [Google Scholar]
- Coifman, R.R.; Wickerhauser, M.V. Entropy-Based Algorithms for Best Basis Selection. IEEE Trans. Inf. Theory 1992, 38, 713–718. [Google Scholar] [CrossRef]
- Zhang, J.; Tao, B.B. Research on Wavelet Denoising Based on MATLAB. J. Liaoning Univ. Technol. 2022, 42, 177–182. [Google Scholar]
- LI, S.L. Fault Feature Extraction of Rolling Bearing Based on Wavelet Packet. Master’s Thesis, Kunming University of Science and Technology, Yunnan, China, 2019. [Google Scholar]
- He, Q. Vibration signal classification by wavelet packet energy flow manifold learning. J. Sound Vib. 2013, 332, 1881–1894. [Google Scholar] [CrossRef]
- Xu, J. Localization and Analysis of Transient Power Quality Disturbance Based on Hilbert-Huang Transform and Wavelet Packet Denoising. Master’s Thesis, Ningxia University, Ningxia, China, 2016. [Google Scholar]
- Zhu, N.K. Application of Wavelet Packet Analysis in Data Processing of Extra-Large Steel Box Girder Bridge. Stand. Surv. Mapp. 2021, 37, 64–69. [Google Scholar]
- Liu, H.; Li, L.; Ma, J. Rolling Bearing Fault Diagnosis Based on STFT-Deep Learning and Sound Signals. Shock Vib. 2016, 2016, 6127479. [Google Scholar] [CrossRef]
- Gao, S.; Jiang, Z.; Liu, S. An Approach to Intelligent Fault Diagnosis of Cryocooler Using Time-Frequency Image and CNN. Comput. Intel. Neurosci. 2022, 2022, 1754726. [Google Scholar] [CrossRef]
- Cheng, Q.; Zhao, Z.; Tang, C.; Qian, G.; Islam, S. Diagnostic of transformer winding deformation fault types using continuous wavelet transform of pulse response. Measurement 2019, 140, 197–206. [Google Scholar] [CrossRef]
- Cohen, M.X. A better way to define and describe Morlet wavelets for time-frequency analysis. Neuroimage 2019, 199, 81–86. [Google Scholar] [CrossRef]
- Gou, L.; Li, H.; Zheng, H.; Li, H.; Pei, X. Aeroengine Control System Sensor Fault Diagnosis Based on CWT and CNN. Math. Probl. Eng. 2020, 2020, 5357146. [Google Scholar] [CrossRef]
- Xu, X.; Zhou, F.; Liu, B. Automatic bladder segmentation from CT images using deep CNN and 3D fully connected CRF-RNN. Int. J. Comput. Assist. Radiol. Surg. 2018, 13, 967–975. [Google Scholar] [CrossRef]
- Gao, J.; Yu, Z.; Nie, K.; Xu, J. A Real Noise Elimination Method for CMOS Image Sensor Based on Three-Channel Convolution Neural Network. IEEE Sens. J. 2020, 20, 11549–11555. [Google Scholar] [CrossRef]
- Hua, W.; Xie, W.; Jin, X. Three-Channel Convolutional Neural Network for Polarimetric SAR Images Classification. IEEE J. Sel. Top. Appl. Earth Obs. Remote Sens. 2020, 13, 4895–4907. [Google Scholar] [CrossRef]
- Garbin, C.; Zhu, X.; Marques, O. Dropout vs. batch normalization: An empirical study of their impact to deep learning. Multimed. Tools Appl. 2020, 79, 12777–12815. [Google Scholar] [CrossRef]
- Nair, V.; Hinton, G.E. Rectified Linear Units Improve Restricted Boltzmann Machines Vinod Nair. In Proceedings of the 27th International Conference on Machine Learning (ICML-10), Haifa, Israel, 21–24 June 2010. [Google Scholar]
Disclaimer/Publisher’s Note: The statements, opinions and data contained in all publications are solely those of the individual author(s) and contributor(s) and not of MDPI and/or the editor(s). MDPI and/or the editor(s) disclaim responsibility for any injury to people or property resulting from any ideas, methods, instructions or products referred to in the content. |
© 2023 by the authors. Licensee MDPI, Basel, Switzerland. This article is an open access article distributed under the terms and conditions of the Creative Commons Attribution (CC BY) license (https://creativecommons.org/licenses/by/4.0/).

