Article

Application of Near Infrared Hyperspectral Imaging Technology in Purity Detection of Hybrid Maize

1
College of Optoelectronic Engineering, Changchun University of Science and Technology, Changchun 130022, China
2
College of Electronic and Information Engineering, Beihua University, Jilin 132021, China
*
Author to whom correspondence should be addressed.
Appl. Sci. 2023, 13(6), 3507; https://doi.org/10.3390/app13063507
Submission received: 17 December 2022 / Revised: 11 February 2023 / Accepted: 7 March 2023 / Published: 9 March 2023

Abstract

:
Seed purity has an important impact on the yield and quality of maize. Studying the spectral characteristics of hybrid maize and exploring the rapid and non-destructive detection method of seed purity are conducive to the development of maize seed breeding and planting industry. The near-infrared spectral data of five hybrid maize seeds were collected in the laboratory. After eliminating the obvious noises, the multiple scattering correction (MSC) was applied to pretreat the spectra. PLS-DA, KNN, NB, RF, SVM-Linear, SVM-Polynomial, SVM-RBF, and SVM-Sigmaid were used as pattern recognition methods to classify five different types of maize seeds. The recognition accuracy of the models established by different algorithms was 84.4%, 97.6, 100%, 96.4, 99.2%, 100%, 98.4%, and 91.2%, respectively. The results indicated that hyperspectral imaging technology could be used for variety classification and the purity detection of maize seeds. To improve the calculation speed, using the principal component analysis (PCA) to reduce the dimension of hyperspectral data, we then established classification models based on characteristic wavelengths. The recognition accuracy of the models established by different algorithms was 80.8%, 86.8%, 98%, 94%, 96.8%, 98.4%, 94.4%, and 88.2%, respectively. The results showed that the selected sensitive wavelengths could be used to detect the purity of maize seeds. The overall results indicated that it was feasible to use near-infrared hyperspectral imaging technology for the variety identification and purity detection of maize seeds. This study also provides a new method for rapid and non-destructive detection of seed purity.

1. Introduction

Maize is one of the most important crops as food and feedstuff in the world. Its planting areas and total output are second only to rice and wheat. At present, the planting area of maize in the world has exceeded 2 billion acres, which is one of the fastest growing crops in recent years. The traditional maize seeding method is “one hole multiple seeds”. This method requires artificial thinning, seedling removal, and seedling repair after seed germination, which wastes seeds and soil fertility and is time-consuming and laborious. With the promotion of “precision seeding”, the single seed seeding technology can reduce the seed amount by more than 60% and save a lot of working hours to maximize the production potential of each maize variety and achieve a high yield of maize. The single seed sowing method has high requirements for seed quality. The United States requires the purity of hybrid seeds to be more than 98% for the quality of maize seeds used for single seed sowing. However, the purity of seeds processed by China’s existing seed processing equipment is low, which is unsuitable for the high-speed operation of suction seeders.
Seed purity refers to the degree of typical consistency in characteristics, which directly affects the yield and quality of maize. With the promotion of single seed sowing technology in China accelerating year by year, to ensure seed quality and standardize the seed market, it is necessary to select and grade maize seeds before they are put on the market [1]. The traditional methods for testing the purity of varieties include seed morphology identification, seedling identification, field plot planting identification, electrophoresis, etc. [2,3,4,5,6,7,8]. These methods generally take a long time and require professional personnel and special instruments. However, the test results are greatly affected by the subjective experience of the test personnel. Therefore, developing rapid, accurate, and non-destructive methods for classifying and identifying maize seeds is important in the seed industry.
In recent years, with the development of spectroscopy technology and image processing technology, near-infrared spectroscopy (NIRS) has been widely studied and deeply used in seed purity and quality detection [9,10,11,12,13]. In the field of grain research, researchers used near-infrared spectroscopy technology to study the material content, vigor, moisture, authenticity, and defect seed detection of seeds. W. Kong et al. used the random forest to establish the rice seed variety recognition model, and the model accuracy based on the characteristic wavelength exceeded 80% [14]. J. L. Tang, R. H. Miao, and others used ML and SVM for farmland target classification, and the total classification accuracy exceeded 97.5%, while the SVM-M model can reach 99.5% [15]. S. N. Wang et al. conducted convolution smoothing pretreatment on the spectrum of soybeans and identified soybean varieties through the character wavelength strengths and limit learning machine with an accuracy of 78.22% [16]. These studies revealed that the hyperspectral imaging method was feasible for the classification and identification of seeds. In terms of classification and detection of maize seeds, S. Q. Jia et al. used the characteristic wavelengths selection method based on standard deviation, combined with PCA and LDA to reduce the dimension of the data, and established an identification model for the female parent and its hybrid varieties of maize. The correct identification rate reached more than 90% [17]. Y. K. Rui et al. used near-infrared spectroscopy to detect and identify transgenic maize and obtained good recognition results [18]. L. G. Wang et al. classified maize varieties in the visible light band, reduced the dimension of data by PCA, and established a CNN model to realize the non-destructive testing of corn varieties [19]. G. J. Qiu et al. used the Fourier transform near-infrared spectroscopy combined with discriminant analysis to classify sweet corn seeds, they used KNN to build the model, and the accuracy was 97.56% [20]. Although these studies have achieved high classification accuracy, the premise is that there is a large data set. If the number of experimental samples is small, or even smaller than the data dimension, it is difficult to ensure the classification accuracy, resulting in results that do not meet the requirements of the single seed sowing method for seed authenticity. Moreover, with the development of commercial breeding technology, there are more and more varieties of maize. There are a lot of hybrids with the same parents, and the differences between individual seeds are small. There are few studies on the classification of hybrids with the same parents.
In this paper, five different kinds of hybrid maize seeds were chosen as the research objects. The hyperspectral imaging system was used to acquire the hyperspectral images in the spectral range of 881~1715 nm with 256 bands of the seeds. Multiple Scattering Correction (MSC) was used to pretreat the spectrum, and Principal Component Analysis (PCA) was used to reduce the dimension of the data. The seven characteristic wavelengths with the highest weight were used as the input to build the classification models of maize based on PLS-DA, KNN, NB, RF, SVM-Linear, SVM-Polynomial, SVM-RBF, and SVM-Sigmoid, and the impact of different algorithms on the classifier performance is obtained through the accuracy assessment of the classification results. Through this study, we can provide an experimental basis for applying hyperspectral imaging technology in the quality inspection of seeds and provide a more effective method for purity detection in maize seeds.

2. Materials and Methods

2.1. Samples

The five kinds of corn seeds used for the experiments were provided by the Jilin Guangde Agricultural Science and Technology Co., Ltd. (located at 42°39′ N, 126°08′ E). The names of corn varieties were 2490, 2780, GD5, XX8, and XY335, respectively. The 2490, 2780, GD5, and XX8 are different hybrids of the same female parent, and XY335′s female parent and male parent are different from the other four varieties. All seeds were uncoated, and there was no significant difference in surface properties. Figure 1 presents the five kinds of corn seeds.

2.2. Experimental Equipment

The hyperspectral imaging system was used to acquire spectral images of different varieties of maize grains. The system includes an Imaging spectrometer (ImSpector N17E, 900–1700 nm, Spectral Imaging Ltd., Oulu, Finland), 14-bits 1600 × 1200 pixel CCD camera (Bobcat ICL-1410, Boca Raton, FL, USA), bilateral 150 W halogen linear light source (IT3900, Illumination Technologies, Liverpool, NY, USA), one-dimensional displacement platform (IRCP-0076-400, Isuzu Optics Corp., Taiwan), etc. The spectral resolution of the system is 5 nm, and the image resolution is 320 × 256 pixels. The whole system is packaged in a dark box to avoid the interference of ambient light. The optical imaging system and the control parameters of the displacement stage need to be adjusted before acquisition.
Before hyperspectral image acquisition, it is necessary to adjust the object distance, exposure time, and moving speed of the system to ensure the collected maize seed image is clear and accurate in shape and that the spectrum of each pixel is as far as possible without saturation. After many tests, the setting parameters were as follows: the distance from the sample to the edge of the lens was 43 cm, the exposure time was 10 ms, and the moving speed of the platform was 5 mm·s−1.
The spectral images taken by the system need to be calibrated to reduce or eliminate the dark current of the machine and the noise interference of charge-coupled devices in the acquisition process [21,22]. The image correction formula is shown as follows:
R = I raw I dark I white I dark
where R is the corrected image, Iraw is the original image, Iwhite is the standard whiteboard image, and Idark is the dark field image.

2.3. Data Processing and Modeling Methods

2.3.1. Multivariate Scattering Correction

Multivariate scattering correction (MSC) is a common data processing method for multi-wavelength calibration modeling. It can effectively eliminate the near-infrared diffuse reflection spectrum of sample mirror reflection and uneven noise and eliminate the spectral baseline drift phenomenon and spectral non-repeatability to enhance the component content-related spectral absorption information [23,24,25].

2.3.2. Principal Component Analysis

Principal component analysis (PCA) is an effective method for data dimensionality reduction, which converts a large number of correlated variables into a few combinations of unrelated variables, that is, separating the correlation between the original variables, and uses a few variables to express information of the overall data set [26,27]. Since the amount of data increases with the number of bands and the correlation between adjacent bands is high, generating a large amount of redundant information, PCA greatly reduces the amount of data, thus shortening the computation time.

2.3.3. Partial Least Squares-Discriminant Analysis

Partial least squares-discriminant analysis (PLS-DA) is a discriminant technique based on PLS regression (PLSR). In spectral data analysis, the PLS algorithm is a widely used regression analysis algorithm. The new variable combination is obtained from spectral data through linear transformation. It is especially suitable for the case where there are many variables with multicollinearity, few sample observations, and large interference noise [28].

2.3.4. K-Nearest Neighbor Algorithm

K-nearest neighbor algorithm (KNN) is a classification method based on the closest training examples in the feature space. If the majority of an unknown sample’s K-nearest neighbors in the training set belong to a certain class, then this unknown sample is classified as this class. KNN is suitable for multi-classification problems, and the parameter K influences the performance of the KNN model [29]. In this paper, the value of K is 4 throughout.

2.3.5. Naive Bayes

NB originates from classical mathematical theory. It is a classification method based on Bayesian theory and an independent hypothesis of feature conditions. It makes classification predictions by calculating the conditional probability of each feature being classified separately [30]. The basic idea of the NB algorithm is: for the given item to be classified, calculate the probability of each category under the condition of the occurrence of this item and determine to which category the item to be classified belongs. This algorithm requires few parameters to be estimated and has fast operation speed and stable performance. However, this algorithm ignores the correlation between variables and the difference in the influence of attribute variables on decision variables, which results in the classification structure being greatly affected by the input data.

2.3.6. Random Forest

Random forest (RF) is a novel machine learning algorithm combining Breiman’s “bootstrap aggregating” idea and Ho’s “random subspace method” [31]. An RF classifier contains many decision trees, and each tree is grown from a bootstrap sample of the response variable. The best split is selected from a random subset of variables at each tree node and then grows the tree to the maximum extent without pruning. Predictions can be made from new data by aggregating the output of all trees. RF is effective and quickly deals with a large amount of data.
The number of spanning decision trees (ntree) and the number of selective splitting attributes (mtry) in random forest models directly affect the accuracy of the results. Generally, with the increase of the number of ntree, the test error will gradually decrease, but if the ntree is too large, the model will over-fit. Mtry represents the maximum number of features randomly selected by each node of the decision tree. In the traditional decision tree model, mtry reduces the diversity of a single tree. However, RF is based on the idea of ensemble learning. Reducing mtry will not only improve the algorithm speed but may also reduce the test error. This is also an improvement of the RF model based on the Bagging ensemble learning method. Generally, the cross-validation method is used to select ntree and mtry to obtain more suitable values [32].

2.3.7. Support Vector Machine

Support vector machine (SVM) is a new machine-learning method based on statistical theory and structural risk minimization criteria [33]. SVM takes the training error as the constraint condition of the optimization problem and takes the minimization of the confidence range as the optimization objective; that is, SVM is a learning method based on the structural risk minimization criterion. Since the solution of SVM is transformed into the solution of a quadratic programming problem, the solution of SVM is the globally unique optimal solution. SVM has many unique advantages in solving small sample, nonlinear, and high-dimensional pattern recognition problems and can be extended to other applications in machine learning, such as function fitting [34,35,36]. When the input space is linearly inseparable, the nonlinear mapping is completed by the kernel function of the support vector machine. Linear, polynomial, Gaussian radial basis kernel (RBF), and Sigmoid are the kernel functions used commonly [37]. The principles and characteristics are shown in Table 1.
When SVM is used to establish a classification model, optimizing two parameters (gamma and C) can improve the accuracy of the model. The smaller the gamma value, the larger the diameter of the Gaussian kernel, the smoother the boundary of SVM, and the simpler the model, which tends to be underfitting. Parameter C is the penalty coefficient. Increasing C can improve the accuracy of the model, but it is easy to cause over-fitting. The smaller the C value is, the better the fault tolerance is, but it may lead to under-fitting. This paper uses the grid search method to find the best parameters, C and gamma.

3. Results and Discussion

3.1. Background Segmentation

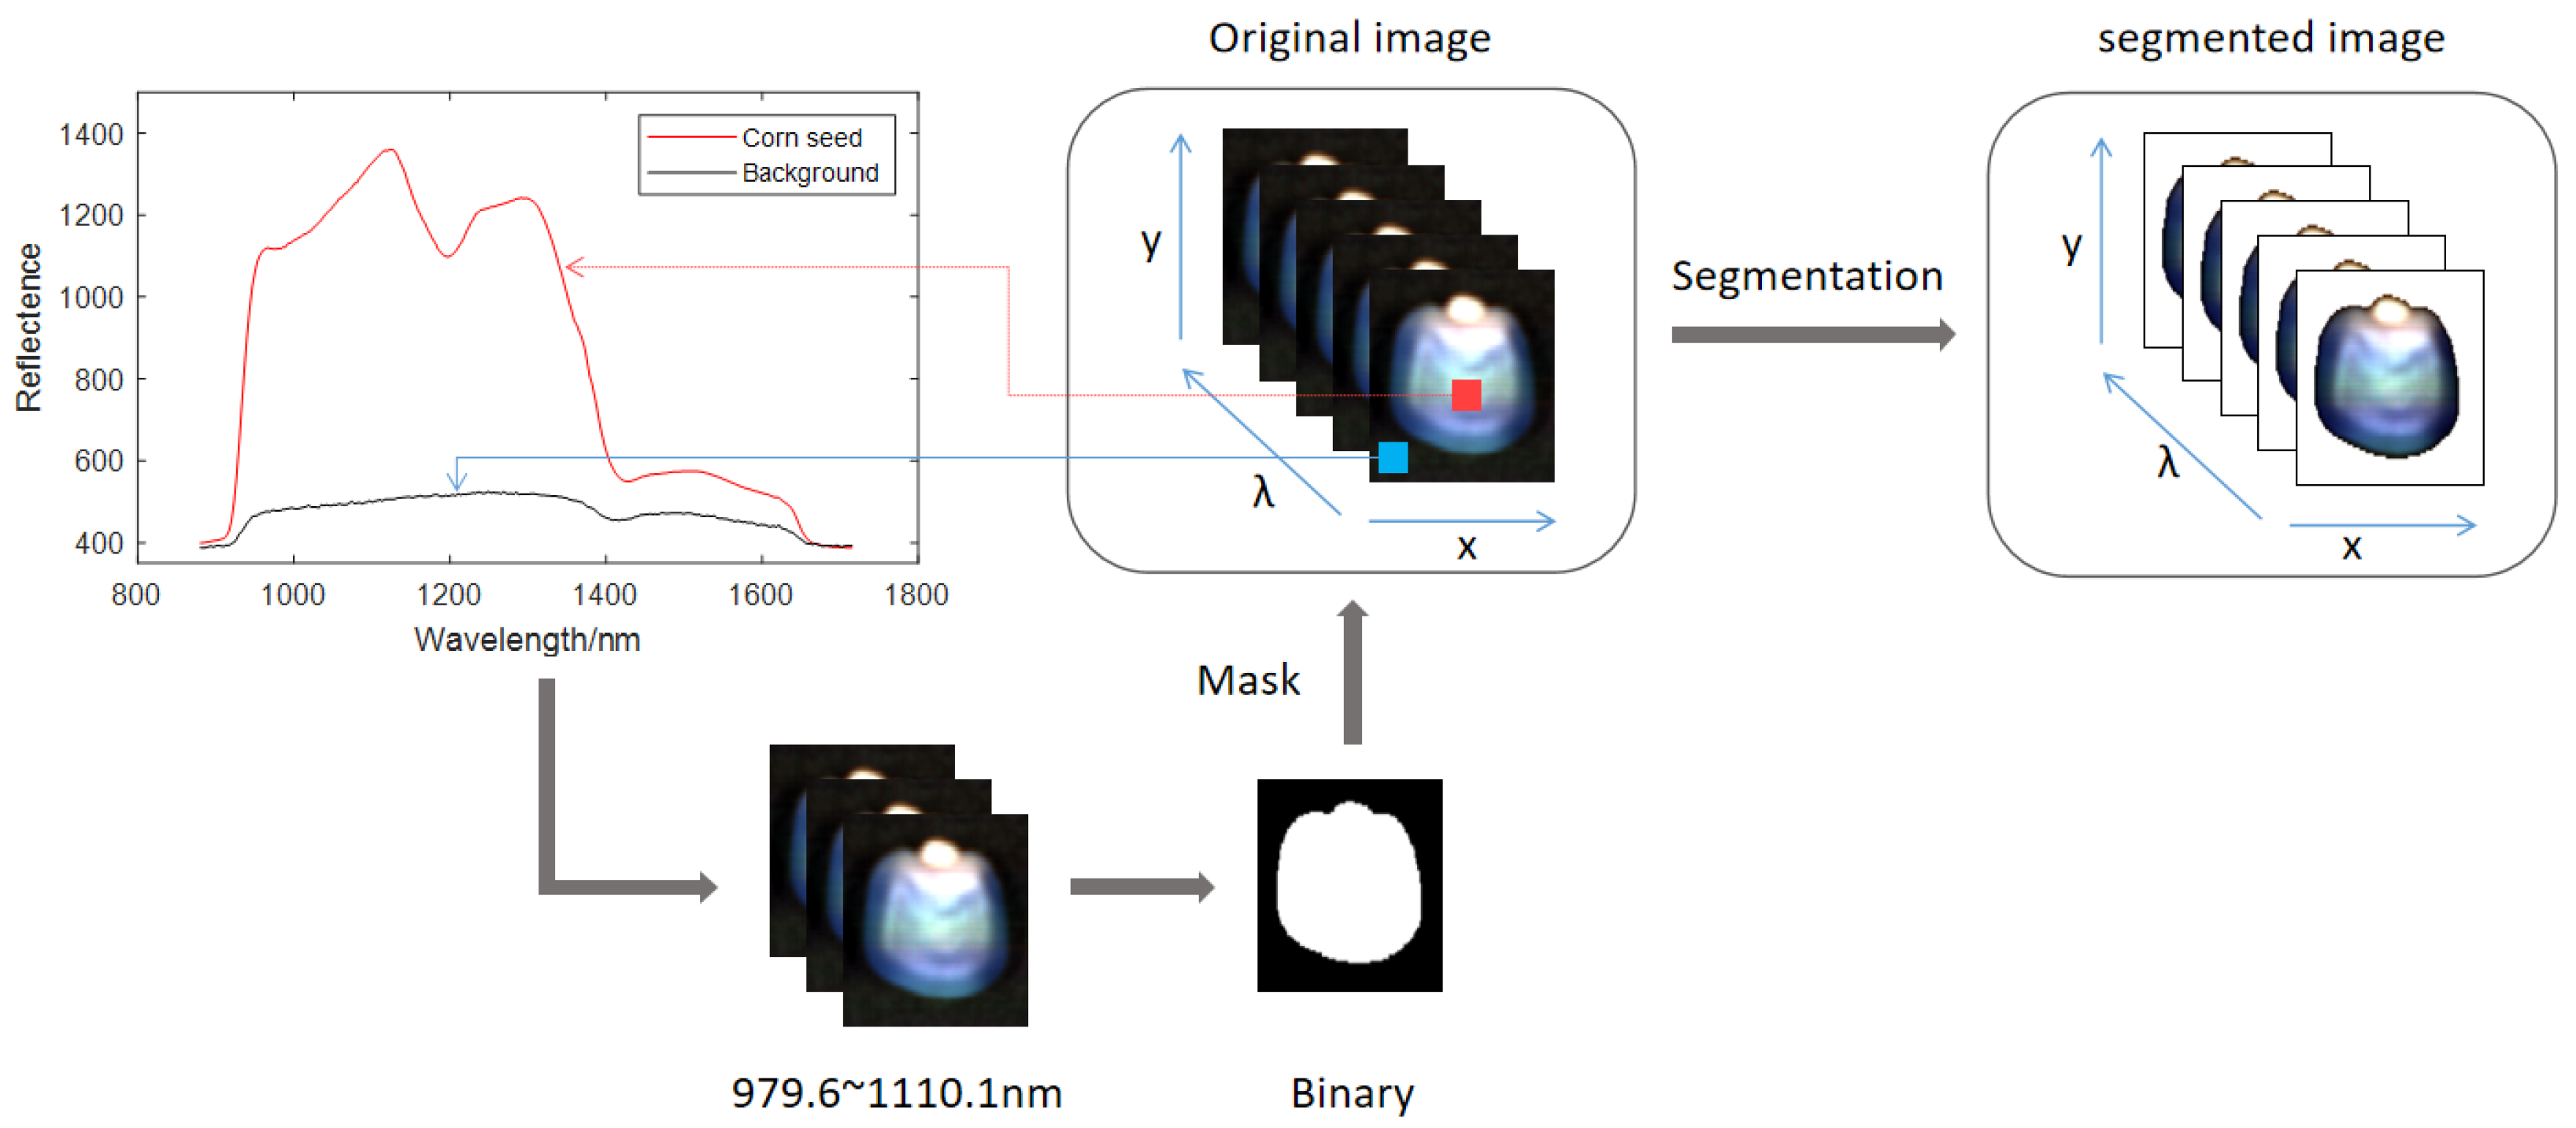
To obtain the outline information of corn seeds from the hyperspectral images, it is necessary to segment the targets from the background. Hyperspectral images have a large number of bands, and the data dimension is high. Therefore, accurate image segmentation is the premise and foundation of variety classification based on hyperspectral images. By comparing and analyzing the reflectance spectrum, there was a significant difference in the change rate between the corn seed edge spectrum and the background spectrum in the 979.6~1110.1 nm bands. Therefore, the variance map in the 979.6~1110.1 nm band was used for threshold segmentation to generate a binary image. The binary image was applied as a mask to the original hyperspectral image for image segmentation under each band [38]. The background segmentation process is shown in Figure 2.

3.2. Spectral Curve Analysis

The wavelength range of the hyperspectral data collected in the experiment is 881~1715 nm with 256 wavebands. Since the head and end of the spectral data are obviously subject to noise during acquisition, this part of the data should be removed during the study. Therefore, 228 bands from band 13 to band 240 (that is, the spectrum with a wavelength range of 920~1661 nm) are used for analysis.
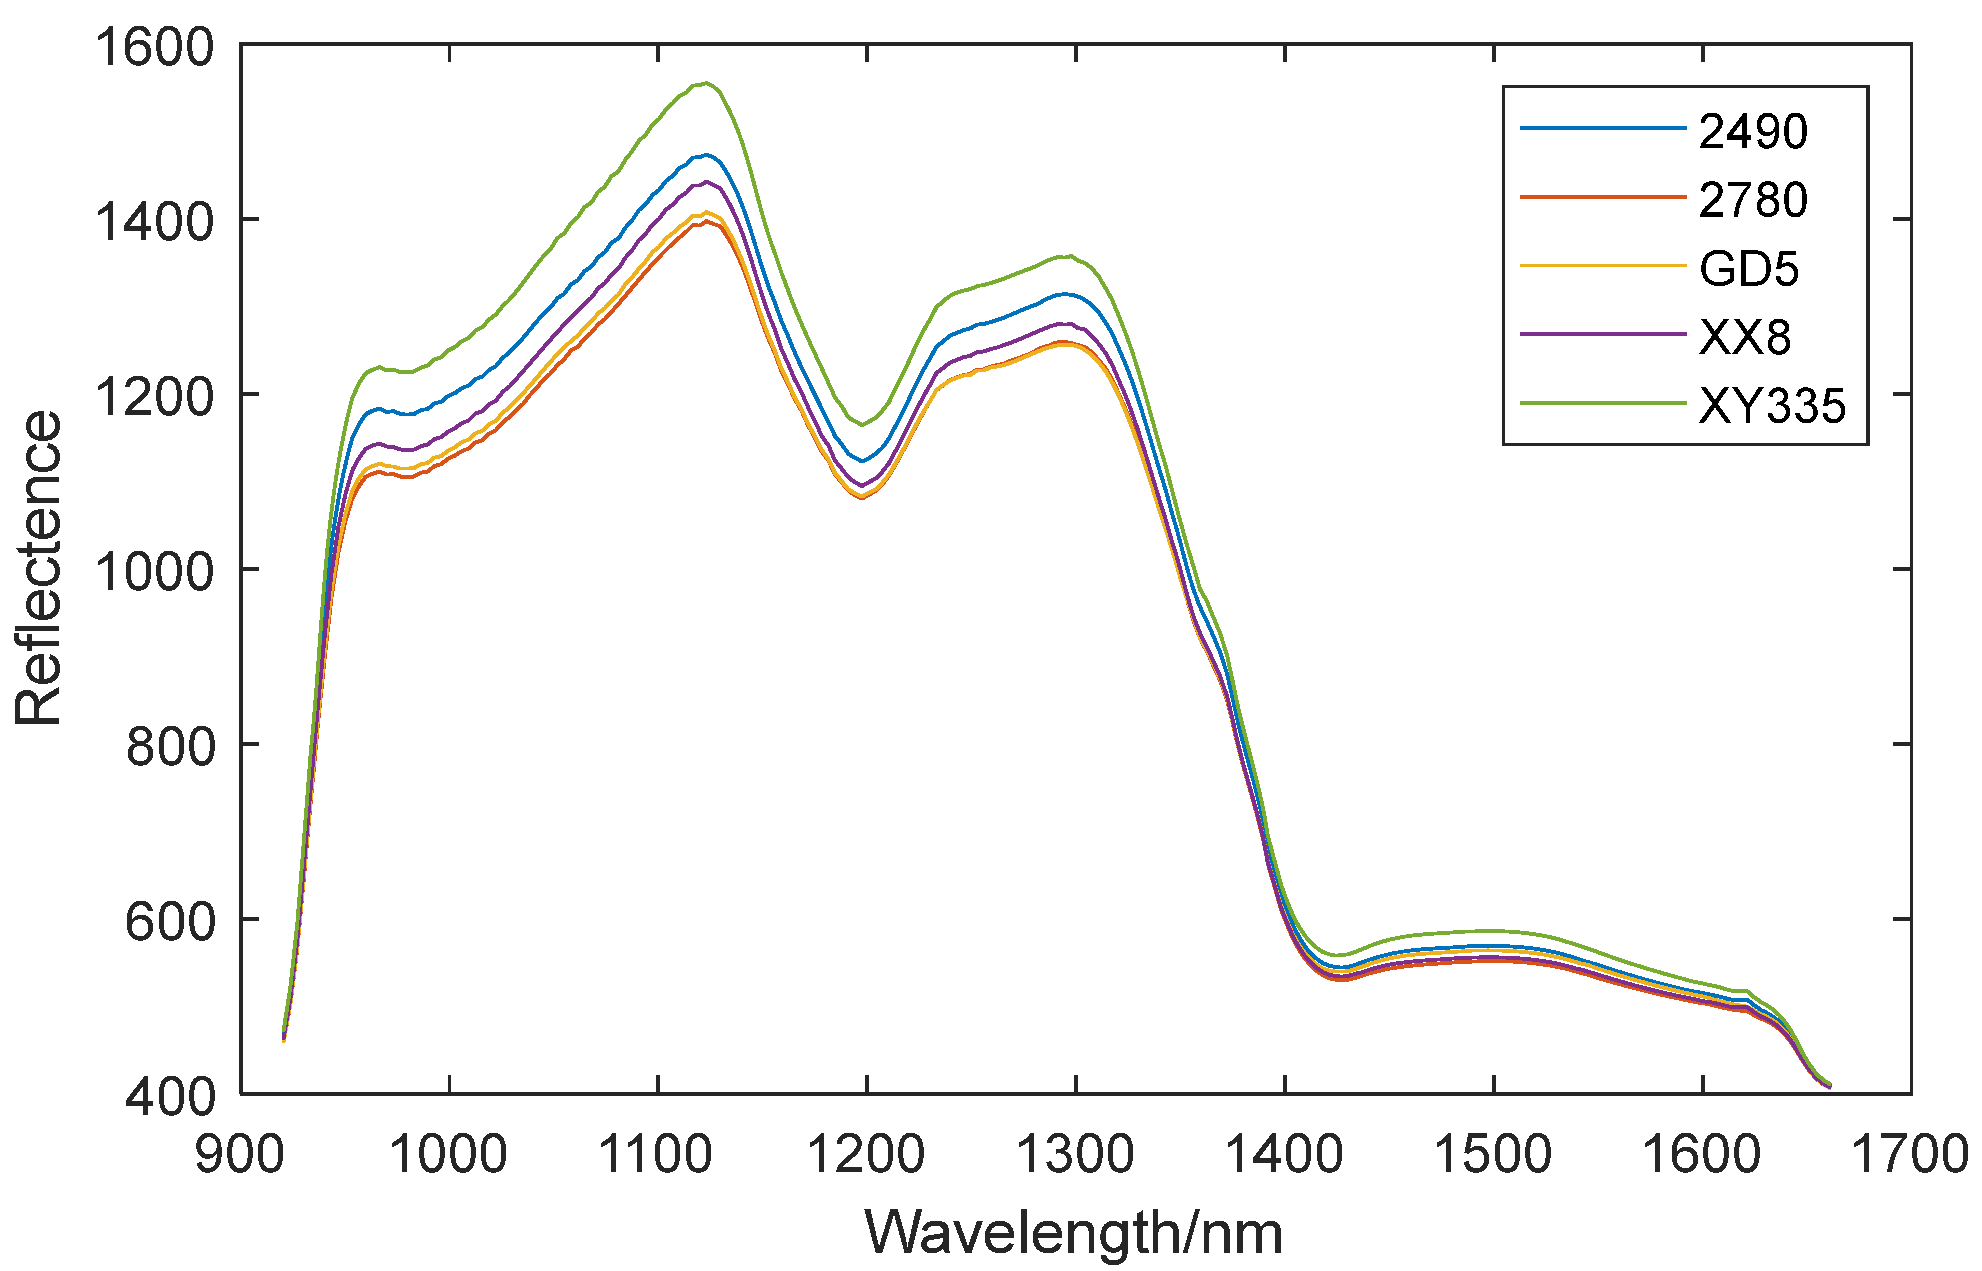
Spectral data were pretreated with MSC to eliminate or minimize the effects of acquisition environment and instrument noise as much as possible. The mean spectral curves of the five kinds of corn seeds are shown in Figure 3. As 2490, 2780, GD5, and XX8 seeds use the same female parent in the hybridization process, they are highly similar in genes and traits, and XY335 is relatively different. However, the main components of corn seeds are basically the same, so the average spectral curves of the five kinds of maize seeds are similar and cannot be distinguished from the original curves.

3.3. Characteristic Wavelength Selection

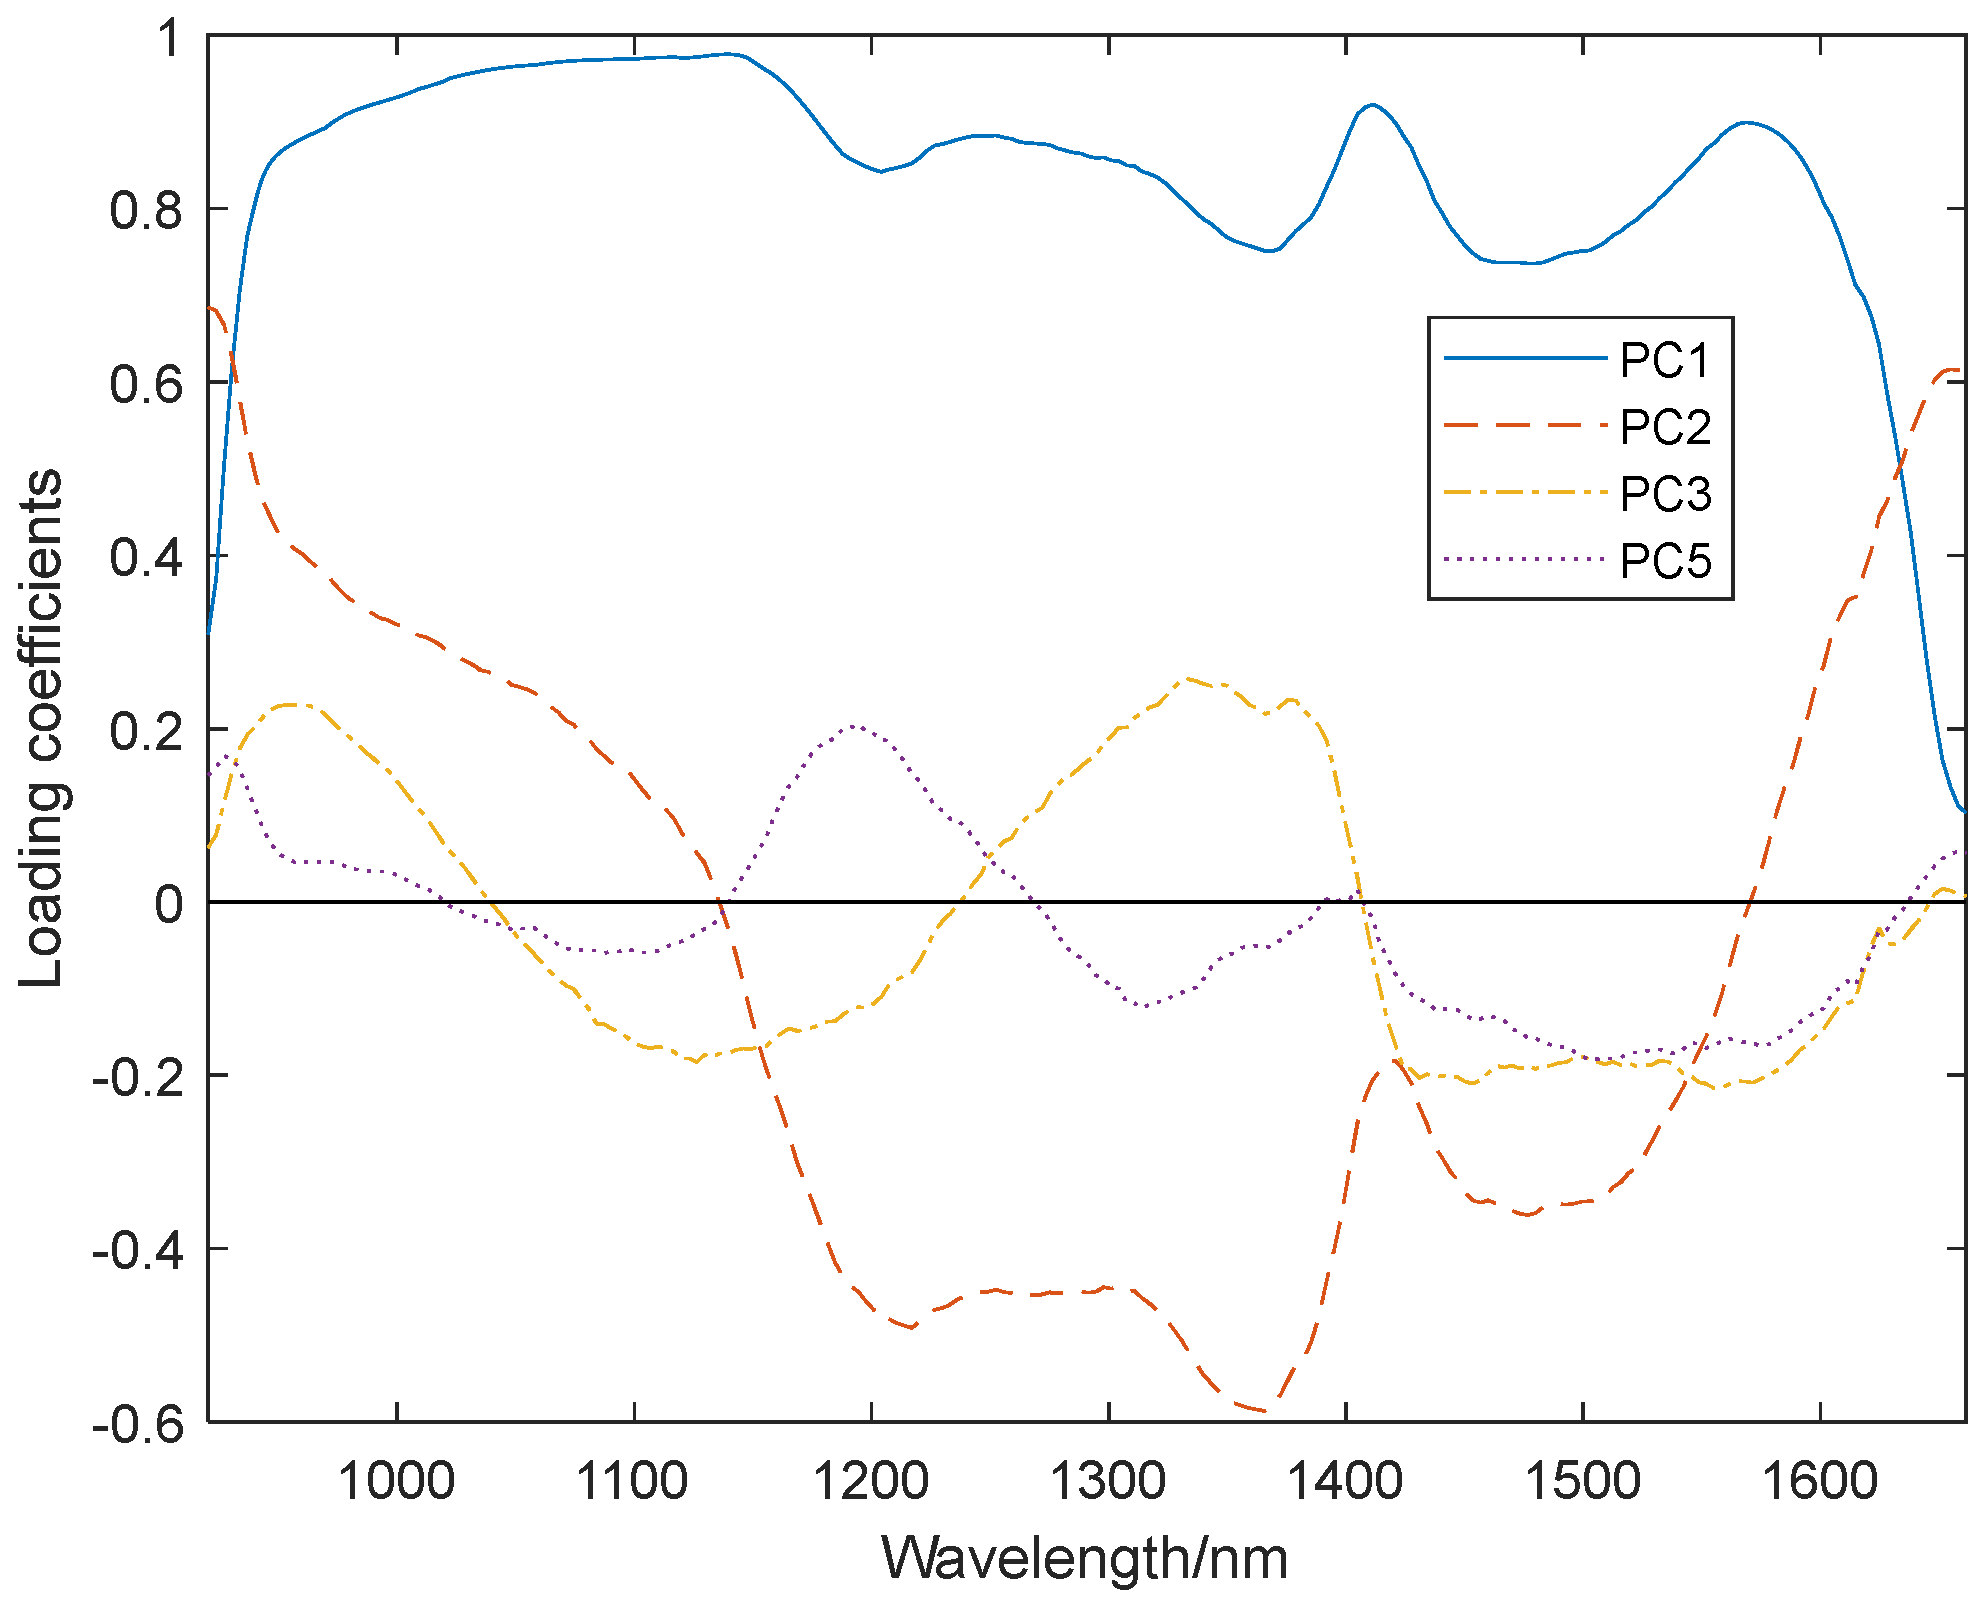
Hyperspectral images have huge spectral band resources, which leads to the increased correlation of two images in adjacent bands and produces a large amount of redundant information, which brings great difficulties for data analysis and modeling. Therefore, it will be of great use to reduce the dimensionality of the hyperspectral images through feature selection and extraction and to express information about the entire dataset with a few variables. In this paper, a characteristic wavelength selection method based on the PCA load coefficient is used. PCA transformation of corn kernels and the absolute value of the load coefficient corresponding to each wavelength indicates the contribution of the wavelength to the model, so the load coefficient corresponding to each principal component can be taken as a condition for selecting the characteristic wavelength [39].
Taking XY335 as an example, the five main principal components with a cumulative contribution rate of 99.9% are selected, as shown in Figure 4. It shows more grayscale, texture, embryo size, stalk, and folds in PC1, more embryo characteristics in PC2, more granular characteristics in PC3, and more surface texture in PC5. In the first five principal components, PC4 contains a lot of noise information, and the features are not obvious, which can be eliminated when applied. Therefore, the PC1, PC2, PC3, and PC5 components are used to replace the original image, and the load coefficient of each principal component is shown in Figure 5.
As shown in Figure 5, according to the PCA transformation results, the wavelength corresponding to the maximum absolute load coefficient of each principal component was selected as the characteristic wavelength, 920.35 nm, 1139.27 nm, 1194.31 nm, 1333.39 nm, respectively. To improve the accuracy of model discrimination, several higher correlation wavelengths were added as the characteristic wavelength, respectively 1365.79 nm, 1568.32 nm, and 1651.29 nm.

3.4. Machine Learning Modeling

Assigning the type of seeds, and randomly dividing the samples into modeling and prediction sets. The ratio of the modeling set to the prediction set is 2:1. The modeling set contained 100 samples, and the prediction set contained 50 samples. The assignments and the sample division of different kinds of maize seeds are shown in Table 2.

3.4.1. Discriminant Models Based on the Full-Band Spectra

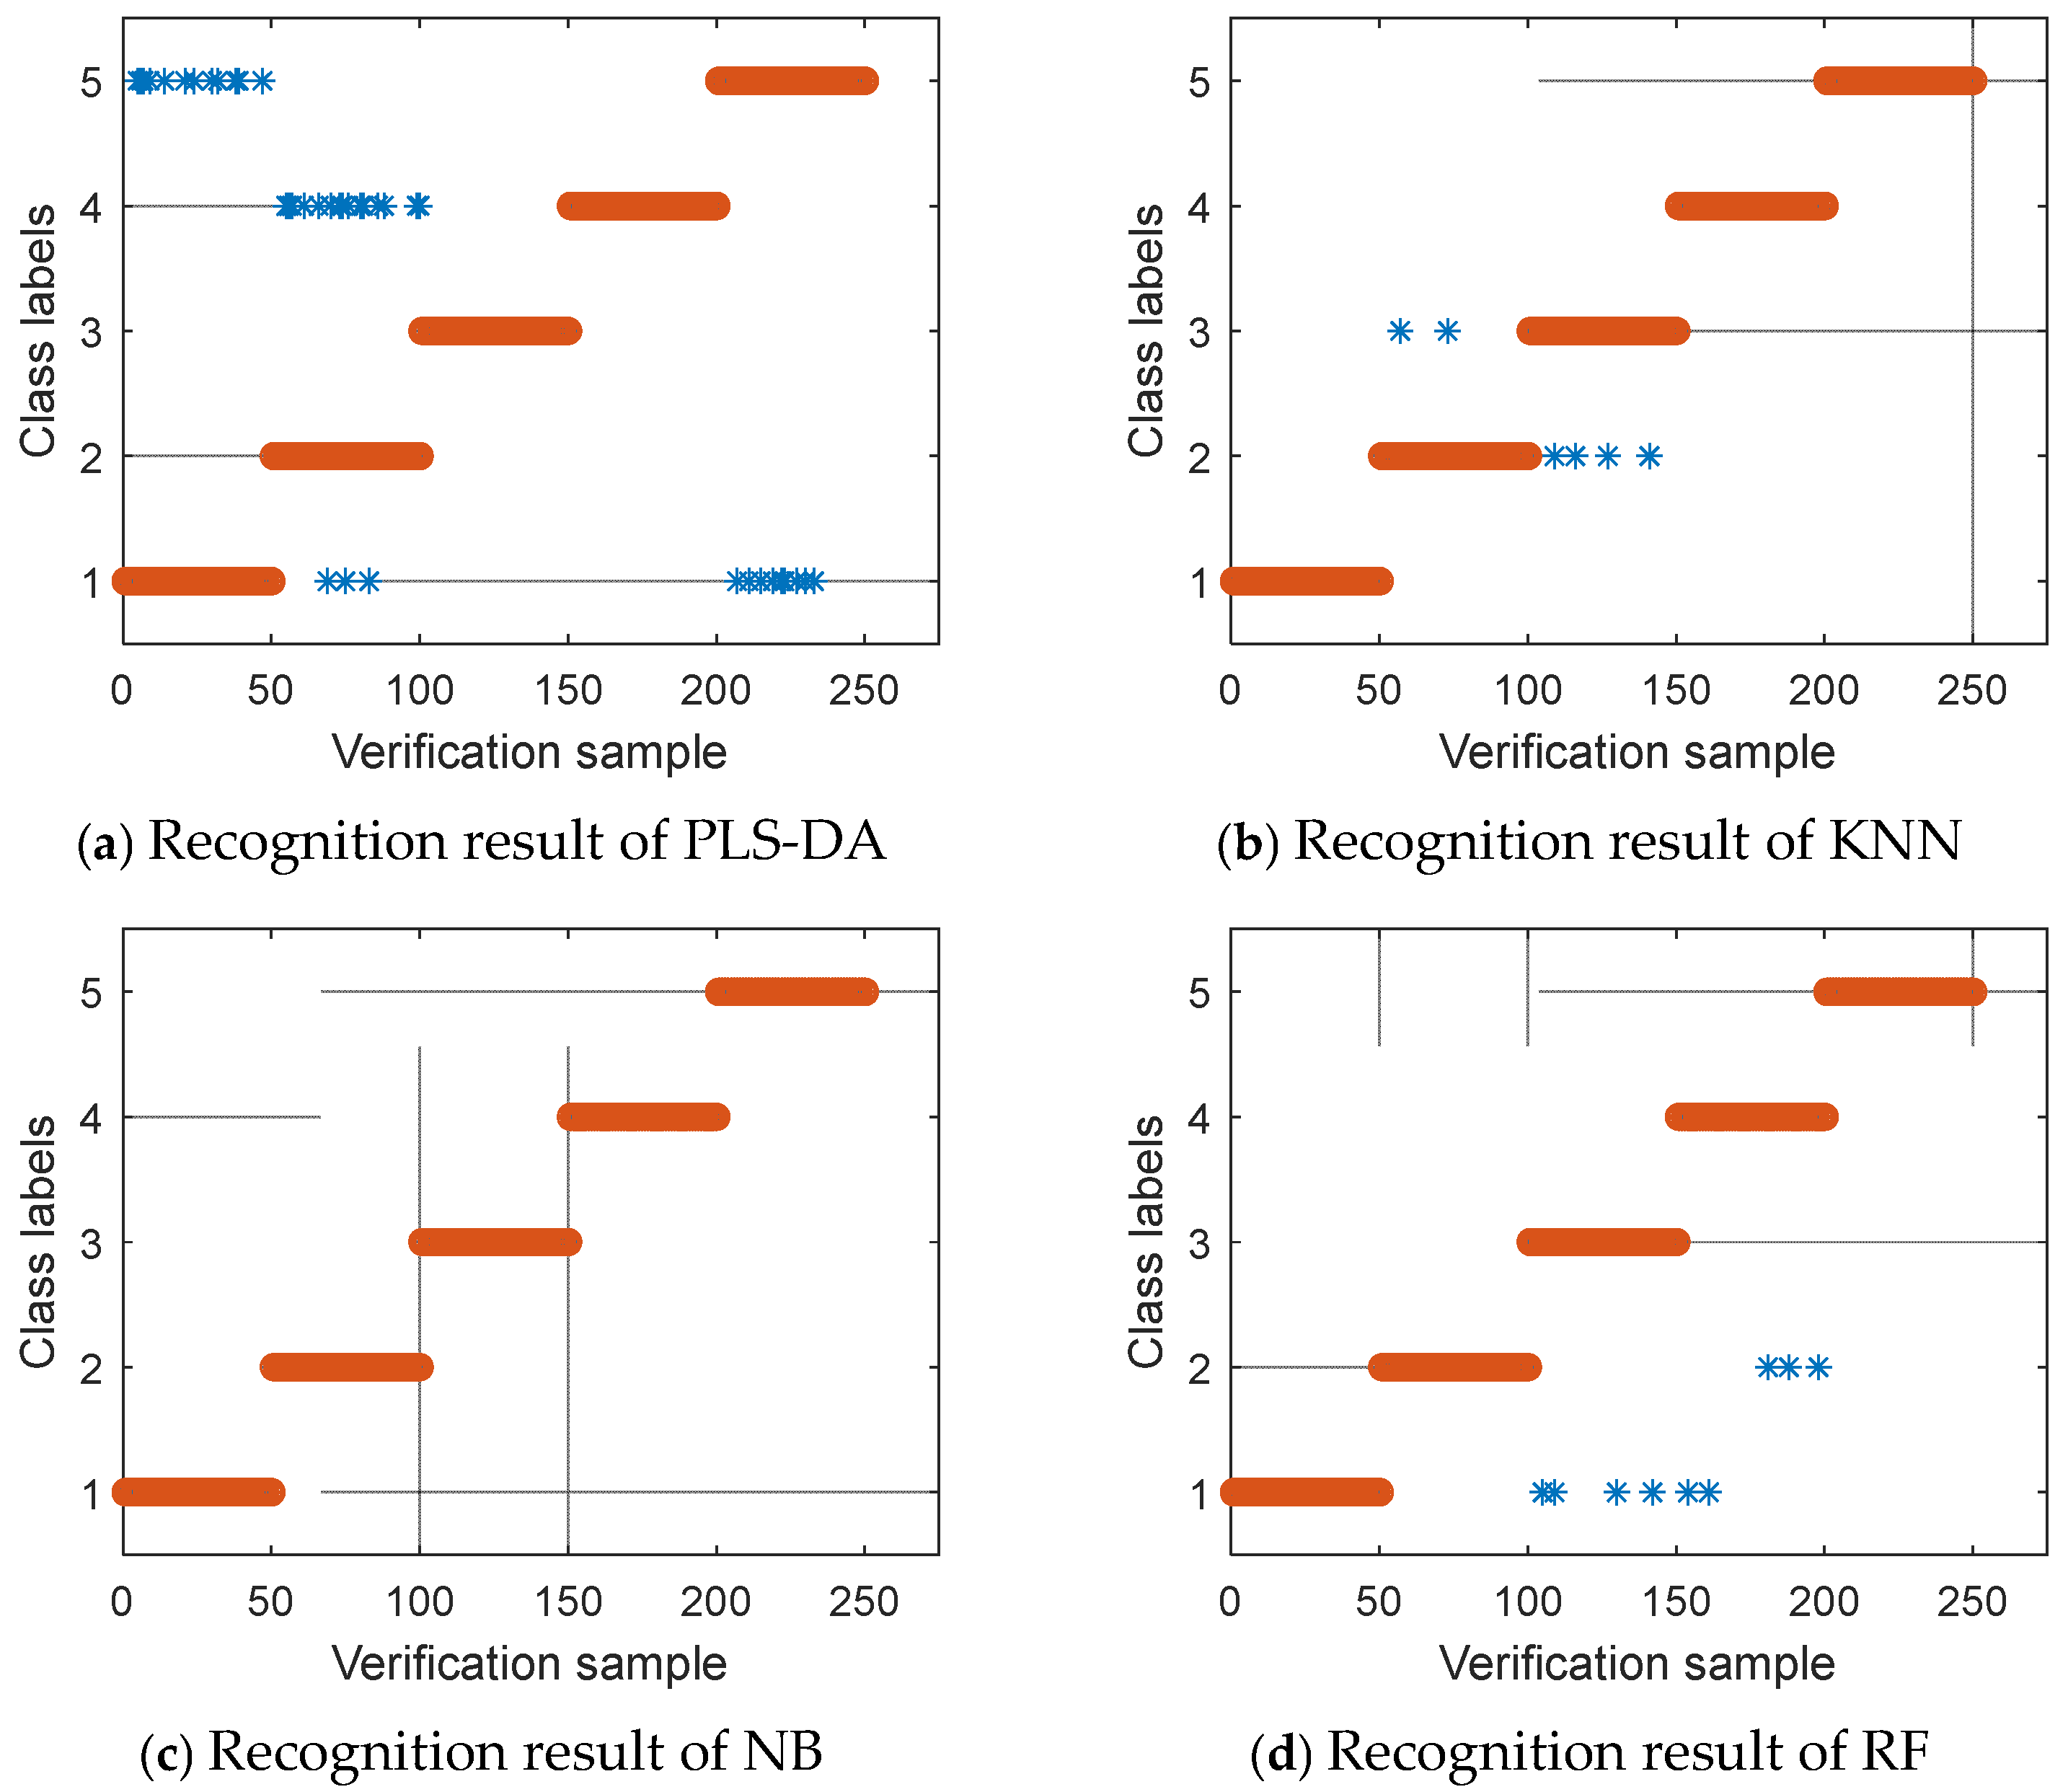
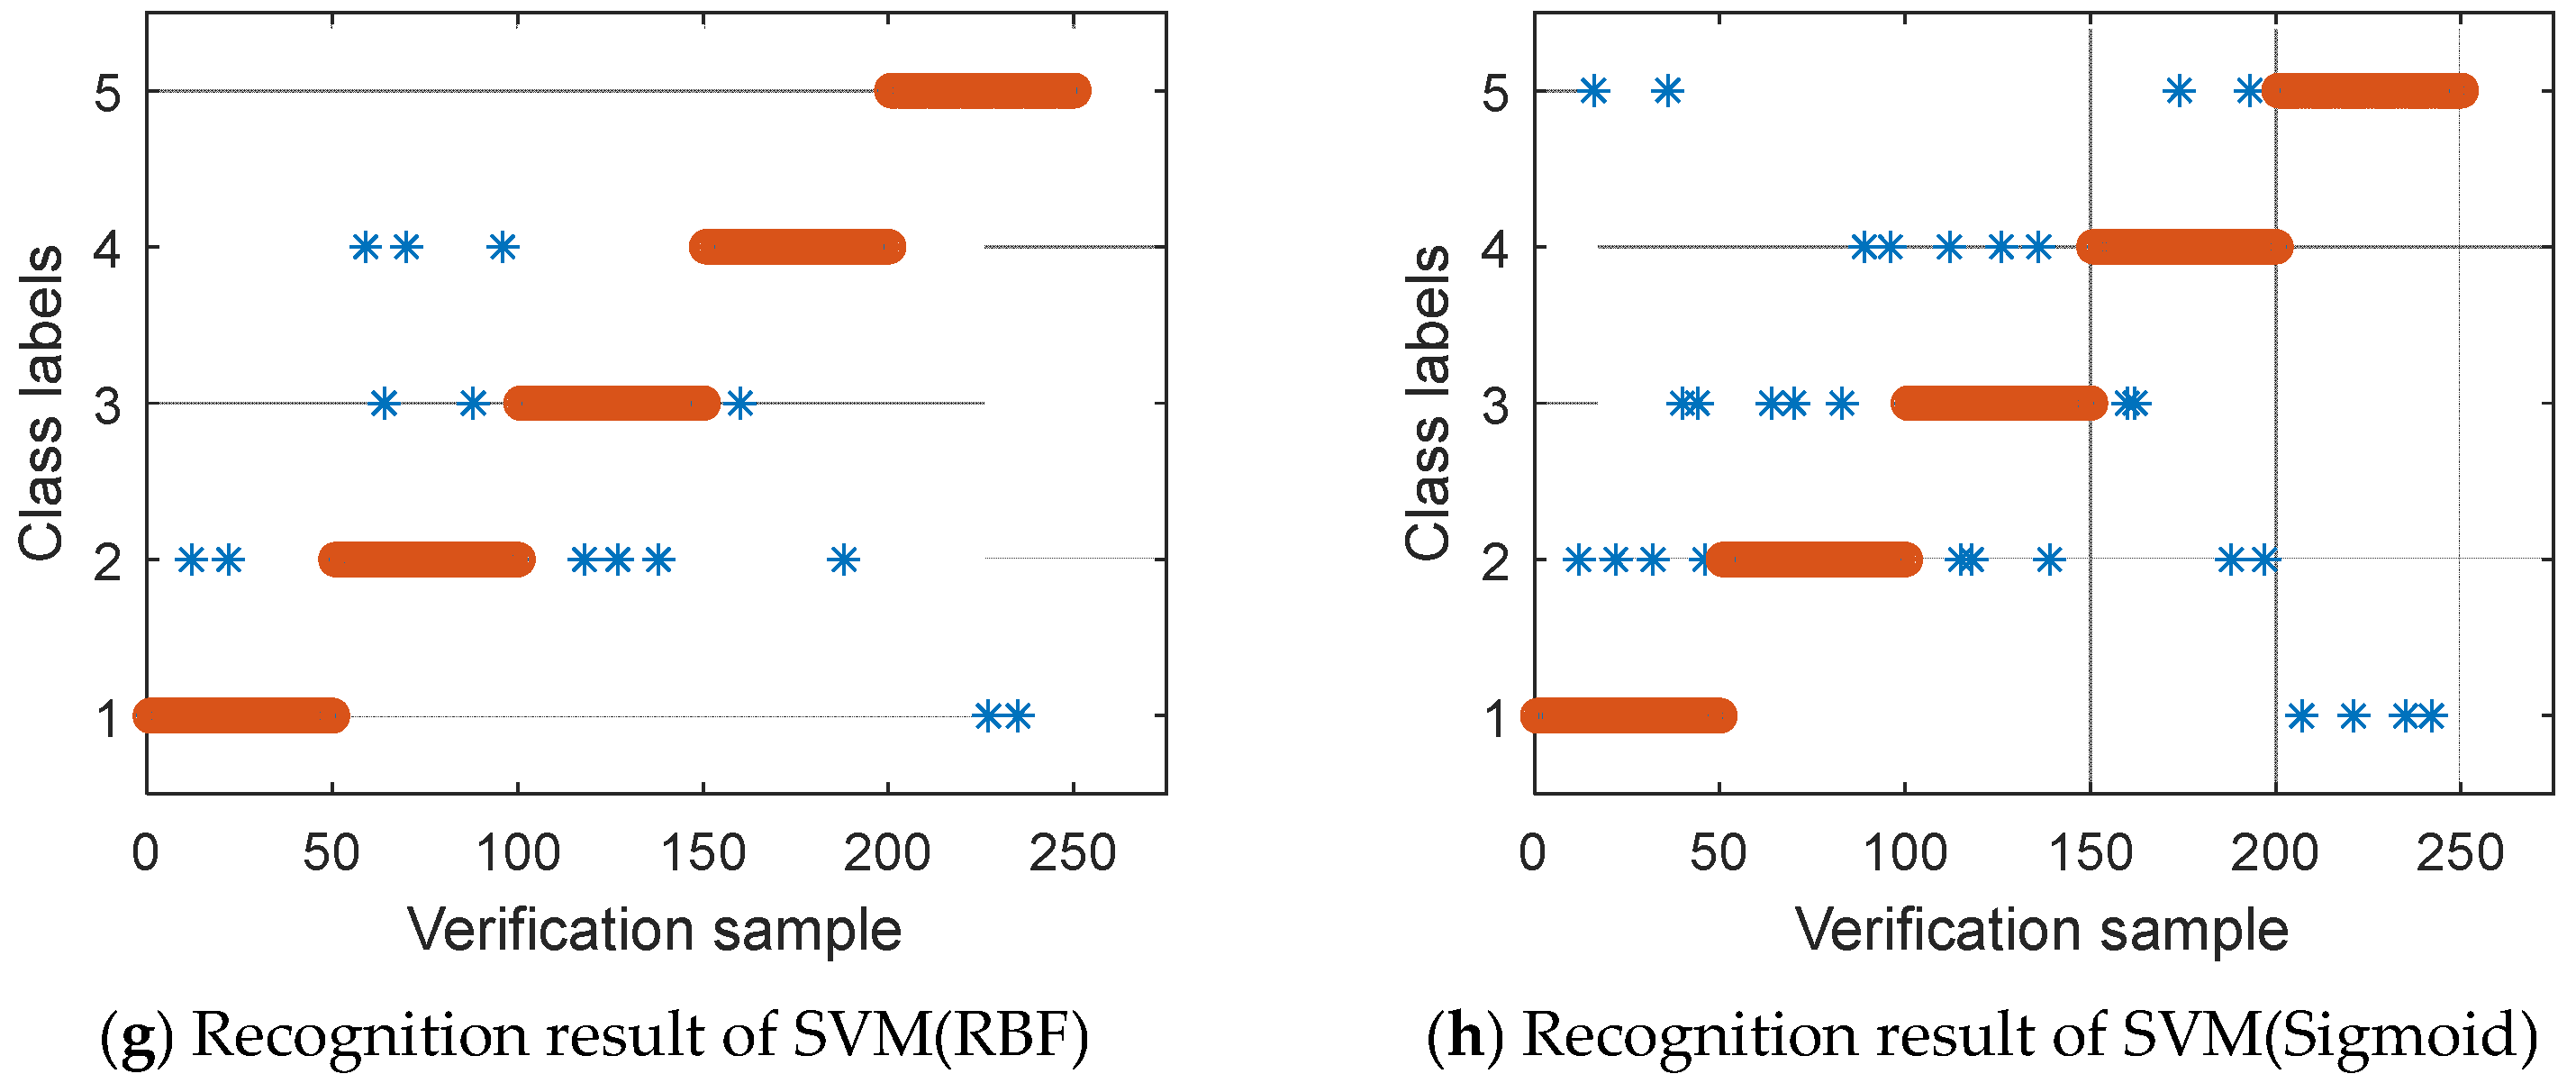
After image segmentation and spectral preprocessing, taking the full-band spectrum as the input, PLS-DA, KNN, BN, RF, and SVM classification models are established, respectively. The discriminant analysis results are shown in Figure 6 and Table 3. The red mark indicates the actual category of corn kernels, and the blue mark indicates the predicted category of corn kernels. The abscissa represents the sample number, and the ordinate represents the type label.
As can be seen from Figure 6 and Table 3, the classification models of maize seeds based on full-spectrum have achieved good results. However, there are certain differences in the results of different recognition algorithms. The accuracy of KNN, RF, SVM-Linear, and SVM-RBF all reach more than 96%. However, due to the small data set, when the proportion of KNN’s modeling set and test set changes, the classification results differ greatly, and the model stability is poor. SVM based on linear kernel has a high calculation speed, but the recognition process is greatly affected by the reflected light intensity. After preprocessing, better recognition results can be obtained. The accuracy of PLS-DA and SVM-Sigmaid is relatively low. The recognition accuracy of individual varieties is even lower than 60%, mainly because the training accuracy is affected by the size of data sets, so when the number of modeling sets is small, the recognition effect is bad. The classification accuracy of NB and SVM based on the polynomial kernel function has reached 100%, and they can correctly identify different maize seeds.

3.4.2. Discriminant Models Based on the Characteristic Band Spectra

The classification models built with full-band data as input achieves good results, but a large amount of data will increase the complexity of the model and reduce the computational speed. Meanwhile, in the full-spectrum data information, the presence of a large number of redundancy and collinearity data will affect the effect of the model. In this paper, we use PCA transformation and combine the load coefficient of the principal components to obtain seven characteristic wavelengths and establish models with different algorithms. The discriminant analysis results are shown in Figure 7 and Table 4.
According to Table 4, the prediction result based on characteristic wavelength is lower than the model based on full spectrum. However, the accuracy of SVM based on the polynomial kernel function still reaches 100%. Compared with Figure 6 and Figure 7, the accuracy of KNN has changed greatly, from 97.6% to 86.8%, and the recognition error of variety 2780 is very large, which further proves the instability of KNN in the experiment.

3.5. Model Accuracy Evaluation

The identification accuracy of the classification model is often evaluated by factors such as the overall classification accuracy, Kappa coefficient, misclassification error, and omission error [40]. The results are shown in Table 5, Table 6 and Table 7.
The data in Table 5 shows that the SVM model based on polynomial kernel functions has the highest overall accuracy, which reaches 98.4%. The data in Table 6 and Table 7 show that X Y335 maize has the smallest wrong classification error and the least easy to be misclassified in different models. The reason is that the parents of XY335 are different from other varieties and have quite different genes, which can be well identified in the discriminant analysis. The polynomial kernel function establishes minimal model misclassification errors and powder leakage errors. It can be further seen that the SVM model establishment of the polynomial kernel function has a high accuracy for the maize variety classification, which can realize the purity identification of maize kernels.

4. Conclusions

The purity of hybrid maize seeds was detected quickly and non-destructive based on near-infrared spectral imaging technology and a machine learning algorithm. Established models based on PLS-DA, KNN, NB, RF, SVM-Linear, SVM-Polynomial, SVM-RBF, and SVM-Sigmoid for classification and identification. The accuracies of the models were improved by multivariate scattering correction of the spectrum. Principal component analysis was used to select characteristic wavelengths to reduce the calculation time of the model. The confusion matrix and its evaluation factors were used to evaluate the classification effect of different models. The experiments showed that the support vector machine based on the polynomial kernel function has the highest classification accuracy. It can be seen from the analysis results that the discrimination accuracy of completely different maize seeds is very high. Even the seeds with the same maternal parent can be well distinguished. This study provides a theoretical basis and method for rapid and non-destructive testing of the purity of maize seeds and a methodological basis for further research on the quality detection of maize seeds.

Author Contributions

Conceptualization, X.X.; Data curation, Y.Y.; Formal analysis, H.X.; Funding acquisition, N.Z.; Investigation, Y.Y.; Methodology, H.X.; Project administration, Y.L.; Resources, H.X.; Software, H.X.; Supervision, N.Z.; Validation, Y.Y.; Writing—original draft, H.X.; Writing—review & editing, X.X. All authors have read and agreed to the published version of the manuscript.

Funding

This research was funded by the Jilin Provincial Key Research and Development Project (Grant No. 20210201029GX) and the General Free Exploration Project of the Jilin Provincial Department of Science and Technology (Grant No. YDZJ202201ZYTS419).

Institutional Review Board Statement

Not applicable.

Informed Consent Statement

Not applicable.

Data Availability Statement

All relevant data presented in the article are stored according to institutional requirements and, as such, are not available online. However, all data used in this manuscript can be made available upon request to the authors.

Conflicts of Interest

The authors declare no conflict of interest.

References

  1. Tenaillon, M.I.; Charcosset, A. A European Perspective on Maize History. C. R. Biol. 2011, 334, 221–228. [Google Scholar] [CrossRef]
  2. Liu, L.; Wang, Y. Brief Analysis of Maize Seed Purity Electrophoresis Identification. Seed World 2000, 1, 21. [Google Scholar]
  3. Chen, L.T.; Sun, A.Q.; Yang, M.; Chen, L.L.; Li, X.; Li, M.L.; Yin, Y.P. Seed Vigor Evaluation Based on Adversity Resistance Index of Wheat Seed Germination Under Stress Conditions. Chin. J. Appl. Ecol. 2016, 27, 2968–2974. [Google Scholar]
  4. Radanović, A.; Sprycha, Y.; Jocković, M.; Sundt, M.; Miladinović, D.; Jansen, C.; Horn, R. KASP Markers Specific for the Fertility Restorer Locus Rf1 and Application for Genetic Purity Testing in Sunflowers (Helianthus annuus L.). Genes 2022, 13, 465. [Google Scholar] [CrossRef] [PubMed]
  5. Yang, L.; Lü, Q.; Zhang, H. Experimental Study on Direct Harvesting of Corn Kernels. Agriculture 2022, 12, 919. [Google Scholar] [CrossRef]
  6. Izabel, C.S.N.; Edila, V.D.R.V.P.; Viviane, M.D.A.; Heloisa, O.D.S.; Danielle, R.V.; Renzo, G.V.P.; Maria, L.M.D.C. Enzyme Activities and Gene expression in Dry Maize Seeds and Seeds Submitted to Low Germination Temperature. Afr. J. Agric. Res. 2016, 11, 3097–3103. [Google Scholar] [CrossRef] [Green Version]
  7. Zhang, T.; Sun, Q.; Yang, L.; Yang, L.; Wang, J. Vigor Detection of Sweet Corn Seeds by Optimal Sensor Array Based on Electronic Nose. Trans. Chin. Soc. Agric. Eng. 2017, 33, 275–281. [Google Scholar]
  8. Fatonah, K.; Suliansyah, I.; Rozen, N. Electrical Conductivity for Seed Vigor Test in Sorghum (Sorghum bicolor). Cell Biol. Dev. 2017, 1, 6–12. [Google Scholar] [CrossRef] [Green Version]
  9. Siesler, H.W.; Ozaki, Y.; Kawata, S.; Heise, H.M. Near-Infrared Spectroscopy: Principles, Instruments, Applications; John Wiley & Sons, Incorporated: Hoboken, Germany, 2002. [Google Scholar]
  10. Huang, M.; Wang, Q.; Zhu, Q.; Qin, J.; Huang, G. Review of Seed Quality and Safety Tests Using Optical Sensing Technologies. Seed Sci. Technol. 2015, 43, 337–366. [Google Scholar] [CrossRef]
  11. Norris, K.H. History of NIR. J. Near Infrared Spectrosc. 1996, 4, 31–37. [Google Scholar] [CrossRef]
  12. Lohumi, S.; Mo, C.; Kang, J.S.; Hong, S.J.; Cho, B.K. Nondestructive Evaluation for the Viability of Watermelon (Citrullus lanatus) Seeds Using Fourier Transform Near Infrared Spectroscopy. J. Biosyst. Eng. 2013, 38, 312–317. [Google Scholar] [CrossRef] [Green Version]
  13. Ambrose, A.; Lohumi, S.; Lee, W.; Cho, B.K. Comparative Nondestructive Measurement of Corn Seed Viability Using Fourier Transform Near-infrared (FT-NIR) and Raman Spectroscopy. Sens. Actuators B Chem. 2016, 224, 500–506. [Google Scholar] [CrossRef]
  14. Kong, W.; Zhang, C.; Liu, F.; Nie, P.; He, Y. Rice Seed Cultivar Identification Using Near-Infrared Hyperspectral Imaging and Multivariate Data Analysis. Sensors 2013, 13, 8916–8927. [Google Scholar] [CrossRef] [Green Version]
  15. Tang, J.L.; Miao, R.H.; Zhang, Z.Y.; Xin, J.; Wang, D. Distance-based Separability Criterion of ROI in Classification of Farmland Hyper-spectral Images. Int. J. Agric. Biol. Eng. 2017, 10, 177–185. [Google Scholar]
  16. Wang, S.N.; Tan, Y.; Liu, C.Y.; Song, S.Z.; Li, Z. Classification and identification of soybean varieties by density functional theory combined with Raman spectroscopy. J. Sens. Technol. Appl. 2022, 10, 177–186. [Google Scholar]
  17. Jia, S.Q.; Liu, Z.; Li, S.M.; Li, L.; Ma, Q.; Zhang, X.D.; Zhu, D.H.; Yan, Y.L.; An, D. Study on Method of Maize Hybrid Purity Identification Based on Hyperspectral Image Technology. Spectrosc. Spectr. Anal. 2013, 33, 2847–2852. [Google Scholar]
  18. Rui, Y.K.; Luo, Y.B.; Huang, K.L.; Wang, W.M.; Zhang, L.D. Application of Near-Infrared Diffuse Reflectance Spectroscopy to the Detection and Identification of Transgenic Corn. Spectrosc. Spectr. Anal. 2005, 10, 49. [Google Scholar]
  19. Wang, L.G.; Wang, L.F. Variety iIdentification Model for Maize Seeds Using Hyperspectral Pixel-level Information Combined with Convolutional Neural Network. Natl. Remote Sens. Bull. 2021, 25, 2234–2244. [Google Scholar]
  20. Qiu, G.; Lü, E.; Wang, N.; Lu, H.; Wang, F.; Zeng, F. Cultivar Classification of Single Sweet Corn Seed Using Fourier Transform Near-Infrared Spectroscopy Combined with Discriminant Analysis. Appl. Sci. 2019, 9, 1530. [Google Scholar] [CrossRef] [Green Version]
  21. Baranowski, P.; Mazurek, W.; Pastuszka-Woźniak, J. Supervised Classification of Bruised Apples with Respect to the Time After bBruising on the Basis of Hyperspectral Imaging Data. Postharvest Biol. Technol. 2013, 86, 249–258. [Google Scholar] [CrossRef]
  22. Menesatti, P.; Zanella, A.; Andrea, S. Supervised Multivariate Analysis of Hyper-spectral NIR Images to Evaluate the Starch Index of Apples. Food Bioprocess Technol. 2009, 2, 308–314. [Google Scholar] [CrossRef]
  23. Zhang, L.; Wu, J.Z.; Li, J.B.; Liu, C.L.; Sun, X.R.; Yu, L. Rapid and Non-destructive Determination of Moisture Content of Single Maize Seed by Near Infrared Spectroscopy Based on Random Forest. J. Chin. Cereals Oils Assoc. 2021, 36, 114–119. [Google Scholar]
  24. Benković, M.; Jurina, T.; Longin, L.; Grbeš, F.; Valinger, D.; Jurinjak Tušek, A.; Gajdoš Kljusurić, J. Qualitative and Quantitative Detection of Acacia Honey Adulteration with Glucose Syrup Using Near-Infrared Spectroscopy. Separations 2022, 9, 312. [Google Scholar] [CrossRef]
  25. Isaksson, T.; Naes, T. The Effect of Multiplicative Scatter Correction (MSC) and Linearity Improvement in NIR Spectroscopy. Appl. Spectrosc. 1988, 42, 1273–1284. [Google Scholar] [CrossRef]
  26. Wang, B.; Zhang, J. Principal Component Regression Analysis for lncRNA-Disease Association Prediction Based on Pathological Stage Data. IEEE Access 2021, 9, 20629–20640. [Google Scholar] [CrossRef]
  27. Sao, R.; Sahu, P.K.; Patel, R.S.; Das, B.K.; Jankuloski, L.; Sharma, D. Genetic Improvement in Plant Architecture, Maturity Duration and Agronomic Traits of Three Traditional Rice Landraces through Gamma Ray-Based Induced Mutagenesis. Plants 2022, 11, 3448. [Google Scholar] [CrossRef]
  28. León-Ecay, S.; López-Maestresalas, A.; Murillo-Arbizu, M.T.; Beriain, M.J.; Mendizabal, J.A.; Arazuri, S.; Jarén, C.; Bass, P.D.; Colle, M.J.; García, D.; et al. Classification of Beef Longissimus Thoracis Muscle Tenderness Using Hyperspectral Imaging and Chemometrics. Foods 2022, 11, 3105. [Google Scholar] [CrossRef] [PubMed]
  29. Pavlos, T.; Farahmand, B.; Maria, L.A.; Giancarlo, C. Early Detection of Eggplant Fruit Stored at Chilling Temperature Using Different Non-destructive Optical Techniques and Supervised Classification Algorithms. Postharvest Biol. Technol. 2020, 159, 111001. [Google Scholar]
  30. Ubaidillah, A.; Rochman, E.M.S.; Fatah, D.A.; Rachmad, A. Classification of Corn Diseases using Random Forest, Neural Network, and Naive Bayes Methods. J. Phys. Conf. Ser. 2022, 2406, 1742–6596. [Google Scholar] [CrossRef]
  31. Li, X.H. Using “Random Rorest” for Classification and Regression. Chin. J. Appl. Entomol. 2013, 50, 1190–1197. [Google Scholar]
  32. Zhao, D.; Zhang, X.B.; Zhao, H.W. Stochastic Forest Prediction Method Based on Gruit Fly Optimization. J. Jilin Univ. 2017, 47, 609–614. [Google Scholar]
  33. Zhao, Q.; Zhang, Z.; Huang, Y.; Fang, J. TPE-RBF-SVM Model for Soybean Categories Recognition in Selected Hyperspectral Bands Based on Extreme Gradient Boosting Feature Importance Values. Agriculture 2022, 12, 1452. [Google Scholar] [CrossRef]
  34. Jahed Armaghani, D.; Asteris, P.G.; Askarian, B.; Hasanipanah, M.; Tarinejad, R.; Huynh, V.V. Examining Hybrid and Single SVM Models with Different Kernels to Predict Rock Brittleness. Sustainability 2020, 12, 2229. [Google Scholar] [CrossRef] [Green Version]
  35. Ahmad, A.S.; Hassan, M.Y.; Abdullah, M.P.; Rahman, H.A.; Hussin, F.; Abdullah, H.; Saidur, R. A Review on Applications of ANN and SVM for Building Electrical Energy Consumption Forecasting. Renew. Sustain. Energy Rev. 2014, 33, 102–109. [Google Scholar] [CrossRef]
  36. Kour, V.P.; Arora, S. Particle Swarm Optimization Based Support Vector Machine (P-SVM) for the Segmentation and Classification of Plants. IEEE Access 2019, 7, 29374–29385. [Google Scholar] [CrossRef]
  37. Pal, M.; Foody, G.M. Feature Selection for Classification of Hyperspectral Data by SVM. IEEE Trans. Geosci. Remote Sens. 2010, 48, 2297–2307. [Google Scholar] [CrossRef] [Green Version]
  38. Yang, X.L.; Hong, H.M.; You, Z.H.; Cheng, F. Spectral and Image Integrated Analysis of Hyperspectral Data for Waxy Corn Seed Variety Classification. Sensors 2015, 15, 15578–15594. [Google Scholar] [CrossRef] [Green Version]
  39. Cheng, S.X.; Kong, W.W.; Zhang, C.; Liu, F.; He, Y. Variety Recognition of Chinese Cabbage Seeds by Hyperspectral Imaging Combined with Machine Learning. Spectrosc. Spectr. Anal. 2014, 34, 2519–2522. [Google Scholar]
  40. Foody, G.M. Explaining the Unsuitability of the Kappa Coefficient in the Assessment and Comparison of the Accuracy of Thematic Maps Obtained by Image Classification. Remote Sens. Environ. 2020, 239, 111630. [Google Scholar] [CrossRef]
Figure 1. Pictures of five kinds of corn seeds; (a) 2490; (b) 2780; (c) GD5; (d) XX8; (e) XY335.
Applsci 13 03507 g001
Figure 2. Background segmentation of hyperspectral images.
Applsci 13 03507 g002
Figure 3. Average spectra of five kinds of corn grains.
Applsci 13 03507 g003
Figure 4. Grayscale images of PC1-PC5 of XY335 endosperm surface hyperspectral image after PCA transformation. (a) PC1; (b) PC2; (c) PC3; (d) PC4; (e) PC5.
Applsci 13 03507 g004
Figure 5. Loading coefficients of PCs after XY335 hyperspectral image by PC transformation.
Applsci 13 03507 g005
Figure 6. The recognition results of diffident models based on full-spectrum. The red mark (o) indicates the actual category of corn kernels, the blue mark (*) indicates the predicted category of corn kernels.
Applsci 13 03507 g006aApplsci 13 03507 g006b
Figure 7. The recognition results of diffident models based on feature wavelengths. The red mark (o) indicates the actual category of corn kernels, the blue mark (*) indicates the predicted category of corn kernels.
Applsci 13 03507 g007aApplsci 13 03507 g007b
Table 1. The expressions and characteristics of four kernel functions.
Kernel FunctionMathematical FormulaCharacteristic
Linear K x , y = xy Few parameters and fast calculation speed
Polynomial K x , y = xy + 1 q A large number of parameters and easy to overfit
RBF K x , y = exp x y 2 σ 2 Wide application and strong locality
Sigmoid K x , y = tan h ν xy + c Multilayer neural network
Table 2. Class value assignment and dataset split of different maize seeds.
VarietiesAssignmentModeling SetPrediction Set
2490110050
2780210050
GD5310050
XX8410050
XY335510050
Table 3. The total recognition results of diffident models based on full-spectrum.
Recognition AlgorithmParameterModeling SetPrediction Set
Identification NumberOverall
Accuracy/%
Identification NumberOverall
Accuracy/%
PLS-DAn_components = 104408821184.4
KNNn_neighbors = 44909824497.6
NBauto49198.2250100
RFntree = 25
mtry = 11
49498.824196.4
SVM (Linear)C = 14909824899.2
SVM (Polynomial)degree = 3500100250100
SVM (RBF)C = 84.45
g = 0.001
48997.824698.4
SVM (Sigmoid)auto44889.622891.2
Table 4. The total recognition results of diffident models based on feature wavelengths.
Recognition AlgorithmParameterModeling SetPrediction Set
Identification NumberOverall Accuracy/%Identification NumberOverall Accuracy/%
PLS-DAn_components = 841382.620280.8
KNNn_neighbors = 44559121786.8
NBauto48697.224598
RFntree = 35
mtry = 3
49198.223594
SVM (Linear)C = 14909824899.2
SVM (Polynomial)degree = 3500100250100
SVM (RBF)C = 10
g = 0.0007
48997.824698.4
SVM (Sigmoid)auto43687.222188.4
Table 5. Overall classification accuracy and Kappa coefficient.
Recognition AlgorithmOverall Accuracy/%Kappa Coefficient
PLS-DA81.20.41
KNN86.80.59
NB980.94
RF940.81
SVM (Linear)96.80.9
SVM (Polynomial)98.40.95
SVM (RBF)94.40.83
SVM (Sigmaoid)88.40.64
Table 6. The misclassification error.
Recognition
Algorithm
24902780GD5XX8XY335
PLS-DA21.43013.7918.0333.33
KNN7.4118.1831.256.120
NB09.09000
RF19.3555.66000
SVM (Linear)082.045.770
SVM (Polynomial)0403.850
SVM (RBF)411.7765.880
SVM (Sigmoid)8.716.6713.7310.28
Table 7. The omission error.
Recognition
Algorithm
24902780GD5XX8XY335
PLS-DA56260012
KNN0461280
NB000100
RF008166
SVM (Linear)28420
SVM (Polynomial)04400
SVM (RBF)410644
SVM (Sigmoid)161012128
Disclaimer/Publisher’s Note: The statements, opinions and data contained in all publications are solely those of the individual author(s) and contributor(s) and not of MDPI and/or the editor(s). MDPI and/or the editor(s) disclaim responsibility for any injury to people or property resulting from any ideas, methods, instructions or products referred to in the content.