Featured Application
Helping telecom companies retain those with a tendency toward number portability.
Abstract
In 2019, China introduced a policy on Number Portability Management, which has resulted in a rapid increase in the number of lost users among telecom companies. Telecom companies must urgently distinguish those with a tendency toward number portability. However, existing prediction research lacks the input of temporal variations in user data and the graph-based analysis of user relationship characteristics, resulting in a poor prediction effect. In this paper, a neural-network-based approach has been applied to address the limitation, whereby user data do not feature temporal variation. Furthermore, innovative approaches have been proposed to construct multilayer community networks through users’ geographic attributes and to analyze community networks with a network embedding method based on the matrix factorization framework. This fills a gap in existing research areas, whereby the geographic attributes of users have not received much attention. Considering the extensive inputs and multiple features of the predicted attributes, in this paper, the strengths and weaknesses of three feature selection methods are compared, as well as the prediction accuracy of each of the five prediction models. Finally, the embedded feature selection method, deep neural network model, and the Light GBM model are shown to provide better results. After introducing the user community network, it was found that the prediction evaluation indicators of both the deep neural network model and the Light GBM model are improved.
1. Introduction
1.1. Research Background
On 11 November 2019, the Ministry of Industry and Information Technology (MIIT) issued the Provisions on Number Portability Management (hereinafter referred to as portability [1]). This means that users of one telecommunications operator can switch to another one without changing their existing mobile phone number and enjoy the various services provided by the new operator.
The provisions stipulate that telecommunications business operators shall not set up specially charged plans and marketing plans for users receiving number porting services, nor should they use technology such as interceptions and restrictions to affect the communication service quality of portability.
In April 2022, a press conference held by the State Council Information Office announced that the number of portability users across the country had exceeded 57 million.
Under the broader background of the implementation of the potability policy, at the end of 2019, the competition among the four major communication companies in China had become increasingly fierce. Operators at the municipal level who have to manually confirm whether the current millions of users tend to switch their carriers are burdened with a huge workload and face higher inaccuracies. Thus, traditional predictive studies on users leaving the network (i.e., users permanently closing an existing phone number) fall behind the current demands of communication companies.
Considering the late launches of policies related to number portability in China, research in the related field is low in quantity and is limited to discussions on policies themselves. A handful of articles adopted data mining for number portability research, while few scholars are equally familiar with telecommunications operator enterprises and data mining. This situation means it is more difficult to conduct a predictive study regarding number portability. Out of the four patents that have been applied in China [2,3,4,5], only Wang Min et al. considered the multi-month attribute data of users before numbers were ported. However, their processing method was limited to directly inputting a few specific user characteristics of the target users from a period of time before the current moment into the neural network model, without taking into account the changing trend of users’ multi-month attribute analysis. Ren, M et al. from the China Unicom Research Institute present a detailed integration solution for blockchain and mobile number portability [6]. Other research projects only utilized the attribute data of users for one month to predict portability.
In addition, researchers have not fully grasped the key points that relate to users leaving a network. For example, previous studies did not pay attention to users’ community attributes, and no one has attempted to apply graph theory to predict number portability. However, according to the work experience of the employees of the operators, the communities where customers live greatly affect the customers’ ideas of number portability. A series of unusual behaviors by a customer also suggests that the customer is ready to leave the network.
In addition, the Personal Information Protection Law of the People’s Republic of China, released in 2021, has added difficulty to carrying out existing predictive studies conducted by operators. The existing high-precision predictive models applied by operators rely heavily on the user’s phone calling attributes (i.e., the information related to phone calls between users). The official implementation of the Personal Information Protection Law means that operators can no longer retrieve users’ call records in unnecessary cases, leading to updated requirements among operators regarding prediction precision and the coverage of number portability modeling. The combination of users’ geographic attributes and community detection technology in the field of graph research can effectively meet the needs of operators.
The goal of community detection is to gain a better understanding of the components, interaction patterns, and functional characteristics of a network by analyzing its structure and connection patterns, grouping nodes, and clustering similar nodes together. The application of community detection technology is quite extensive. For instance, in social network analysis, community detection can reveal interpersonal relationships and social structure, identify opinion leaders and information diffusion paths in the network, and support precision marketing and social investigations [7].
Currently, most methods that use deep learning to study multilayer community detection networks involve obtaining the representation vectors of nodes on the multilayer network through network embedding, using clustering algorithms to cluster the representation vectors of nodes, and ultimately obtaining the results of divided communities [8]. In the latest study, Poulik et al. argued that bipolar fuzzy relations and bipolar fuzzy graphs play an essential role in solving many problems related to communication and contributions between vertices and edges in graph theory [9,10].
1.2. Organization of the Paper
In this paper, we discuss how to improve the existing research regarding the prediction of user number portability based on community detection technology. Firstly, in this study, we selected information from real customers in the operator’s local network, extracted attribute information related to the target customer for five consecutive months as sample data, and adopted the neural network method, Word2Vec [11,12], to the continuous data of model users, which not only solves the limitation of the missing time-series change in the source data but also more effectively expresses the similarity and analogy among different input features of users.
Secondly, in the process of data preprocessing, we add geographical attributes of customers by creatively building a multilayer community network; this method solved the limitation of the lack of source data that can reflect the associated attributes among users. Furthermore, the geographic attributes used in this project are accurately narrowed down to the community level after desensitization, which does not invade the privacy of the user, yet simultaneously compensates for the irretrievability of the attributes of the users’ phone calls.
Thirdly, in this study, we adopted an improved network embedding method based on the matrix factorization framework to extract new features of the community network, which solved the limitation of dimension explosion caused by the direct one-hot encoding of the customers’ geographic attributes.
Finally, considering the large number of input users and features in the prediction model, in this study, we compared three feature selection methods to assess their advantages and disadvantages. Additionally, we evaluated the processing performance of five classifiers using the data from this project to identify the most suitable classification model, which can improve accuracy and facilitate practical applications for operators and enterprises.
2. Modeling and Experiment Comparison
2.1. Modeling Ideas
The main thought behind using machine learning algorithms to establish a predictive model in this paper is to correlate the basic information of existing users and users who have ported their phone numbers. In this study, we adopt machine learning methods for modeling and finding out the relationship between the two parties, so as to predict customers with the potential for attrition among the existing customers. Thus, in this research, it was shown that this method can be used to effectively locate and retain customers while lowering costs for the company.
The modeling concept presented in this paper is as follows (shown in Figure 1):
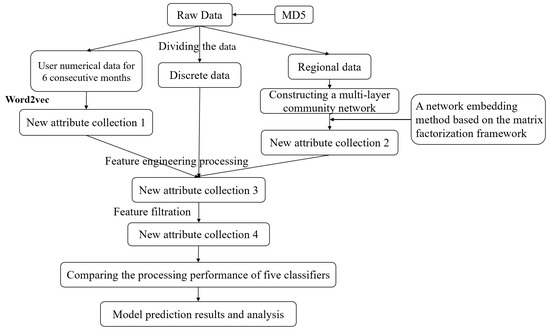
Figure 1.
Modeling concept.
Firstly, to complete data preprocessing, this research divided the data into three categories, namely numerical data, discrete data, and regional data.
Secondly, the user numerical data generated for 6 consecutive months were modeled based on the Word2Vec method; the new attribute collection 1 is output, which reflects the behavior change characteristics of users in a period of time before; and feature engineering processing was performed on the discrete data and the new attribute collection 1.
A single original feature (or variable) was usually a continuous feature, categorical feature, or ordinal feature. The processing method used for a single feature in this paper is shown in Table 1.

Table 1.
Feature engineering operation.
After constructing a multilayer community network for regional data, in this research, the new attribute collection 2 is output based on an improved method.
Thirdly, in this study, new attribute collection features are selected to determine the appropriate feature variables.
Fourthly, a prediction model is built to predict the tendency of existing users to leave the network, and the prediction precision of different models is compared to, finally, obtain the most suitable prediction model to predict whether existing users would leave the network.
2.2. Data and Experimental Environment
The dataset used in this article was provided by the communication industry database, which includes a total of one million samples of existing network users, users leaving the network without porting numbers, and users porting numbers. In order to protect customer privacy, the data were strictly desensitized twice and were solely used for academic research.
Among them, 13,000 users left the network by porting numbers, and 94,000 users left the network without porting numbers. The number of features was 48, including 35 numerical features such as “caller calling times”, 8 discrete features containing “primary and secondary card identification”, and 5 regional features such as “area”, “branch”, “street”, and “community”.
Experimental environment: Windows10, Python3.7.3, tensorflow-gpu1.9, and keras2.2.
Application program: Jupyter Notebook.
Server environment: Intel(R) Xeon(R) CPU E5-2620 v3 @ 2.40 GHz (two processors), RAM 48.0 GB.
2.3. Process User Continuous Time Attributes
In view of the difficulties arising from the combinatorial relationships between multi-month features, such as the changing trends in information regarding five-month call duration, payment amount, and short message number, in this study, we first attempted to add various features using five traditional methods, such as the calculation of ring ratio, average, weighted average, variance, and standard deviation. Although this method may be simpler and more intuitive, it may not capture the complex semantic relationships in the Word2Vec model.
As shown in Figure 2, in this study, we used Word2Vec to model five months of continuous data. Firstly, 25 numerical attributes were selected from the user features as input, which were simply counted according to rows and columns, and the corpus sentences were obtained via word segmentation. Then, the CBOW algorithm was used to loop within the character length of the corpus, discarding the words with a frequency of less than one, and representing each vector by five numbers.
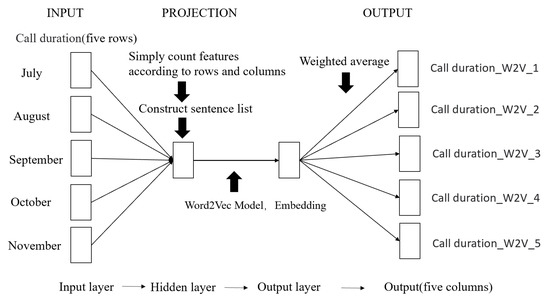
Figure 2.
Flowchart of Word2Vec feature processing.
Taking the user’s “call duration” feature as an example, the “call duration” value of five consecutive months was taken as input, and the function was used to group the values according to the user’s unique identification. The call duration of each user by month was regarded as a sentence, and the call duration of all users was regarded as a corpus to learn a Word2Vec model. In this way, the original word vector of dimension V was changed into a word vector of dimension N (N is much smaller than V), and the word vectors retained a certain correlation, which meant that users who are similar in sequence behavior should also be similar in tags. The average value of the embedding vectors corresponding to each call duration was taken as the feature of the user under the call duration label.
Finally, the corresponding word vector dimensions were used to generate the corresponding new features. In this study, the input was five rows (for each feature); therefore, the output was also set to five columns, as introducing too much noise and too many unnecessary dimensions may result in features that are too dense, which would be difficult to interpret and apply.
2.4. Build a Community Detection Network
When we tried to address the user location attribute in this project, we found that because the words in the document and the nodes in the social network share statistical consistency, the idea of Word2Vec could be transferred to the network embedding application [13]. Therefore, in this paper, we tried to combine the geographic attribute of telecom users with the network embedding method. Under the condition of limited customer characteristics, the existing regional characteristics of customers were integrated, the transformation was brought closer to reality on the basis of the traditional community network, and a multilayer community network model was built [14].
Definition 1 (Single-layer network).
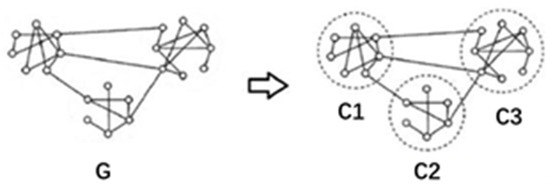
A single-layer network can be formalized as in Figure 3. Assuming the graph G = G (V, E), where V represents a vertex (usually, a vertex represents an individual), and E represents a connection between vertices, indicating the existence of a certain connection between two individuals.
Figure 3.
General single-layer network diagram.
A community network means that graph ‘G’ is composed of ‘n’ communities ‘C’, among which:
G = C1 + C2 + C3+…+Cn
Definition 2 (Multilayer Network).
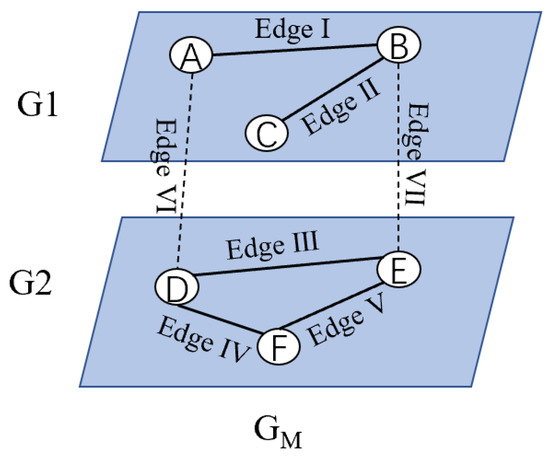
A multilayer network can be defined as GM = {G1, G2, …, GL, EM). Using Figure 4 as an example, L is the total number of layers and EM is the set of edges between layers, (L = 2, EM = {Edge VI, Edge VII}), Gi = (Vi, Ei) is the network at layer i, where the set of nodes at layer i is Vi ⊆ V, V is the set of all nodes in a multilayer network (V = {V1, V2, …, VN}, V1 = {A, B, C}). Ei ⊆ Vi * Vi, is the set of edges in the i-th layer network (E1 = {Edge I, Edge II).
Figure 4.
General multilayer network diagram.
On the basis of the information presented above, and according to the actual situation of the operator, we introduced the auxiliary node to enable the community network to be understood better (as shown in Step 2).
The regional network features were extracted from the established community network model through an improved method (as shown in Table 2) and added to the original feature set to optimize the classification model, improving the identification accuracy of customers leaving the network, and providing technical support for returning customers.
Table 2.
The processing steps of community discovery.
Figure 5 shows the layout of the multilayer community network constructed in this paper. The specific method applied includes the following steps:
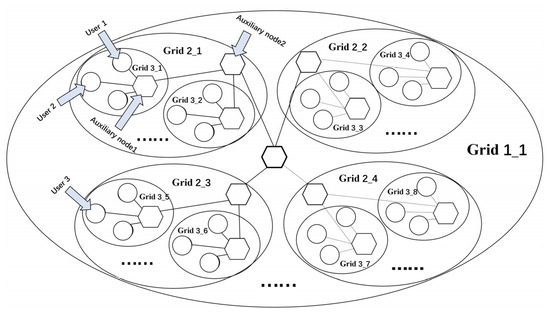
Figure 5.
Layout of the multilayer community network.
Step 1: Initialize the data grid dictionary to store and output user geographic data. The user data grid inputted based on dictionary rules (a set of conventions used to define the structure and content of a dictionary) refers to the user’s regional features. Initialize each data grid dictionary, traverse each data grid and the name in it, add the formatted user grid data to the cache, and output the data grid dictionary. In the context of community detection, a data grid dictionary can be used to represent the adjacency matrix of a network, where the keys represent the nodes, and the values represent the edges between them [15].
Step 2: Construct a new multilayer community network model of telecom users. Iterate over all the users, divide the grid based on their geographic attributes, and create a new node for each user based on their unique identity. For example, if we consider Grid 3_1 as area-A, then, the circular nodes in Grid 3_1 can represent all users living in area-A, and all users living in area-B are in another small grid, Grid 3_2, with no intersection between the grids.
Step 3: In addition to the traditional community network, in this project, we add auxiliary nodes based on the actual situation. For example, the auxiliary node (hexagonal node) in Grid 3_1 can be interpreted as an exclusive customer manager for area-A, which is widely connected with all the users in Grid 3_1. Therefore, the hexagonal nodes in Grid 3_1 are connected to all circular nodes in the same grid, and the same is true for Grid 3_2, and so on. An auxiliary node is constructed separately in each grid, which is fully connected to the users belonging to that grid.
Step 4: Traverse the grid of the upper layer, that is, a larger layer of the grid (such as grid 2-1). In the network of this layer, construct a new auxiliary node, which is fully connected with the auxiliary node in the lower grid.
Repeat the step until the topmost grid is reached (e.g., grid 1-1) to complete the network construction. This method makes the network structure smaller and more energy-efficient than the fully connected network structure. It can more closely reflect the association between network nodes without being randomly selected.
Step 5: Output the graph with users as nodes.
Step 6: Use the graph as the input and substitute it into Table 2 for calculation.
Output a matrix of x*4, where x is the number of users in the graph, and 4 refers to four new attributes that contain the topological information regarding the user community network graph and hidden related information. The new attributes are all numeric attributes (assuming that both user 1 and user 2 exist in grid 3-1, set the weight of the connection between the auxiliary node and each user in grid 3-1 to be one, then, the distance between user 1 and user 2 is two. In the output new numerical attribute, the new attribute A of user 1 and that of user 2 is calculated by substituting the distance formula to obtain the result of two, which means that the distance between user 1 and user 2 is two. Thus, the new attribute contains the topological information and hidden association information regarding the user community network graph).
Table 2 shows a network embedding method based on the matrix factorization framework, which is considered one of the most effective methods at this stage for application scenarios that require fast, high-quality, and large-scale network embedding [16,17,18,19].
Meanwhile, this matrix-factory-based framework is more computationally intensive and efficient and offers significant improvements over DeepWalk and LINE for conventional network mining tasks. In the lab test, the F1-score of DeepWalk and LINE using 10% training data to obtain a classification is 12–29%, and the F1-score of this improved method on the same dataset is 18–38%, which also represents large-scale networks.
Therefore, here, we adopt this improved algorithm to embed the user’s community network, so as to more effectively display the rules generated among users due to community attributes.
2.5. Comparison of Feature Selection Methods
Feature selection refers to the selection of N features from the existing M features, to optimize the specific indicators of the system. It is the process of selecting some of the most effective features from the original features to reduce the dimension of the dataset. It is an important means to improve the performance of learning algorithms and a key data preprocessing step in pattern recognition.
Feature selection includes three methods, namely Filter, Wrapper, and Embedding [20].
Due to the variety of feature selection methods and according to the different combinations of feature selection and learners [21], in this paper, we tried different feature selection methods, compared their advantages and disadvantages, and selected the most suitable method for this project.
In this article, we attempted to evaluate and compare 125 attributes. The encapsulated code takes about 9 h to run, which is much longer than the filtering and embedded algorithms. Both the filtering and embedded algorithms can generate visual graphics, which are easy for researchers to observe and can be deleted by setting relevant thresholds.
From the perspective of project complexity, the filtering algorithm is independent of the specific learning algorithm and has the advantage of high operational efficiency. However, the filtering algorithm needs to be run twice. The first run is used to calculate the correlation between attributes and labels, and the second run is to calculate the correlation between two attributes. The embedded algorithm integrates feature selection into the classification model. Although it only takes one step, it runs the prediction model again after filtering the feature attributes due to the subsequent feature selection of the trained model cannot be performed.
The advantages and disadvantages of the three feature selection methods are compared in Table 3:
Table 3.
Comparison of advantages and disadvantages of the three feature selection methods.
To sum up, in this paper, we chose to use the filtering method for feature selection because this method is not as time-consuming, easy to operate, does not get stuck in a local optimum solution, and can observe the correlation between two attributes.
2.6. Comparison of Prediction Models
The main purpose of this article was to build a prediction model with higher accuracy based on existing data records and provide telecom operators with a list of users who are prone to number portability. In this paper, we chose the widely used KNN, random forest model, SVM, deep neural network, and the Light GBM model to compare the prediction accuracy of different models, and to find the optimal user number portability prediction model.
Firstly, to ensure the fairness and reliability of the comparison between the models, the performance of the four models was evaluated via ten-fold cross-validation, to calculate the accuracy rate of each evaluation. As shown in Figure 6, the predictive accuracy of the KNN and SVM is the lowest at below 85%, followed by the RF model. The DNN and Light GBM models have the highest prediction accuracy, both exceeding 90%. The accuracy of Light GBM is slightly higher than that of the DNN.
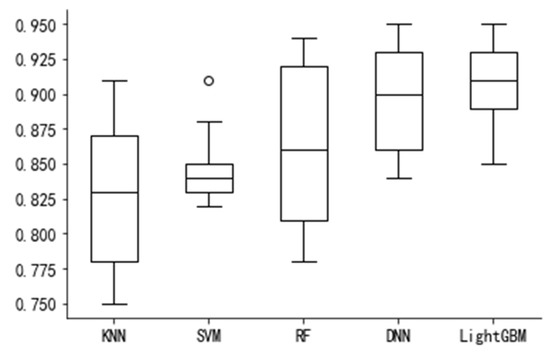
Figure 6.
Comparison of model prediction accuracy.
Therefore, the prediction accuracy of the DNN and Light GBM is significantly higher than that of the other three models, while that of Light GBM is slightly better than that of the DNN.
Secondly, to study the influence of the number of characteristic variables on the prediction accuracy of each model, the prediction accuracy of each model with different numbers of characteristic variables is calculated. As shown in Figure 7, when the number of characteristic variables is less than 10, the prediction accuracy of each model is significantly improved with the increase in the number of characteristic variables. When the number of characteristic variables is greater than 15, the prediction accuracy of each model is not obviously improved, remaining basically unchanged.
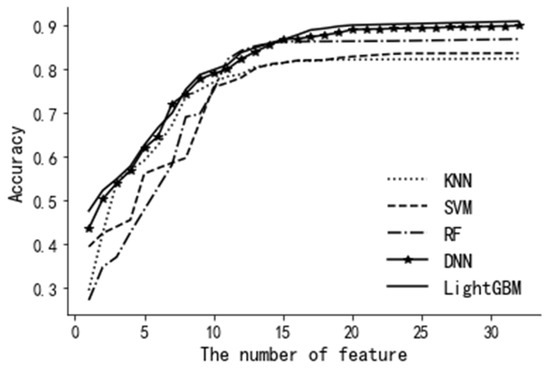
Figure 7.
Comparison of model accuracy.
As a single indicator cannot reflect the overall performance of the model, in this project, we must combine different indicators to reflect the overall performance of the model.
Therefore, here, we adopt accuracy, precision, recall, F1-score, and AUC-value to evaluate the performance of the model. The evaluation results are shown in Table 4. Among the five prediction models, KNN’s evaluation indicators are lower than other models. On the contrary, all the evaluation indicators of Light GBM are higher than other models. Figure 8 is a schematic diagram of the ROC curves for each model, and the results are consistent with the data of each evaluation indicator in Table 4. The area under the ROC curve of KNN is the smallest, and the area under the ROC curve of Light GBM is the largest. It can be seen from Table 4 and Figure 8 that, compared with other machine learning algorithms, the performance of each evaluation index of the Light GBM model is better.
Table 4.
Comparison of advantages and disadvantages of three feature selection methods.
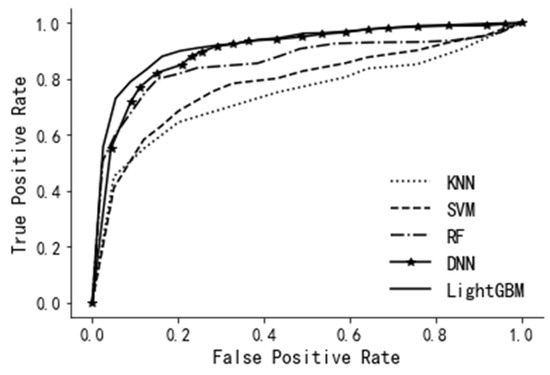
Figure 8.
Model performance comparison.
The research mentioned above shows that the DNN model and the Light GBM model have higher accuracy in predicting the number portability of users, although the previous research did not take into account the influence of the network structure on the text matrix. Thus, the user community network was added to the data processing to compare the prediction accuracy of the DNN model and the Light GBM model to those without a community network. The results are shown in the last two rows of Table 3. After the community network was introduced, the accuracy of both the DNN model and the Light GBM model increased by 3 percent, and the other evaluation indicators also improved. It can be seen that after introducing the user community network, all prediction evaluation indicators of the model have improved.
3. Conclusions and the Following Work
In this paper, we take the telecom operator user information as the basic data regarding the groundwork of information clustering, feature engineering, and information prediction. Here, we successively discuss the role of Word2Vec and its improved method in the data preprocessing of this project and compare the prediction precision of different models on telecommunications users’ number portability.
It was found that using Word2Vec to model user data for consecutive months can uncover more potentially useful information in an easier way. In terms of feature selection for user information, it was found that the embedded method is more suitable based on the time it takes to perform and considerations regarding score performance. Through the prediction accuracy comparison, it was found that the DNN model and the Light GBM model are significantly better than the traditional KNN, SVM, and RF models. Finally, in this paper, we applied the method of building a community network for the first time and adopted a network embedding method based on the matrix factorization framework for network analysis. This study integrates the regional attributes of telecommunications users with portability prediction. The experimental comparison shows that after introducing the user community network, the evaluation indicators of the DNN model and the Light GBM model improved. Thus, the behavior of user porting numbers is highly related to the community environment they live in. Operators can solve targeted problems and bring back potentially lost customers.
This research provides a reference for telecommunications enterprises in the prediction of number portability. In the future, research can be conducted regarding user information feature selections and model parameter optimizations to further improve prediction accuracy.
Author Contributions
Conceptualization, R.C. and B.L.; methodology, R.C.; validation, R.C. and B.L.; data curation, R.C.; writing-original draft preparation, R.C.; writing-review and editing, R.C.; visualization, R.C.; supervision, B.L.; project administration, R.C. All authors have read and agreed to the published version of the manuscript.
Funding
This research received no external funding.
Institutional Review Board Statement
Not applicable.
Informed Consent Statement
Not applicable.
Data Availability Statement
Because it involves the real user data of the telecom companies and privacy issues, the data is unavailable.
Conflicts of Interest
The authors declare no conflict of interest.
References
- Zhang, Z. Policy Research on Management Regulations on Carrying Number and Transferring Network Service by Ministry of Industry and Information Technology. Master’s Thesis, University of Electronic Science and Technology of China, Chengdu, China, 2021. [Google Scholar]
- Fang, D.; Xu, D. Prediction Method and Device for Number Portability User and Computing Equipment. CN113543117A, 22 October 2021. [Google Scholar]
- Wei, J.; Cui, Y.; Zhang, D. Prediction Model Generation Method, Prediction Model Generation Device, and Computer-Readable Medium. CN112200375A, 8 January 2021. [Google Scholar]
- Wang, M.; Xin, C. Prediction Method, Device and Storage Medium for Number Portability Potential User. CN111092762A, 1 May 2020. [Google Scholar]
- Zhang, L. Research on Telcom Customer Churn Prediction Based on Deep Learning; Yunnan University of Finance and Economics: Kunming, China, 2020. [Google Scholar]
- Ren, M.; Li, C.; Xue, M.; Ren, J.; Wang, G. Discussion and Research on Mobile Number Portability Service Based on Blockchain. Designing Techniques of Posts and Telecommunications. No.561. 2022, pp. 15–20. Available online: https://d.wanfangdata.com.cn/periodical/ChlQZXJpb2RpY2FsQ0hJTmV3UzIwMjMwMTEyEg95ZHNqanMyMDIyMTEwMDQaCHc3cnFjOHlj (accessed on 16 February 2023).
- Zhang, F.; Zhang, W.; Zhang, Y.; Qin, L.; Lin, X. OLAK: An efficient algorithm to prevent unraveling in social networks. Proc. VLDB Endow. 2017, 10, 649–660. [Google Scholar] [CrossRef]
- Song, H.; Thiagarajan, J.J. Improved deep embeddings for inferencing with multi-layered networks. arXiv 2018, arXiv:1811.12156. [Google Scholar]
- Poulik, S.; Ghorai, G. Determination of journeys order based on graph’s Wiener absolute index with bipolar fuzzy information. Inf. Sci. 2021, 545, 608–619. [Google Scholar] [CrossRef]
- Poulik, S.; Ghorai, G. Estimation of most effected cycles and busiest network route based on complexity function of graph in fuzzy environment. Artif. Intell. Rev. 2022, 55, 4557–4574. [Google Scholar] [CrossRef] [PubMed]
- Grbovic, M.; Cheng, H. Real-time personalization using embeddings for search ranking at airbnb. In Proceedings of the 24th ACM SIGKDD International Conference on Knowledge Discovery & Data Mining, London, UK, 19–23 August 2018; pp. 311–320. [Google Scholar]
- Mikolov, T.; Sutskever, I.; Chen, K.; Corrado, G.S.; Dean, J. Distributed representations of words and phrases and their compositionality. Adv. Neural Inf. Process. Syst. 2013, 26. [Google Scholar]
- Bhowmick, A.K.; Meneni, K.; Danisch, M.; Guillaume, J.-L.; Mitra, B. Louvainne: Hierarchical louvain method for high quality and scalable network embedding. In Proceedings of the 13th International Conference on Web Search and Data Mining, Houston, TX, USA, 5–9 February 2020; pp. 43–51. [Google Scholar]
- Shen, H.-W. Community Structure of Complex Networks; Springer Science & Business Media: Berlin/Heidelberg, Germany, 2013. [Google Scholar]
- Fortunato, S.; Hric, D. Community detection in networks: A user guide. Phys. Rep. 2016, 659, 1–44. [Google Scholar] [CrossRef]
- Qiu, J.; Dong, Y.; Ma, H.; Li, J.; Wang, K.; Tang, J. Network embedding as matrix factorization: Unifying deepwalk, line, pte, and node2vec. In Proceedings of the 11th ACM International Conference on Web Search and Data Mining, Hong Kong, China, 9–12 February 2018; pp. 459–467. [Google Scholar]
- Qiu, J.; Dong, Y.; Ma, H.; Li, J.; Wang, C.; Wang, K.; Tang, J. Netsmf: Large-scale network embedding as sparse matrix factorization. In Proceedings of the World Wide Web Conference, San Francisco, CA, USA, 13–17 May 2019; pp. 1509–1520. [Google Scholar]
- Zhang, J.; Dong, Y.; Wang, Y.; Tang, J.; Ding, M. Prone: Fast and scalable network representation learning. In Proceedings of the IJCAI (2019), Macao, China, 10–16 August 2019; pp. 4278–4284. [Google Scholar]
- Zhu, H.; Koniusz, P. Refine: Random range finder for network embedding. In Proceedings of the 30th ACM International Conference on Information & Knowledge Management, Online, 1–5 November 2021; pp. 3682–3686. [Google Scholar]
- Sun, H.; He, F.; Huang, J.; Sun, Y.; Li, Y.; Wang, C.; He, L.; Sun, Z.; Jia, X. Network embedding for community detection in attributed networks. ACM Trans. Knowl. Discov. Data 2020, 14, 1–25. [Google Scholar] [CrossRef]
- Bolón-Canedo, V.; Alonso-Betanzos, A. Ensembles for feature selection: A review and future trends. Inf. Fusion 2019, 52, 1–12. [Google Scholar] [CrossRef]
Disclaimer/Publisher’s Note: The statements, opinions and data contained in all publications are solely those of the individual author(s) and contributor(s) and not of MDPI and/or the editor(s). MDPI and/or the editor(s) disclaim responsibility for any injury to people or property resulting from any ideas, methods, instructions or products referred to in the content. |
© 2023 by the authors. Licensee MDPI, Basel, Switzerland. This article is an open access article distributed under the terms and conditions of the Creative Commons Attribution (CC BY) license (https://creativecommons.org/licenses/by/4.0/).