Abstract
To reveal the mechanical characteristics of BRT asphalt pavement structures under the combined effects of the temperature field and load of buses, a series of finite element analysis models were established in the software application ABAQUS to simulate the Lanzhou BRT asphalt pavement project. The actual BRT road temperature field in summer and loads of buses at different speeds were introduced in the model with user subroutines before conducting a sequentially coupled thermal-mechanical analysis. The results indicated that the BRT asphalt pavement structure readily experienced permanent deformation, mainly comprising unstable rutting during the high-temperature season, and the possibility of cracking was higher for the subbase bottom than for the base. Temperature imposed a greater influence than BRT vehicle frequency. To delay fatigue cracking of the base and subbase and the shear failure of asphalt pavement structures, BRT operating speed should be controlled within 30–40 km/h. In actual BRT asphalt pavement engineering, special attention should be given to the deformation resistance of the intermediate surface layer.
1. Introduction
With the process of urbanization and the rapid development of social economy and culture, the transportation of large numbers of people has brought great pressure to urban road traffic, and therefore many cities are vigorously developing public transportation. Bus rapid transit (BRT), as a new and efficient public transport mode, has achieved remarkable results in improving urban transport efficiency and relieving traffic pressure due to its capacity, feasibility and cost-effectiveness. As a key component of this development, BRT-related research has basically focused on land development impact [1], greenhouse gas emissions [2], safety concerns [3], life cycle cost assessment [4] and comparison with other public transport alternatives [5]. However, little work has been done to study the mechanical characteristics of BRT roads until recent years. The difficulty lies in the combination of special factors that affect BRT roads that can significantly accelerate the deterioration of BRT pavements.
In the current operation situation, ruts, potholes, fatigue cracks and other damage develop in many BRT roads shortly after they are put into service. This phenomenon is even more serious in station areas of BRT systems [6,7]. Due to the frequent braking and starting of buses, severe rutting can cause early pavement failure. As a result, Izaks et al. [8] and Xiong et al. [9] suggested using high-modulus asphalt concrete in the asphalt pavement structure to inhibit rutting and fatigue cracking. Such research has great significance for the prevention of BRT asphalt pavement problems. However, in addition to the asphalt material, other factors including axle weight, axle type, running characteristics of BRT vehicles and environmental temperature have a significant impact on the mechanical characteristics of BRT asphalt pavement. Most pavement problems are related to the temperature of the pavement structure and the characteristics of bus loads.
Regarding pavement structure temperature, many scholars have conducted meaningful research. Mirzaei et al. [10], Qin et al. [11], and Mohajerani et al. [12] focused on the relationship between asphalt pavement temperature and the urban heat island effect and showed that asphalt pavement was vulnerable to atmospheric temperatures. Lin et al. [13], Mills et al. [14], and Qin et al. [15] researched factors influencing pavement surface temperature, including air temperature, solar radiation, wind speed, and pavement texture. Fujimoto et al. [16], Islam et al. [17], Chen et al. [18,19], and Adwan et al. [20] introduced models for predicting asphalt pavement temperature. Mohd Hasan et al. [21] and Zhou et al. [22] studied the influence of the temperature field on the stress of asphalt pavement structures. Sarkar et al. [23] quantified the thermal behavior of continuously reinforced concrete pavement (CRCP) and the curling deflection of BRT lanes. Yu [24] measured and analyzed the relationship between the surface temperatures of different pavement types and atmospheric temperature.
Another factor that has an important effect on the mechanical properties of BRT asphalt pavement structure is the bus load. Bus loads in urban areas have the characteristics of heavier axle weight, slow speeds, and frequent acceleration and deceleration [25], which are obviously different from the characteristics of highway vehicle loads [26,27]. Meanwhile, due to width limitations of lanes and the size of buses, the load must be concentrated on the wheel path, and this highly channelized load has an adverse effect on BRT pavement structure. Therefore, for the mechanical analysis of BRT asphalt pavement structure, it is necessary to use a traffic load that is more in line with the characteristics of BRT buses. However, research on load characteristics of BRT vehicles is limited. With respect to vehicle loading, Cheng et al. [28] and Hsing et al. [29] investigated vertical strain and stress through a dynamic load experiment. The results showed the significance of axle configuration, axle load and traffic speed on the vertical strains and stresses of asphalt pavement. Wang et al. [30], Zhao et al. [31], and Zhang et al. [32] emphasized the characteristics of dynamic traffic loads. Assogba et al. [33], Wang et al. [34], and Selsa et al. [35] studied the dynamic mechanical response of asphalt pavement under different traffic loads. Zhang et al. [36] analyzed the mesomechanical response of asphalt pavement under vehicle loads by generating a three-dimensional mesostructure discrete element model. Wang et al. [37], Dong et al. [38], and Huang et al. [39] analyzed loads as nonuniform distributions and found that stress concentration was present in asphalt pavement. Hajj et al. [40] determined rutting and fatigue-based load equivalency factors for BRT buses operating in northern and southern Nevada by obtaining pavement responses corresponding to several cases of bus loading and climatic conditions.
All of the above research showed the important effects of temperature field and vehicle load on asphalt pavement. However, the available research mainly focuses on highways; research on BRT roads under bus loads is limited. Pavement structure temperature and bus load are associated with each other, and are considered to have a coupled influence, rather than independent influences, on the mechanical characteristics of asphalt pavement. This paper aims to meet the need for a study on the mechanical characteristics of BRT asphalt pavement structure under the combined action of an actual temperature field and bus load. To achieve this goal, a series of finite element models were established using the well-known commercial software application ABAQUS 6.14-1, based on the Lanzhou (city of Gansu Province, China) BRT asphalt pavement project. First, the actual weather conditions of Lanzhou in summer were introduced into the model to analyze the temperature field of BRT asphalt pavement. Then, a sequentially coupled thermal-mechanical analysis was conducted by importing the actual temperature field into a mechanical response calculation model of pavement structure under bus loads to analyze the vertical compressive stress, horizontal tensile stress, shear stress, and permanent deformation of the BRT asphalt pavement structure. The details of the results are presented and discussed in this paper.
2. Establishment of the Analysis Model
2.1. Pavement Structure and Materials
The structure and material of the three-dimensional finite element analysis model were consistent with those of the Lanzhou BRT asphalt pavement structure, as shown in Figure 1. The following assumptions about the BRT asphalt pavement structure model were made [41,42]. (1) The surface of the asphalt pavement was made of viscoelastic materials, and the remaining layers were made of linear elastic materials. (2) The surface of the pavement was considered to be a horizontal plane, regardless of its roughness and the influence of the horizontal and vertical slopes. (3) Structural layers were of uniform thickness, and were isotropic and continuous, without considering the influence of gravity. (4) The structural layers were completely continuous, and the displacement was continuous in the vertical direction.
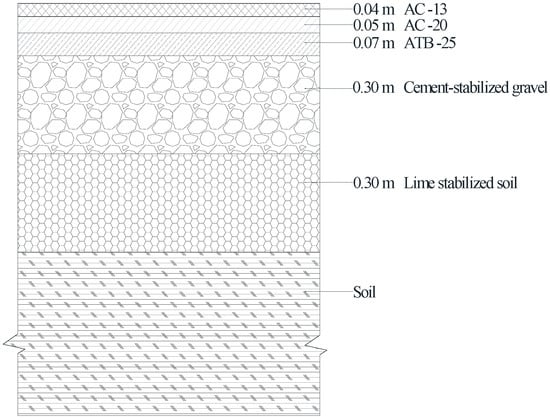
Figure 1.
Lanzhou BRT asphalt pavement structure.
In regard to the actual engineering of the Lanzhou BRT asphalt pavement, the surface materials of the pavement are AC-13, AC-20 and ATB-25. The asphalt used in those asphalt mixtures is 90#, with a penetration requirement at 25 °C of 80–100 (0.1 mm). Due to the remarkable viscoelastic properties of the asphalt mixture, its material properties are greatly affected by temperature. Considering the influence of the temperature field on the mechanical properties of BRT pavement structures, a creep model was adopted for the surface asphalt mixture. In this model, the surface deformation () is related to the temperature (T), stress (q), and time (t), and can be obtained with Equation (1):
In this study, the strain hardening law was applied to simulate the creep characteristics of the asphalt mixture under loading conditions. In the analysis process, the stress state was varied. As a result, the above equation can be rewritten as Equation (2):
where A, n and m are parameters of the strain hardening creep model related to the temperature [43], and denotes the uniaxial equivalent creep strain.
The thickness and material parameters of each structural layer of the pavement model are listed in Table 1, which shows the elastic parameters and creep parameters of AC-13, AC-20 and ATB -25 at different temperature [43]. The material parameters at 20 °C retrieved from the literature [26] were adopted for the base, subbase and subgrade.

Table 1.
Structural and material parameters of BRT asphalt pavement.
2.2. Temperature Conditions
It was assumed that all the structural layers of BRT asphalt pavement were isotropic and completely continuous between layers. The horizontal distribution of the temperature field of the pavement structure was assumed to be unchanged, only heat flux transfer along the depth direction was considered, and the heat flux and temperature between the layers was continuous [44]. The thermal property parameters of each structural layer material of the BRT asphalt pavement were determined by referring to literature [43], as shown in Table 2.
Table 2.
Thermal property parameters of asphalt pavement structure materials.
Because the temperature of the pavement structure changes with time, the temperature field is transient. It is necessary to define steady-state and transient heat conduction analysis steps to analyze the continuous temperature change in one day. User subroutines FILM and DFLUX [45] were programmed in Fortran 77 to simulate the temperature field conditions, including solar radiation, atmospheric temperature and convective heat exchange. The effective radiation of the road surface was defined based on the emissivity of the road surface in the interaction module of the model. Table 3 shows the representative daily 24 h temperature during the hot season in Lanzhou. Table 4 shows the corresponding meteorological parameters.
Table 3.
Atmospheric temperature during one day in the hot season in Lanzhou.
Table 4.
Meteorological parameters.
2.3. Application of Moving Loads
The parameters of the load were consistent with Lanzhou BRT operating vehicles, which are shown in Table 5. Because the wheelbase was relatively long and the load of the rear axle was obviously greater than that of the front axle, only the load of the rear axle was taken for modeling analysis. To reduce computational efforts, the two-wheel load of the rear axle was simplified into a single-wheel rectangle based on Equations (3)–(6); the length/width ratio of the rectangle was 0.8712/0.6 [46]. As a result, the simplified load, as shown in Figure 2, acted on an area 0.32 m long and 0.22 m wide, and the specific ground pressure was 0.733 MPa. Measurements were obtained at four points: point A, at the center of one of the loading regions; point B, at the inner edge of one of the loading regions; point C, at the middle of the loading regions; and point D, at the middle of points B and C. The horizontal force coefficient was 0.5. User subroutines DLOAD and UTRACLOAD [47] were programmed in Fortran 77 to simulate the movement of vertical and horizontal loads.
where P denotes the standard design axle load of 100 kN; p denotes the standard design specific ground pressure of 0.70 MPa; A denotes the area of the simplified single-wheel rectangle; Pi denotes the load distributed on the wheel (kN); pi denotes the specific ground pressure (MPa); La denotes the length of the simplified single-wheel rectangle; and Lb denotes the width of the simplified single-wheel rectangle.
Table 5.
Parameters of the BRT bus.
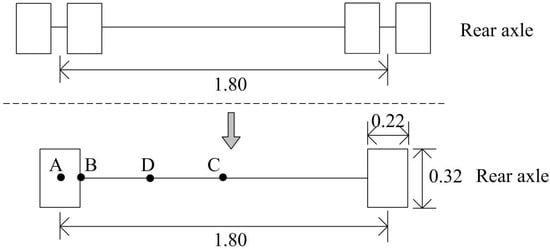
Figure 2.
Schematic diagram of equivalent load (unit: m).
Based on the measured data for Lanzhou BRT vehicle operation speeds, the initial speed of the moving load was set to 10 km/h, 20 km/h, 30 km/h or 40 km/h. In each initial speed case, a deceleration of −2 m/s2 was adopted to simulate the entrance process of BRT braking, and the running time was 0.5 s. Because different initial braking speeds lead to different braking distances, to facilitate the comparison of stress results under various speed conditions, the braking distances of four levels were symmetrically distributed on the wheel path based on the middle section of the model, which was the fixed location for extracting mechanical response. The braking starting position and corresponding braking distances of the load are shown in Figure 3.
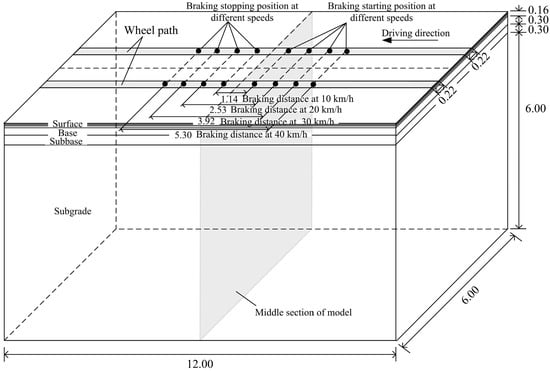
Figure 3.
Schematic diagram of pavement structure with BRT vehicle braking (unit: m).
2.4. Other Parameters
It should be explained that, due to the symmetry of the pavement structure and vehicle load along the cross-sectional direction, as shown in Figure 3, the 1/2 model was taken for analysis. The model dimensions were 3 m in the cross-sectional direction (X-axis), 6.76 m in the depth direction (Y-axis) and 12 m in the driving direction (Z-axis). All the models had the same grid and were meshed by adjusting the mesh spacing, which gradually increased with increasing distance from the load path area, as shown in Figure 4. The minimum and maximum element sizes were 0.02 m and 0.50 m, respectively. The DC3D8 element was used in the temperature field model, and the C3D8 element was used in the mechanical response calculation model, in which the temperature field corresponding to the mechanical analysis step had been imported. The boundary conditions of the models were defined as symmetrical constraints on the side surfaces (X- and Z-directions) and fixed constraints on the bottom surface of the subgrade (Y-direction). Considering the advantages of the ABAQUS/standard solver in nonlinear analysis of viscoelastic material and the solving speed of dynamic analysis, the models were submitted to ABAQUS/standard for implicit analysis.
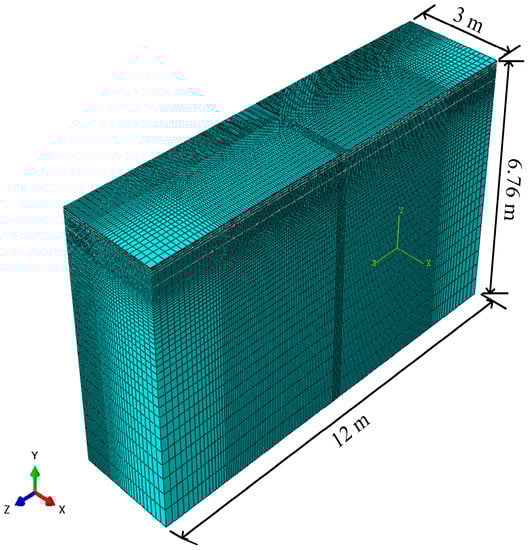
Figure 4.
Finite element model of BRT pavement structure.
The principles and procedure of the analysis method for the mechanical characteristics of the BRT asphalt pavement structure under varying temperatures and bus loads are shown in Figure 5.
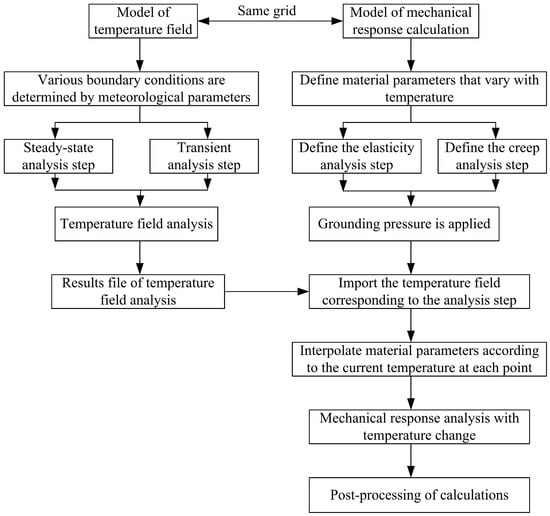
Figure 5.
Principles and procedure of analysis method for mechanical characteristics of BRT asphalt pavement structure under varying temperatures and bus loads.
3. Results and Discussion
3.1. Temperature Field Analysis of BRT Asphalt Pavement Structure
Equations (7) and (8) constitute the model for predicting daily maximum temperature and daily minimum temperature at a given depth of asphalt pavement. This model was proposed by Lijun Sun [48] and has wide applicability. To verify the reliability of the temperature field model, the calculated daily maximum and minimum temperature in this study were compared to predicted temperatures obtained with Equations (7) and (8). In the process of obtaining the predicted temperature, Tamax and Tamin, derived from Table 3, were 33.6 °C and 20.8 °C, respectively; Tm was 23.6 °C, which was the average monthly temperature of the hottest months of the last 10 years in Lanzhou. The calculated and predicted temperatures are listed in Table 6.
where Tpmax denotes the daily maximum temperature at the given depth of asphalt pavement (°C); Tpmin denotes the daily minimum temperature at the given depth of asphalt pavement (°C); Tamax denotes daily maximum air temperature (°C); Tamin denotes daily minimum air temperature (°C); H denotes the depth below surface (cm); and Tm denotes the mean monthly temperature over the calendar year.
Table 6.
Comparison of calculated and predicted temperatures of asphalt pavement.
As shown in Table 6, with the increase in asphalt pavement depth, the calculated temperature and the predicted temperature basically exhibited the same trend, namely, the daily maximum temperature decreased and the daily minimum temperature increased. Moreover, the difference between the calculated temperature and the predicted temperature at the same depth was relatively small. Notably, the maximum difference was 3.5 °C, which had little influence on the mechanical properties of asphalt pavement. In conclusion, the temperature field model established above is highly reliable, and the calculation results satisfy our analysis needs.
Figure 6 shows the temperature change of the BRT asphalt pavement structure during 24 h of 1 day. As shown in Figure 4, the temperature change trend of the pavement structure was roughly the same as that of air, and the temperature change of the pavement surface was basically synchronized with that of the air temperature over time. Because the rate of absorption of solar radiation of the asphalt pavement was far greater than that of the atmosphere, the temperatures of the upper, intermediate and lower surface layers were obviously higher than that of the atmosphere. With increasing depth of the pavement structure, the change in temperature gradually lagged, and the range of the temperature rise gradually decreased. The upper, intermediate and lower surface layers sequentially reached maximum temperature values of approximately 51.7 °C at 14:00, 45.0 °C at 14:30 and 39.0 °C at 16:00. The influence of atmospheric temperature change on the structural layers below the base was not obvious.
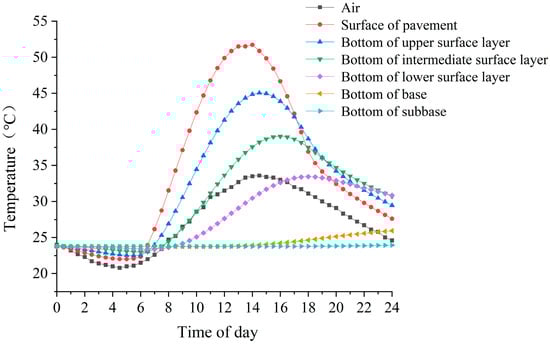
Figure 6.
Temperature variation of each structural layer of pavement during 24 h of 1 day.
3.2. Stress Analysis of BRT Asphalt Pavement Structure
Since the overall temperature of the BRT asphalt pavement at 14:00 was relatively high, to analyze the mechanical characteristics of the BRT asphalt pavement during the high-temperature season, the steady temperature field at 14:00 was introduced into the model to calculate the mechanical response of the asphalt pavement structure under a moving load. Since the loading time is 0.5 s, which is relatively short, it could be assumed that the temperature field did not change during the loading process. The maximum values of the mechanical responses at points A, B, C and D in Figure 2 were adopted as the calculation results for analysis. Figure 7, Figure 8, Figure 9, Figure 10, Figure 11, Figure 12, Figure 13, Figure 14 and Figure 15 show the stress response of the BRT asphalt pavement structure under a moving load based on the temperature field at 14:00. The vertical and horizontal stresses are positive in tension and negative in compression.
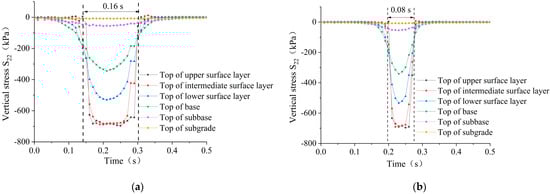
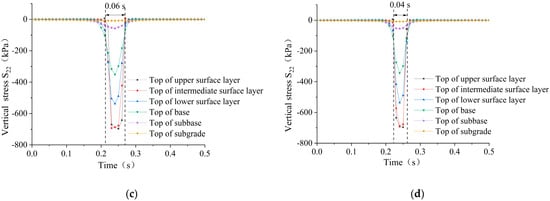
Figure 7.
Variation in vertical stress over time at initial speeds of (a) 10 km/h, (b) 20 km/h, (c) 30 km/h, and (d) 40 km/h.
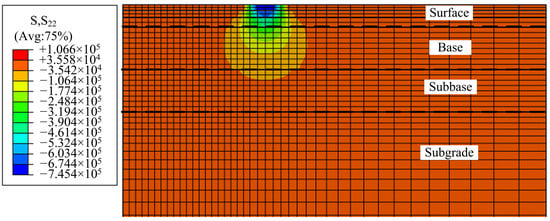
Figure 8.
Vertical stress in middle section when load moves over it at initial speed of 10 km/h.
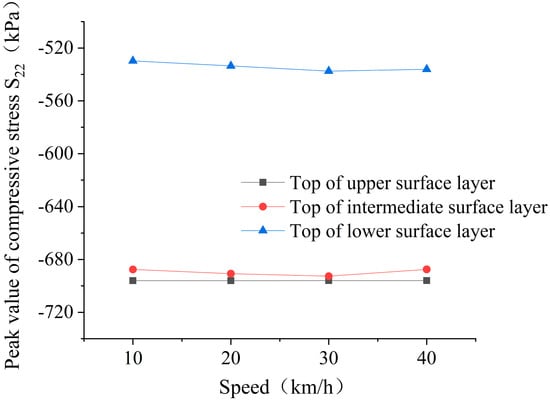
Figure 9.
Variation in peak value of vertical compressive stress with vehicle speed.
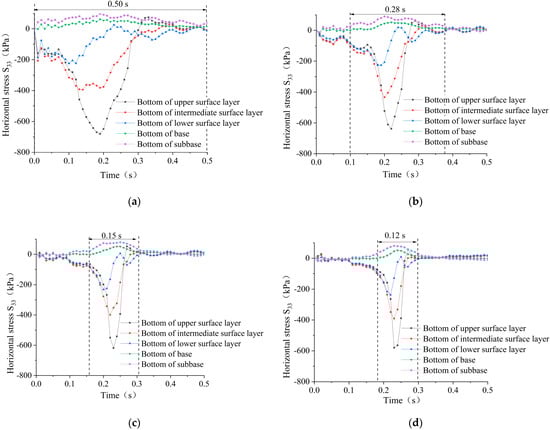
Figure 10.
Variation in horizontal stress over time at initial speeds of (a) 10 km/h, (b) 20 km/h, (c) 30 km/h, and (d) 40 km/h.
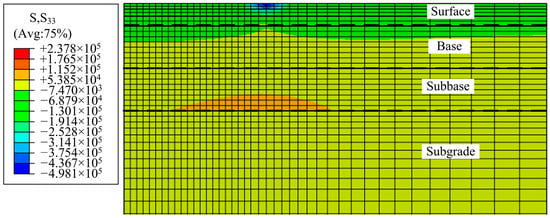
Figure 11.
Horizontal stress in middle section when load moves over it at initial speed of 10 km/h.
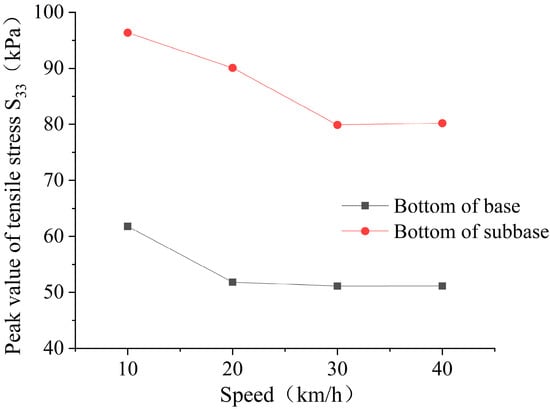
Figure 12.
Variation in peak value of longitudinal tensile stress with vehicle speed.
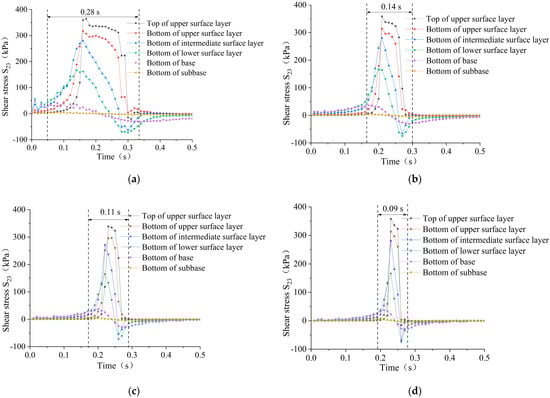
Figure 13.
Variation in shear stress over time at initial speeds of (a) 10 km/h, (b) 20 km/h, (c) 30 km/h, and (d) 40 km/h.

Figure 14.
Shear stress in middle section when load moves over it at initial speed of 10 km/h.
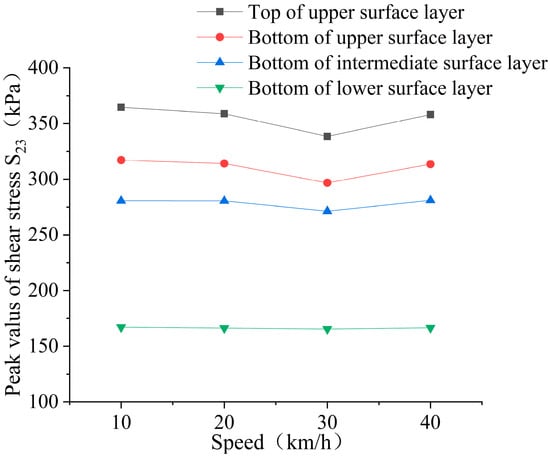
Figure 15.
Variation in peak value of shear stress with vehicle speed.
3.2.1. Vertical Stress
As shown in Figure 7, the pavement structure was in a vertical compression state during the load driving process. The compressive stress increased rapidly as the load approached the analysis point and then decreased rapidly and approached zero after a period of time near the peak value. The slower the initial loading velocity, the longer the duration of the compressive stress. The compressive stress duration was 0.16 s and 0.04 s at 10 km/h and 40 km/h, respectively, the latter being only 25% of the former. The upper, intermediate and lower surface layers were all subjected to high vertical compressive stress, while the vertical compressive stress of the soil foundation was almost zero, which can also be seen in Figure 8. Figure 8 shows the vertical stress in the middle section of the pavement model when the bus load moves over it at the initial speed of 10 km/h. The stress situation shows that the BRT asphalt pavement structure was prone to permanent deformation dominated by unstable rutting at high temperatures.
The peaks of the vertical compressive stress on the top surface of each layer of the asphalt mixture (i.e., upper, intermediate and lower surface layers) were compared. As shown in Figure 9, the speed slightly influenced the peak of the vertical compressive stress. When the speed was increased from 10 km/h to 20 km/h and then to 30 km/h, the peaks of the compressive stress of each structural layer gradually increased. When the speed was further increased from 30 to 40 km/h, the peaks of the compressive stress decreased.
3.2.2. Horizontal Stress
As shown in Figure 10 and Figure 11, the bottoms of the upper, intermediate and lower surface layers were basically compressed in the horizontal driving direction; however, the bottoms of the base and subbase were always under tension. It should be noted that the horizontal stress in Figure 11 was extracted when the bus load moved over the middle section at the initial speed of 10 km/h. It can be seen in Figure 10 that the slower the load speed, the more obvious the tensile stress fluctuation, and the longer the tensile stress lasted near its maximum, which was more unfavorable for the base and subbase. When the load speed was 10 km/h, the tensile stresses at the bottom of base and subbase were near the high value of the entire load driving process, which was 0.50 s. In contrast, when the load speed was 40 km/h, the duration of the high value of tensile stress was only 0.12 s, which was far less than when the load speed was 10 km/h. Because the tensile stress was always greater at the bottom of the subbase than at the bottom of the base, the possibility of fatigue cracking was greater at the bottom of the subbase than at the base.
The peaks of the tensile stress at the bottoms of the base and subbase were compared. As shown in Figure 12, the vehicle speed significantly impacted the peak tensile stress. Under the moving load, the peak tensile stress generally decreased at first and then increased. Notably, when the load speed was increased from 10 km/h to 20 km/h and then to 30 km/h, the tensile stress at the bottom of the base and subbase obviously decreased by 16.1% and 1.3% and by 6.5% and 11.3%, respectively. When the velocity was increased from 30 to 40 km/h, there was no obvious increase in the tensile stress at the bottom of the base and subbase.
3.2.3. Shear Stress
As shown in Figure 13, the variation in the shear stress over time was similar to that in the vertical stress. Notably, as the load approached the analysis point, the shear stress increased rapidly and then decreased rapidly and reversed after a period of time near the peak value. Under driving loads of 10, 20, 30 and 40 km/h, the duration of the shear stress on the pavement was 0.28, 0.14, 0.11 and 0.09 s, respectively. The slower the initial load speed, the longer the shear stress acted on the pavement structure, which was more likely to lead to shear failure. Although the whole pavement structure was subjected to shear stress, as shown in Figure 14, it can be seen from Figure 13 that the shear stresses of the upper, intermediate and lower surface layers were obviously greater than those of the base and subbase, which is an important reason for the shear failure of asphalt pavement at high temperatures. In the practical engineering of BRT asphalt pavement, special attention should be given to improving the shear resistance of pavement materials and strengthening the adhesion between surface layers.
The peaks of the shear stress of each surface layer were compared. As shown in Figure 15, the change in the shear stress peak with the vehicle speed was similar to that in the tensile stress peak. When the vehicle speed was increased from 10 to 30 km/h, the shear stress peak at each depth of the surface layer gradually decreased. However, when the vehicle speed was increased from 30 to 40 km/h, the shear stress peak increased. With increasing surface depth, the curve of the shear stress peak with the vehicle speed tended to become horizontal.
According to the analysis of Figure 7, Figure 8, Figure 9, Figure 10, Figure 11, Figure 12, Figure 13, Figure 14 and Figure 15, the duration and peak value of the mechanical response of the BRT asphalt pavement varied differently with vehicle speed. As the load speed increased from 10 to 40 km/h, the duration of the pavement stress became shorter, which was beneficial for the BRT asphalt pavement structure. Notably, regarding the duration of the mechanical response, 40 km/h was the optimal velocity for the Lanzhou BRT asphalt pavement. Moreover, the influence of the load speed on the stress peak was mainly reflected in the tensile stress and shear stress, which were the lowest at a speed of 30 km/h. This suggests that 30 km/h is the optimal velocity for the Lanzhou BRT asphalt pavement regarding the peak value of the mechanical response. Therefore, it is necessary to comprehensively consider the duration and peak value of mechanical response when researching the influence of driving speed on BRT asphalt pavement damage. In the high-temperature season, BRT operating speeds in the 30–40 km/h range can effectively delay the occurrence and development of fatigue cracking and shear failure of the base and subbase. Because the vertical compressive stress and shear stress of BRT asphalt pavement are relatively high, the permanent deformation of BRT pavement should be the key issue in the high-temperature season. The next analysis focuses on the permanent deformation of BRT asphalt pavement structure based on repeated loading.
3.3. Permanent Deformation Analysis of BRT Asphalt Pavement Structure
The deformation of asphalt pavement includes creep deformation and elastic deformation. Permanent deformation is severe road distress that is mainly caused by creep deformation [49]. In this analysis, the strain hardening creep model as shown in Equations (1) and (2) was applied to simulate permanent deformation. The high-temperature season of Lanzhou was considered to last 100 days, and the atmospheric temperatures during one day being listed in Table 3. The transient temperature field for each day, as shown in Figure 6, was introduced into the model to calculate the permanent deformation of the asphalt pavement structure under the influence of BRT vehicles. Repeated loading of BRT vehicles was simulated by replacing moving loads with static loads [43], in which the vertical load was 0.733 MPa and the horizontal coefficient was 0.5. Figure 16 shows the number of times the BRT vehicles passed a certain station in a day. Assuming that repeated and single loading processes, which have the same cumulative time, are equivalent, the cumulative action time of the load at the various vehicle speeds can be calculated with Equation (9):
where t denotes the cumulative action time of wheel load (s), N denotes the number of wheel load actions, P denotes the axle load of the vehicle (kN), nw denotes the number of wheels on the axle, p denotes the tire-ground stress (MPa), B denotes the tire grounding width (cm), and v denotes the speed of the vehicle (km/h).
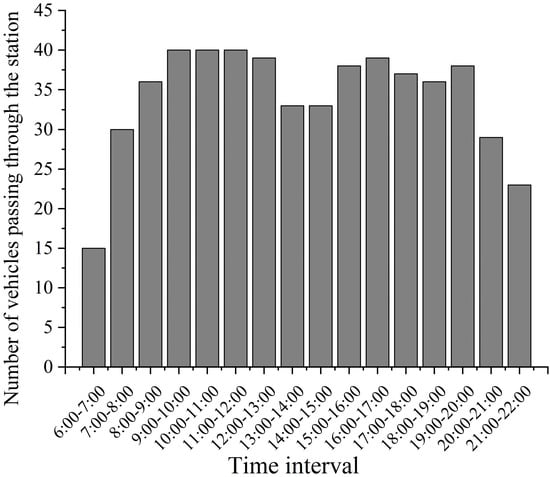
Figure 16.
Number of times BRT vehicles pass analysis station in 1 day.
The permanent vertical deformations of the road surface after repeated loading at the different vehicle speeds are shown in Figure 17.
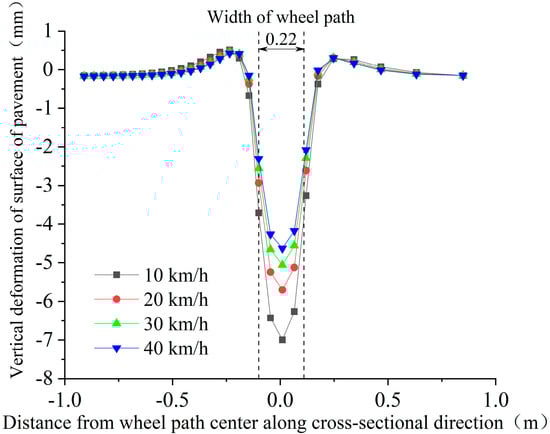
Figure 17.
Permanent vertical deformation of road surface in cross-sectional direction at different vehicle speeds.
Figure 17 shows that the surface of the road was deformed, including depression and uplift deformation, under the combined action of vertical and horizontal loads. The maximum depression deformation appeared in the center of the wheel stamp. Uplift deformation occurred on both sides of the wheel stamp, with the maximum value occurring at 0.135 m outside the wheel stamp. By adding the maximum values of depression and uplift deformation, the rut depth of the BRT asphalt pavement after 100 days of loading during the high-temperature season could be obtained. After repeated loads at 10, 20, 30 and 40 km/h, the calculated rut depth was 7.5, 6.2, 5.5 and 5.1 mm, respectively. With the speed increased from 10 km/h to 40 km/h, the rut depth decreased by 32%. The range of calculated rut value is basically consistent with the rut depth of the Lanzhou BRT asphalt pavement structure after one year of repaving.
The points in the pavement structure with the same horizontal position as the maximum values of depression and uplift deformation were defined as A and B, respectively. Figure 18 shows the variation in the permanent deformation at points A and B over time at different depths of the pavement.
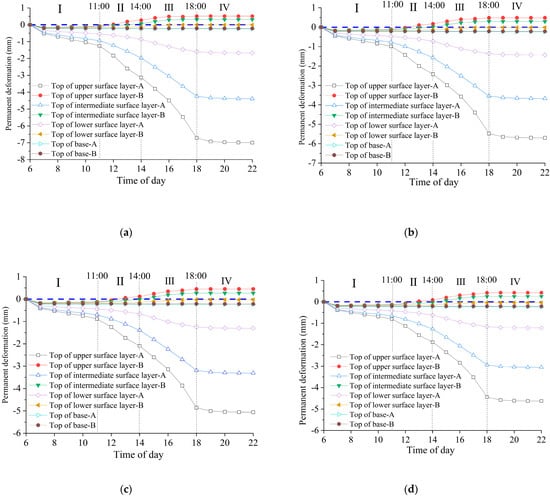
Figure 18.
Variation in permanent deformation of asphalt pavement over time at vehicle speeds of (a) 10 km/h, (b) 20 km/h, (c) 30 km/h, and (d) 40 km/h.
As shown in Figure 18, the development of permanent deformation was similar for different BRT speeds. Permanent deformation mainly occurred in the surface layers, and the deformation value below the base layer was close to 0. The development of permanent deformation during one day could be divided into 4 phases. Phase I was from 6:00 to 11:00. During this period, although the frequency of BRT vehicles gradually increased, the pavement temperature did not rise, and thus the deformation at each depth of the pavement increased slowly; compact depression deformation occurred. Phase II was from 11:00 to 14:00, with a rapid increase in asphalt pavement temperature as shown in Figure 6. The depression deformation at each depth of pavement obviously accelerated, and uplift deformation of the road surface began to appear. This showed that the asphalt mixture began to flow and rearrange under the comprehensive action of compressive stress and shear stress. Phase III was from 14:00 to 18:00, and although the atmospheric temperature gradually decreased after 14:00, the temperature below the road surface was still rising due to the lag of the internal temperature change of the pavement structure. Thus, the deformation developed fastest during this period, and the uplift deformation of each structural layer reached the maximum. Phase IV occurred after 18:00, and the temperature of the pavement structure gradually decreased during this phase. Although the frequency of BRT loads was still large, as shown in Figure 16, the deformation of each structural layer of pavement tended to be stable. Temperature had a greater impact than the frequency of BRT vehicles on permanent deformation of pavement. Reducing the sensitivity of pavement at high temperatures will effectively improve the resistance of asphalt pavement to rutting.
Figure 19 shows the permanent deformation of the upper, intermediate and lower surface layers, obtained by subtracting the value of the permanent deformation at the bottom of each structural layer from the value of the permanent deformation at the top of the same structural layer. The figure shows that the depression and uplift deformation of the upper, intermediate and lower surface layers decreased with increasing speed. The values of the depression and uplift deformation of the intermediate surface layer were the largest at different driving speeds. This showed that to delay the occurrence of rutting, special attention should be given to the ability of the intermediate surface layer to resist deformation while reasonably increasing the speed.
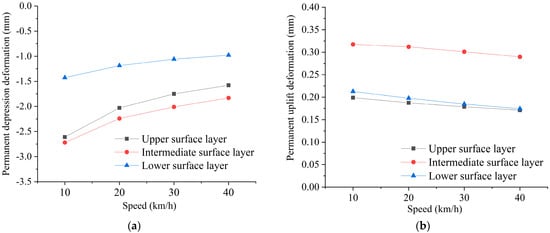
Figure 19.
Variation in permanent deformation of each structural layer with vehicle speed: (a) depression deformation; (b) uplift deformation.
4. Conclusions
- (1)
- BRT asphalt pavement structures are prone to permanent deformation, mainly unstable rutting, during the high-temperature season. The results of this study showed that the possibility of cracking was greater at the bottom of the subbase than at the base, and when the load speed was increased from 10 km/h to 20 km/h and then to 30 km/h, the tensile stress at the bottom of the base and the subbase decreased by 16.1% and 1.3% and by 6.5% and 11.3%.
- (2)
- The lower the initial speed of the BRT vehicle, the longer the duration of the vertical compressive stress, tensile stress of the bottom of the layer and shear stress, and the more unfavorable the conditions for the asphalt pavement structure. Considering the duration and peak value of the mechanical response, controlling the BRT operating speed within the 30–40 km/h range could effectively reduce the occurrence and development of permanent deformation of asphalt pavement structures and fatigue cracking and shear failure of the base and subbase.
- (3)
- During the high-temperature season, the development of permanent deformation of the BRT asphalt pavement structure occurred in four phases: compaction, flow and rearrangement, accelerated accumulation, and stability. Permanent deformation of the BRT asphalt pavement structure mainly occurred from 11:00 to 18:00. Compared to the frequency of BRT vehicles, temperature had a greater influence on the permanent deformation of asphalt pavement. Reducing the sensitivity of pavement to high temperatures could effectively improve the ability of asphalt pavement to resist rutting.
- (4)
- The depression and uplift deformation values of the upper, intermediate and lower layers decreased with increasing vehicle speed, and the deformation values of the intermediate layer were the largest at the different driving speeds. When the speed increased from 10 km/h to 40 km/h, the rut depth decreased by 32%. To delay the initiation and development of rutting, special attention should be given to the ability of the intermediate layer to resist deformation while reasonably increasing the vehicle speed.
In addition to the above conclusions, more in-depth studies are suggested, focusing on the mechanical characteristics of BRT asphalt pavement structures in low temperatures. It is recommended that further investigation through the use of pilot road sections and periodical performance assessment be carried out before the results are made directly applicable to practitioners.
Author Contributions
Conceptualization, Y.W.; methodology, Y.Z.; validation, Y.W.; writing—original draft preparation, Y.W.; writing—review and editing, Y.Z.; visualization, Y.W. All authors have read and agreed to the published version of the manuscript.
Funding
This study was supported by the Science and Technology Planning Project of Gansu Province (20JR10RA261) and the Young Scholars Science Foundation of Lanzhou Jiaotong University (2018013).
Institutional Review Board Statement
Not applicable.
Informed Consent Statement
Not applicable.
Acknowledgments
Special thanks are due to Jiachen Lin from China Railway Design Corporation for contributing to the software and formal analysis.
Conflicts of Interest
The authors declare no conflict of interest.
References
- Deng, T.; Nelson, J.D. Recent developments in bus rapid transit: A review of the literature. Transp. Rev. 2011, 31, 69–96. [Google Scholar] [CrossRef]
- Vincent, W.; Jerram, L.C. The potential for bus rapid transit to reduce transportation-related CO2 emissions. J. Public Transp. 2006, 9, 12. [Google Scholar] [CrossRef]
- Bocarejo, J.P.; Velasquez, J.M.; Díaz, C.A.; Tafur, L.E. Impact of bus rapid transit systems on road safety: Lessons from Bogotá, Colombia. Transp. Res. Rec. 2012, 2317, 1–7. [Google Scholar] [CrossRef]
- Hensher, D.A.; Golob, T.F. Bus rapid transit systems: A comparative assessment. Transportation 2008, 35, 501–518. [Google Scholar] [CrossRef]
- Puchalsky, C.M. Comparison of emissions from light rail transit and bus rapid transit. Transp. Res. Rec. 2005, 1927, 31–37. [Google Scholar] [CrossRef]
- Zhang, X.J.; Qiu, Y.J.; Zhang, X.H. Treatment of steel deck pavement distresses at BRT bus station. J. Railw. Sci. Eng. 2018, 15, 2263–2269. [Google Scholar]
- Zhang, X.J.; Zhang, X.H. Asphalt materials used in treatment of pavement distresses at the BRT bus station. HKIE Trans. Hong Kong Inst. Eng. 2018, 25, 67–73. [Google Scholar] [CrossRef]
- Izaks, R.; Rathore, M.; Haritonovs, V.; Zaumanis, M. Performance properties of high modulus asphalt concrete containing high reclaimed asphalt content and polymer modified binder. Int. J. Pavement Eng. 2022, 23, 2255–2264. [Google Scholar] [CrossRef]
- Xiong, H.; Han, J.F.; Wang, J.; Ren, Q.; Wu, L.B. Application of high viscosity-high modulus modified asphalt concrete in bus rapid transit station pavement—A case study in Chengdu, China. Case Stud. Constr. Mater. 2022, 17, e01337. [Google Scholar] [CrossRef]
- Mirzaei, P.A. Recent challenges in modeling of urban heat island. Sustain Cities Soc. 2015, 19, 200–206. [Google Scholar] [CrossRef]
- Qin, Y. A review on the development of cool pavements to mitigate urban heat island effect. Renew. Sustain. Energ. Rev. 2015, 52, 445–459. [Google Scholar] [CrossRef]
- Mohajerani, A.; Bakaric, J.; Jeffrey-Bailey, T. The urban heat island effect, its causes, and mitigation, with reference to the thermal properties of asphalt concrete. J. Environ. Manag. 2017, 197, 522–538. [Google Scholar] [CrossRef] [PubMed]
- Lin, T.P.; Ho, Y.F.; Huang, Y.S. Seasonal effect of pavement on outdoor thermal environments in subtropical Taiwan. Build. Environ. 2007, 42, 4124–4131. [Google Scholar] [CrossRef]
- Mills, B.; Tighe, S.; Andrey, J.; Smith, J.; Huen, K. Climate change implications for flexible pavement design and performance in southern Canada. J. Transp. Eng. 2009, 135, 773–782. [Google Scholar] [CrossRef]
- Qin, Y.; Zhang, X.; Tan, K.; Wang, J. A review on the influencing factors of pavement surface temperature. Environ. Sci. Pollut. Res. 2022, 29, 67659–67674. [Google Scholar] [CrossRef]
- Fujimoto, A.; Tokunaga, R.; Kiriishi, M.; Kawabata, Y.; Takahashi, N.; Ishida, T.; Fukuhara, T. A road surface freezing model using heat, water and salt balance and its validation by field experiments. Cold Reg. Sci. Technol. 2014, 106, 1–10. [Google Scholar] [CrossRef]
- Islam, M.R.; Ahsan, S.; Tarefder, R.A. Modeling temperature profile of hot-mix asphalt in flexible pavement. Int. J. Pavement Res. Technol. 2015, 8, 47. [Google Scholar]
- Chen, J.; Luo, S.; Li, L.; Dan, H.; Zhao, L. Temperature distribution and method-experience prediction model of asphalt pavement. J. Cent. South Univ. Sci. Technol. 2013, 44, 1647–1656. [Google Scholar]
- Chen, J.; Wang, H.; Xie, P. Pavement temperature prediction: Theoretical models and critical affecting factors. Appl. Therm. Eng. 2019, 158, 113755. [Google Scholar] [CrossRef]
- Adwan, I.; Milad, A.; Memon, Z.A.; Widyatmoko, I.; Ahmat Zanuri, N.; Memon, N.A.; Yusoff, N.I.M. Asphalt Pavement Temperature Prediction Models: A Review. Appl. Sci. 2021, 11, 3794. [Google Scholar] [CrossRef]
- Mohd Hasan, M.R.; Hiller, J.E.; You, Z. Effects of mean annual temperature and mean annual precipitation on the performance of flexible pavement using ME design. Int. J. Pavement Eng. 2016, 17, 647–658. [Google Scholar] [CrossRef]
- Zhou, X.Y.; Wang, X.D.; Guan, W.; Xiao, Q. Analysis on response behavior of asphalt pavement structure in wide temperature range. J. Harbin Inst. Technol. 2020, 52, 63–69. [Google Scholar]
- Sarkar, A.; Norouzi, R. Evaluating curling stress of continuous reinforced concrete pavement. ACI Struct. J. 2020, 117, 53–62. [Google Scholar] [CrossRef]
- Yu, M. Study on Temperature Field of Urban Road Pavement and Its Impact on Near-Surface Atmospheric Temperature. Master’s Thesis, Chang’an University, Xi’an, China, 2019. [Google Scholar]
- Maeso-González, E.; Pérez-Cerón, P. State of art of bus rapid transit transportation. Eur. Transp. Res. Rev. 2014, 6, 149–156. [Google Scholar] [CrossRef]
- CCCC Road and Bridge Consultants Co., Ltd. JTG D50-2017 Specification for Design of Highway Asphalt Pavement; China Communications Press: Beijing, China, 2017; pp. 12–20, 31–33. [Google Scholar]
- CCCC Highway Consultants Co., Ltd. JTG D40-2011 Specification for Design of Highway Cement Concrete Pavement; China Communications Press: Beijing, China, 2011; pp. 35–38. [Google Scholar]
- Cheng, H.; Liu, L.P.; Sun, L.J.; Li, Y.; Hu, Y. Comparative analysis of strain-pulse-based loading frequencies for three types of asphalt pavements via field tests with moving truck axle loading. Constr. Build. Mater. 2020, 247, 118519. [Google Scholar] [CrossRef]
- Hsing, C.H.; Siao, J.H.; Wang, Y.M. A study on the design depth of permeable road pavement through dynamic load experiment. Materials 2022, 15, 4391. [Google Scholar] [CrossRef]
- Wang, H.; Li, M.Y. Comparative study of asphalt pavement responses under fwd and moving vehicular loading. J. Transp. Eng. 2016, 142, 04016069. [Google Scholar] [CrossRef]
- Zhao, J.N.; Wang, H. Dynamic Pavement Response Analysis under Moving Truck Loads with Random Amplitudes. J. Transp. Eng. Part B Pavements 2020, 146, 04020020. [Google Scholar] [CrossRef]
- Zhang, M.M.; Zhang, J.L.; Gong, H.G.; Jia, X.Y.; Xiao, R.; Huang, H.M.; Huang, B.S. Numerical investigation of pavement responses under TSD and FWD loading. Constr. Build. Mater. 2022, 318, 126014. [Google Scholar] [CrossRef]
- Assogba, O.C.; Sun, Z.; Tan, Y.; Nonde, L. Finite-element simulation of instrumented asphalt pavement response under moving vehicular load. Int. J. Geomech. 2020, 20, 04020006. [Google Scholar] [CrossRef]
- Wang, H.; Zhao, J.N. Mechanistic-empirical analysis of asphalt pavement fatigue cracking under vehicular dynamic loads. Constr. Build. Mater. 2021, 284, 122877. [Google Scholar]
- Selsa, Z.; Karakas, A.S.; Sayin, B. Effect of pavement thickness on stress distribution in asphalt pavements under traffic loads. Case Stud. Constr. Mater. 2022, 16, e01107. [Google Scholar]
- Zhang, D.; Wu, C.; Cai, L.; Bian, J.; Yin, C. Discrete Element Modeling of the Meso-Mechanical Response of Asphalt Pavement under Vehicle Load. Materials 2022, 15, 7808. [Google Scholar] [CrossRef] [PubMed]
- Wang, H.; Al-Qadi, I.L. The combined effect of moving wheel loading and three-dimensional contact stresses on perpetual pavement responses. Transp. Res. Rec. 2009, 2095, 53–61. [Google Scholar] [CrossRef]
- Dong, Z.J.; Tan, Y.Q.; Qu, J.P. Dynamic response analysis of asphalt pavement underthree-directional nonuniform moving load. China Civ. Eng. J. 2013, 46, 122–129. [Google Scholar]
- Huang, Z.Y.; Chen, Y.W.; Yan, K.Z. Dynamic Response of Viscoelastic Asphalt Pavement under Non-uniform Moving Load. J. Chongqing Jiaotong Univ. Nat. Sci. 2017, 36, 30–35+53. [Google Scholar]
- Hajj, E.Y.; Batioja-Alvarez, D.; Siddharthan, R. Assessment of pavement damage from bus rapid transit: Case study for Nevada. Transp. Res. Rec. 2016, 2591, 70–79. [Google Scholar] [CrossRef]
- Sousa, J.; Lysmer, J.; Monismtte, C.L. Eyelets of dynamic loads on performance of asphalt concrete pavements. J. Transp. Res. Rec. 1998, 13, 15–28. [Google Scholar]
- White, T.D.; Zaghloul, S.M. Pavement analysis for moving aircraft load. J. Transp. Eng. 1997, 123, 436–446. [Google Scholar] [CrossRef]
- Liao, G.Y.; Huang, X.Y. Application of ABAQUS Finite Element Software in Road Engineering, 2nd ed.; Southeast University Press: Nanjing, China, 2014; pp. 204–205. [Google Scholar]
- Si, C.D.; Cao, H.; Chen, E.L.; You, Z.P.; Tian, R.L.; Zhang, R.; Gao, J.F. Dynamic response analysis of rutting resistance performance of high modulus asphalt concrete pavement. Appl. Sci. 2018, 8, 2701. [Google Scholar] [CrossRef]
- Shan, J.S.; Guo, Z.Y. Predictive method of temperature field in asphalt pavement. J. Jiangsu Univ. Nat. Sci. Ed. 2013, 34, 594–598. [Google Scholar]
- Huang, Y.H. Pavement Analysis and Design, 2nd ed.; Pearson Prentice Hall: Hoboken, NJ, USA, 2012; pp. 27–29. [Google Scholar]
- Qian, Z.D.; Yang, Y.M.; Chen, T.J.; Li, Z. Dynamic response of asphalt pavement under moving loads with low and variable speed. J. Cent. South Univ. 2015, 46, 1140–1146. [Google Scholar]
- Sun, L.J. Structural Behavior Study for Asphalt Pavements; China Communications Press: Beijing, China, 2005; pp. 85–88. [Google Scholar]
- Li, H.; Huang, X.M. Analysis of Analysis of asphalt rutting based on continuous temperature variation. J. Southeast Univ. 2007, 37, 916–920. [Google Scholar]
Disclaimer/Publisher’s Note: The statements, opinions and data contained in all publications are solely those of the individual author(s) and contributor(s) and not of MDPI and/or the editor(s). MDPI and/or the editor(s) disclaim responsibility for any injury to people or property resulting from any ideas, methods, instructions or products referred to in the content. |
© 2023 by the authors. Licensee MDPI, Basel, Switzerland. This article is an open access article distributed under the terms and conditions of the Creative Commons Attribution (CC BY) license (https://creativecommons.org/licenses/by/4.0/).