Abstract
The efficiency of simultaneous treatment of the cold atmospheric pressure plasma jet (CAP) and hydrogen peroxide (H2O2) was investigated. A CAP with a thin and long plume was generated with Ar gas and applied to a common oral bacterium, Enterococcus faecalis (E. faecalis). The bactericidal efficiency was evaluated with the electron microscopy and the colony forming unit (CFU) assay. The underlying mechanisms were studied by measuring extracellular chemical changes in the water solution and by measuring biological responses such as the trans-membrane potential, the intracellular oxidative stress, and the membrane permeability. The combination of CAP with H2O2 could provide dramatic synergistic effects in bacterial disinfection through the enhanced membrane transportation of reactive species and the oxidation of intracellular molecules. Since the byproducts of both H2O2 and CAP are not significantly toxic, the synergistic bactericidal effects of their combination could be a good candidate to clinical applications.
1. Introduction
Hydrogen peroxide (H2O2) is extensively used as a biocide, particularly in applications where its decomposition into non-toxic by-products is important such as food and medical instruments [1]. The peroxide bond is unstable, so H2O2 in low concentration is easily decomposed to water and oxygen [2]. The bactericidal effect becomes stronger with the increase in H2O2 concentration, but it can irritate the skin or eyes and damage some materials [3]. A solution of 3% or less H2O2 is widely used in wound disinfection and dental care [4,5]. However, it is a mild disinfectant, so the inactivation potential of H2O2 was insufficient in some cases to ensure food or medical safety [6,7].
In order to increase the sterilizing power of this H2O2, a combination with other mild technologies has been attempted [8,9]. The combination with the cold atmospheric pressure plasma (CAP) is one such attempt. CAP is a specific type of non-thermal atmospheric pressure plasmas at effluent temperatures acceptable for heat sensitive specimens. It is a partly ionized gas, which is made up of atoms, molecules, free electrons, ions, UV irradiation, and reactive species such as reactive oxygen/nitrogen species (RONS) including ozone. CAP is divided into dielectric barrier discharge (DBD) and Jet types by electrode structures. In DBD, plasma is localized at the vicinity of the electrodes, and the excited gas mass is diffused or delivered to the surface. In Jet, the plasma plume emitting light from excited molecules is directly exposed to the sample. Combination of H2O2 with DBD has been tried, and the results showed enhanced disinfection efficiency on dried bacteria and biofilms [10,11]. In both cases, authors assumed the generation of hydroxyl radical (OH·) radicals from H2O2. Combination with Jet type CAP has not yet been studied, but it is expected that the OH· radical generation rate would be higher.
Jet type CAP has been attracting attention as a suitable tool for disinfection of exposed body parts such as surface treatment. The Leibniz Institute for Plasma Science and Technology (INP) group has been intensively researching the bactericidal power and the effect on treatment recovery in the treatment of chronic wounds, and it has been shown to be effective in the treatment of skin cancer [12,13]. However, in the case of a plasma jet, it takes a long time to treat a large area because the application area is narrow. Therefore, a method for efficiently sterilizing in a short time while directly contacting the plum is required. The combination of H2O2 and jet type is expected to increase efficiency in terms of time and sterilization power by adding a plasma effect to the effect of the existing disinfectant.
In this study, we used less than 3% H2O2 and CAP simultaneously. CAP has a thin and long plume, and the combination of H2O2 and CAP was applied to E. faecalis homogenate in aqueous solutions and gels. E. faecalis has been reported as a main cause for the persistent oral infections [14,15]. The bactericidal efficiency was evaluated with the electron microscopy and the colony forming unit (CFU) assay.
The aim of this study was to investigate the efficiency of simultaneous treatment of Jet type CAP and hydrogen peroxide (H2O2) for bacterial disinfection. The underlying mechanisms were studied by measuring extracellular chemical changes in the water solution and by measuring biological changes such as the trans-membrane potential, the intracellular oxidative stress, and the membrane permeability.
2. Materials and Methods
2.1. Cold Atmospheric Pressure Plasma Jet Device
A medical syringe needle was inserted inside the quartz tube, and the tube was wrapped with a copper pad as shown in Figure 1a. Alternative sine wave electricity with a frequency of 60 kHz and voltage of 1 kVrms (DPO4034 and P6015 A, Tektronix, Beaverton, OR, USA) was directly applied to the needle, and the copper pad was grounded. Ar gas (99.99%) was inserted through the syringe needle into the quartz tube. The length of the ground electrode was optimized experimentally as 100 mm to make a plume long, and the length of the quartz tube to the end was optimized as 10 mm. The flow rate was selected as 0.3 L/min to ensure a Reynolds number 2000, which has been reported to be the best value for increasing the plume length [16]. The discharge current was 15 mA, and the gas temperature was about 30 °C at 15 mm distance. Samples were placed below 15 mm from the end of quartz tube in all the experiments.
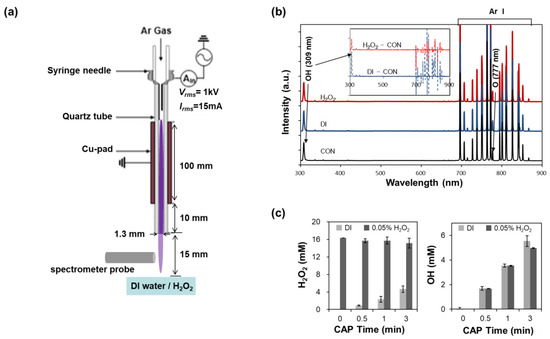
Figure 1.
Schematics and OES of the CAP; (a) The Ar plasma plume is generated between a syringe needle and Cu-pad and ejected from the quartz tube; (b) OES of the CAP plume in the range of 200–900 nm when plume was ejected to dry air (‘CON’), to water surface (‘DI’), and to 1% H2O2 surface (‘H2O2′). Inlet graphs show the differences in OES intensities between H2O2 or DI and CON; (c) Measurements of (a) OH· and H2O2 in the CAP treated DI or 0.05% H2O2 solution according to exposure time.
The reactive species generated from the CAP were measured by analyzing the optical spectra of the plasma plume. An optical fiber (R400-7-UV-VIS, Ocean Optics) was placed normally at a distance of 5 mm from the plasma plume. The spectra were measured using a spectrometer (HR4000CG-UV-NIR, Ocean Optics) having a resolution of 0.75 to 1.00 nm and a detection range of 200–1100 nm. The acquisition was triplicated and averaged. A petri dish was placed 15 mm below the tube. The ‘CON’ experiment was executed with an empty petridish; the ‘DI’ was executed with 1 mL deionized (DI) water; and the ‘H2O2′ was executed with 1 mL 1% H2O2. Figure 1b shows the optical emission spectrum (OES) of CAP with Ar gas. Most peaks were from excited Ar molecules (between 700 and 900 nm), and OH· (309 nm) and O (777 and 844 nm) emission lines were also found.
2.2. Measurements of Chemical Properties of Plasma Treated Solutions
The concentrations of OH·, H2O2, and NOx in CAP treated DI water were chemically measured. DI water with a volume of 300 μL was placed in a 1.5 mL Eppendorf tube (033508, Eppendorf, Hamburg, Germany) and treated by CAP at a distance of 1.5 cm from the end of the quartz tube. The evaporation of water was compensated after CAP treatment by weight. The amount of H2O2 was measured using the Amplex® Red Hydrogen Peroxide Assay Kit (A22188, Thermo Fisher Scientific, Waltham, MA, USA); the OH· radical was measured using terephthalic acid (T2304, Sigma-Aldrich, Burlington, MA, USA) and hydroxy terephthalic acid (752525, Sigma-Aldrich, Burlington, MA, USA); and NOx was measured using a colorimetric nitric oxide assay kit (K262-200, Biovision, Milpitas, CA, USA) following the manufacturer’s protocols. The fluorescence of Amplex red was measured with a filter set of 520/600 nm, and that of hydroxyl terephthalic acid was measured with a filter set of 360/440 nm. The absorbance of nitric oxide assay is measured at 540 nm. The solutions were placed in a black 96 well plate (3603, Corning, NY, USA), and optical signals were measured using a plate reader (Synergy HT, BioTek, Winooski, VT, USA). The same measurements were performed with 16 mM H2O2 solution. To evaluate slight changes in H2O2 solution with CAP application, we used a low concentration of H2O2 (0.05%, 16 mM). The pH values of plasma treated solutions were evaluated using a pH meter (Orion 3-Star, Thermo Fisher Scientific, Waltham, MA, USA).
2.3. Bacterial Liquid Culture and CAP Treatment on Suspension
E. faecalis was provided by the Korean Collection for Oral Microbiology (KCOM 1083). E. faecalis was incubated in a brain–heart infusion medium (BHI; 237500, BD, Hampton, NJ, USA) at 37 °C with shaking under anaerobic conditions (Anaeropack A04, MGC). The suspension was diluted for OD600 to be 2.0, and 300 μL of the suspension were placed in a 1.5 mL Eppendorf tube for CAP treatment. The evaporated water was compensated after treatment by weight after CAP treatment for 0.5–5 min. For the H2O2 only sample, bacteria were incubated in H2O2 solutions for 5 min, and for combination treatment cells were suspended in H2O2 solutions during CAP treatment. The bacterial suspension was serially diluted and spread on a BHI-agar plate for a CFU test. Then, CFU values were evaluated after 24 h incubation at 37 °C. In order to test OH· radical scavenger, bacteria were pre-incubated in 40 μM mannitol for 10 min before treatment. Mannitol was purchased from Sigma.
2.4. Scanning Electron Microscopy
The bacteria were fixed in glutaraldehyde (2.5% in PBS; PAA Laboratories, Toronto, ON, Canada) for 4 h and in 1% osmium tetroxide for 1 h, sequentially. After washing with DPBS (LB001-02, Welgene, Gyeongsan-si, Gyeongsangbuk-do, Korea), the specimens were dehydrated in sequential ethanol series. Centrifugation was performed at 3000 rpm for 5 min between steps. Lastly, the samples were dehydrated in 100% ethanol for 10 min three times, dropped on the carbon tape, and dried in a vacuum. The samples were mounted on stubs, coated with Pt, and observed with a field emission-scanning electron microscope (FE-SEM 7201F, Jeol, Tokyo, Japan).
2.5. Measurements of Intracellular Properties
For measurements of intracellular properties, 300 μL E. faecalis suspension with OD600 2.0 were treated with CAP, and after 5 min incubation at room temperature cells were stained by assay kits. We chose 1.0% H2O2, 45 s CAP treatment, and combination treatment as sublethal conditions.
The amount of malondialdehyde (MDA) was quantified by the OxiSelectTM TBARS Assay Kit (STA-330, Cell Biolabs, Inc., San Diego, CA, USA) following the manufacturer’s protocol. In order to extract whole lipid from microbes, microbe suspension was treated with ultrasound for 1 min in ice (Vibra-Cell, Sonics and Materials, Inc., Newtown, CT, USA). The amount of MDA (nmol) was measured by spectrophotometer (Synergy-HT, BioTek, Winooski, VT, USA).
The relative amount of intracellular ROS was measured by using 2′,7′-dichlorodihydrofluorescein diacetate (H2DCFDA; D399, Thermo Fisher Scientific, Waltham, MA, USA). Immediately after CAP treatment, cells were incubated with 10 μM H2DCFDA solution for 20 min, washed with DPBS solution 3 times, and incubated in DPBS for next 20 min. Then, re-suspended cells were analyzed by flow cytometry (BD FACS Verse, BD Biosciences, Franklin Lakes, NJ, USA). The amount of intracellular ROS was averaged and expressed as a relative value to the level of untreated controls.
The intensity of intracellular propidium iodide (PI) dye per a cell was measured by flow cytometry. Cells were treated with CAP in the 50 μM PI solution, incubated for 5 min at room temperature, and washed with DPBS for 5 times. Then resuspended cells were flowed through the flow cytometry (BD FACS Verse, BD Biosciences, Franklin Lakes, NJ, USA), and the mean fluorescence intensity (MFI) of each group was expressed relatively to the control.
The DNA breakage of the cells was measured by using anti-8 hydroxyguanosine antibody-FITC (ab183393, Abcam, Cambridge, UK). CAP -treated cells were fixed with 4% paraformaldehyde at room temperature for 10 min, washed with DPBS three times, permeabilized by 0.1% Triton X-100 for 10 min, washed with DPBS three times, blocked with 1% BSA at room temperature for 30 min, and stained with 5 μg/mL dye for 1 h at room temperature. After washing with DPBS, the fluorescence per a cell was measured by flow cytometry (BD FACS Verse, BD Biosciences, Franklin Lakes, NJ, USA). The mean MFI of each group was expressed relatively to the control.
The cytoplasmic trans-membrane potential was measured by using FLIPR. Immediately after CAP treatment, cells were incubated with FLIPR membrane potential dye (The FLIPR® Membrane Potential Assay Kits, Molecular Devices, San Jose, CA, USA) for 30 min, and the fluorescence was measured by flow cytometry (BD FACS Verse, BD Biosciences, Franklin Lakes, NJ, USA) without washing. The MFI of each group was expressed relatively to the control.
2.6. Bacterial Inoculation in Agarose Gel and CAP Treatment
To visualize the bactericidal effects of CAP in a tissue, agarose gel was utilized for easy molding. Agarose with low gelling temperature (A9414, Sigma-Aldrich, Burlington, MA, USA) was made as 6% gel solution and mixed with one volume of E. faecalis bacterial solution. The mixture was put in 2 mL Eppendorf tube and gelated in the ice. During gelation, a syringe needle whose outer diameter was 0.9 mm was put inside gel to mold a thin and deep hole for pointing the CAP treatment center and easy manipulation. The end of the quartz tube was located above 1.5 mm from the gel, and CAP was applied for 1 min. To investigate the effects of H2O2, the gel was put inside H2O2 for 5 min before CAP treatment. Solutions of 0.5% and 1.0% H2O2 were used, which were sublethal and lethal conditions in vitro, respectively. Then, the gel was cut perpendicularly to the hole at depths of 2, 5, and 7 mm from the top where the CAP contact position was. The part of gel was stained with Live/Dead bactolight staining kit (L7012, Thermo Fisher Scientific), and the cross-section was observed by using fluorescence microscopy (Ti-U Eclipse, Nikon, Tokyo, Japan).
2.7. Statistical Analysis
All the experiments were repeated at least three times, and the data are expressed as the mean and standard deviation (SD). Statistical significance was evaluated using unpaired Student’s t-tests (two-tailed, equal SD) with Microsoft Excel, where * and ** indicate p-values of <0.05 and <0.01, respectively, compared to the non-treated control value, and # represents a p-value compared with the other group.
3. Results
3.1. Intra- and Extra-Microbial OH· and H2O2 after CAP Treatment with H2O2
The synergistic effects of H2O2 with CAP are thought to be attributed to the newly generated molecules from H2O2 in contact with CAP. For example, an OH· radical can be a strong candidate for enhanced bactericidal efficiency, since it can be formed easily from H2O2. At first, we tried to find the highly generated OES peaks right above the surface of the 1% H2O2 solution when CAP was applied (Figure 1b). The height of most peaks increases on liquids in comparison with those on the dry plate. The peaks at 309 nm (OH·∙radical) and 763 nm (excited Ar) were enhanced above both surfaces of deionized (DI) water and H2O2, but the peaks at 777 nm and 884 nm (O atom) were not affected by the solutions. We could not find big differences in OES from the gas above the CAP irradiated solutions.
At second, we tried to evaluate the generation of OH· radicals in a liquid environment. We assessed the amounts of H2O2 and OH· radicals in solutions after CAP treatment (Figure 1c). When CAP was applied on DI water, the amount of generated OH· and H2O2 increased with treatment time and reached 5.5 mM and 4.6 mM after 5 min of treatment, respectively (Figure 1c). In the case of nitrate and nitrite, the concentrations were very low, as expected from the OES, which was measured to be around 80 μM after 5 min of CAP treatment. On the contrary, H2O2 was slightly decreased in the 0.05% H2O2 solution with the increase in CAP treatment time. The decrease in H2O2 in H2O2 solution means that the more amount of H2O2 might be dissociated than the newly generated H2O2 by CAP in the 0.05% H2O2 solution. Contrary to our expectations, the measured amounts of OH· radicals were not significantly different in the two solutions.
Additionally, we measured the amount of extracellular OH· and H2O2 when bacteria were present in solutions during CAP treatment. Figure 2a shows that the measured amounts of OH· were not affected by the presence of bacterial cells. However, a significant difference in the amount of H2O2 was observed when bacteria were present in the 0.05% H2O2 solution as shown in Figure 2a. About 3 mM (0.009%) H2O2 disappeared when there were bacterial cells. These results imply that the CAP-induced dissociation of H2O2 may not be related to the OH· radical generation, and the induced cytotoxicity by combined treatment may be attributed to the action of H2O2 itself on cells.
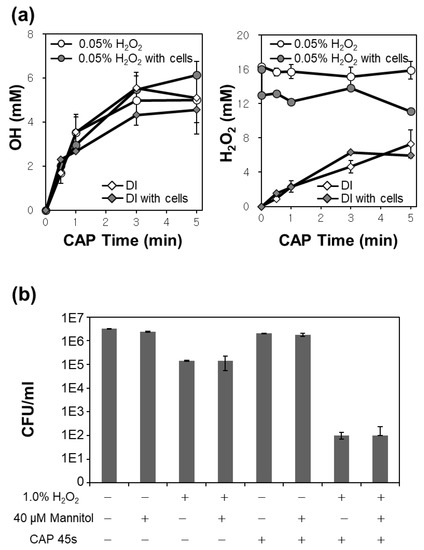
Figure 2.
(a,b) Measurements of (a) OH· and H2O2 in the CAP treated DI or 0.05% H2O2 solution according to exposure time with and without bacteria; (b) CFU tests of E. faecalis with combinations of H2O2, mannitol, or CAP. The notations ‘+’ and ‘−’ mean the condition with and without each treatment, respectively.
To confirm the role of the OH· radical in the synergistic bactericidal effects, 40 μM OH· specific scavenger mannitol was used in a CFU test. Figure 2b shows the CFU of E. faecalis in DI and 1% H2O2 solution with and without CAP treatment for 45 s. Graphs show that the addition of OH· scavenger mannitol did not affect CFU values in all the cases. This demonstrates that OH· radical did not play a key role in the synergistic bacterial killing effects.
3.2. Synergistic Bactericidal Effects of CAP with H2O2
To quantify the synergistic bactericidal effects of CAP with H2O2, CFU values of E. faecalis after CAP treatment were measured with and without H2O2. Figure 3a,b show CFU values according to the CAP treatment time and H2O2 concentration, respectively. CFU decreased 5 orders with 10 min of CAP treatment and decreased 3 orders with 5 min of incubation in 3.0% H2O2 solution. Treatment with CAP for 5 min shows similar killing potential to that of 5 minutes’ incubation in 2.0% H2O2. The red and blue lines in Figure 3b show the remarkably enhanced bactericidal effects of H2O2 with a short time exposure of CAP. The combination treatment reduced the amount of time required for CAP to disinfect bacteria. Bacterial eradication was complete after only 60 s with 1% H2O2 and after only 30 s with 2% H2O2.
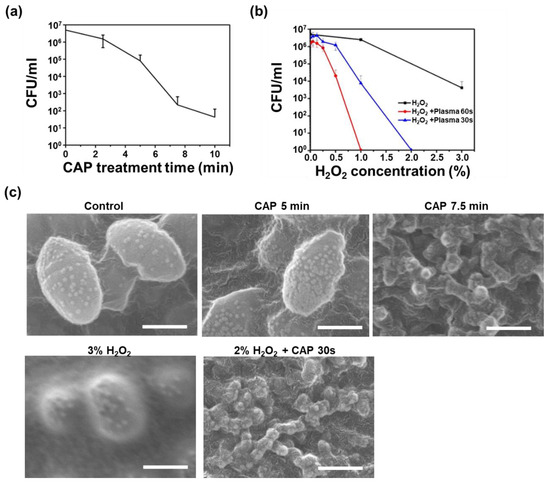
Figure 3.
Bactericidal effects of CAP on the bacterial suspension compared with H2O2; (a) A graph showing CFU decrease according to plasma treatment time; (b) A graph showing CFU decrease according to H2O2 concentrations with or without CAP treatment; (c) SEM images of the bacteria treated with CAP, H2O2 and CAP together with H2O2. Scale bars are 400 nm.
This efficient decontamination was also observed in SEM microscopy. Figure 3c shows the SEM images of the bacteria after plasma and H2O2 treatments. Compared to the control, the surface of the microorganism was distorted as the plasma treatment time increases. When the treatment time exceeded 7.5 min, it was difficult to find normal shaped bacteria under the SEM. The bacteria appeared to be shrunk or burst. Normal rounded bacteria were observed in the 3% H2O2 treated samples, but no normal bacteria were observed in the combination treatment of CAP and 2% H2O2 for 30 s.
3.3. Measurements of Cellular Responses to Synergistic Treatment of CAP with H2O2
To find the cause of the synergistic bactericidal effects, some important factors related to cytotoxicity were measured. The pH of the solution was measured after CAP treatment (Figure 4a). pH is a very important factor in determining bacterial membrane potential and disinfection efficiency [17]. Since H2O2 is acidic, the pH of 1% H2O2 solution was initially slightly lower than that of DI water. It was dramatically reduced with CAP treatment, and more reduction was observed with combination treatment. However, the pH values were not significantly different between CAP only treatment and CAP with H2O2 treatment.
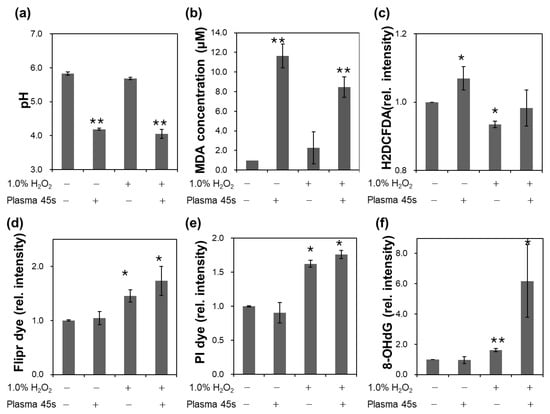
Figure 4.
Measurements of factors related to bactericidal effects in the combination of CAP and H2O2; (a) pH; (b) MDA concentration; (c) Mean values of the intensity of H2DCFDA dye relative to the control; (d) Mean values of the intensity of Flipr dye relative to the control; (e) Mean values of the intensity of PI dye per a cell relative to the control; (f) Mean values of the intensity of 8-OH·dG dye relative to the control. The notations ‘+’ and ‘−’ mean the condition with and without each treatment, respectively.
Lipid peroxidation was generally accepted as the first process of plasma-cell interactions. To examine whether membrane damage was the reason for the synergistic effects, the amount of MDA was measured. MDA is formed by the degradation of polyunsaturated lipids and is therefore used as a marker of oxidative stress. Figure 4b shows the increase in MDA concentration with CAP treatment. However, the differences between the 1% H2O2 and DI solutions were not significant. While H2O2 shows slightly higher values in MDA quantification without CAP treatment, the lipid oxidation was somewhat reduced with combined treatment of CAP and H2O2. Similarly, Figure 4c shows that the intracellular ROS level increased with CAP treatment. These results imply that CAP induced oxidative stress inside a cell. However, MFI of H2DCFDA were decreased in the 1% H2O2 solution, which would be related to cellular defense process to H2O2.
Figure 4d shows the MFI of Flipr dye per a cell, which represents the trans-membrane potential. The Flipr fluorescence is known to become brighter when the membrane is electrically de-polarized. The intensity was not changed much with CAP treatment but increased with H2O2 treatment. More enhancement of MFI was observed with the combination treatment. In contrast to MDA measurement, trans-membrane potential was affected more significantly by H2O2 than CAP, and the change became more significant in a combination treatment. This result suggests the differential influence of H2O2 and CAP on the cell membrane. H2O2 may pass through the membrane easily than other species from CAP, or H2O2 can freeze some proteins working for maintaining transmembrane potential. Figure 4e shows that the membrane permeability was similarly increased as membrane potential depolarization. The intensity of membrane impermeable PI dye increased in 1% H2O2 and increased more when treated simultaneously with 1% H2O2 and CAP.
As a following intracellular oxidation signal, we used antibody to deoxyguanosine (8-OHdG), which is one of the major products of DNA oxidation. DNA damage is a very important signal in cells and is generally accepted as a key process of cell death. Figure 4f shows that the intensity for the amount of 8-OHdG increased in 1% H2O2 and increases more significantly when treated with both 1% H2O2 and CAP. This implies that the synergistic effects of H2O2 with CAP should be ascribed to intracellular oxidative stress including DNA damages.
3.4. Synergistic Bactericidal Effects of CAP with H2O2 in the Bacterial Homogenate Gel
To determine whether this combination treatment is beneficial in tissue disinfection, bacterial homogenate gel was molded as shown in Figure 5a. The gels were cut at depths of 2, 5, and 7 mm from the top after CAP treatment, and the live and dead fluorescent signals were observed from the bottom of each sliced gel. For combination treatment, bacterial homogenate gel was immersed in H2O2 for 5 min and then treated with CAP for 1 min. When the gels were only immersed in H2O2 without CAP treatment, no significant red signals were observed at a depth of 2 mm, as shown in Figure 5b. This demonstrated that H2O2 alone could not induce severe cytotoxicity in this system. Figure 5c shows the degree of cell damages according to the depth of the gel when H2O2 and CAP were applied together. All cases of CAP only, H2O2 0.5% + CAP, and H2O2 1.0% + CAP showed strong red color at 2 mm below the top surface. When CAP was used alone, the red signal was not distinguishable at the depth of 5 mm. On the contrary, co-applications of H2O2 with CAP deepened the effective depth down to longer than 5 mm. These results indicate that the co-application of H2O2 with CAP can increase the effective depth of disinfection in agarose.
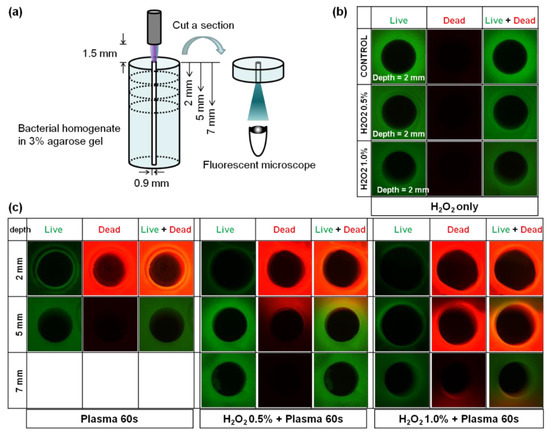
Figure 5.
Synergistic bactericidal effects of CAP with H2O2 in the bacterial homogenate gel. (a) Scheme showing the experimental design. (b) Photographs of Live–Dead fluorescent-stained bacterial homogenate gels at the depth of 2 mm from the top after H2O2 only treatment. (c) Photographs of Live–Dead fluorescent-stained bacterial homogenate gels at the depths of 2, 5, and 7 mm from the top after CAP treatment with or without H2O2.
4. Discussion
H2O2 is widely used as a biocide, particularly in applications where its decomposition into non-toxic byproducts is important. It is currently believed that the Fenton reaction generating OH· radicals is the leading mechanism in H2O2-induced cytotoxicity [1]. Many studies have reported the oxidation of DNA and proteins rather than cell membrane by H2O2. Similarly, the main mechanism of CAP is known as the oxidation of molecules by ROS/RNS originated from CAP [18]. Differently from H2O2, CAP has complex reactive molecules, charged particles, and UV light at one time. Those reactive species diffuse from the CAP device into cells with damaging the outermost cytoplasmic membrane first. The shrinkage and destruction of cells due to the membrane damage is widely accepted as a main cause of bacterial cell death by CAP [19].
In this study, we tried to understand the underlying mechanism of the synergistic effects of the combination of these two modalities. There have been trials to combine these two modalities, especially in sterilizing devices. Most trials used H2O2 vapor, which passes through the plasma device to generate highly reactive species directly [20,21]. In dentistry, this combination method has been applied to sterilize surgical tools or to conduct tooth whitening [22,23]. The OH· radical has been reported as a key player in those applications with the help of other reactive species such as atomic O. The mechanism for the synergistic bacterial killing in liquid seems a little different from the vaporized H2O2 discharge in CAP. Our results show that H2O2 was dissociated by CAP treatment, but OH· radical concentrations measured in DI water and H2O2 solution after CAP treatment are almost the same (Figure 1c). The OH· radical scavenger does not reduce the bacterial cell death in the combination treatment of H2O2 and CAP (Figure 2b). Instead, we observed that a certain amount of H2O2 disappeared when cells were in the solution (Figure 2a). We can assume that co-treatment of H2O2 and CAP may enhance the bactericidal effects not by generating more OH· radicals but by other cellular interaction with H2O2. It is presumed to be the same for DBD CAP.
Results in Figure 4 provide us some information about cellular responses to the combination therapy. The extracellular pH, the lipid peroxidation (MDA), and the amounts of intracellular ROS (H2DCFDA) were more significantly affected by CAP (Figure 4a–c). On the contrary, the membrane permeability, the membrane potential depolarization, and the intracellular DNA oxidation were more significantly affected by H2O2 (Figure 4d–f). An anionic dye PI transferred more through the membrane when cells were incubated in H2O2, though lipids were less peroxidized than by CAP. The higher intensity of Flipr dye in H2O2 treatment may be more strongly related to the membrane permeability. The high Flipr intensity is known to be related to the penetrations of charged particles [24]. Based on these measurements, we can assume that H2O2 can enhance transmembrane transportation of reactive species from CAP, which are important in bactericidal effects. In addition, we can guess that the H2O2 reactions such as damaging of membrane-bound proteins such as glutathione (GSH) or catalase should be prerequisite for synergistic biocidal effects [25]. Though our experimental results do not elucidate exact pathways of molecular interactions, these support that the combination treatment of the two modalities can amplify bactericidal effects through the oxidation of intracellular molecules.
There are cases where Jet type CAP is useful for such combination treatment. Jet type CAP can localize the effective area specifically around the CAP-treated point due to the short lifetimes of highly reactive species. The thin and long plume of CAP can be a good complementation for complete disinfection of small area such as the root canal. In root canal therapy, the microbial eradication is necessary before filling resin. Several reports showed the same sterilizing power of CAP as clinically used reagents, but the time was as long as 10 min [26,27]. If treated simultaneously with hydrogen peroxide, not only can the treatment time be reduced, but also the effective depth is deepened. This is expected to be helpful in sterilizing germs in the teeth with a porous structure. Another suitable application can be acne treatment. One of the causes of acne is the colonization of bacteria known as Propionibacterium acnes (P. acnes). P. acnes lives on the skin’s surface or within hair follicles, and their overgrowth can result in skin problems. Localized and deep treatment of acne with CAP can be an alternative approach to traditional chemical treatments. Promising results were reported in several case studies [28,29]. However, as H2O2 is an endogenous substance, externally added H2O2 can be involved in biological reactions. It is known that H2O2 plays various roles in the wound healing process and is modulated at different concentrations during healing process [4]. CAP with H2O2 can be effective in disinfection, but more detailed research is needed on the effect on the immune responses [30,31]. In addition, it is necessary to check the safety issues such as high voltage, ultraviolet irradiation, or heat for safe clinical applications.
In conclusion, the combination of CAP with H2O2 could provide dramatic synergistic effects in bacterial disinfection not by hydroxyl radical generation from H2O2 but by the enhanced membrane transportation of reactive species. This combination is expected to be particularly effective when the desired effect is to be localized or to have a deep impact. Since the byproducts of both H2O2 and CAP are not significantly toxic, their combination could be a good candidate to clinical applications.
Author Contributions
K.Y.B., H.J. and S.H.K. performed the experiments, analyzed the data, and wrote the manuscript. G.-C.K. and G.C. gave advice and guidelines in the plasma device. All authors have read and agreed to the published version of the manuscript.
Funding
This research was supported by the Leading Foreign Research Institute Recruitment Program through the National Research Foundation of Korea (NRF) funded by the Korea government (MSIP) (NRF-2022R1F1A1076242), and partially supported by Kwangwoon University.
Institutional Review Board Statement
Not applicable.
Informed Consent Statement
Not applicable.
Data Availability Statement
Not applicable.
Acknowledgments
We appreciate the Korean Collection for Oral Microbiology for the kind supply of E. faecalis from root canal of human teeth.
Conflicts of Interest
The authors declare no conflict of interest.
References
- Linley, E.; Denyer, S.P.; McDonnell, G.; Simons, C.; Maillard, J.Y. Use of hydrogen peroxide as a biocide: New consideration of its mechanisms of biocidal action. J. Antimicrob. Chemother. 2012, 67, 1589–1596. [Google Scholar] [CrossRef] [PubMed]
- Pędziwiatr, P.; Mikołajczyk, F.; Zawadzki, D.; Mikołajczyk, K.; Bedka, A. Decomposition of Hydrogen Perodixe—Kinetics and Review of Chosen Catalysts. Acta Innov. 2018, 26, 45–52. [Google Scholar] [CrossRef]
- Watt, B.E.; Proudfoot, A.T.; Vale, J.A. Hydrogen peroxide poisoning. Toxicol. Rev. 2004, 23, 51–57. [Google Scholar] [CrossRef]
- Zhu, G.; Wang, Q.; Lu, S.; Niu, Y. Hydrogen Peroxide: A Potential Wound Therapeutic Target. Med. Princ. Pract. 2017, 26, 301–308. [Google Scholar] [CrossRef] [PubMed]
- Marshall, M.V.; Cancro, L.P.; Fischman, S.L. Hydrogen peroxide: A review of its use in dentistry. J. Periodontol. 1995, 66, 786–796. [Google Scholar] [CrossRef]
- Shikongo-Nambabi, M.N.; Kachigunda, B.; Venter, S.N. Evaluation of oxidising disinfectants to control Vibrio biofilms in treated seawater used for fish processing. Water SA 2010, 36, 215–220. [Google Scholar]
- Stewart, P.S.; Roe, F.; Rayner, J.; Elkins, J.G.; Lewandowski, Z.; Ochsner, U.A.; Hassett, D.J. Effect of catalase on hydrogen peroxide penetration into Pseudomonas aeruginosa biofilms. Appl. Environ. Microbiol. 2000, 66, 836–838. [Google Scholar] [CrossRef]
- Villar-Navarro, E.; Levchuk, I.; Rueda-Márquez, J.J.; Manzano, M. Combination of solar disinfection (SODIS) with H2O2 for enhanced disinfection of marine aquaculture effluents. Sol. Energy 2019, 177, 144–154. [Google Scholar] [CrossRef]
- Sheng, H.; Nakamura, K.; Kanno, T.; Sasaki, K.; Niwano, Y. Bactericidal Effect of Photolysis of H2O2 in Combination with Sonolysis of Water via Hydroxyl Radical Generation. PLoS ONE 2015, 10, e0132445. [Google Scholar] [CrossRef]
- Gershman, S.; Harreguy, M.B.; Yatom, S.; Raitses, Y.; Efthimion, P.; Haspel, G. A low power flexible dielectric barrier discharge disinfects surfaces and improves the action of hydrogen peroxide. Sci. Rep. 2021, 11, 4626. [Google Scholar] [CrossRef]
- Govaert, M.; Smet, C.; Verheyen, D.; Walsh, J.L.; Van Impe, J.F.M. Combined Effect of Cold Atmospheric Plasma and Hydrogen Peroxide Treatment on Mature Listeria monocytogenes and Salmonella Typhimurium Biofilms. Front. Microbiol. 2019, 10, 2674. [Google Scholar] [CrossRef] [PubMed]
- Emmert, S.; Pantermehl, S.; Foth, A.; Waletzko-Hellwig, J.; Hellwig, G.; Bader, R.; Illner, S.; Grabow, N.; Bekeschus, S.; Weltmann, K.-D.; et al. Combining Biocompatible and Biodegradable Scaffolds and Cold Atmospheric Plasma for Chronic Wound Regeneration. Int. J. Mol. Sci. 2021, 22, 9199. [Google Scholar] [CrossRef] [PubMed]
- Berner, J.; Bekeschus, S. Combined toxicity of indirubins with cold physical plasma in skin cancer cells in vitro. Jpn. J. Appl. Phys. 2022, 62, SA1006. [Google Scholar] [CrossRef]
- Sundqvist, G.; Figdor, D.; Persson, S.; Sjögren, U. Microbiologic analysis of teeth with failed endodontic treatment and the outcome of conservative retreatment. Oral Surg. Oral Med. Oral Pathol. Oral Radiol. 1998, 85, 86–93. [Google Scholar] [CrossRef]
- Roach, R.P.; Hatton, J.F.; Gillespie, M.J. Prevention of the ingress of a known virulent bacterium into the root canal system by intracanal medications. J. Endod. 2001, 27, 657–660. [Google Scholar] [CrossRef]
- Jin, D.J.; Uhm, H.S.; Cho, G. Influence of the gas-flow Reynolds number on a plasma column in a glass. Phys. Plasmas 2013, 20, 083513. [Google Scholar] [CrossRef]
- Oehmigen, K.; Hahnel, M.; Brandenburg, R.; Wilke, C.; Weltmann, K.-D.; Woedtke, T. The Role of Acidification for Antimicrobial Activity of Atmospheric Pressure Plasma in Liquids. Plasma Process. Polym. 2010, 7, 250–257. [Google Scholar] [CrossRef]
- Hoffmann, C.; Berganza, C.; Zhang, J. Cold Atmospheric Plasma: Methods of production and application in dentistry and oncology. Med. Gas Res. 2013, 3, 21. [Google Scholar] [CrossRef]
- Li, Y.; Sun, K.; Ye, G.; Liang, Y.; Pan, H.; Wang, G.; Zhao, Y.; Pan, J.; Zhang, J.; Fang, J. Evaluation of Cold Plasma Treatment and Safety in Disinfecting 3-week Root Canal Enterococcus faecalis Biofilm In Vitro. J. Endod. 2015, 41, 1325–1330. [Google Scholar] [CrossRef]
- Soloshenko, I.A.; Tsiolko, V.V.; Khomich, V.A.; Bazhenov, V.Y.; Ryabtsev, A.V.; Schedrin, A.I.; Mikhno, I.L. Features of Sterilization Using Low-Pressure DC-Discharge Hydrogen-Peroxide Plasma. IEEE Trans. Plasma Sci. 2002, 30, 1440–1444. [Google Scholar] [CrossRef]
- Tessarolo, F.; Caola, I.; Nollo, G.; Antolini, R.; Guarrerad, G.M.; Caciagli, P. Efficiency in endotoxin removal by a reprocessing protocol for electrophysiology catheters based on hydrogen peroxide plasma sterilization. Int. J. Hyg. Environ. Health 2006, 209, 557–565. [Google Scholar] [CrossRef] [PubMed]
- Kawamoto, K.; Tsujimoto, Y. Effects of the Hydroxyl Radical and Hydrogen Peroxide on Tooth Bleaching. J. Endod. 2004, 30, 45–50. [Google Scholar] [CrossRef]
- Lee, H.W.; Kim, G.J.; Kim, J.M.; Park, J.K.; Lee, J.K.; Kim, G.C. Tooth Bleaching with Nonthermal Atmospheric Pressure Plasma. J. Endod. 2009, 35, 587–591. [Google Scholar] [CrossRef] [PubMed]
- Yu, H.; Li, M.; Wang, W.; Wang, X. High throughput screening technologies for ion channels. Acta Pharmacol. Sin. 2016, 37, 34–43. [Google Scholar] [CrossRef] [PubMed]
- Bekeschus, S.; Schmidt, A.; Bethge, L.; Masur, K.; Woedtke, T.; Hasse, S.; Wende, K. Redox Stimulation of Human THP-1 Monocytes in Response to Cold Physical Plasma. Oxid. Med. Cell. Longev. 2016, 2016, 5910695. [Google Scholar] [CrossRef]
- Pan, J.; Sun, K.; Liang, Y.; Sun, P.; Yang, X.; Wang, J.; Zhang, J.; Zhu, W.; Fang, J.; Becker, K.H. Cold Plasma Therapy of a Tooth Root Canal Infected with Enterococcus faecalis Biofilms In Vitro. J. Endod. 2013, 39, 105–110. [Google Scholar] [CrossRef]
- Armand, A.; Khani, M.; Asnaashari, M.; AliAhmadi, A.; Shokri, B. Comparison study of root canal disinfection by cold plasma jet and photodynamic therapy. Photodiagnosis Photodyn. Ther. 2019, 26, 327–333. [Google Scholar] [CrossRef]
- Wu, X.; Yang, Y.; Wang, Y.; Wang, H.; Zheng, Y.; Chen, J.; Xu, H. Treatment of refractory acne using selective sebaceous gland electro-thermolysis combined with non-thermal plasma. J. Cosmet. Laser Ther. 2021, 23, 188–194. [Google Scholar] [CrossRef]
- Mariachiar, A.; Ann, V.; Alessandr, G.; Edoardo, G.P.; Stefani, B.; Mariateres, R.; Piergiacomo, C.P. Cold atmospheric plasma (CAP) as a promising therapeutic option for mild to moderate acne vulgaris: Clinical and non-invasive evaluation of two cases. Clin. Plasma Med. 2020, 19–20, 100110. [Google Scholar] [CrossRef]
- Moon, I.J.; Yun, M.R.; Yoon, H.K.; Lee, K.H.; Choi, S.Y.; Lee, W.J.; Chang, S.E.; Won, C.H. Treatment of atopic dermatitis using non-thermal atmospheric plasma in an animal model. Sci. Rep. 2021, 11, 16091. [Google Scholar] [CrossRef]
- Boeckmann, L.; Schäfer, M.; Bernhardt, T.; Semmler, M.L.; Jung, O.; Ojak, G.; Fischer, T.; Peters, K.; Nebe, B.; Müller-Hilke, B.; et al. Cold Atmospheric Pressure Plasma in Wound Healing and Cancer Treatment. Appl. Sci. 2020, 10, 6898. [Google Scholar] [CrossRef]
Disclaimer/Publisher’s Note: The statements, opinions and data contained in all publications are solely those of the individual author(s) and contributor(s) and not of MDPI and/or the editor(s). MDPI and/or the editor(s) disclaim responsibility for any injury to people or property resulting from any ideas, methods, instructions or products referred to in the content. |
© 2023 by the authors. Licensee MDPI, Basel, Switzerland. This article is an open access article distributed under the terms and conditions of the Creative Commons Attribution (CC BY) license (https://creativecommons.org/licenses/by/4.0/).