Abstract
The combination of a wind turbine and fish cage (wind-fish) is able to solve the complex issue of power supply for deep-sea aquaculture. Nevertheless, the hydrodynamic coupling between the fish cage and the wind turbine foundation is increasingly complex, and there is little research on the related hydrodynamics. In this paper, the hydrodynamic research on the wind turbine foundation and fish cage structure is carried out using numerical simulation, in which the porous medium model is adopted to simulate the effects of the fish cage on the flow field. By analyzing the hydrodynamic characteristics of the combined structure of an offshore wind turbine and aquaculture cage under the action of regular waves, the load on both the cage in the combined structure and the wind turbine foundation, and the overall load on the combined structure of offshore wind turbine and cage are obtained. The effects of wave parameters, structural dimensions, cage submergence depth, and biological attachment on cage load, wind turbine foundation load, and overall load of the combined structure are analyzed. The results demonstrate that the wind turbine foundation is persistently the central part of the combined structure. The wave height, water depth, and degree of attachment of marine organisms all have different effects on the amplitude of the structural load. In contrast, the wave period, cage geometry, and cage submergence depth have no significant effects on the amplitude of the structural load. In addition to the water depth, other factors will affect the proportion of the load on the wind turbine foundation and the total load as well.
1. Introduction
On one hand, deep-sea aquaculture reduces the negative impact of fisheries on the environment. On the other hand, it provides a more natural aquaculture environment; therefore, it can obtain fishery products with better quality, which is more advantageous than offshore aquaculture [1]. However, as deep-sea aquaculture is far from the coast, how to supply power for deep-sea aquaculture facilities has become a vital issue restricting the development of deep-sea aquaculture. The combination of wind turbines and fish cages can solve the complex power supply problem of deep-sea cage culture. Nonetheless, since the marine ranching and offshore wind power are located in the same sea area, it remains unknown whether the hydrodynamic forces between them will have adverse effects on each other. Therefore, it is urgent to carry out a hydrodynamic analysis of the combined deep-sea aquaculture cage and wind turbine structure, to explore the hydrodynamic characteristics of the deep-sea aquaculture structure and wind turbine foundation, and to provide necessary technical support for the subsequent research and implementation of far-reaching offshore wind farms and marine ranching.
Great progress has been made in the research of offshore wind turbines and fish cages. At present, a series of numerical simulation methods have been established to study the hydrodynamic characteristics of a wind turbine foundation, employing ANSYS software to calculate the stress and strain changes, and to analyze the influence of tower top mass, wind turbine structure gravity, and seawater on the natural frequency of the wind turbine foundation structure [2,3]. The finite element software ABAQUS is also used to analyze the dynamic response of offshore wind turbines [4]. Several numerical simulation models of wind turbines coupled with hydrodynamic forces have been proposed to identify the damping of the wind turbine foundation mode [5]. The hydrodynamic characteristics of offshore wind turbines under wave, wind, tidal current and extreme sea conditions have also been numerically simulated and analyzed [6,7,8,9,10]. In addition, the dynamic characteristics of the offshore wind turbine supporting structures under different wave steepness parameters [11,12], water depth parameters [13,14,15], and wave loads [16,17,18] are widely studied.
For the study of hydrodynamic characteristics of cages in marine pastures, the numerical simulation methods extensively used to simulate mesh structure mainly include the modal analysis method [19,20] and the porous medium method [21], whose effectiveness is verified by comparison with the experimental results. A series of studies have been carried out on the hydrodynamic characteristics of the cage under different sea conditions. Kristiansen et al. explored the load variation of aquaculture cages and mooring devices under the combined action of waves and currents, as well as the sensitivity of numerical results to multiple parameters and models, and came to the conclusion that the cage devices did not need to use extremely fine numerical grids [22,23,24]. Xu et al. [25,26,27] established the finite element model of the cage structure under the action of waves, analyzed the deformation and stress of the cage in regular waves, and predicted the stress of the net panels under extreme wave action. Lader et al. discussed the dynamic characteristics of the cage under the action of regular waves, irregular waves and water flow by numerical simulation [28,29,30]. Moreover, the submergence characteristics of a single-point mooring (SPM) cage system under the action of regular waves [31] and random waves [32] were investigated. It was found that the cage system has an obvious response to the increase in wave height; the degree of submergence of irregular waves is less than that of regular waves, and the cage is in a dynamic stable state after submergence. Ma et al. developed a semi-analytical solution to investigate the wave interference and corresponding dynamic responses of the submerged flexible fish cage array [33]. Liu et al. analyzed the yield and fatigue phenomena of the cage floating structure under excessive and long-term wave loads [34]. Mjåtveit et al. simulated two types of typical gravity cages, with circular and square shapes, for the purpose of comparing their cage deformations, cultivation volumes, and towing forces under different current conditions [35]. Cheng et al. conducted time-domain simulations to study the effects of the main design parameters on cage culture quantity and resistance [36]. Wang et al. investigated the tensions within the net twines, the loads on the connectors and the cross-sectional forces/moments on the main steel structures of vessel-shaped fish cages [37].
Previous studies are almost a separate exploration of the hydrodynamic characteristics of wind turbines or cages. The research on the combination of wind turbines and cages is in the preliminary stage of development. The combined structure of fixed offshore wind turbines and deep-water and offshore aquaculture cages has significant advantages of efficient space utilization and sufficient combination between structures. However, the interaction mechanism between structures and the influence mechanism of the marine environment on structures are extremely complex. It is difficult to carry out field measurement and physical model test, and the research cost is also quite high. Currently, there are many basic technical problems which need to be explored and solved in depth and in detail. Therefore, it is necessary to use the numerical simulation method in this paper to study the hydrodynamic characteristics of the combined structure of a deep-sea aquaculture cage with fixed offshore fan under the action of waves, and to study the effect of wave factors and cage size on the combined structure. Therefore, it is necessary to study not only the hydrodynamic characteristics of the combined structure of offshore wind turbines and cages under wave action using the numerical simulation method in this paper, but also the effect of wave factors and cage size on the stress of the combined structure.
2. Numerical Simulation
To simulate the hydrodynamic characteristics of the combined structure of offshore wind turbines and marine ranches under the action of waves, a three-dimensional numerical wave flume capable of generating regular waves is established based on the Navier–Stokes equation in this paper. On the basis of the multiphase flow solver in OpenFOAM, the control equations of the offshore wind turbine and cage combined structures are solved. For the purpose of improving the calculation efficiency, the porous medium model is used to simulate the cage part of the combined structure.
2.1. Control Equation
In this paper, the load and flow field of the combined structure of wind turbine and cage under wave action are studied in a numerical wave tank. The fluctuation is described by the Reynolds-Averaged Navier–Stokes equations (RANS) as follows [38],
Continuity equation:
Momentum equation:
where u is the velocity; x is the coordinate; p is the pressure; g is the gravitational acceleration; t is the time; and ρ is the fluid density.
The porous medium model is used to simulate the cage structure in the ocean The control equation of the cage is mainly based on the corresponding control equation of the wave field, adding porosity and introducing Darcy’s law. See Formulas (3) and (4) for the specific control equation [39].
Continuity equation:
Momentum equation:
where ρ is the fluid density; μ is the momentum viscosity of the fluid; ui and uj are average velocity components; t is the time; p is the pressure; ν is the velocity vector; gi is the acceleration of gravity; i and j are 1, 2, 3, etc.; and Si is the source term of the momentum equation in porous medium.
2.2. Porous Media Model
The fish cage is an integral part of the combined structure, and the wire in the mesh structure can be regarded as a small cylinder. Several small cylinders are connected into a mesh through nodes. Due to the large number of small cylinders, it will be a great burden for numerical simulation if it is directly simulated and calculated. Therefore, this paper adopts the porous medium model (see Figure 1 for the schematic diagram) to simulate the flow-blocking effect of the mesh and selects a reasonable flow-blocking coefficient to make the porous medium have the same flow-blocking effect as mesh.
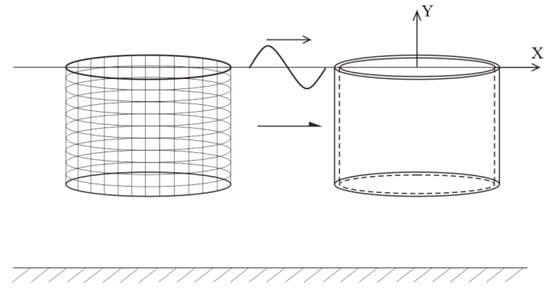
Figure 1.
Schematic diagram of porous medium model.
Outside the porous medium region, the source term Si in the momentum equation is equal to 0. In the porous medium region, Forchheimer put forward the expression of pressure gradient when water flows through the porous medium region at a certain velocity based on Darcy’s law in 1901. The calculation of Si is shown in Formulas (5)–(7),
where a and b are constant coefficients; λ is the thickness of the porous medium; D is the cylinder diameter; Cij is the porosity coefficient matrix of the porous medium; Cn is the normal resistance coefficient; Ct is the tangential resistance coefficient, and porosity coefficient is expressed in m−1.
The directions of resistance Fd and lift Fl of the porous medium are parallel and perpendicular to the flow direction, respectively. See Formulas (8) and (9) for specific expressions [39],
where λ and A is the thickness and the area of porous medium, respectively. In addition, the drag and lift can also be calculated by empirical formulas, as shown in Formulas (10) and (11),
where u0 is the free flow rate.
The drag coefficient Cd and lift coefficient Ct can be calculated as follows,
where α is the angle of attack of the mesh, that is, the angle between the mesh and the direction of water flow on the horizontal plane; and Sn is the net solidity. When the mesh is perpendicular to the direction of water flow, and its resistance values at different flow velocities are known, Cn can be obtained by fitting the curve between the cage resistance and the flow velocity with the least square method.
2.3. Calculation Method of Structural Load
The ratio D/L of the cross-sectional dimension D to the wavelength L of offshore wind turbine foundation is less than 0.2. For small-scale cylindrical structures, the empirical formula proposed by Morison in 1950 is commonly used to calculate the wave loads. See Formula (14) for the calculation of the total wave force f,
where fD is the horizontal drag force; fI is the horizontal inertial force; ux is the velocity component; D is the diameter of the column; ρw is the density of seawater; CD and CM are the drag force coefficient and inertia force coefficient, respectively. According to the suggestion of Code for Classification and Construction of Fixed Offshore Platforms, CD equal to 1.2 and CM equal to 2.0 are selected in this paper.
2.4. Free Surface Tracking
The VOF method has the advantages of small storage, favorable form, and less calculation error, so this paper selects the VOF method as the free surface tracking method. The VOF uses a scalar function between 0 and 1 to simulate the position of a free surface, where 0 indicates that the grid is filled with gas, and 1 means that the grid is filled with liquid. Except for these two aforementioned cases, it is considered that there is an interface between the two fluids in the grid, namely, the free surface. The density and viscosity of the fluid in a single grid are shown in Formula (15),
where ρw and ρα is the density of water and air, respectively; μw and μα is the dynamic viscosity of water and air, respectively; α is the ratio of unit water volume to grid volume; αw is the volume fraction of water; and αa is the volume fraction of air. The volume fractions αw and αa can be obtained by calculation, as shown in Formula (16),
where is the manual compression item; uc,i is the artificial compression speed to keep the interface sharp; and ca is the coefficient, which is usually 1 by default.
2.5. Numerical Wave Making and Wave Attenuation
Waves2Foam, a third-party wave-making and wave-absorbing tool based on the C++ environment, has been extensively used on the OpenFOAM platform, so this paper applies Waves2Foam to simulate the wave generation and wave absorption.
- (1)
- Regular wave generation
The horizontal velocity distribution of the numerical wave tank is as follows:
The velocity distribution in the vertical direction, that is, the velocity distribution in the water depth direction is described as:
The wave surface of the wave is expressed as:
where is the frequency of the wave; k is the number of waves; H is the wave amplitude; and h is the water depth of the numerical flume.
- (2)
- Wave elimination
The Waves2Foam solver uses a relaxation zone for wave attenuation, and defines the relaxation function in the solver, as shown in Formula (21).
This function makes the values of the starting point of the relaxation zone 1, the ending point 0, and the middle of the relaxation zone between 0 and 1. In the relaxation zone, the velocity of fluid and the volume fraction of the wave surface are constantly updated in time steps. See Formula (22) for the specific expression,
where is the volume fraction or velocity of the fluid; is the updated volume fraction or velocity calculated in real time in the relaxation zone; and is the theoretical value corresponding to the entrance, with the exit value of 0. Figure 2 is the schematic diagram of fluid volume fraction. The value of the volume fraction is mainly based on the relative position from the static water surface, which is 0 above the static water surface and 1 below it.
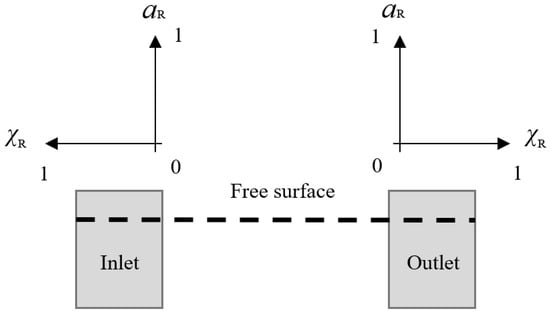
Figure 2.
Schematic diagram of fluid volume fraction.
2.6. Model Settings and Boundary Conditions
A scale model of 1:30 is used for numerical simulation. Figure 3 implies an established numerical wave flume with a length of 15 m, a width of 4 m, and a height of 2 m. The diameter D of the cage is 2 m, while that of the wind turbine foundation is 0.17 m, placed in the center of the bottom of the sink. The cage height H is 0.5 m, the length of the wave-making area is 4 m, and the length of the wave-absorbing area is 5 m. Three wave height meters are arranged in front, inside, and behind the combined structure along the x-direction of the center line.
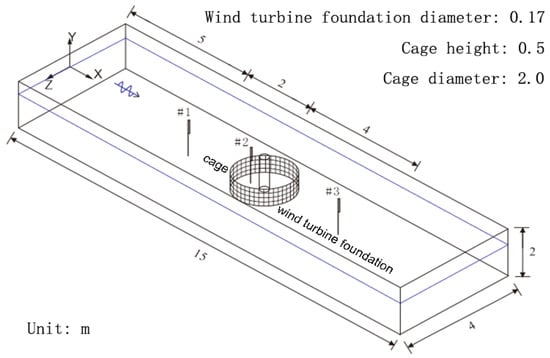
Figure 3.
Boundary conditions of numerical flume.
The inlet boundary of the numerical flume is defined as the wave inlet boundary, while the outlet at the right end is the wave outlet boundary, and the boundary between the top of the numerical flume and the air is the free outflow boundary. The pressure condition is the total boundary condition obtained according to the velocity and atmospheric pressure. For the side wall and bottom surface of the numerical flume, they are identifiable fixed nonslip boundaries. The foundation structure of the wind turbine adopts an impenetrable nonslip boundary. The mesh arrangement of the numerical flume is given in Figure 4. Both the horizontal mesh size and the vertical mesh size are 0.02 m, and the mesh around the water surface and the structure is refined.
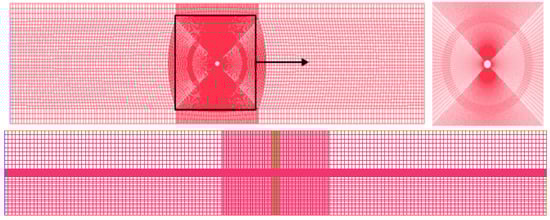
Figure 4.
The mesh arrangement of the numerical flume with wind-fish combined structure.
3. Results
The hydrodynamic characteristics of the combined structure of offshore wind turbines and deep-sea aquaculture cages under the action of regular waves are explored. The effects of different wave parameters (wave height, period, and water depth), structure size, structure location (i.e., the diving depth of the cage), as well as biological attachment on the structural load are analyzed.
3.1. Wave Environmental Factors
The hydrodynamic load of the wind-fish combined structure is an important component of the structural design, and the wave environmental factors have a significant influence on the hydrodynamic load. Therefore, it is beneficial to understand the influence of wave environmental factors on the design of the wind-fish combined structure. A total of seven wave conditions with three different wave heights, three different periods and three different water depths are set up to compare the effects of wave heights, wave periods and water depths on structural loads. Specific design parameters are shown in Table 1. The cage height Hnet is 0.5 m, the diameter Dnet is 2 m and the net solidity Sn is 0.27.

Table 1.
Regular wave environment parameters.
Figure 5, Figure 6 and Figure 7 depict the time domain curve and frequency domain diagram of the combined structure under different wave heights, periods, and water depths. It can be seen from the comparison that the horizontal wave load on the combined structure increases with the increase in wave height. The change of wave period has little effect on the horizontal wave load on the combined structure, whereas with the variation of water depth, the horizontal wave load on the combined structure increases slowly, and the wave crest occurs slightly earlier. In the frequency domain diagram, one times the frequency is inertial force, and two times the frequency is drag force. The analysis illustrates that the inertial force dominates among the three, while the drag force is weak.
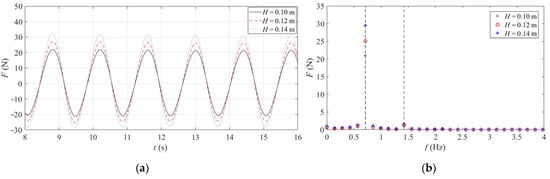
Figure 5.
Load duration curve and spectrum of combined structure under different wave heights. (a) Time domain curve. (b) Frequency domain diagram.
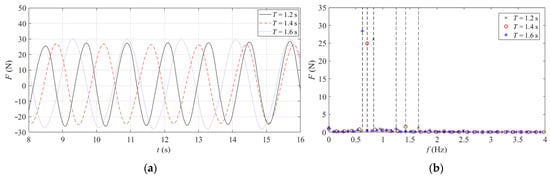
Figure 6.
Load duration curve and spectrum diagram of combined structure under different periods. (a) Time domain curve. (b) Frequency domain diagram.
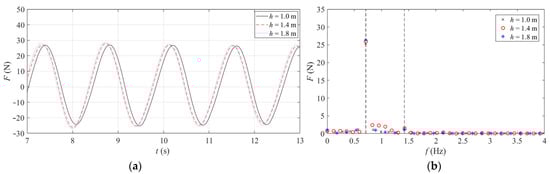
Figure 7.
Load duration curve and spectrum of combined structure under different water depths. (a) Time domain curve. (b) Frequency domain diagram.
In the composite structure, the sensitivity of the horizontal load on cages and wind turbines to the change of wave factor is different. In order to explore the influence of different wave factors on the safety of the combined structures, Figure 8 is the distribution diagram of the hydrodynamic load of the combined structure under different wave heights, wave periods, and water depths. Table 2 shows the proportion of the maximum horizontal load on the wind turbine foundation.
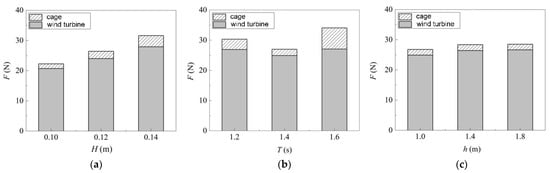
Figure 8.
Hydrodynamic load distribution on the combined structure under different wave heights (a), wave periods (b), and water depths (c).
Table 2.
Maximum horizontal load distribution and proportion of combined structure under different wave factors.
The results illustrate that with the increase in wave height, the proportion of the maximum horizontal load of offshore wind turbines gradually decreases from 94% to 88.6%, indicating that the cage has more obvious wave resistance. With the increase in the wave period, the maximum horizontal load proportion of the wind turbine foundation increases first and then decreases. Synchronously, the existence of the wind turbine foundation has a significant impact on the load on the cage in different periods. However, an increase in water depth does not significantly change the proportion of maximum horizontal load on the offshore wind turbines. In general, the load on the wind turbine foundation is obviously greater than that on the fish cage when the degree of adhesion of marine organisms to the fish cage is small.
3.2. The Influence of the Geometrical Dimensions of the Cage
The fish yield in the fish cage is affected by the dimensions of the cage. However, the dimensions of the cage are also determined by the power supply of the wind turbine. In addition, the hydrodynamic load on the fish cage can be also transferred to the foundation of the wind turbine. Thus, it is beneficial to understand the influence of the geometrical dimensions of the fish cage on the safety design of the combined structure. The diameter and height of the cage are important factors to be considered when designing cage dimensions. Three different cage heights and six different diameters of the cages are set in this paper, and the specific design parameters are shown in Table 3. The wave height is 0.12 m, the period is 1.4 s, the water depth is 1 m, and the cage is commonly at the liquid level.
Table 3.
Size parameters of cage.
The forces on the combined structure with different cage sizes are shown in Figure 9 and Figure 10. It can be seen that the increase in cage height does not significantly affect the horizontal wave load on the combined structure. An increase in the diameter of the cage results in no obvious change in the trend of the horizontal wave load on the composite structure. The inertial force dominates the load on a combined structure, while the drag force is weak.
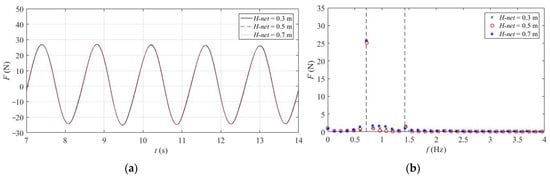
Figure 9.
Load duration curve and spectrum of combined structure under different cage heights. (a) Time domain curve. (b) Frequency domain diagram.
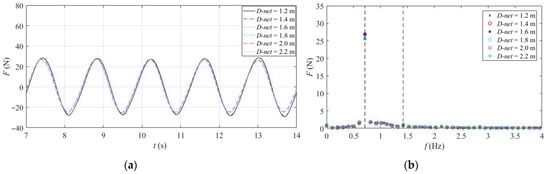
Figure 10.
Load duration curve and spectrum of combined structure under different diameters of the cages. (a) Time domain curve. (b) Frequency domain diagram.
Table 4 and Figure 11 present the maximum horizontal load proportion. The results show that with the increase in cage height, the proportion of the maximum horizontal load of the wind turbine foundation gradually decreases from 93.28% to 91.06%, showing that the wave-making resistance of cage gradually increases, mainly because the increase in cage height increases the effective area of the cage. With the increase in the diameter of the cage, the proportion of the maximum horizontal load of the offshore wind turbine gradually increases from 80.21% to 93.67%, indicating that the influence of the cage’s wave resistance on the load on the wind turbine’s foundation structure is gradually reduced. The wind turbine foundation bears the primary load on the combined structure.
Table 4.
Maximum horizontal load distribution and proportion of the combined structure under different cage heights and diameters.
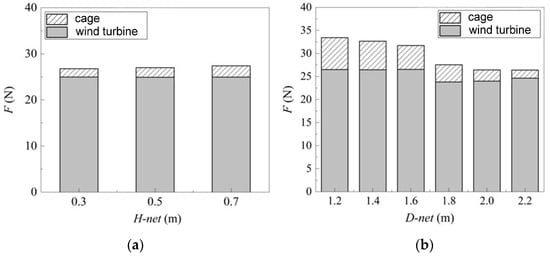
Figure 11.
Hydrodynamic load distribution of the combined structure under different cage heights (a) and diameters (b).
3.3. Other Influencing Factors
As a permeable structure, long-term exposure to the marine environment and the attachment of marine organisms will also threaten the safety of the composite structure. Therefore, this paper studies the influence of different cage submergence depths and different degrees of attachment of marine organisms on the load on the combined structure. The degree of attachment of marine organisms mainly corresponds to different cage densities. In this paper, seven different cage submergence depths and two cage densities are set, and the specific design parameters are shown in Table 5. The wave height is 0.12 m, the period is 1.4 s, and the water depth is 1 m.
Table 5.
Parameters of other influencing factors.
As can be seen from Figure 12 and Figure 13, with the increase in the diving depth of the cage, the horizontal wave load on the combined structure shows little change. The increase in the density of the cage will lead to an increase in the effective area; afterwards, the horizontal wave load on the combined structure will also increase. The load on the combined composite structure is still dominated by the inertial force, with a weak drag force.
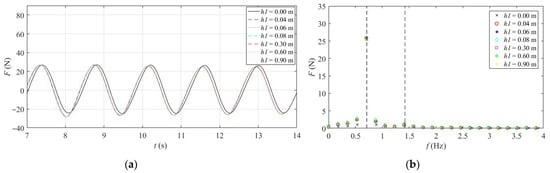
Figure 12.
Load duration curve and spectrum of the combined structure under different cage submergence depths. (a) Time domain curve. (b) Frequency domain diagram.
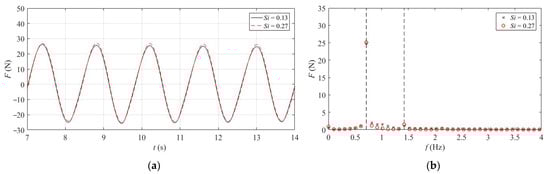
Figure 13.
Load duration curve and spectrum diagram of combined structure under different levels of marine organism attachment. (a) Time domain curve. (b) Frequency domain diagram.
Table 6 and Figure 14 indicate the proportion of the maximum horizontal load on the wind turbine foundation under different submergence depths and cage plugging rates. The results portray that the proportion of the maximum horizontal load on offshore wind turbines gradually increases from 93.05% to 99.78% with the increase in the diving depth of the cage, indicating that the wave-blocking effect of the cage on the wind turbine foundation becomes weaker and weaker. However, with the increase in the degree of adhesion of marine organisms, the proportion of the maximum horizontal load on the offshore wind turbine decreases from 97.35% to 93.05%, demonstrating that increased adhesion of marine organisms increases the wave resistance of the cage.
Table 6.
Distribution and proportion of the maximum horizontal load on the combined structure caused by different cage submergence depths and cage plugging rates.
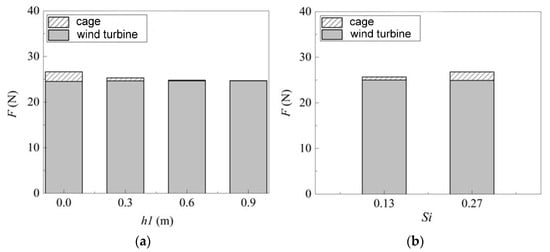
Figure 14.
Hydrodynamic load distribution on the combined structure under different cage submergence depths (a) and cage plugging rates (b).
4. Conclusions
It is found that, among the wave parameters, the wave height affects the amplitude of the load on the combined structure. The higher the wave height, the greater the load on the combined structure, the more pronounced the wave resistance of the cage, and the smaller the load proportion on the wind turbine foundation. The period influences the phase of the maximum load of the combined structure, whereas it has little influence on the magnitude of the load. In contrast, the wind turbine foundation load first decreases and then increases with the increase in the wave period. The increase in water depth induces the horizontal wave load on the combined structure to increase slowly and the time of wave crest to occur slightly earlier, but it has little effect on the load proportion on the wind turbine foundation. The geometric size of the cage has no significant effect on the load. With the increase in cage height, the proportion of the wind turbine foundation load decreases, while with the increase of the diameter of the cage, the proportion of fan foundation load increases. Different diving depths of the cage have little effect on the load on the combined structure, but the more significant the diving depth, the greater the proportion of wind turbine load. The degree of adhesion of different marine organisms directly affects the wave resistance of the cage structure, leading to the increase in the load on the combined structure. In contrast, the wind turbine foundation load proportion will be significantly smaller. Notably, the wind turbine foundation is commonly the central part of the load-bearing combined structure.
Author Contributions
Conceptualization, Z.Z. and T.X.; methodology, T.X.; investigation, Z.Z. and T.X.; writing—original draft preparation, W.Y.; writing—review and editing, W.Y. and Z.Z.; supervision, W.Y. and Z.Z. All authors have read and agreed to the published version of the manuscript.
Funding
This research was funded by the Science and Technology Research and Development Plan of China Railway Group Limited (Grant No. cz02-major-02).
Institutional Review Board Statement
Not applicable.
Informed Consent Statement
Not applicable.
Data Availability Statement
Not applicable.
Acknowledgments
All the authors are greatly acknowledged for the financial support in making this research possible.
Conflicts of Interest
The authors declare no conflict of interest.
References
- Chen, C.P.; Li, Y.C.; Zhao, Y.P.; Dong, G.H.; Gui, F.K. Numerical analysis on effects of submerged depth of the grid and direction of incident wave on gravity cage. China Ocean Eng. 2009, 23, 233–250. [Google Scholar]
- Qin, L.; Yang, X.; Li, L.; Zhang, P. Design and research of prestressed anchor wind turbine foundation. Appl. Mech. Mater. 2014, 711, 550–553. [Google Scholar] [CrossRef]
- Ram, S.; Mohana, R. Simulation and numerical analysis of offshore wind turbine with monopile foundation. IOP Conf. Ser. Mater. Sci. Eng. 2020, 872, 012046. [Google Scholar]
- Oyeniran, A.; Aziaka, D. Residual stress consideration in fatigue damage of offshore wind turbine monopiles: To be or not to be? Int. J. Mech. 2020, 10, 39–52. [Google Scholar] [CrossRef]
- Shirzadeh, R.; Devriendt, C.; Bidakhvidi, M.A.; Guillaume, P. Experimental and computational damping estimation of an offshore wind turbine on a monopile foundation. J. Wind Eng. Ind. Aerodyn. 2013, 120, 96–106. [Google Scholar] [CrossRef]
- Hu, Y.; Yang, J.; Baniotopoulos, C.; Wang, X. Dynamic analysis of offshore steel wind turbine towers subjected to wind, wave and current loading during construction. Ocean Eng. 2020, 216, 108084. [Google Scholar] [CrossRef]
- Tempel, J.V.; Diepeveen, N.F.B.; Vries, W.E.; Salzmann, D.C. 15-Offshore environmental loads and wind turbine design: Impact of wind, wave, currents and ice. In Wind Energy Systems; Woodhead Publishing: Shaxton, UK, 2011; pp. 463–478. [Google Scholar]
- Buljac, A.; Kozmar, H.; Yang, W.; Kareem, A. Concurrent wind, wave and current loads on a monopile-supported offshore wind turbine. Eng. Struct. 2022, 255, 113950.1–113950.17. [Google Scholar] [CrossRef]
- Barj, L.; Jonkman, J.M.; Robertson, A.; Stewart, G.M.; Stewart, S.W. Wind/wave misalignment in the loads analysis of a floating offshore wind turbine. In Proceedings of the 32nd ASME Wind Energy Symposium, National Harbor, MD, USA, 13–17 January 2014. [Google Scholar]
- Wei, K.; Arwade, S.R.; Myers, A.T.; Valamanesh, V.; Pang, W. Effect of wind and wave directionality on the structural performance of non-operational offshore wind turbines supported by jackets during hurricanes. Wind Energy 2017, 20, 289–303. [Google Scholar] [CrossRef]
- Peng, Z. Wave slamming impact on offshore wind turbine foundations. Coast. Eng. Proc. 2014, 1, 43. [Google Scholar] [CrossRef]
- Paulsen, B.T.; Sonneville, B.D.; Michiel, V.; Jacobsena, N.G. Probability of wave slamming and the magnitude of slamming loads on offshore wind turbine foundations. Coast. Eng. 2019, 143, 76–95. [Google Scholar] [CrossRef]
- Zhang, P.; Li, Y.; Gu, J.; Yin, T.; Hu, Z.; Tang, Y. Dynamic response of a conceptual designed articulated offshore wind turbine. J. Offshore Mech. Arct. Eng. Apr. 2021, 143, 024501. [Google Scholar] [CrossRef]
- Zhang, P.; Yang, S.; Li, Y.; Gu, J.; Hu, Z.; Zhang, R.; Tang, Y. Dynamic response of articulated offshore wind turbines under different water depths. Energies 2020, 13, 2784. [Google Scholar] [CrossRef]
- Wandji, W.N.; Natarajan, A.; Dimitrov, N. Development and design of a semi-floater substructure for multi-megawatt wind turbines at 50+m water depths. Ocean Eng. 2016, 125, 226–237. [Google Scholar] [CrossRef]
- Mazarakos, T.; Konispoliatis, D.N.; Manolas, D.I.; Voutsinas, S.G.; Mavrakos, S.A. Modelling of an offshore multi–purpose floating structure supporting a wind turbine including second–order wave loads. In Proceedings of the 11th European Wave and Tidal Energy Conference Series (11th EWTEC), Nantes, France, 6–11 September 2015. [Google Scholar]
- Lim, S.; Tao, L. Analysis of octagonal pile supporting offshore wind turbines under wave loads. In Proceedings of the International Conference on Offshore Mechanics and Arctic Engineering, Busan, Republic of Korea, 15–20 June 2014. [Google Scholar]
- Sheng, J.; Chen, S. Fatigue load simulation for foundation design of offshore wind turbines due to combined wind and wave loading. In Proceeding of 2010 World Non-Grid-Connected Wind Power and Energy Conference, Nanjing, China, 5–7 November 2010. [Google Scholar]
- Lee, C.W.; Kim, Y.B.; Lee, G.H.; Choe, M.Y.; Lee, M.K.; Koo, K.Y. Dynamic simulation of a fish cage system subjected to currents and waves. Ocean Eng. 2008, 35, 1521–1532. [Google Scholar] [CrossRef]
- Cui, Y.; Guan, C.T.; Wan, R.; Huang, B.; Li, J. Numerical simulation of a flatfish cage system in waves and currents. Aquacult. Eng. 2013, 56, 26–33. [Google Scholar] [CrossRef]
- Dong, G.; Xu, T.; Zhao, Y.; Li, Y.; Gui, F. Numerical simulation of hydrodynamic behavior of gravity cage in irregular waves. Aquacult. Eng. 2010, 42, 90–101. [Google Scholar] [CrossRef]
- Kristiansen, T.; Faltinsen, O.M. Experimental and numerical study of an aquaculture net cage with floater in waves and current. J. Fluid Struct. 2015, 54, 1–26. [Google Scholar] [CrossRef]
- Tang, H.; Yang, R.; Yao, H. Experimental and numerical investigations of a mooring line failure of an aquaculture net cage subjected to currents. Ocean Eng. 2021, 238, 109707. [Google Scholar] [CrossRef]
- Yang, R.Y.; Tang, H.; Huang, C. Numerical modeling of the mooring system failure of an aquaculture net cage system under waves and currents. IEEE J. Ocean. Eng. 2019, 45, 1396–1410. [Google Scholar] [CrossRef]
- Xu, T.J.; Hou, H.M.; Dong, G.H.; Zhao, Y.P. Structural analysis of float collar for metal fish cage in waves. Turk. J. Fish. Aquat. Sci. 2017, 17, 257–268. [Google Scholar]
- Xu, T.J.; Dong, G.H.; Tang, M.F.; Liu, J.; Guo, W.J. Experimental analysis of hydrodynamic forces on net panel in extreme waves. Appl. Ocean Res. 2021, 107, 102495. [Google Scholar] [CrossRef]
- Zhao, Y.P.; Chen, Q.P.; Bi, C.W.; Cui, Y. Experimental investigation on hydrodynamic coefficients of a column-stabilized fish cage in waves. J. Mar. Sci. Eng. 2019, 7, 418. [Google Scholar] [CrossRef]
- Lader, P.F.; Fredheim, A. Dynamic properties of a flexible net sheet in waves and current—A numerical approach. Aquacult. Eng. 2006, 35, 228–238. [Google Scholar] [CrossRef]
- Huang, X.H.; Guo, G.X.; Tao, Q.Y.; Hu, Y.; Liu, H.Y.; Wang, S.M.; Hao, S.H. Dynamic deformation of the floating collar of a net cage under the combined effect of waves and current. Aquacult. Eng. 2018, 83, 47–56. [Google Scholar] [CrossRef]
- Cifuentes, C.; Kim, M.H. Hydrodynamic response of a cage system under waves and currents using a Morison-force model. Ocean Eng. 2017, 141, 283–294. [Google Scholar] [CrossRef]
- Shainee, M.; DeCew, J.; Leira, B.J.; Ellingsen, H.; Fredheim, A. Numerical simulation of a self-submersible SPM cage system in regular waves with following currents. Aquacult. Eng. 2013, 54, 29–37. [Google Scholar] [CrossRef]
- Shainee, M.; Leira, B.J.; Ellingsen, H.; Fredheim, A. Investigation of a self-submersible spm cage system in random waves. Aquacult. Eng. 2014, 58, 35–44. [Google Scholar] [CrossRef]
- Ma, M.Y.; Zhang, H.; Jeng, D.S.; Wang, C.M. Hydroelastic interactions between waves and an array of submersible flexible fish cages. Ocean Eng. 2022, 266, 113035. [Google Scholar] [CrossRef]
- Liu, H.Y.; Huang, X.H.; Pang, G.L.; Yuan, T.P.; Hu, Y.; Yuan, S. Structural mechanical properties of circular fish cages determined by finite element analysis and material test. Ocean Eng. 2022, 261, 112083. [Google Scholar] [CrossRef]
- Mjåtveit, M.A.; Cheng, H.; Ong, M.C.; Lee, J. Comparative study of circular and square gravity-based fish cages with different dimensions under pure current conditions. Aquacult. Eng. 2022, 96, 102223. [Google Scholar] [CrossRef]
- Cheng, H.; Li, L.; Ong, M.C. Comparative study of five commonly used gravity type fish cages under pure current conditions. Ocean Eng. 2022, 250, 110977. [Google Scholar] [CrossRef]
- Wang, Y.H.; Fu, S.X.; Xu, Y.W.; Li, S.; Moan, T. Loads on a vessel-shaped fish cage steel structures, nets and connectors considering the effects of diffraction and radiation waves. Mar. Struct. 2022, 86, 103301. [Google Scholar] [CrossRef]
- Stokes, G.G. On the theories of the internal friction of fluids in motion and of the equilibrium and motion of elastic solids. Trans. Camb. Philos. Soc. 1845, 8, 287–319. [Google Scholar]
- Bi, C.W.; Zhao, Y.P.; Dong, G.H.; Cui, Y.; Gui, F.K. Experimental and numerical investigation on the damping effect of net cages in waves. J. Fluid Struct. 2015, 55, 122–138. [Google Scholar] [CrossRef]


Disclaimer/Publisher’s Note: The statements, opinions and data contained in all publications are solely those of the individual author(s) and contributor(s) and not of MDPI and/or the editor(s). MDPI and/or the editor(s) disclaim responsibility for any injury to people or property resulting from any ideas, methods, instructions or products referred to in the content. |
© 2023 by the authors. Licensee MDPI, Basel, Switzerland. This article is an open access article distributed under the terms and conditions of the Creative Commons Attribution (CC BY) license (https://creativecommons.org/licenses/by/4.0/).